Travel lifestyle preferences and destination activity choices of Slow Food members and non-members
25
Travel lifestyle preferences and destination activity choices of Slow Food members and non-members Lee, Kuan –Hee, Packer, J., & Scott, N. (2015) Travel lifestyle preferences and destination activity choices of Slow Food members and non-members. Tourism Management, 46 1-10. ( 20.12.2013 ) ABSTRACT This paper explores the relationships between travel lifestyle preferences and destination activity choices of Slow Food members and non-members. Food is an important component of Slow Food members’ lifestyle, and members practice the Slow Food philosophy in their daily lives. It was therefore expected that lifestyle preferences would influence destination activity choices in different ways for Slow Food members and non-members. This proposition was tested by comparing 337 Slow Food members’ and 207 non-members’ questionnaire responses. The results suggest that Slow Food members differed significantly from non-members in travel-related lifestyle preferences and destination activity choices. Slow Food members had lower interest in comfortable travel and higher interest in local culture compared with non- members. This study also found travel lifestyle preferences significantly influenced destination activity choices. Independently of the motivation to travel to a destination, this study offered evidence that travel lifestyle preferences influence participants’ destination activity choices. An investigation of the impact of the diverse cultural backgrounds of Slow Food members is suggested as a future area of study. Keywords: food tourism, motivation to travel, travel lifestyle, destination activity, Slow Food 1. Introduction Food is an important component in any travel destination and could occupy as much as one third of the total expenditure of a tourist in a destination (Mak, Lumbers, & Eves, 2012). Food has psycho- sensorial, social and symbolic meanings and is often associated with destination image and attraction (Ab Karim & Chi, 2010; Bessiere, 1998; Frochot, 2003). Food can also form part of a peak 1
Transcript of Travel lifestyle preferences and destination activity choices of Slow Food members and non-members

Travel lifestyle preferences and destination activity choices ofSlow Food members and non-members
Lee, Kuan –Hee, Packer, J., & Scott, N. (2015) Travel lifestylepreferences and destination activity choices of Slow Food members
and non-members. Tourism Management, 46 1-10. (20.12.2013)
ABSTRACT
This paper explores the relationships between travel lifestylepreferences and destination activity choices of Slow Food membersand non-members. Food is an important component of Slow Foodmembers’ lifestyle, and members practice the Slow Food philosophyin their daily lives. It was therefore expected that lifestylepreferences would influence destination activity choices indifferent ways for Slow Food members and non-members. Thisproposition was tested by comparing 337 Slow Food members’ and 207non-members’ questionnaire responses. The results suggest thatSlow Food members differed significantly from non-members intravel-related lifestyle preferences and destination activitychoices. Slow Food members had lower interest in comfortabletravel and higher interest in local culture compared with non-members. This study also found travel lifestyle preferencessignificantly influenced destination activity choices.Independently of the motivation to travel to a destination, thisstudy offered evidence that travel lifestyle preferences influenceparticipants’ destination activity choices. An investigation ofthe impact of the diverse cultural backgrounds of Slow Foodmembers is suggested as a future area of study.
Keywords: food tourism, motivation to travel, travel lifestyle,destination activity, Slow Food
1. Introduction
Food is an important component in any travel destination and couldoccupy as much as one third of the total expenditure of a touristin a destination (Mak, Lumbers, & Eves, 2012). Food has psycho-sensorial, social and symbolic meanings and is often associatedwith destination image and attraction (Ab Karim & Chi, 2010;Bessiere, 1998; Frochot, 2003). Food can also form part of a peak
1

experience for tourists and influence their decision to revisit adestination (Kim, Kim, Goh, & Antun, 2011; Quan & Wang, 2004).Definitions of food tourism, gastronomy tourism, culinary tourism,and gourmet tourism consider food as the primary motivationalfactor for these groups of tourists to travel (Boniface, 2003;Hall & Sharples, 2008; Kivela & Crotts, 2005). For example, thedefinition of food tourism is “visitation to primary and secondaryfood producers, food festivals, restaurants and specific locationsfor which food tasting and/or experiencing the attributes ofspecialist food production regions are the primary motivatingfactor for travel” (Hall & Mitchell, 2001, p. 308). The importanceof food in tourism is evidenced by the growing investment of localgovernments in promoting food-related activities in order toattract tourists with food interests (du Rand, Heath, & Alberts,2003; Kivela & Crotts, 2006). Many countries such as Singapore,France or Italy, and cities such as Hong Kong or Adelaide, seek todevelop their own culinary image (Au & Law, 2002).
Although most studies in food tourism have concluded that food isan important motivating factor for tourists to visit adestination, McKercher, Okumus, and Okumus (2008) suggest thatsome past studies on food tourism are not methodologically soundand do not provide sufficient evidence to support this conclusion.For example, some food tourism studies have inferred motivation totravel from an investigation of activities in the destination.Such studies overestimate the importance of food as a motivationfor travel and do not provide evidence of a cause-effectrelationship between motivations to travel and the activitiesundertaken in the destination. The reasons for travelling to aparticular destination play an important role in the traveller’sdecision-making when selecting a vacation destination. However,tourist decision-making is an ongoing process that involvesdifferent stages (Smallman & Moore, 2010). The motivation totravel to a destination and the activities undertaken in thedestination can be seen as two different processes which may ormay not be related. In many cases, tourists’ motivations changefrom one stage of travel to another (Kao, Patterson, Scott, & Li,2008; McKercher & Chan, 2005). Thus, there is a need for foodtourism research to move beyond studies of motivation to travel,and to better understand the factors that influence tourists’choices regarding food-related activities in the destination.
2

To understand food tourists’ destination activity choices, it isnecessary to first consider how people make decisions. A decisionis an outcome of a mental process whereby one action isspecifically chosen from a set of available alternatives(Moutinho, 1987). Among all of the different variables thatinfluence decision making, one underlying factor that requiresfurther exploration is lifestyle (Sirakaya & Woodside, 2005). Veal(1991, p. 19) defines the term lifestyle in the context ofleisure: “lifestyle is the pattern of individual and socialbehaviour characteristic of an individual or a group”. A simplerdefinition of lifestyle for most sociologists is, “a distinctive,hence recognisable, mode of living” (Sobel, 1981, p. 28). Bourdieu(1984, 1990) elaborated the notion of habitus as being related tolifestyle and taste. From Bourdieu’s point of view, consumersoperate according to practical logic, with economics and culturalcapital playing a fundamental role in their decision-making, andembody practical logic according to their own taste. Individualscarry and accumulate past memories and display their lifestylethrough the choices they make; hence model of car, brand ofclothing, mode of travel, and type of food are all examples ofways that lifestyle can be manifested.
Preferences in travel behaviour form part of personal lifestyle,and may influence both how and why people travel (Chen, Huang, &Cheng, 2009; Hsu, Tsai, & Wu, 2009; Lanzendorf, 2002). Lifestylefactors are thus likely to influence tourists’ participation infood-related activities at a destination. For example, Wahlers andEtzel (1985) demonstrated that vacation activity preferences areinfluenced by the perceived level of lifestyle stimulationinherent in the tourist’s work, social life, and leisure timeactivities. Activities in a vacation destination can be decidedbefore or after arrival in the destination (McKercher & Chan,2005). Furthermore, lifestyle information is widely used as amarket segmentation tool. Schul and Crompton’s (1983) studyassessed the travel behaviour of international travellers using 16travel-specific psychographic statements. Their study suggestedthat lifestyle research could provide a detailed profile of therespondents, segment respondents into different groups, and couldpredict respondents’ behaviour better than demographic variables.
Tourists may travel to escape from the ordinary and thus chooseactivities different to those at home, or may undertake the sameactivities as they do at home (Funk, Toohey, & Bruun, 2007; Smith,
3

Pitts, & Litvin, 2012). In either case, lifestyle preferences orhabitus are likely to influence their destination activity choices(Allen, 2002; Hjalager, 2004). This study will thus investigatethe relationships between travel lifestyle preferences andparticipation in destination activities for a group with aparticular lifestyle preference: Slow Food members.
The Slow Food movement is a non-profit foundation with over 20years of history, and with over 100,000 members in 150 countriesaround the world. The philosophy of Slow Food is based onacquiring good, clean, and fair food: food should be tasty, varied,produced to maximise its flavour, and with connections to ageographic and cultural region; it should help to preserve ratherthan destroy the environment; and it should be produced insocially sustainable ways, with an emphasis on social justice andfair wages (Schneider, 2008). Food is an important component ofSlow Food members’ lifestyle, and members practice the Slow Foodphilosophy in their daily lives. It might thus be considered partof their habitus. Based on the view prevailing in definitions offood tourism, it may therefore be expected that Slow Food members’vacation travel would be motivated by their high interest in food.The Slow Food movement can also be associated with slow travel andtourism in the way that people behave and consume in their traveldestination, as the movement is linked to ethical consumption,relocalisation of consumption, local food systems, food miles, andcarbon footprint of food (Hall, 2012). Slow Food members tend toextend Slow Food core values into other consumption behaviourssuch as transportation, travel and vacation (Nevison, 2008).
The study thus aims to investigate the relationship between travellifestyle preferences and participation in activities at adestination, and to compare Slow Food members and non-members inthis regard. It was reasoned that the Slow Food members’ lifestylepreferences in relation to Slow Food would influence their choiceof activities in a travel destination to a greater extent thanwould be the case for non-members. It was therefore hypothesisedthat (1) Slow Food members would have different travel lifestylepreferences than non-members; (2) (a) Slow Food members wouldengage in different destination activities than non-members and(b) Slow Food members would be more consistent in their activitychoices than non-members (i.e., less likely to vary in activitiesfrom one vacation to the next); and (3) travel lifestyle
4

preferences would influence destination activity choices for bothgroups, but in different ways.
2. Method
2.1 Procedure and Participants
Two groups with an interest in food participated in the study: 337members of the international Slow Food movement; and 207 visitorsto a local food event in Brisbane, Australia.
An online survey was conducted with Slow Food members. The onlinesurvey initially targeted Slow Food members in English-speakingcountries; however, due to the difficulty of collecting a largeenough sample, the survey was extended to other countries. Thesurvey was translated from English, using a back-translationtechnique into Italian, Spanish, Japanese, Korean and Chinese. Thenationalities who responded to the online survey approximatelyrepresented the international Slow Food community, with themajority of respondents from Italy (60%) and English-speakingcountries (Australia, USA, UK, Canada, and South Africa, 35%). Anon-site survey with non-members was conducted using a face-to-faceconvenience intercept method with attendees at the Brisbane GoodFood and Wine Show.
The gender distribution of Slow Food members was 45% females and55% males; and for non-members was 60% female and 40% males. Most(75%) Slow Food members were over 40 years old, while most (66%)non-members were between 18 to 39 years old. These demographicdifferences between Slow Food members and non-members need to betaken into account in interpreting the data.
2.2 Instruments
The online and on-site questionnaires measured travel lifestylepreferences and destination activities.
Travel lifestyle preferences A scale formulated by Schul and Crompton (1983) was used tomeasure travel-specific lifestyle. In Schul and Crompton’s study,
5

the original 16 travel activity, interest, and opinion statementsreflected six underlying factors: (1) cultural interest; (2)comfort; (3) familiarity/convenience; (4) activity; (5) opinionleadership; and (6) knowledge-seeking. The 16 items were eachrated on a seven-point Likert-type scale from “strongly disagree”to “strongly agree”.
Travel lifestyle data from the full data-set (including both SlowFood members and non-members) were analysed using Principal Axisfactoring with Varimax rotation. On the initial factor analysis,the Kaiser-Meyer-Olkin (KMO) measure of sampling adequacy was .736and the Barlett’s Test of Sphericity χ2
(120)=1657.251, p<.001,indicating that the data were suitable for factor analysis.However, five items with communalities below .2 were eliminated.The criteria used to identify the number of factors was Kaiser’scriterion of eigenvalues>1. Three factors (preference for familiarity andcomfort, interest in new and local culture, preference for activity and adventure) wereidentified. Table 1 shows the results of the factor analysis oftravel lifestyle items and Cronbach’s alpha for each of the threefactors.
Table 1. Principal Axis Factoring with Varimax rotation of Travel Lifestyleitems
Factor Items Factor Loading Cronbach’s alpha1 2 3
Factor 1:Preference for familiarity & comfort
The nicest vacation is one whereI can just relax and do nothing.
I most like to visit places thatmy friends have visited before me.
When I travel abroad, I prefer to be on a guided tour.
It is important that I stay at the best places when on vacation.
I prefer to visit places where the people speak the same language.
.642
.604
.559
.501
.451
-.051
-.059
-.135
.012
-.287
-.137
.155
.044
.091
.148
.683
Factor 2:Interest in new & local cultures
One of the best parts of travelling is to visit new cultures and new ways of living.
I always like to mix with the local people and experience the local customs.
-.141
-.088
.844
.703
.198
.121
.766
6

Factor 3:Preference for activity & adventure
I try to do many things when I am on vacation.
I prefer to visit places with a large variety of activities and sights.
The best vacations are those that have a lot of night life.
When I go on vacation, I look for adventure and an opportunity to escape from theordinary.
-.088
-.088
.310
-.016
.052
.046
.010
.198
.657
.515
.483
.459
.611
Destination activities A new scale was created in order to measure food and travel-related activities in a destination. Selection of items wasinformed by findings from semi-structured face-to-face interviewswith 43 international Slow Food members from Australia, Italy,Argentina, Taiwan and Hong Kong (Lee, 2013). Interviewees wereasked about their general travel behaviour and their activitypreferences in their vacation destinations. A total of 20 commonactivities were identified and submitted to two pilot tests, onewith Slow Food members and one with non-members. The scales werefurther refined through factor analysis in order to select itemsthat represented two distinct constructs: food-related activitiesand travel-related activities:
Food-activity in the destination I like to join cooking classes on my trips if possible. I like to cook my own meals on my trips if possible. I like to try local street food in a destination. I do not eat local food of a destination; I prefer food that I am familiar
with. I like to read recipes/menus in the destination. I like to buy cook books in the destination. I like to buy local produce in the destination. I like to join food events/festivals.
Travel-activity in the destination I prefer staying in small/family owned hostels rather than big chain
hotels. I like to visit farmer/traditional markets in a destination. I like to stay in one destination as long as possible. I like to live like a local in the destination. I like to have flexibility in my itineraries. I like to enjoy a destination slowly. I like to visit Slow City (Cittàslow) destinations.
7

Respondents were asked to rate each item according to theirpreferences when on a vacation trip, using a six-point Likert-typescale from 1=Strongly Disagree to 6=Strongly Agree. An additionaloption “Varies” was provided, which respondents were asked to useif the importance of the item varied from one vacation to thenext. This option was provided to investigate whether there was adifference between Slow Food members and non-members in the extentto which their preference for various destination activities wasconsistent from one vacation to another (Hypothesis 2b). Whentesting the other hypotheses based on destination activitypreferences, two different methods were used to deal with the“Varies” responses. In Method 1, the “Varies” responses weretreated as missing data, thus reducing the sample size. In Method2, the “Varies” responses were recoded as the mid-point (4) of a7-point scale from 1=Strongly Disagree to 7=Strongly Agree. Bothmethods were used for each analysis and any discrepancies inresults are reported.
An initial factor analysis using Principal Axis Factoring withVarimax rotation was performed on the 8 food-activity items. Theinitial sample size was 522, but when using Method 1 (“Varies”responses as missing data), the sample size was reduced to 323.For Method 1, the Kaiser-Meyer-Olkin (KMO) measure of samplingadequacy of these items was .808 and the Barlett’s Test ofSphericity χ2
(28)=630.082, p<.001. As the communalities of all itemswere above .2, no item was eliminated. Two factors underlyingdestination food activity preferences were identified (engagement infood activities and savouring local flavours) by using Kaiser’s criterion ofeigenvalues>1. Table 2 shows the results of the factor analysis ofdestination food activities and Cronbach’s alpha for each factor.The same analysis was performed using Method 2 (“Varies” as themid-point 4). A similar number of factors, factor loadings, andCronbach’s alphas were obtained.
Table 2. Principal Axis Factoring of Destination Food-activities
Factor ItemsFactorLoading
Cronbach’salpha
1 2Factor 1: Engagement in food activities
I like to buy cook books in the destination.I like to join cooking classes
on my trips if possible.I like to buy local produce in
the destination.I like to read recipes/menus in
.751
.629
.578
.555
.456
.146
.215
.404
.204
.064
.765
8

the destination.I like to cook my own meals on
my trips if possible.I like to join food events/festivals.
.416 .338
Factor 2: Savouring local flavours
I do not eat local food of a destination; I prefer food that I am familiar with.a
I like to try local street food in a destination.
.088
.243
.757
.568
.602
a. Item was reversed scored
The seven travel-activity items were similarly subjected toPrincipal Axis Factoring with Varimax rotation. The initial samplesize was 512, but when using Method 1 (“Varies” responses asmissing data), the sample size was reduced to 292. For Method 1,the Kaiser-Meyer-Olkin (KMO) measure of sampling adequacy of theseitems was .766 and the Barlett’s Test of Sphericity χ2
(21)=482.393,p<.001. One item (“I like to stay in one destination as long aspossible”) was eliminated due to low communality (<.2). One factorunderlying destination travel-activity (immersion in the destination) wasidentified. Table 3 shows the results of factor analysis ofdestination travel-activities and Cronbach’s alpha for theImmersion in destination factor. The same analysis was performedusing Method 2 (“Varies” as the mid-point 4), yielding a similarnumber of factors, factor loadings, and Cronbach’s alphas.
Table 3. Principal Axis Factoring of Destination Travel activities
Factor Items FactorLoading
Cronbach’s alpha
Factor: Immersion in the destination
I like to visit Slow City (Cittàslow) destinations.
I like to visit farmer/traditional markets in a destination.
I like to live like a local in the destination.
I like to enjoy a destination slowly.
I like to have flexibility in myitineraries.I prefer staying in small/family
owned hostels rather than big chain hotels.
.634
.629
.609
.597
.542
.531
.750
9

3. Results
3. 1 Hypothesis 1: Slow Food members have different travel lifestyle preferences than non-members
An independent samples t-test was employed to investigate ifstatistically significant differences existed between Slow Foodmembers and non-members in any of the three travel lifestylefactors. Table 4 indicates significant differences across allthree factors. The results support the hypothesis that Slow Foodmembers and non-members had different travel lifestyles; Slow Foodmembers were more interested than non-members in new and localcultures, were less concerned about familiarity and comfort intheir travel, and less interested in activity and adventure whenon vacation. As non-members were younger than Slow Food members itwas possible that this might influence their preference foractivity and adventure in the destination. The effect of age wasanalysed using two-way ANOVA with two fixed factors: member (ornot) of Slow Food and age (18~39 years, 40~59 years, ≥ 60 years).The main effect of Slow Food membership was significant across allthree travel lifestyle factors, even when age was accounted for(F(1,503)=7.157, p=.008, effect size=.014; F(1,515)=7.824, p=.005, effectsize=.015; F(1,506)=6.619, p=.010, effect size=.013). The main effectof age was significant only in preference for activity and adventure. Theinteraction effect was not significant for any of the three travellifestyle factors.
Table 4. Travel lifestyle differences between Slow Food members and non-members
Travel Lifestyle Factors
Slow FoodMembers (SF)
Non-Slow Foodparticipants
(NSF)t-testresults
Mean SD Mean SD
Preference for familiarity & comfort 3.40 .98 3.78 1.10t(520)=-4.10,
p<.001
Interest in new & local cultures 6.27 .72 5.77 .94t(532)=6.
88,p<.001
Preference for activity & adventure 4.59 .89 5.03 .91t(522)=-5.44,
p<.001Note. Items were rated on a 7-point scale from 1= ‘strongly disagree’ to 7= ‘strongly agree’.
10

3.2 Hypothesis 2: (a) Slow Food members engage in differentdestination activities than non-members
An independent samples t-test was employed to investigate ifstatistically significant differences existed between Slow Foodmembers and non-members in any of the three destination activityfactors. Data was analysed first using Method 1 (“Varies” asmissing), which reduced the sample size to 292. Table 5 indicatessignificant differences across all three destination activityfactors with Slow Food members showing a higher interest than non-members in both food and travel-related activities. Slow Foodmembers reported a greater preference for engaging in foodactivities, savouring local flavours, and immersing themselves inthe destination than non-members. The same analysis was performedusing Method 2 (“Varies” as mid-point), the sample size being 492.Table 6 shows the results using Method 2. The same pattern in theresults was shown using both methods, although the means usingmethod 2 are higher as they are based on a 7-point rather than 6-point scale. The findings confirmed a similar finding from paststudies where Slow Food members showed an affinity for slowtourism and engaged in more interactions with local people (Hall,2012; Nevison, 2008). The effect of age was investigated usingtwo-way ANOVA. The significant main effect of Slow Food membershipremained significant across all three destination activityfactors, there was no significant main effect for age and nointeraction effect. Similar results were found using Method 1 andMethod 2. Table 5. Destination activity preference differences between Slow Food members
and non-members (Method 1)
Destination Activity Factors
Slow FoodMembers (SF)
Non-Slow Foodparticipants
(NSF)t-testresults
Mean SD Mean SD
Food-activity
Engagement in food activities 4.86 .67 4.06 .90 t(344)=9.33, p<.001
Savouring local flavours 5.16 .89 4.86 1.11 t(451)=3.14, p=.002
Travel-activity Immersion in the destination 5.22 .49 4.34 .75 t(292)=11.
65, p<.001Note. Items were rated on a 6-point scale from 1= ‘strongly disagree’ to 6 = ‘strongly agree’.
11

Table 6. Destination activity preference differences between Slow Food membersand non-members (Method 2)
Destination Activity Factors
Slow FoodMembers (SF)
Non-Slow Foodparticipants
(NSF)t-testresults
Mean SD Mean SD
Food-activity
Engagement in food activities 5.54 .85 4.71 1.12t(492)=9.
41,p<.001
Savouring local flavours 5.92 1.12 5.62 1.34t(512)=2.
65,p=.008
Travel-activity Immersion in the destination 5.92 .725 5.01 .83
t(499)=12.74,
p<.001Note. Items were rated on a 7-point scale from 1= ‘strongly disagree’ to 7 = ‘strongly agree’, with ‘varies’ as the midpoint.
3.3 Hypothesis 2: (b) Slow Food members are more consistent intheir activity choices than non-members (i.e., less likely tovary in activities from one vacation to the next)
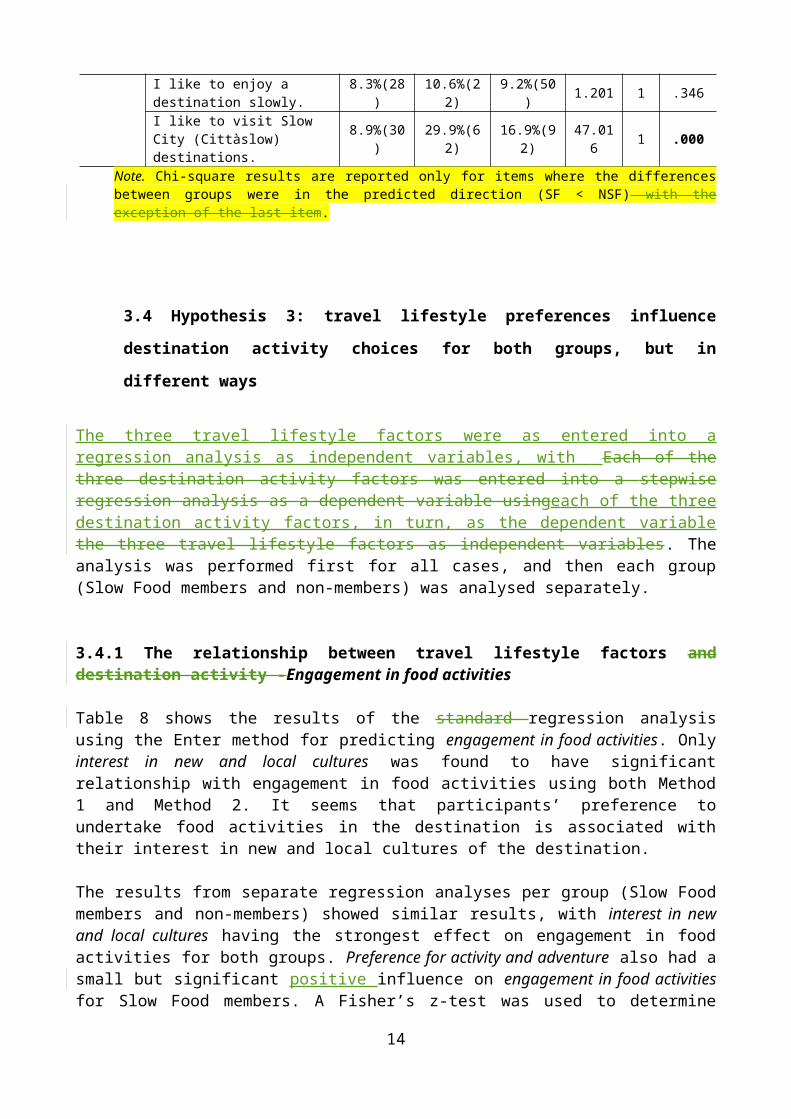
The option “Varies” was added to the six-point rating scale as aseventh option to investigate whether there was a differencebetween Slow Food members and non-members in the extent to whichtheir preference for various destination activities was consistentfrom one vacation to another. Table 7 presents the percentage ofrespondents who chose “Varies” in each of the destination activityitems. Fewer than 12% of respondents chose the option “Varies” inmost of the items (12 items out of 15) which suggests respondentswere mostly consistent in their preferences and their answers werenot perceived to vary from one vacation to another. Slow Foodmembers “Varies” responses ranged from 5-23%, while non-membersranged from 4-30%. On 12 of the 15 items, the differences betweenSlow Food members and non-members was not in the predicteddirection, thus the hypothesis that Slow Food members are moreconsistent than non-members is not supported. The only item onwhich Slow Food members reported a significantly lower percentageof “Varies” responses than non-members was “I like to visit SlowCity destinations”. It is possible that non-members were not awareof the notion “Slow City” and chose “Varies” to express “Don’tknow”.
12

Table 7. Differences between Slow Food members and non-members in preferenceconsistency
ItemsSF
Members% (n)
NSFMembers% (n)
Total %(n)
Χ2
value df p
Food-activity
I like to join cookingclasses on my trips ifpossible.
10.9%(37)
7.2%(15)
9.6%(52)
I like to cook my own meals on my trips if possible.
13.3%(45)
7.2%(15) 11%(60)
I like to try local street food in a destination.
10.8%(34) 4.3%(9) 7.9%(43
)
I do not eat local food of a destination;I prefer food that I am familiar with.
5.3%(18)
6.7%(14)
5.9%(32) .507 1 .600
I like to read recipes/menus in the destination.
6.5%(22)
5.3%(11) 6%(33)
I like to buy cook books in the destination.
9.1%(31)
6.2%(13) 8%(44)
I like to join food events/festivals. 8.9%(30
) 4.3%(9) 7.2%(39)
I like to buy local produce in the destination.
9.4%(32)
5.7%(12) 8%(44)
Travel-
activity
I prefer staying insmall/family ownedhostels rather thanbig chain hotels.
16.6%(56)
22.7%(47)
19%(103) 3.575 1 .076
I like to stay in onedestination as long aspossible.
22.8%(77)
12.6%(26)
19%(103)
I like to visit farmer/traditional markets in a destination.
6.5%(22)
5.7%(12)
6.3%(34)
I like to live like a local in the destination.
10.7%(36)
7.7%(16)
9.6%(52)
I like to have flexibility in my itineraries.
8.9%(30)
2.8%(6) 6.6%(36)
13
I like to enjoy a destination slowly.
8.3%(28)
10.6%(22)
9.2%(50) 1.201 1 .346
I like to visit Slow City (Cittàslow) destinations.
8.9%(30)
29.9%(62)
16.9%(92)
47.016 1 .000
Note. Chi-square results are reported only for items where the differencesbetween groups were in the predicted direction (SF < NSF) with theexception of the last item.
3.4 Hypothesis 3: travel lifestyle preferences influence
destination activity choices for both groups, but in
different ways
The three travel lifestyle factors were as entered into aregression analysis as independent variables, with Each of thethree destination activity factors was entered into a stepwiseregression analysis as a dependent variable usingeach of the threedestination activity factors, in turn, as the dependent variablethe three travel lifestyle factors as independent variables. Theanalysis was performed first for all cases, and then each group(Slow Food members and non-members) was analysed separately.
3.4.1 The relationship between travel lifestyle factors anddestination activity -Engagement in food activities
Table 8 shows the results of the standard regression analysisusing the Enter method for predicting engagement in food activities. Onlyinterest in new and local cultures was found to have significantrelationship with engagement in food activities using both Method1 and Method 2. It seems that participants’ preference toundertake food activities in the destination is associated withtheir interest in new and local cultures of the destination.
The results from separate regression analyses per group (Slow Foodmembers and non-members) showed similar results, with interest in newand local cultures having the strongest effect on engagement in foodactivities for both groups. Preference for activity and adventure also had asmall but significant positive influence on engagement in food activitiesfor Slow Food members. A Fisher’s z-test was used to determine
14

whether there was a significant difference in the R values betweenthe Slow Food members and non-members group. No significantdifference was found.
Table 8. Standard (enter) multiple regression analysis for predicting engagementin food activities
All participantsSample
Size
Beta(ß)
Sig. R R2 Adj.
R2 F Fisher z-test
Method 1Preference for familiarity & comfortInterest in new & local culturesPreference for activity & adventure
346-.081
.399-.040
.127.000.440
.423 .179 .171 24.010***
Method 2Preference for familiarity & comfortInterest in new & local culturesPreference for activity & adventure
494-.050
.350-.073
.920.000.107
.344 .118 .113 21.163***
Sub-group (Method 1)Slow Food membersPreference for familiarity & comfortInterest in new & local culturesPreference for activity &adventure
206-.063
.295
.175
.349.000.012
.395 .156 .143 11.978***
z-score=.637
p=.524
Non-membersPreference for familiarity & comfortInterest in new & local culturesPreference for activity &adventure
140-.028
.334-.055
.750.000.540
.334 .111 .091 5.563***
Sub-group (Method 2)Slow Food membersPreference for familiarity & comfortInterest in new & local culturesPreference for activity &adventure
312.035.209.113
.545.000.057
.263 .069 .060 7.335***
z-score=-.518
p=.561
Non-membersPreference for familiarity & comfortInterest in new & local culturesPreference for activity &
182.013.333-.100
.872.000
.313 .098 .082 6.296***
15

adventure .204
Note. ***p<.001
3.4.2 The relationship between travel lifestyle factors anddestination activity -Savouring local flavours
Table 9 shows the results of the standard regression analysisusing the Enter method for predicting savouring local flavours for allparticipants and sub-groups. Similar results were found using Method1 and Method 2, and for both Slow Food members and non-members.Preference for familiarity and comfort showed a moderate negativerelationship with savouring local flavours, while interest in new and localculture had a moderate positive relationship. It seemed thatparticipants who had a low preference for familiarity and comfortin their travel and a high interest in new and local culture weremore likely to savour local flavours in the destination. AFisher’s z-test was used to determine whether there was asignificant difference in the R values between the Slow Foodmembers and non-members group. No significant difference wasfound.
Table 9. Standard (enter) multiple regression analysis for predicting savouringlocal flavours
All participantsSample
Size
Beta(ß)
Sig. R R2 Adj.
R2 F Fisher z-test
Method 1Preference for familiarity & comfortInterest in new & local culturesPreference for activity & adventure
453-.384
.327-.002
.000.000.954
.557
.311 .306 65.202***
Method 2Preference for familiarity & comfortInterest in new & local culturesPreference for activity & adventure
514-.377
.265
.009
.000.000.830
.510
.260 .256 57.677***
Sub-group (Method 1)Slow Food membersPreference for familiarity & comfortInterest in new & local culturesPreference for activity &
276-.406
.279-.03
.000.000
.520
.271 .262 32.195***
z-score=-.734
p=.463
16

adventure 9 .486
Non-membersPreference for familiarity & comfortInterest in new & local culturesPreference for activity &adventure
177-.362
.350
.044
.000.000.524
.570
.325 .313 27.318***
Sub-group (Method 2)Slow Food membersPreference for familiarity & comfortInterest in new & local culturesPreference for activity &adventure
320-.389
.193-.029
.000.000.585
.459
.211 .203 26.905***
z-score=-1.446p=.148
Non-membersPreference for familiarity & comfortInterest in new & local culturesPreference for activity &adventure
194-.356
.336
.042
.000.000.533
.557
.311 .300 27.940***
Note. ***p<.001
3.4.3 The relationship between travel lifestyle factors anddestination activity -Immersion in the destination
Table 10 shows the results of the standard regression analysisusing the Enter method for predicting immersion in the destination forall participants and sub-groups. Similar results were found usingMethod 1 and Method 2, and for Slow Food members and non-members.Only interest in new and local culture revealed a positive strongsignificant influence ond to immersion in the destination. The resultssuggest that participants’ who express an interest in local foodand culture influences their preferenceare more likely to immersethemselves in the destination.
When analysing per group (Slow Food members and non-members),preference for familiarity and comfort also showed a significant andnegative influence on immersion in the destination for non-members only.Thus non-members were more likely to immerse themselves in adestination when they were less concerned about familiarity andcomfort in their travel. There were no significant differencebetween the R values for Slow Food members and non-members.
17

Table 10. Standard (enter) multiple regression analysis for predicting immersionin the destination
All participantsSample
Size
Beta(ß)
Sig. R R2 Adj.
R2 F Fisher z-test
Method 1Preference for familiarity & comfortInterest in new & local culturesPreference for activity & adventure
292-.118
.500-.136
.031.000.011
.544 .296 .289 38.717***
Method 2Preference for familiarity & comfortInterest in new & local culturesPreference for activity & adventure
501-.055
.426-.148
.204.000.001
.439 .193 .188 38.055***
Sub-group (Method 1)Slow Food membersPreference for familiarity & comfortInterest in new & local culturesPreference for activity & adventure
206-.038
.403
.099
.572.000.146
.445 .198 .186 15.732***
z-score=-.730
p=.465
Non-membersPreference for familiarity & comfortInterest in new & local culturesPreference for activity &adventure
86-.243
.388-.178
.026.001.108
.518 .268 .241 9.896***
Sub-group (Method 2)Slow Food membersPreference for familiarity & comfortInterest in new & local culturesPreference for activity &adventure
321.043.319.026
.439.000.645
.324 .105 .096 11.790***
z-score=-.959
p=.337
Non-membersPreference for familiarity & comfortInterest in new & local culturesPreference for activity &adventure
180-.168
.335-.120
.026.000.121
.402 .162 .147 11.078***
Note. ***p<.001
18

4. Discussion
Slow Food members and non-members presented different travellifestyle preferences as well as destination activity choices.Slow Food members were more interested in local and new cultureswhile non-members had a higher preference for familiarity andcomfort in their travel as well as preference for activity andadventure. (although aAge differences may have been an influencein this regard, but the effect remained significant when age wasaccounted for). Past studies have shown that individuals’motivations and decisions to travel are based on internal andexternal factors such as cultural, social, psychological andlifestyle factors (Correia & Pimpão, 2008; Decrop, 2006; Woodside,Caldwell, & Spurr, 2006). Slow Food members in this studypresented less interest in familiarity and comfort and higherinterest in local culture than non-members. Slow Food members werealso more likely than non-members to immerse themselves in adestination by interacting with the local community and enjoyingthe destination slowly.
However, the hypothesis that Slow Food members were moreconsistent than non-members in their destination activity choiceswas not supported, except for one item about visiting Slow Citydestinations. The extent to which these results might have beeninfluenced by the age, profession or gender differences betweenthese two groups requires further investigation.
This study also demonstrated that travel lifestyle preferencesinfluence destination activity choices for both Slow Food membersand non-members. Interest in new and local cultures was found to have astrong positive influence on all three destination activityfactors. The higher the interest in local culture, the higher thepreference in engaging in food activities, savouring localflavours, and immersion in the destination. Past studies havefound that tourists’ preference for familiar and comfortabletravel decreases their interest in tasting local food as theywould seek more familiar flavours in the destination (Chang,Kivela, & Mak, 2010; Germann Molz, 2007). Bardhi, Ostberg, andBengtsson’s (2010) study documented the negative food experienceencountered by American consumers in China due to their lack of
19

knowledge about the local culture of the destination. In thepresent study, savouring local flavours in the destination was influencednegatively by the preference for familiarity and comfort intravel, and positively by the interest in new and local cultures.
Travel lifestyle influenced destination activity choices for bothSlow Food members and non-members. The important influences weremostly similar between the two groups, however preference for activity andadventure had a positive influence on engagement in food activities forSlow Food members only, and preference for familiarity and comfort had anegative influence on immersion in the destination for non-members only.It seemed that members would be more likely to engage in foodactivities if they had a preference for activity and adventure,while non-members would be more likely to stay longer and interactwith local people in a destination if they were not concernedabout familiarity and comfort in their travel. Pizam and Jeong(1996) found tourists from different nationalities (Japanese,Koreans and Americans) had different travel behaviour (asperceived by tour guides), especially in the characteristic of“novelty vs. familiarity”. Basala and Klenosky (2001) also foundthat “familiarity seekers” preferred to stay in well-knowninternational hotels or places with a high level of comfort andconvenience while they travelled. The results of the present studysupport the observation that a preference for familiarity andcomfort is an important lifestyle factor that impacts onengagement in destination activities, especially in relation tosavouring local flavours. However, in the present study, interestin new and local cultures was also an important lifestyle factor,especially in relation to engaging in food activities andimmersion in the local destination.
5. Conclusion and implications
While both groups of participants in this study had foodinterests, Slow Food members showed a stronger interest in new andlocal cultures as well as being more likely to undertake food-activities, savour local flavours and immerse themselves in thedestination.
Past literature in food tourism proposes that participation inlocal food activities is driven by participants’ interest in food.
20

The present study suggests that this may not be a sufficientexplanation. Even when though tourists’ initial motivation totravel to a destination might not be related to food, theirparticipation in food activities in the destination is influencedby their travel lifestyle. In this case, the lifestyle of SlowFood members was reflected in their high interest in local cultureand low concern for familiarity and comfort in their travel. Thefindings of this study suggest that tourists who are willing toaccept and interact with new cultures tend to be more willing totry unfamiliar local food and experience local life. Their travellifestyle influences their motivation to participate in food-related activities in the destination. Although the two groups ofparticipants (Slow Food members and non-members) both had aninterest in food, their motivation to participate in food-relatedactivities was explained by their different travel lifestylepreferences. Lifestyle forms the habitus that a person carrieswherever he or she goes and is manifested through consumption andchoices of activities in the destination (Bourdieu, 1984;Hjalager, 2004).
The results of this study would assist destination managers andtourist operators to differentiate the kind of activities andevents likely to attract tourists who are more engaged in food.For example, if a local food event in a destination would like toattract international tourists, it might be more likely thatfreelance tourists (tourists who have more time to interact withlocal people) would have a higher interest in attending this eventthan group tourists with a tour guide (tourists who likecomfortable and familiar travel). Similarly, tourists who areinterested in local culture would be more willing to tastetraditional local food and get involved with local people. Thefindings of this study could also assist destination marketers tobetter understand the travel lifestyle of participants touristswith an interest in food, and design an appropriate marketing mixto provide adequate services.
The diverse cultural background of Slow Food members may haveimpacted on the results of this study. It is a recommendation forfuture study to explore the influence of cultural factors ontravel lifestyles, destination activities, and the relationshipsbetween them perform a single culture comparison between Slow Foodmembers and non-Slow Food participants within a single culturalgroup. There are other aspects of lifestyle that were not able to
21

be coveredincluded in this paperstudy, and could be explored in. Ffuture research could explore the relationship of other lifestylefactors with destination activity preferences of tourists with aninterest in food. The findings of this study suggest that theimpact of travel lifestyle on engagement in destination activitiesis likely to be a fruitful area for future research.
REFERENCESAb Karim, S., & Chi, C. G.-Q. (2010). Culinary Tourism as a
Destination Attraction: An Empirical Examination of Destinations' Food Image. Journal of Hospitality Marketing & Management,19(6), 531-555.
Allen, D. E. (2002). Toward a Theory of Consumer Choice as Sociohistorically Shaped Practical Experience: The Fits-Like-a-Glove (FLAG) Framework. Journal of Consumer Research, 28(4), 515-532.
Au, N., & Law, R. (2002). Categorical classification of tourism dining. Annals of Tourism Research, 29(3), 819-833.
Bardhi, F., Ostberg, J., & Bengtsson, A. (2010). Negotiating cultural boundaries: Food, travel and consumer identities. Consumption Markets & Culture, 13(2), 133-157.
Basala, S. L., & Klenosky, D. B. (2001). Travel-Style Preferences for Visiting a Novel Destination: A Conjoint Investigation across the Novelty-Familiarity Continuum. Journal of Travel Research,40(2), 172-182.
Bessiere, J. (1998). Local Development and Heritage: Traditional Food and Cuisine as Tourist Attractions in Rural Areas. Sociologia Ruralis, 38(1), 21-34.
Boniface, P. (2003). Tasting tourism: travelling for food and drink. Aldershot:Ashgate.
Bourdieu, P. (1984). Distinction: a social critique of the judgement of taste. Cambridge, Mass: Harvard University Press.
Bourdieu, P. (1990). The logic of practice. Cambridge: Polity Press.Chang, R. C. Y., Kivela, J., & Mak, A. H. N. (2010). Food
preferences of Chinese tourists. Annals of Tourism Research, 37(4), 989-1011.
Chen, J. S., Huang, Y.-C., & Cheng, J.-S. (2009). Vacation Lifestyle and Travel Behaviors. Journal of Travel & Tourism Marketing, 26(5/6), 494-506.
Correia, A., & Pimpão, A. (2008). Decision-making processes of Portuguese tourist travelling to South America and Africa.
22

International Journal of Culture, Tourism and Hospitality Research, 2(4), 330-373.
Decrop, A. (2006). Vacation Decision-Making. Wallingford: CAB International.
du Rand, G., Heath, E., & Alberts, N. (2003). The Role of Local and Regional Food in Destination Marketing -- A South AfricanSituation Analysis. Journal of Travel & Tourism Marketing, 14(3), 97-112.
Frochot, I. (2003). An Analysis of Regional Positioning and Its Associated Food Images in French Tourism Regional Brochures. Journal of Travel & Tourism Marketing, 14(3), 77-96.
Funk, D. C., Toohey, K., & Bruun, T. (2007). International Sport Event Participation: Prior Sport Involvement; Destination Image; and Travel Motives. European Sport Management Quarterly, 7(3), 227 - 248.
Germann Molz, J. (2007). Eating Difference. The Cosmopolitan Mobilities ofCulinary Tourism, 10(1), 77-93.
Hall, C. M. (2012). The Contradictions and Paradoxes of Slow Food:Environmental Change, Sustainability and the Conservation of Taste. In S. Fullagar, K. Markwell & E. Wilson (Eds.), Slow Tourism: Experiences and Mobilities (pp. 53-68): Channel View Publications.
Hall, C. M., & Mitchell, R. (2001). Wine and food tourism. In N. D. R. Derrett (Ed.), Special interest tourism (pp. 307-325). Australia: John Wiley.
Hall, C. M., & Sharples, L. (2008). Food events, festivals and farmers' markets: An introduction. In C. M. Hall & L. Sharples (Eds.), Food and wine festivals and events around the world: development, management and markets. Amsterdam: Elsevier/Butterworth-Heinemann.
Hjalager, A.-M. (2004). What do tourists eat and why? Towards a sociology of gastronomy and tourism. Tourism, 52(2), 195-201.
Hsu, T.-K., Tsai, Y.-F., & Wu, H.-H. (2009). The preference analysis for tourist choice of destination: A case study of Taiwan. Tourism Management, 30(2), 288-297.
Kao, M. C., Patterson, I., Scott, N., & Li, C. K. (2008). Motivations and Satisfactions of Taiwanese Tourists Who VisitAustralia. Journal of Travel & Tourism Marketing, 24(1), 17-33.
Kim, Y. H., Kim, M., Goh, B. K., & Antun, J. M. (2011). The Role of Money: The Impact on Food Tourists' Satisfaction and Intention to Revisit Food Events. Journal of Culinary Science & Technology, 9(2), 85-98.
23

Kivela, J., & Crotts, J. C. (2005). Gastronomy Tourism: A Meaningful Travel Market Segment. Journal of Culinary Science & Technology, 4(2/3), 39-55.
Kivela, J., & Crotts, J. C. (2006). Tourism and Gastronomy: Gastronomy's Influence on How Tourists Experience a Destination. Journal of Hospitality & Tourism Research, 30(3), 354-377.
Lanzendorf, M. (2002). Mobility Styles and Travel Behavior: Application of a Lifestyle Approach to Leisure Travel. Transportation Research Record, 1807(1), 163-173.
Lee, K. H. (2013). Understanding the importance of food in vacation decision making-Involvement, lifestyles and destination activity preferences of international Slow Food members. (Dissertation/Thesis), The University of Queensland, Australia.
Mak, A. H. N., Lumbers, M., & Eves, A. (2012). Globalisation and food consumption in tourism. Annals of Tourism Research, 39(1), 171-196.
McKercher, B., & Chan, A. (2005). How Special Is Special Interest Tourism? Journal of Travel Research, 44(1), 21-31.
McKercher, B., Okumus, F., & Okumus, B. (2008). Food Tourism as a Variable Market Segment: It's all how you cook the numbers! Journal of Travel & Tourism Marketing, 25(2), 137-148.
Moutinho, L. (1987). Consumer Behaviour in Tourism. European Journal ofMarketing, 21(10), 5-44.
Nevison, J. (2008). Impact of sustainable consumption choices on quality of life. Unpublished MA (International Leadership) project, Simon Fraser University.
Pizam, A., & Jeong, G.-H. (1996). Cross-cultural tourist behavior : Perceptions of Korean tour-guides. Tourism Management, 17(4), 277-286.
Quan, S., & Wang, N. (2004). Towards a structural model of the tourist experience: an illustration from food experiences in tourism. Tourism Management, 25(3), 297-305.
Schneider, S. (2008). Good, Clean, Fair: The Rhetoric of the Slow Food Movement. College English, 70(4), 384-402.
Schul, P., & Crompton, J. L. (1983). Search Behavior of International Vacationers: Travel-Specific Lifiestyle and Sociodemographic Variables. Journal of Travel Research, 22(2), 25-30.
Sirakaya, E., & Woodside, A. G. (2005). Building and testing theories of decision making by travellers. Tourism Management, 26(6), 815-832.
Smallman, C., & Moore, K. (2010). Process Studies of Tourists' Decision-Making. Annals of Tourism Research, 37(2), 397-422.
24

Smith, W. W., Pitts, R. E., & Litvin, S. W. (2012). Travel and leisure activity participation. Annals of Tourism Research, 39(4), 2207-2210.
Sobel, M. E. (1981). Lifestyle and social structure: concepts, definitions, analyses.New York: Academic Press.
Veal, A. J. (1991). Lifestyle and leisure: a review and bibliography (Vol. no. 13.). Sydney: Centre for Leisure & Tourism Studies, University of Technology.
Woodside, A. G., Caldwell, M., & Spurr, R. (2006). Advancing Ecological Systems Theory in Lifestyle, Leisure, and Travel Research. Journal of Travel Research, 44(3), 259-272.
25