Predictors of Juvenile Survival in Birds
55
PREDICTORS OF JUVENILE SURVIVAL IN BIRDS TERRI J. MANESS 1,2,3 AND DAVID J. ANDERSON 2 1 School of Biological Sciences, Louisiana Tech University, Ruston, Louisiana 71272, USA; and 2 Department of Biology, Wake Forest University, Winston-Salem, North Carolina 27106, USA ABSTRACT.—The survival probability of birds during the juvenile period, between the end of parental care and adulthood, is highly variable and has a major effect on population dynamics and parental fitness. As such, a large number of studies have attempted to evaluate potential predictors of juvenile survival in birds, especially predictors related to parental care. Lack’s hypothesis linking body reserves accumulated from parental care to the survival of naive juveniles has organized much of this research, but various other predictors have also been investigated and received some support. We reviewed the literature in this area and identified a variety of methodological problems that obscure interpretation of the body of results. Most studies adopted statistical techniques that missed the opportunities to (1) evaluate the relative importance of several predictors, (2) control the confounding effect of correlation among predictor variables, and (3) exploit the information content of collinearity by evaluating indirect (via correlation) as well as direct effects of potential predictors on juvenile survival. Ultimately, we concluded that too few reliable studies exist to allow robust evaluations of any hypothesis regarding juvenile survival in birds. We used path analysis to test potential predictors of juvenile survival of 2,631 offspring from seven annual cohorts of a seabird, the Nazca Booby (Sula granti). Fledging age was the most important predictor of juvenile survival: fast-growing offspring survived best, when all other variables were held constant. Offspring sex was the next most important predictor, with juvenile males (the smaller sex) surviving better than females. Hatching day, an index of body weight, and wing length also showed important predictive ability, but cohort size, culmen length, and an index of clutch size and hatching success did not. Nestling growth was compromised under poor rearing conditions: overall weight fell, the number of days needed to reach fledging status increased, and the growth of some structures, but not others, was reduced. These effects were more pronounced in females, and the higher juvenile mortality of females accounts for most of the male bias in the adult sex ratio and its attendant “mate rotation” mating system in this population. Most previous studies did not evaluate sex as a potential predictor of juvenile survival. Had we omitted sex from our models, we would have made two erroneous conclusions: that weight did not influence juvenile survival, and that small structural size enhanced it. Received17 May 2012, accepted 8 February 2013. Key words: body condition index, nestling growth, path analysis, reproductive success, sexual size dimorphism. Predictores de la Supervivencia Juvenil en Aves RESUMEN.— La probabilidad de supervivencia de las aves durante el periodo juvenil, entre el extremo de cuidado parental y la edad adulta, es altamente variable y tiene un efecto importante en la dinámica de la población e idoneidad parental. Como tal, un gran número de estudios ha intentado evaluar posibles predictores de la supervivencia juvenil en las aves, especialmente pre- dictores relacionados al cuidado de sus padres. Hipótesis de falta vinculación reservas corporales acumuladas de cuidado parental para la supervivencia de juveniles de ingenuo ha organizado gran Ornithological Monographs Volume (2013), No. 78, 1–55 © The American Ornithologists’ Union, 2013. Printed in USA. 1 Ornithological Monographs, Number 78, pages 1–55. ISBN: 978-0-943610-96-2. © 2013 by The American Ornithologists’ Union. All rights reserved. Please direct all requests for permission to photocopy or reproduce article content through the University of California Press’s Rights and Permissions website, http://www.ucpressjournals.com/reprintInfo.asp. DOI: 10.1525/om.2013.78.1.1. 3 E-mail: [email protected]
Transcript of Predictors of Juvenile Survival in Birds
PREDICTORS OF JUVENILE SURVIVAL IN BIRDS
Terri J. Maness1,2,3 and david J. anderson2
1School of Biological Sciences, Louisiana Tech University, Ruston, Louisiana 71272, USA; and2Department of Biology, Wake Forest University, Winston-Salem, North Carolina 27106, USA
absTracT.—The survival probability of birds during the juvenile period, between the end of parental care and adulthood, is highly variable and has a major effect on population dynamics and parental fitness. As such, a large number of studies have attempted to evaluate potential predictors of juvenile survival in birds, especially predictors related to parental care. Lack’s hypothesis linking body reserves accumulated from parental care to the survival of naive juveniles has organized much of this research, but various other predictors have also been investigated and received some support. We reviewed the literature in this area and identified a variety of methodological problems that obscure interpretation of the body of results. Most studies adopted statistical techniques that missed the opportunities to (1) evaluate the relative importance of several predictors, (2) control the confounding effect of correlation among predictor variables, and (3) exploit the information content of collinearity by evaluating indirect (via correlation) as well as direct effects of potential predictors on juvenile survival. Ultimately, we concluded that too few reliable studies exist to allow robust evaluations of any hypothesis regarding juvenile survival in birds. We used path analysis to test potential predictors of juvenile survival of 2,631 offspring from seven annual cohorts of a seabird, the Nazca Booby (Sula granti). Fledging age was the most important predictor of juvenile survival: fast-growing offspring survived best, when all other variables were held constant. Offspring sex was the next most important predictor, with juvenile males (the smaller sex) surviving better than females. Hatching day, an index of body weight, and wing length also showed important predictive ability, but cohort size, culmen length, and an index of clutch size and hatching success did not. Nestling growth was compromised under poor rearing conditions: overall weight fell, the number of days needed to reach fledging status increased, and the growth of some structures, but not others, was reduced. These effects were more pronounced in females, and the higher juvenile mortality of females accounts for most of the male bias in the adult sex ratio and its attendant “mate rotation” mating system in this population. Most previous studies did not evaluate sex as a potential predictor of juvenile survival. Had we omitted sex from our models, we would have made two erroneous conclusions: that weight did not influence juvenile survival, and that small structural size enhanced it. Received17 May 2012, accepted 8 February 2013.
Key words: body condition index, nestling growth, path analysis, reproductive success, sexual size dimorphism.
Predictores de la Supervivencia Juvenil en Aves
resuMen.— La probabilidad de supervivencia de las aves durante el periodo juvenil, entre el extremo de cuidado parental y la edad adulta, es altamente variable y tiene un efecto importante en la dinámica de la población e idoneidad parental. Como tal, un gran número de estudios ha intentado evaluar posibles predictores de la supervivencia juvenil en las aves, especialmente pre-dictores relacionados al cuidado de sus padres. Hipótesis de falta vinculación reservas corporales acumuladas de cuidado parental para la supervivencia de juveniles de ingenuo ha organizado gran
Ornithological MonographsVolume (2013), No. 78, 1–55© The American Ornithologists’ Union, 2013. Printed in USA.
1
Ornithological Monographs, Number 78, pages 1–55. ISBN: 978-0-943610-96-2. © 2013 by The American Ornithologists’ Union.All rights reserved. Please direct all requests for permission to photocopy or reproduce article content through the University of California Press’s Rights and Permissions website, http://www.ucpressjournals.com/reprintInfo.asp. DOI: 10.1525/om.2013.78.1.1.
3E-mail: [email protected]
2 ORNITHOLOGICAL MONOGRAPHS NO. 78
parte de esta investigación, pero varios otros predictores también han sido investigados y recibió algún apoyo. Repasamos la literatura en esta área y había identificado una variedad de problemas metodológicos que oscurecen la interpretación del cuerpo de los resultados. Mayoría de los estudios adoptado técnicas estadísticas que desaprovechar las oportunidades (1) evaluar la importancia relativa de varios calculadores, (2) controlar el efecto de confusión de correlación entre las vari-ables predictoras y (3) explotar el contenido de información de colinealidad evaluando indirecto (a través de correlación) así como los efectos directos de predictores potenciales sobre la supervivencia de juvenil. Finalmente, llegamos a la conclusión que existen muy pocos estudios confiables para permitir evaluaciones robustas de cualquier hipótesis en cuanto a supervivencia juvenil en las aves. Utilizamos análisis de trayectoria para probar posibles predictores de la supervivencia juve-nil de 2.631 descendencia de siete cohortes anuales de un ave marina, el piquero de Nazca. Edad de emancipación fue el predictor más importante de la supervivencia juvenil: rápido crecimiento descendencia sobrevivieron mejor, cuando todas las otras variables se mantiene constantes. Sexo de la descendencia fue el predictor más importante siguiente, con los machos juveniles (el sexo más pequeño) sobrevivir mejor que las hembras. Día de eclosión, un índice de peso corporal y la longitud del ala también mostró importante capacidad predictiva, pero el tamaño de la cohorte, longitud de culmen y un índice de tamaño de la nidada y el éxito de eclosión no. Crecimiento del polluelo estaba comprometida en malas condiciones de cría: peso total cayó, nido de estado mayor y el crecimiento de algunas estructuras, pero no en otros, se redujo el número de días necesarios para alcanzar. Estos efectos fueron más pronunciados en las hembras, y la mayor mortalidad juvenil de hembras representa para la mayoría el sesgo masculino en la proporción de sexos adultos y su asistente “compañero rotación” sistema en esta población de apareamiento. Mayoría de los estudios anterior no evaluar sexo como potencial predictor de supervivencia juvenil. Nos habíamos omitido sexo de nuestros modelos, habríamos hecho dos conclusiones erróneas: que peso no influyó en sobreviven-cia juvenil, y ese pequeño tamaño estructural mejorada lo. Nos habíamos omitido sexo de nuestros modelos, habríamos hecho dos conclusiones erróneas: que peso no influyó en sobrevivencia juvenil, y ese pequeño tamaño estructural mejorada lo.
inTroducTion
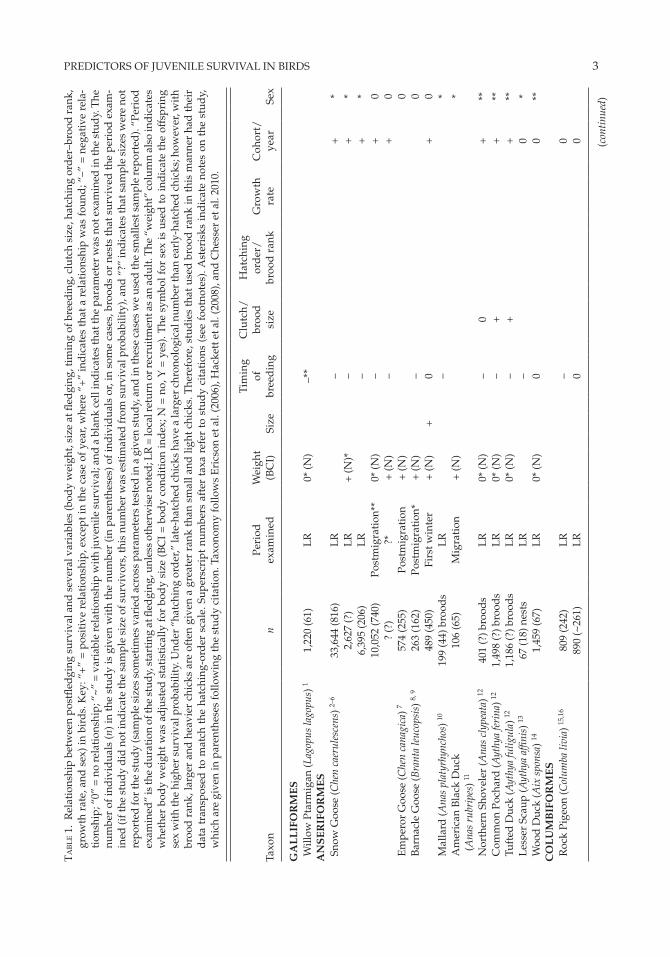
research regarding populaTion dynamics and life histories typically focuses on breeding success, adult survival, and adult sex ratio. These parameters are not the only important demographic effects on population growth, but they are generally easier to measure than the remaining component of the life history timeline, survival from independence to adulthood. During this interval, propagules and juveniles of both plants and animals may be inconspicuous and located away from population concentrations (e.g., in an unobservable state), making detection difficult. However, estimates of breeding success may be inaccurate if this param-eter is ignored, and sex-biased juvenile survival can have profound ecological and evolutionary impacts on the population (Trivers and Willard 1973; Elgar 1990; Clutton-Brock 1991; Promislow et al. 1992; Venable 1992; Bernardo 1996; Fox and Czesak 2000; Marshall et al. 2003; Marshall and Keough 2007, 2009). For the many studies of birds, the difficulty of sexing the young of most species further com-plicated the issue in that group before the use of molecular sexing (Griffiths et al. 1998, Fridolfsson and Ellegren 1999). These logistical obstacles have
limited exploitation of the rich research possibilities linking parental care, offspring status at indepen-dence, and survival as a naive, prebreeding son or daughter. We begin by reviewing hypothetical predictors of juvenile survival and the logistical obstacles that complicate their study.
In an influential early contribution, Lack (1966) linked survival to a juvenile’s fat reserve at the end of parental care and, thus, to the quality of its parental care. Lack focused on weight and assumed that body weight reflects the size of the fat reserve. We will refer to Lack’s influential idea as the “body-reserve advantage hypothesis.” He predicted a higher survival probability for heavier juveniles than for lighter ones just after leaving the nest, expecting fat reserves to buffer the food limitation that accompanies foraging inexperience. This hypothesis is invoked widely despite mixed evidence from the few studies that have made di-rect, invasive assessments of fat stores in relation to body weight (Thompson et al. 1993, Ardia 2005). In addition, the mean total fat content of nestling Great Tits (for scientific names of species consid-ered in our study, see Table 1) represents only a 1-day supply of energy, assuming that the nest-lings could mobilize all of their fat (Garnett 1981).
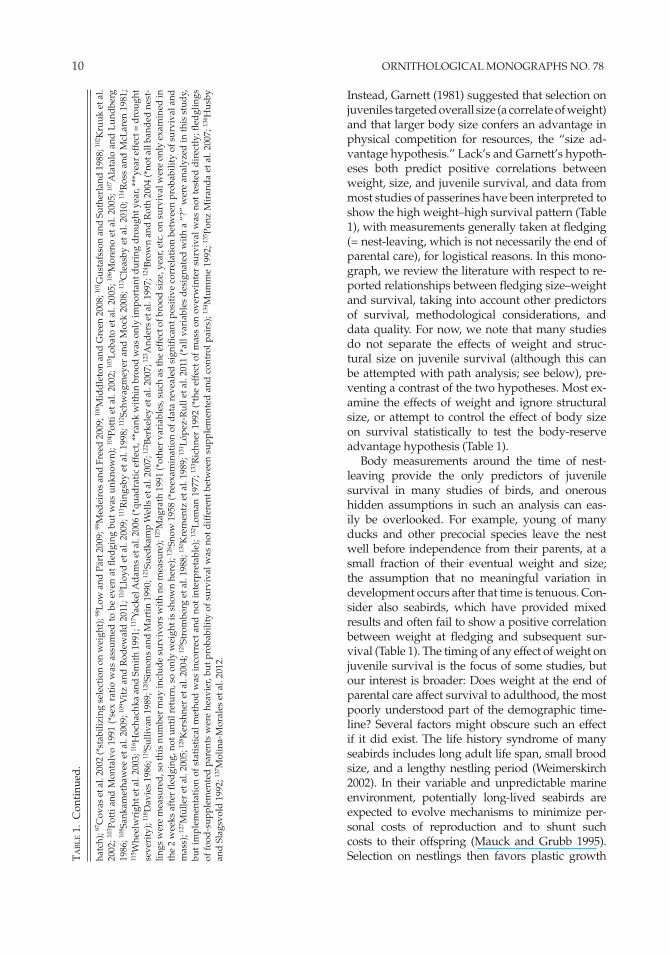
PREDICTORS OF JUVENILE SURVIVAL IN BIRDS 3
Taxo
n
n
Per
iod
ex
amin
ed
Wei
ght
(BC
I)
Size
Tim
ing
of
bree
din
g
Clu
tch/
br
ood
si
ze
Hat
chin
g or
der
/
broo
d r
ank
Gro
wth
ra
te
Coh
ort/
ye
ar
Sex
GA
LL
IFO
RM
ES
Will
ow P
tarm
igan
(Lag
opus
lago
pus)
11,
220
(61)
LR
0* (N
)
–**
A
NS
ER
IFO
RM
ES
Snow
Goo
se (C
hen
caer
ules
cens
) 2–6
33,6
44 (8
16)
LR
–
+*
2,62
7 (?
)L
R+
(N)*
–
+
*6,
395
(206
)L
R
–
+
*10
,052
(740
)Po
stm
igra
tion
**0*
(N)
–
+
0?
(?)
?*+
(N)
–
+
0E
mpe
ror
Goo
se (C
hen
cana
gica
) 757
4 (2
55)
Post
mig
rati
on+
(N)
0B
arna
cle
Goo
se (B
rant
a le
ucop
sis)
8, 9
263
(162
)Po
stm
igra
tion
*+
(N)
–
048
9 (4
50)
Firs
t win
ter
+ (N
)+
0
+0
Mal
lard
(Ana
s pl
atyr
hync
hos)
1019
9 (4
4) b
rood
sL
R
–
*A
mer
ican
Bla
ck D
uck
(A
nas
rubr
ipes
) 1110
6 (6
5)M
igra
tion
+ (N
)
*
Nor
ther
n Sh
ovel
er (A
nas
clyp
eata
) 1240
1 (?
) bro
ods
LR
0* (N
)
–0
+**
Com
mon
Poc
hard
(Ayt
hya
feri
na) 12
1,49
8 (?
) bro
ods
LR
0* (N
)
–+
+**
Tuft
ed D
uck
(Ayt
hya
fulig
ula)
121,
186
(?) b
rood
sL
R0*
(N)
–
+
+
**L
esse
r Sc
aup
(Ayt
hya
affin
is) 13
67 (1
8) n
ests
LR
–
0*
Woo
d D
uck
(Aix
spo
nsa)
141,
459
(67)
LR
0*
(N)
0
0
**C
OL
UM
BIF
OR
ME
S
R
ock
Pige
on (C
olum
ba li
via)
15,1
680
9 (2
42)
LR
–
0
890
(~26
1)L
R
0
0
Ta
bl
e 1
. R
elat
ions
hip
betw
een
post
fled
ging
sur
viva
l and
sev
eral
var
iabl
es (b
ody
wei
ght,
size
at fl
edgi
ng, t
imin
g of
bre
edin
g, c
lutc
h si
ze, h
atch
ing
ord
er–b
rood
ran
k,
grow
th r
ate,
and
sex
) in
bir
ds.
Key
: “+
” =
pos
itiv
e re
lati
onsh
ip, e
xcep
t in
the
case
of
year
, whe
re “
+”
ind
icat
es th
at a
rel
atio
nshi
p w
as f
ound
; “–”
= n
egat
ive
rela
-ti
onsh
ip; “
0” =
no
rela
tion
ship
; “~
” =
var
iabl
e re
lati
onsh
ip w
ith
juve
nile
sur
viva
l; an
d a
bla
nk c
ell i
ndic
ates
that
the
para
met
er w
as n
ot e
xam
ined
in th
e st
udy.
The
nu
mbe
r of
ind
ivid
uals
(n) i
n th
e st
udy
is g
iven
wit
h th
e nu
mbe
r (i
n pa
rent
hese
s) o
f ind
ivid
uals
or,
in s
ome
case
s, b
rood
s or
nes
ts th
at s
urvi
ved
the
peri
od e
xam
-in
ed (i
f the
stu
dy
did
not
ind
icat
e th
e sa
mpl
e si
ze o
f sur
vivo
rs, t
his
num
ber
was
est
imat
ed fr
om s
urvi
val p
roba
bilit
y), a
nd “
?” in
dic
ates
that
sam
ple
size
s w
ere
not
repo
rted
for
the
stud
y (s
ampl
e si
zes
som
etim
es v
arie
d a
cros
s pa
ram
eter
s te
sted
in a
giv
en s
tud
y, a
nd in
thes
e ca
ses
we
used
the
smal
lest
sam
ple
repo
rted
). “P
erio
d
exam
ined
” is
the
dur
atio
n of
the
stud
y, s
tart
ing
at fl
edgi
ng, u
nles
s ot
herw
ise
note
d; L
R =
loca
l ret
urn
or re
crui
tmen
t as
an a
dul
t. T
he “
wei
ght”
col
umn
also
ind
icat
es
whe
ther
bod
y w
eigh
t w
as a
dju
sted
sta
tist
ical
ly f
or b
ody
size
(B
CI
= b
ody
cond
itio
n in
dex
; N =
no,
Y =
yes
). T
he s
ymbo
l for
sex
is u
sed
to
ind
icat
e th
e of
fspr
ing
sex
wit
h th
e hi
gher
sur
viva
l pro
babi
lity.
Und
er “
hatc
hing
ord
er,”
late
-hat
ched
chi
cks
have
a la
rger
chr
onol
ogic
al n
umbe
r th
an e
arly
-hat
ched
chi
cks;
how
ever
, wit
h br
ood
ran
k, la
rger
and
hea
vier
chi
cks
are
ofte
n gi
ven
a gr
eate
r ra
nk th
an s
mal
l and
ligh
t chi
cks.
The
refo
re, s
tud
ies
that
use
d b
rood
ran
k in
this
man
ner
had
thei
r d
ata
tran
spos
ed t
o m
atch
the
hat
chin
g-or
der
sca
le. S
uper
scri
pt n
umbe
rs a
fter
tax
a re
fer
to s
tud
y ci
tati
ons
(see
foo
tnot
es).
Ast
eris
ks in
dic
ate
note
s on
the
stu
dy,
w
hich
are
giv
en in
par
enth
eses
follo
win
g th
e st
udy
cita
tion
. Tax
onom
y fo
llow
s E
rics
on e
t al.
(200
6), H
acke
tt e
t al.
(200
8), a
nd C
hess
er e
t al.
2010
.
(con
tinu
ed)

4 ORNITHOLOGICAL MONOGRAPHS NO. 78T
ab
le 1
. C
onti
nued
.
(con
tinu
ed)
Taxo
n
n
Per
iod
ex
amin
ed
Wei
ght
(BC
I)
Size
Tim
ing
of
bree
din
g
Clu
tch/
br
ood
si
ze
Hat
chin
g or
der
/
broo
d r
ank
G
row
th
rate
C
ohor
t/
year
Se
x
Eur
asia
n C
olla
red
-Dov
e
(Str
epto
pelia
dec
aoct
o) 17
41 (2
6)13
wee
ks0
(Y)
0
0
CU
CU
LIF
OR
ME
S
G
reat
Spo
tted
Cuc
koo
(C
lam
ator
gla
ndar
ius)
1838
(24)
12 w
eeks
+ (N
)
GR
UIF
OR
ME
S
E
uras
ian
Coo
t (Fu
lica
atra
) 1964
4 (1
13)
1 ye
ar
+–
+
H
ouba
ra B
usta
rd
(Cha
myd
otis
und
ulat
a) 20
92 (7
0)1
year
0 (N
)
0
Gre
at B
usta
rd (O
tis
tard
a) 21
328
(98)
1 ye
ar+
(N)
0
+
♀P
RO
CE
LL
AR
IFO
RM
ES
Shor
t-ta
iled
She
arw
ater
(P
uffin
us te
nuir
ostr
is) 22
388
(31)
LR
0 (N
)0
Man
x Sh
earw
ater
(P
uffin
us p
uffin
us) 23
5,07
9 (9
80)
≥1 y
ear
+ (N
)
–
+
Soot
y Sh
earw
ater
(P
uffin
us g
rise
us) 24
500
(31)
LR
+ (N
)
0
Wan
der
ing
Alb
atro
ss
(Dio
med
ea e
xula
ns) 25
33 (1
4)L
R–
(Y)
+0
0
*26
(17)
LR
+ (Y
)0
0
0
**
SP
HE
NIS
CIF
OR
ME
S
L
ittl
e Pe
ngui
n
(Eud
yptu
la m
inor
) 26,2
745
(23)
1 ye
ar+
(N)
–
60
6 (6
0)1
year
0 (N
)
0/–*
+
+
Ye
llow
-eye
d P
engu
in
(Meg
adyp
tes
anti
pode
s) 28
2,12
5 (?
)≥1
yea
r+
(N)
Gen
too
Peng
uin
(Pyg
osce
lis p
apua
) 2944
(26)
LR
0 (N
)
0
Kin
g Pe
ngui
n
(Apt
enod
ytes
pat
agon
icus
) 30,3
165
(15)
≤4 y
ears
0 (N
)
–
+
2,37
5 (1
,838
)L
R+
(Y)
+
♂C
ICO
NII
FOR
ME
S
W
ood
Sto
rk (M
ycte
ria
amer
ican
a) 32
44 (9
)≤2
yea
rs0*
(N)
+
♀P
EL
ICA
NIF
OR
ME
S
L
ittl
e E
gret
(Egr
etta
gar
zett
a) 33
3,02
4 (2
53)
LR
0
+
SU
LIF
OR
ME
S
E
urop
ean
Shag
(P
hala
croc
orax
ari
stot
elis
) 3413
,086
(1,3
77)
≥3 y
ears
–+
+

PREDICTORS OF JUVENILE SURVIVAL IN BIRDS 5
Taxo
n
n
Per
iod
ex
amin
ed
Wei
ght
(BC
I)
Size
Tim
ing
of
bree
din
g
Clu
tch/
br
ood
si
ze
Hat
chin
g or
der
/
broo
d r
ank
G
row
th
rate
C
ohor
t/
year
Se
x
Cap
e G
anne
t (M
orus
cap
ensi
s) 35
1,00
4 (9
91)
?*+
**(N
)
–
Naz
ca B
ooby
(Sul
a gr
anti
) 362,
080
(995
)L
R+
(N)
+–
+0
♂C
HA
RA
DR
IIFO
RM
ES
Her
ring
Gul
l (La
rus
arge
ntat
us) 37
,38
10,0
90 (1
,479
)L
R
0
27
,115
(708
)L
R
–
–
W
este
rn G
ull (
Laru
s oc
cide
ntal
is) 39
1,05
6* (1
93)
LR
–+
–
+
Bla
ck-l
egge
d K
itti
wak
e
(Ris
sa tr
idac
tyla
) 40,4
190
4 (9
4)L
R
+–
+
4,
059
(477
)1
year
–+
Com
mon
Ter
n (S
tern
a hi
rund
o) 42
,43
236
(106
)2
year
s+
(N)
0
+
023
6 (1
99)
Dep
artu
re0
(N)
+
0So
oty
Tern
(Ony
chop
rion
fusc
atus
) 441,
127
(20)
≥22
year
s*0
(N)
–
Sa
ndw
ich
Tern
(T
hala
sseu
s sa
ndvi
cens
is) 45
3,36
5 (4
13)
LR
0 (N
)
+
Bla
ck-f
ront
ed T
ern
(C
hlid
onia
s al
bost
riat
us) 46
44 (3
6)4
wee
ks+
(N)
+
0*
Com
mon
Gui
llem
ot
(Uri
a aa
lge)
47–4
913
,841
(278
)≥1
yea
r0
(N)
0
1,
277
(313
)≥6
mon
ths*
0 (Y
)
–
0
+
9,02
5 (5
,054
)1
year
0 (Y
)*
–
+
+
Thi
ck-b
illed
Mur
re (U
ria
lom
via)
5013
8 (2
9)4–
5 ye
ars
0* (N
)
0**
R
azor
bill
(Alc
a to
rda)
511,
461
(72)
LR
0* (N
)
0
Anc
ient
Mur
rele
t (S
ynth
libor
amph
us a
ntiq
uus)
524,
045
(53)
LR
+*
(N)
+
Atl
anti
c Pu
ffin
(Fra
terc
ula
arct
ica)
5326
8 (5
8)≥6
mon
ths
0 (N
)
0
0
Tuft
ed P
uffin
(Fra
terc
ula
cirr
hata
) 5413
3 (3
5)L
R+
(N)
+–
+
G
reat
Sku
a (S
terc
orar
ius
skua
) 5542
0 (2
91)
≤1 y
ear
–
Para
siti
c Ja
eger
(S
terc
orar
ius
para
siti
cus)
561,
313
(38)
LR
+ (N
)
–
Eur
asia
n O
yste
rcat
cher
(H
aem
atop
us o
stra
legu
s) 57
120
(46)
LR
0 (N
)0
0
0
CO
RA
CII
FOR
ME
S
L
augh
ing
Koo
kabu
rra
(D
acel
o no
vaeg
uine
ae) 58
162
(9)
LR
+ (N
)0
0
Mid
dle
Spo
tted
Woo
dpe
cker
(D
endr
ocop
os m
ediu
s) 59
39 (1
2)46
day
s+
(Y)
0
0
Ta
bl
e 1
. C
onti
nued
.
(con
tinu
ed)

6 ORNITHOLOGICAL MONOGRAPHS NO. 78
Taxo
n
n
Per
iod
ex
amin
ed
Wei
ght
(BC
I)
Size
Tim
ing
of
bree
din
g
Clu
tch/
br
ood
si
ze
Hat
chin
g or
der
/
broo
d r
ank
G
row
th
rate
C
ohor
t/
year
Se
x
ST
RIG
IFO
RM
ES
Bur
row
ing
Ow
l (A
then
e cu
nicu
lari
a) 60
,61
32 (1
8)3
mon
ths
+ (N
)
00
+0
40 (2
2)M
igra
tion
0 (Y
)
0
0
Taw
ny O
wl (
Stri
x al
uco)
6250
2* (1
04)
LR
–
AC
CIP
ITR
IFO
RM
ES
Eur
asia
n Sp
arro
wha
wk
(A
ccip
iter
nis
us) 63
240
(58)
28 d
ays
0 (N
)
0
0
*
Nor
ther
n G
osha
wk
(Acc
ipit
er g
enti
lis) 64
89 (6
4)12
wee
ks+
(N)
0
0
0
♂*
Egy
ptia
n V
ultu
re
(Neo
phro
n pe
rcno
pter
us) 65
658
(?)
≥1 y
ear
0 (Y
)
00
FAL
CO
NIF
OR
ME
S
Pr
airi
e Fa
lcon
(Fal
co m
exic
anus
) 6615
2 (1
05)
35 d
ays
0 (Y
)
00
00
PAS
SE
RIF
OR
ME
S
E
aste
rn K
ingb
ird
(T
yran
nus
tyra
nnus
) 6710
2 (2
5)L
R0
(N)
0–
–
0
*94
(21)
LR
0 (N
)0
0–
+**
Bla
ck-c
row
ned
Ant
shri
ke
(Tha
mno
philu
s at
rinu
cha)
6824
(11)
LR
+ (N
)
–
0
Bro
wn
Tho
rnbi
ll (A
cant
hiza
pus
illa)
6915
9 (3
7)L
R+
(Y)
0
00
0
♂*
Spot
ted
Ant
bird
(H
ylop
hyla
x na
evio
ides
) 7081
(37)
50 d
ays
0 (N
)
–
Gre
at T
it (P
arus
maj
or) 71
–84
? (?
)*3
mon
ths
+ (N
)
–+
+
466
(125
)11
wee
ks
+0
0
*54
1 (6
9)≥3
mon
ths
+ (N
)+
1,48
2 (2
70) 74
Win
ter
+ (N
)+
1,48
2 (2
70) 74
LR
––
3,57
5 (?
) 75L
R—
Hog
e V
eluw
e+
(N)
0
+
♂*
3,67
5 (?
) 75L
R—
Vlie
land
+ (N
)
0
+♂
*5,
907
(341
)L
R+
(Y)
–
–
13
7 (1
4)L
R+
(N)
–
(con
tinu
ed)
Ta
bl
e 1
. C
onti
nued
.

PREDICTORS OF JUVENILE SURVIVAL IN BIRDS 7
Taxo
n
n
Per
iod
ex
amin
ed
Wei
ght
(BC
I)
Size
Tim
ing
of
bree
din
g
Clu
tch/
br
ood
si
ze
Hat
chin
g or
der
/
broo
d r
ank
G
row
th
rate
C
ohor
t/
year
Se
x
3,93
2 (2
85)
LR
+ (N
)
–
+♀
*?
(?)*
LR
+ (N
)
2,05
1 (1
84)
LR
+ (N
)
~*
0
3,
147
(288
)≥1
yea
r+
(N)
0
+
27
3 (1
9)L
R0
(Y)
0
0
0
3,
106
(734
)3
mon
ths
+ (N
)
+
266
(141
)20
day
s+
(N)
–
0
C
oal T
it (P
erip
arus
ate
r) 84
,85
76 (4
0)20
day
s+
(N)
–
0
1,
086
(114
)L
R
–
0B
lue
Tit (
Cya
nist
es c
aeru
leus
) 86–8
887
8 (6
8)≥3
mon
ths
+ (N
)
0
? (?
)*≥3
mon
ths
–+
+
1,20
4 (1
19)
Firs
t win
ter
or
mor
e+
(N)
+
♂
Lon
g-ta
iled
Tit
(Aeg
itha
los
caud
atus
) 8965
2 (?
)O
verw
inte
r+
(N)
0
0
+
♂*
Com
mon
Hou
se M
arti
n
(Del
icho
n ur
bica
) 9050
5 (3
5)1
year
0 (Y
)
0*+
Purp
le M
arti
n (P
rogn
e su
bis)
913,
990
(1,0
77)
1 ye
ar
–
–
+
B
arn
Swal
low
(Hir
undo
rus
tica
) 92,9
321
8 (?
)38
day
s0
(N)
+–
24
3 (?
)38
day
s
–
+
Tr
ee S
wal
low
(Tac
hyci
neta
bic
olor
) 94,9
537
(14)
bro
ods*
LR
0 (N
)0
0
1,83
6 (8
7)L
R+
(N)
0–
0
C
liff S
wal
low
(P
etro
chel
idon
pyr
rhon
ota)
965,
122*
(?)
1 ye
ar
–*
*
+
Soci
able
Wea
ver
(Phi
leta
irus
soc
ius)
9743
5 (?
)4
mon
ths
+/
– (N
)*0
Stit
chbi
rd (N
otio
mys
tis
cinc
ta) 98
594
(?)
LR
0 (N
)
0
Ake
pa (L
oxop
s co
ccin
eus)
9971
(27)
≥1 y
ear
+ (N
)0
Am
eric
an D
ippe
r
(Cin
clus
mex
ican
us) 10
082
(10)
LR
0 (Y
)0
00
0
00
Col
lare
d F
lyca
tche
r
(Fic
edul
a al
bico
llis)
101,
76,1
022,
135
(1,8
26)
LR
+ (N
)+
–
7,56
0 (8
53)
LR
+ (Y
)
–0
2,06
5 (1
,764
)L
R+
(Y)
+–
0
+
(con
tinu
ed)
Ta
bl
e 1
. C
onti
nued
.

8 ORNITHOLOGICAL MONOGRAPHS NO. 78
Taxo
n
n
Per
iod
ex
amin
ed
Wei
ght
(BC
I)
Size
Tim
ing
of
bree
din
g
Clu
tch/
br
ood
si
ze
Hat
chin
g or
der
/
broo
d r
ank
G
row
th
rate
C
ohor
t/
year
Se
x
Eur
opea
n Pi
ed F
lyca
tche
r
(Fic
edul
a hy
pole
uca)
103–
107
918
(145
)L
R0
(Y)
0
–
0*41
9 (5
3)L
R+
(N)
0
–
030
3 (1
8)L
R0
(N)
0
+
49
1 (3
6)L
R0
(N)
0
0
1,
705
(?)
LR
+
Puff
-thr
oate
d B
ulbu
l (A
loph
oixu
s pa
llidu
s) 1
0854
(33)
8 w
eeks
0 (N
)
0
00
Ove
nbir
d (S
eiur
us a
uroc
apill
a) 10
951
(33)
51 d
ays
+ (Y
)
–0
0
Wor
m-e
atin
g W
arbl
er (H
elm
ithe
ros
verm
ivor
um) 1
0960
(40)
31 d
ays
+ (Y
)
+–
0
Kar
oo S
crub
Rob
in
(Cer
cotr
icha
s co
ryph
aeus
) 110
167
(129
)3
wee
ks+
(N)
0
0
Hou
se S
parr
ow
(Pas
ser
dom
esti
cus)
111–
113
3,40
0 (1
00)
LR
+ (N
)
00
408
(108
)L
R+
(Y)
++
0
79
3 (1
52)
LR
+ (N
)
00
0♀
Sava
nnah
Spa
rrow
(P
asse
rcul
us s
andw
iche
nsis
) 114,
115
596
(25)
LR
0 (N
)0
00
0
221
(37)
LR
+ (N
)
–
00
Song
Spa
rrow
(Mel
ospi
za m
elod
ia) 11
61,
193
(774
)5
mon
ths
+ (Y
)
0
0
+
Lar
k B
unti
ng
(Cal
amos
piza
mel
anoc
orys
) 117
167
(27)
22 d
ays
0 (Y
)
+/
–*
–**
+
***
Dun
nock
(Pru
nella
mod
ular
is) 11
831
9 (2
29)
2–3
wee
ks+
(N)
0
Ye
llow
-eye
d Ju
nco
(J
unco
pha
enot
us) 11
920
6 (4
5)36
day
s0
(N)
0
Cac
tus
Wre
n
(Cam
pylo
rhyn
chus
bru
nnei
capi
llus)
120
81 (?
)4–
6 w
eeks
+ (N
)
+
Dic
kcis
sel (
Spiz
a am
eric
ana)
121,
122
155
(86)
58 d
ays
+ (N
)
00
0
53 (2
0)30
day
s0
(N)
0
W
ood
Thr
ush
(Hyl
ocic
hla
mus
telin
a) 12
3,12
449
(21)
8 w
eeks
0 (N
)
0
941
(48)
*L
R0
(Y)
0–
0
0
E
uras
ian
Bla
ckbi
rd
(Tur
dus
mer
ula)
125,
126
417
(41)
LR
+ (N
)*
190
(107
)20
day
s+
(N)*
0
R
ed-b
acke
d S
hrik
e
(Lan
ius
collu
rio)
127
176
(32)
LR
0 (Y
)0
–+
+
(con
tinu
ed)
Ta
bl
e 1
. C
onti
nued
.
PREDICTORS OF JUVENILE SURVIVAL IN BIRDS 9
Taxo
n
n
Per
iod
ex
amin
ed
Wei
ght
(BC
I)
Size
Tim
ing
of
bree
din
g
Clu
tch/
br
ood
si
ze
Hat
chin
g or
der
/
broo
d r
ank
G
row
th
rate
C
ohor
t/
year
Se
x
Eas
tern
Mea
dow
lark
(S
turn
ella
mag
na) 12
8,12
150
(29)
90 d
ays
+ (N
)
0
107
(77)
72 d
ays
+ (N
)
00
0
Eur
opea
n St
arlin
g
(Stu
rnus
vul
gari
s) 12
9,13
012
1 (5
0)42
day
s0
(N)
15
7 (?
)11
wee
ks+
(N)
0
Sp
otle
ss S
tarl
ing
(Stu
rnus
uni
colo
r) 13
129
1 (3
2)L
R
?*?
?
+
?H
ood
ed C
row
(Cor
vus
corn
ix) 13
216
2 (6
2)D
ispe
rsal
+ (N
)
–+
Car
rion
Cro
w (C
orvu
s co
rone
) 133
82 (3
4)O
verw
inte
r0
(N)*
+
0Fl
orid
a Sc
rub-
Jay
(A
phel
ocom
a co
erul
esce
ns) 13
463
(38)
40 d
ays
+ (N
)+
–
Eur
opea
n M
agpi
e (P
ica
pica
) 135–
137
50 (1
0)≥9
mon
ths
0 (N
)
0
39 (2
9)50
day
s+
(N)
+
0
0
030
9 (3
6)L
R+
(N)
–
0
1 Mar
tin
and
Han
non
1987
(*w
eigh
t at
1–7
day
s, c
ateg
oriz
ed a
s lig
ht, m
ediu
m, o
r he
avy;
**c
ompa
riso
n of
firs
t an
d r
epla
cem
ent
clut
ches
); 2 C
ooke
et
al. 1
984
(*on
ly f
emal
es in
the
ana
lysi
s);
3 Coo
ch 2
002
(*on
ly fe
mal
es in
the
anal
ysis
); 4 R
eed
et a
l. 20
03 (*
only
fem
ales
in th
e an
alys
is);
5 Men
u et
al.
2005
(*m
ean
mas
s an
d fl
edgi
ng d
ate
of a
coh
ort w
ere
used
to p
red
ict c
ohor
t sur
viva
l pr
obab
ility
); 6 F
ranc
is e
t al.
1992
(*su
rviv
al b
ased
on
band
rec
over
ies
from
hun
ters
); 7 S
chm
utz
1993
; 8 Ow
en a
nd B
lack
198
9; 9 S
horr
ocks
et a
l. 19
98; 10
Dzu
s an
d C
lark
199
8 (*
only
fem
ales
in th
e an
alys
is);
11L
ongc
ore
et a
l. 19
91 (*
only
fem
ales
in th
e an
alys
is);
12B
lum
s et
al.
2002
(*m
ean
wei
ght o
f bro
od o
n ha
tchi
ng d
ay; *
*exa
min
ed fe
mal
es o
nly)
; 13D
awso
n an
d C
lark
200
0 (*
only
fem
ales
in
the
anal
ysis
); 14
Hep
p et
al.
1989
(*w
eigh
t on
hatc
hing
day
; **e
xam
ined
fem
ales
onl
y); 15
Het
mań
ski 2
007;
16H
etm
ańsk
i and
Bar
kow
ska
2008
; 17E
raud
et a
l. 20
11; 18
Sole
r et
al.
1994
; 19B
rink
hof
et a
l. 19
97; 20
Cha
rgé
et a
l. 20
11; 21
Mar
tín
et a
l. 20
07; 22
Mea
thre
l and
Car
ey 2
007;
23Pe
rrin
s 19
66, P
erri
ns e
t al
. 197
3; 24
Saga
r an
d H
orni
ng 1
998;
25W
eim
ersk
irch
et
al. 2
000
(*m
ales
onl
y in
the
an
alys
is, *
*fem
ales
onl
y in
the
anal
ysis
); 26
Rei
lly a
nd C
ulle
n 19
82; 27
Joha
nnes
en e
t al.
2003
(*in
tera
ctio
n be
twee
n la
ying
dat
e an
d c
lutc
h si
ze—
sing
leto
ns h
ad n
egat
ive
rela
tion
ship
); 28
McC
lung
et
al.
2004
; 29W
illia
ms
and
Cro
xall
1991
; 30O
lsso
n 19
97; 31
Sara
ux e
t al
. 201
1; 32
Hyl
ton
et a
l. 20
06 (
*mea
sure
d ~
1 m
onth
bef
ore
fled
ging
); 33
Haf
ner
et a
l. 19
98; 34
Har
ris
et a
l. 19
94; 35
Jarv
is 1
974
(*ti
me
fram
e is
unc
erta
in b
ecau
se c
ompa
riso
n w
as b
etw
een
fled
glin
g m
ean
wei
ght (
incl
udin
g d
ead
bir
ds)
and
mea
n w
eigh
t of d
ead
ban
d r
ecov
erie
s, *
*und
erw
eigh
t you
ng d
ied
sho
rtly
aft
er
leav
ing
the
colo
ny);
36pr
esen
t st
udy;
37N
isbe
t an
d D
rury
197
2; 38
Pars
ons
et a
l. 19
76; 39
Spea
r an
d N
ur 1
994
(*to
tal n
umbe
r ha
tchi
ng);
40C
ouls
on a
nd P
orte
r 19
85; 41
Cam
et
al. 2
003;
42B
raas
ch
et a
l. 20
09; 43
Scha
urot
h an
d B
ecke
r 20
08; 44
Fear
e 20
02 (
*lon
g-te
rm s
urvi
val)
; 45St
iene
n an
d B
renn
inkm
eije
r 20
02; 46
Kee
dw
ell 2
003
(*ye
ars
pool
ed d
ue to
sm
all s
ampl
e si
zes)
; 47H
edgr
en 1
981;
48
Har
ris
et a
l. 19
92 (*
all a
naly
ses
wer
e re
peat
ed in
bir
ds
know
n to
be
aliv
e at
2 y
ears
, and
res
ults
did
not
cha
nge)
; 49H
arri
s et
al.
2007
; 50H
ipfn
er 2
001
(*w
eigh
t at ~
15 d
ays
old
, **c
ompa
riso
n be
twee
n fir
st a
nd r
epla
cem
ent
broo
ds)
; 51L
loyd
197
9 (*
wei
ght
was
not
tes
ted
dir
ectl
y bu
t w
as in
ferr
ed f
rom
hat
chin
g d
ate’
s re
lati
onsh
ip w
ith
surv
ival
); 52
Gas
ton
1997
(*w
eigh
t at
1–4
day
s ol
d);
53H
arri
s an
d R
othe
ry 1
985;
54M
orri
son
et a
l. 20
09; 55
Cat
ry e
t al.
1998
; 56Ph
illip
s an
d F
urne
ss 1
998;
57K
erst
en a
nd B
renn
inkm
eije
r 19
95; 58
Leg
ge 2
002;
59R
oble
s et
al.
2007
; 60To
dd
et a
l. 20
03;
61D
avie
s an
d R
esta
ni 2
006;
62Sa
svár
i and
Heg
yi 2
010
(*nu
mbe
r of
clu
tche
s th
at p
rod
uced
at l
east
one
fled
glin
g; r
etur
ning
num
ber
is in
div
idua
ls);
63N
ewto
n an
d M
oss
1986
(*m
ales
in a
ll-m
ale
broo
ds
and
fem
ale
in a
ll-fe
mal
e br
ood
s su
rviv
ed b
ette
r th
an o
ther
s of
the
ir s
ex in
tw
o-se
x br
ood
s); 64
Wie
ns e
t al
. 200
6 (*
fem
ales
wit
h lo
w m
ass
wer
e le
ss li
kely
to
surv
ive
than
mal
es w
ith
low
mas
s), 65
Gra
nde
et a
l. 20
09; 66
McF
adze
n an
d M
arzl
uff 1
996;
67D
olan
et a
l. 20
09 (*
only
mal
es in
the
anal
ysis
, **o
nly
fem
ales
in th
e an
alys
is);
68Ta
rwat
er e
t al.
2011
; 69G
reen
and
Coc
kbur
n 20
01 (
*att
ribu
ted
to
fem
ale-
bias
ed d
ispe
rsal
); 70
Styr
sky
et a
l. 20
05; 71
Perr
ins
1965
(*s
ampl
e si
zes
wer
e no
t gi
ven,
but
wer
e ≥1
0,00
0), 72
Dho
ndt
1979
(*e
xam
ined
mal
e su
rviv
al o
nly,
ow
ing
to
fem
ale-
bias
ed d
ispe
rsal
); 73
Gar
nett
198
1; 74
Smit
h et
al.
1989
; 75Ti
nber
gen
and
Boe
rlijs
t 199
0 (*
attr
ibut
ed to
fem
ale-
bias
ed d
ispe
rsal
); 76
Lin
dén
et a
l. 19
92; 77
Ver
huls
t and
Tin
berg
en 1
991,
Ver
huls
t et
al.
1995
; 78V
erbo
ven
and
Vis
ser
1998
(*a
ttri
bute
d t
o fe
mal
e-bi
ased
rec
aptu
re p
roba
bilit
y at
nes
t bo
xes)
; 79B
oth
et a
l. 19
99 (
*sam
ple
size
s no
t gi
ven,
but
wer
e ≥2
,800
), 80
Mon
rós
et a
l. 20
02
(*ea
rly,
inte
rmed
iate
, or
late
hat
chin
g in
div
idua
ls w
ere
favo
red
in d
iffe
rent
yea
rs);
81G
reño
et
al. 2
008;
82N
orte
et
al. 2
008;
83va
n N
oord
wijk
et
al. 1
988;
84N
aef-
Dae
nzer
et
al. 2
001;
85D
ietr
ich
et a
l. 20
03; 86
Nur
198
4; 87
Sven
sson
199
7 (*
2,27
2 ba
nded
fled
glin
gs, b
ut s
ampl
e si
zes
vari
ed b
etw
een
anal
yses
); 88
Råb
erg
et a
l. 20
05; 89
Mac
Col
l and
Hat
chw
ell 2
003
(*at
trib
uted
to fe
mal
e-bi
ased
d
ispe
rsal
); 90
Chr
iste
et a
l. 20
01 (*
com
pari
son
betw
een
firs
t and
sec
ond
bro
ods)
; 91Ta
rof e
t al.
2011
; 92G
rüeb
ler
and
Nae
f-D
aenz
er 2
010;
93G
rüeb
ler
and
Nae
f-D
aenz
er 2
008;
94D
e St
even
198
0 (*
all
anal
yses
use
d m
ean
broo
d v
alue
s); 95
Shut
ler
et a
l. 20
06; 96
Bro
wn
and
Bro
wn
1999
(*no
nfum
igat
ed n
ests
; **r
esul
t was
var
iabl
e, b
ut o
vera
ll ea
rlie
r ha
tchi
ng d
ate
had
hig
her
surv
ival
than
late
(con
tinu
ed)
Ta
bl
e 1
. C
onti
nued
.
10 ORNITHOLOGICAL MONOGRAPHS NO. 78
hatc
h); 97
Cov
as e
t al.
2002
(*st
abili
zing
sel
ecti
on o
n w
eigh
t); 98
Low
and
Pär
t 200
9; 99
Med
eiro
s an
d F
reed
200
9; 10
0 Mid
dle
ton
and
Gre
en 2
008;
101 G
usta
fsso
n an
d S
uthe
rlan
d 1
988;
102 K
ruuk
et a
l. 20
02; 10
3 Pot
ti a
nd M
onta
lvo
1991
(*s
ex r
atio
was
ass
umed
to
be e
ven
at fl
edgi
ng b
ut w
as u
nkno
wn)
; 104 P
otti
et
al. 2
002;
105 L
obat
o et
al.
2005
; 106 M
oren
o et
al.
2005
; 107 A
lata
lo a
nd L
und
berg
19
86; 10
8 San
kam
etha
wee
et a
l. 20
09; 10
9 Vit
z an
d R
odew
ald
201
1; 11
0 Llo
yd e
t al.
2009
; 111 R
ings
by e
t al.
1998
; 112 S
chw
agm
eyer
and
Moc
k 20
08; 11
3 Cle
asby
et a
l. 20
10; 11
4 Ros
s an
d M
cLar
en 1
981;
11
5 Whe
elw
righ
t et a
l. 20
03; 11
6 Hoc
hach
ka a
nd S
mit
h 19
91; 11
7 Yac
kel A
dam
s et
al.
2006
(*qu
adra
tic
effe
ct, *
*ran
k w
ithi
n br
ood
was
onl
y im
port
ant d
urin
g d
roug
ht y
ear,
***y
ear
effe
ct =
dro
ught
se
veri
ty);
118 D
avie
s 19
86; 11
9 Sul
livan
198
9; 12
0 Sim
ons
and
Mar
tin
1990
; 121 S
ued
kam
p W
ells
et a
l. 20
07; 12
2 Ber
kele
y et
al.
2007
; 123 A
nder
s et
al.
1997
; 124 B
row
n an
d R
oth
2004
(*no
t all
band
ed n
est-
lings
wer
e m
easu
red
, so
this
num
ber
may
incl
ude
surv
ivor
s w
ith
no m
easu
re);
125 M
agra
th 1
991
(*ot
her
vari
able
s, s
uch
as th
e ef
fect
of b
rood
siz
e, y
ear,
etc.
on
surv
ival
wer
e on
ly e
xam
ined
in
the
2 w
eeks
aft
er fl
edgi
ng, n
ot u
ntil
retu
rn, s
o on
ly w
eigh
t is
show
n he
re);
126 S
now
195
8 (*
reex
amin
atio
n of
dat
a re
veal
ed s
igni
fican
t pos
itiv
e co
rrel
atio
n be
twee
n pr
obab
ility
of s
urvi
val a
nd
mas
s); 12
7 Mül
ler
et a
l. 20
05; 12
8 Ker
shne
r et
al.
2004
; 129 S
trom
borg
et a
l. 19
88; 13
0 Kre
men
tz e
t al.
1989
; 131 L
ópez
-Rul
l et a
l. 20
11 (*
all v
aria
bles
des
igna
ted
wit
h a
“?”
wer
e an
alyz
ed in
this
stu
dy,
bu
t im
plem
enta
tion
of
stat
isti
cal m
etho
d w
as in
corr
ect a
nd n
ot in
terp
reta
ble)
; 132 L
oman
197
7; 13
3 Ric
hner
199
2 (*
the
effe
ct o
f m
ass
on o
verw
inte
r su
rviv
al w
as n
ot te
sted
dir
ectl
y; fl
edgl
ings
of
foo
d-s
uppl
emen
ted
par
ents
wer
e he
avie
r, bu
t pro
babi
lity
of s
urvi
val w
as n
ot d
iffe
rent
bet
wee
n su
pple
men
ted
and
con
trol
pai
rs);
134 M
umm
e 19
92; 13
5 Pon
z M
iran
da
et a
l. 20
07; 13
6 Hus
by
and
Sla
gsvo
ld 1
992;
137 M
olin
a-M
oral
es e
t al.
2012
.
Ta
bl
e 1
. C
onti
nued
.
Instead, Garnett (1981) suggested that selection on juveniles targeted overall size (a correlate of weight) and that larger body size confers an advantage in physical competition for resources, the “size ad-vantage hypothesis.” Lack’s and Garnett’s hypoth-eses both predict positive correlations between weight, size, and juvenile survival, and data from most studies of passerines have been interpreted to show the high weight–high survival pattern (Table 1), with measurements generally taken at fledging (= nest-leaving, which is not necessarily the end of parental care), for logistical reasons. In this mono-graph, we review the literature with respect to re-ported relationships between fledging size–weight and survival, taking into account other predictors of survival, methodological considerations, and data quality. For now, we note that many studies do not separate the effects of weight and struc-tural size on juvenile survival (although this can be attempted with path analysis; see below), pre-venting a contrast of the two hypotheses. Most ex-amine the effects of weight and ignore structural size, or attempt to control the effect of body size on survival statistically to test the body-reserve advantage hypothesis (Table 1).
Body measurements around the time of nest-leaving provide the only predictors of juvenile survival in many studies of birds, and onerous hidden assumptions in such an analysis can eas-ily be overlooked. For example, young of many ducks and other precocial species leave the nest well before independence from their parents, at a small fraction of their eventual weight and size; the assumption that no meaningful variation in development occurs after that time is tenuous. Con-sider also seabirds, which have provided mixed results and often fail to show a positive correlation between weight at fledging and subsequent sur-vival (Table 1). The timing of any effect of weight on juvenile survival is the focus of some studies, but our interest is broader: Does weight at the end of parental care affect survival to adulthood, the most poorly understood part of the demographic time-line? Several factors might obscure such an effect if it did exist. The life history syndrome of many seabirds includes long adult life span, small brood size, and a lengthy nestling period (Weimerskirch 2002). In their variable and unpredictable marine environment, potentially long-lived seabirds are expected to evolve mechanisms to minimize per-sonal costs of reproduction and to shunt such costs to their offspring (Mauck and Grubb 1995). Selection on nestlings then favors plastic growth

PREDICTORS OF JUVENILE SURVIVAL IN BIRDS 11
survival when competing with siblings (Breitwisch 1989, Olsen and Cockburn 1991, Mulvihill et al. 1992, Anderson et al. 1993, Arroyo 2002, Hipkiss et al. 2002). These effects of sex-specific physical di-mension can reasonably be expected to extend into the juvenile period, but sex has not been available as a predictor in most studies to date.
Factors other than weight, size, and sex can in-fluence juvenile survival, including hatching date, hatching order, brood size, and nestling growth rate (Table 1). These factors are related to parental care and are correlated with each other. Lack (1954) proposed that birds rear young at the best time of year and that the positively skewed distribution of laying dates indicates that selection favors early breeding. Early breeding may allow offspring to fledge during periods of resource abundance, which may buffer them as they learn to forage for themselves. Young fledged earlier in the breeding season may also have more time to improve their foraging skills and acquire fat reserves prior to winter or migration than young fledged late in the breeding season. Many studies give general sup-port to the early breeding hypothesis (Table 1).
Hatching order has been found to influence, to varying degrees, nestling survival in passerines (e.g., Gibbons 1987, Magrath 1989, Forbes et al. 2002), seabirds (e.g., Drummond et al. 1986), rap-tors (Newton 1979), egrets (e.g., Fujioka 1985), grebes (Kloskowski 2003), and others (Mock and Parker 1997) because late-hatched chicks may not be able to obtain adequate nutrients as a result of competition (aggressive, in some cases) with larger, and perhaps more coordinated, older siblings. Con-stant bullying of younger siblings by older siblings can establish a dominance hierarchy within broods through trained winning and losing (Valderrábano-Ibarra et al. 2007), and stress from bullying can generate effects that carry over into adulthood (Müller et al. 2008, 2011; Grace et al. 2011). These effects of hatching order and subsequent sibling competition seem likely to influence survival from fledging to adulthood, although few studies have addressed this hypothesis and most of those that did found no relationship (Table 1).
Brood size is also thought to influence juve-nile survival, although causal relationships may be complex. High-quality parents may be able to produce and raise more offspring than low-quality parents (e.g., Lescroël et al. 2010); in this case, large brood size is associated with high survival. However, offspring from large broods have more competition for parental care than offspring from
and other responses to food shortage, so two birds at the end of parental care may have reached similar body weights via dramatically different nutritional and developmental histories. Body weight at that point may be convenient to measure as a one-time effort but may be a poor predictor of an individual’s physiological, behavioral, and cognitive capabili-ties that will influence its performance in the near future if different newly independent individuals have survived quite different degrees of stress dur-ing the period of dependence (Blount et al. 2003, Pravosudov et al. 2005, Pravosudov and Kitaysky 2006, Arnold et al. 2007a). For species that provide parental care after nest-leaving, a young bird’s status at nest-leaving may have little relevance for its survival after independence, as Stienen and Brenninkmeijer (2002) proposed for seabirds (and probably applies to other taxa with parental care after nest-leaving, particularly precocials). Finally, the contrast of seabirds and non-seabirds is, in part, one of single-chick broods with multi-chick broods, with attendant differences related to sibling competition that influence development, especially in cases when offspring are confined together in a “nursery” (Mock and Parker 1997). Whatever the reasons, body weight at fledging provides a poor indicator of postfledging performance in seabirds with postfledging care, and the gap in our under-standing of this aspect of bird life history partly motivated our study.
Body size and weight predict juvenile survival in many bird species, so sex-biased survival might be expected in species with sexual size dimorphism (= dimorphism in weight and/or nonweight size). Several species of mammals and birds have sex-biased survival of male and female offspring, especially during the period of parental care (Clutton-Brock 1991). In some cases, these species show no sexual size dimorphism (identifying sex per se, and not sexual size dimorphism specifically as a cause of survival), but sex-biased survival before adulthood is observed more frequently in sexually size-dimorphic species (Clutton-Brock 1991). The larger sex sometimes shows lower survival, due to starvation during or after the pe-riod of parental care, probably linked to its higher food requirements (Howe 1977, Cronmiller and Thompson 1981, Fiala and Congdon 1983, Røskaft and Slagsvold 1985, Slagsvold et al. 1986, Teather and Weatherhead 1989, Torres and Drummond 1997, Martín et al. 2007). In other species, the larger sex can convert its larger dimensions into a compet-itive advantage against nestmates and have higher
12 ORNITHOLOGICAL MONOGRAPHS NO. 78
smaller broods. Accordingly, studies that have investigated brood size and juvenile survival have had mixed results. Some studies have found a posi-tive and others a negative relationship between brood size and juvenile survival, even in different populations of the same species (Table 1).
Growth rate is expected to influence juvenile survival if fast growth indicates low stress during the developmental period. Offspring that do not receive adequate nutrition during development may be expected to have slower growth than con-sistently well-fed offspring of the same population (Gebhardt-Henrich and Richner 1998). To date, few studies of birds have investigated the hypothesis that growth rate from hatching to independence influences subsequent survival (Table 1).
Adults must accumulate enough resources to attain and maintain breeding condition (Perrins 1970), and high-performing parents may be expected to breed early; to have large brood sizes, characteristic brood sex ratios, and short nestling periods (i.e., fast growth); and to pro-duce large and/or heavy offspring, compared to low-performing parents. The correlation of these variables often impedes investigations regarding the relative importance of individual predictive factors on juvenile survival. As a consequence, many studies have examined only one or a few of these possible influences on juvenile survival (Table 1). Even fewer studies have included sex-specific survival analysis, reflecting logistical (e.g., variable dispersal, long period between independence and recruitment) and technical challenges (e.g., sex determination, inability to collect large sample sizes, correlated indepen-dent variables). Variable natal dispersal distance (movement from the natal site to a different one for first breeding) complicates the estimation of juvenile survival in many species, and sex-biased dispersal (Greenwood 1980) can bias survival estimates. Juvenile survival will be underesti-mated unless natal philopatry is high or dispersal areas are identified and monitored.
Dealing with collinearity among predictors.—Many, and perhaps most, predictors of interest for juvenile survival will be correlated; avoiding misleading re-sults due to collinearity among predictors is a main focus of this monograph. If correlated predictors are used in a typical generalized-linear-modeling ap-proach (e.g., capture–mark–recapture [CMR]), the standard errors of the regression coefficients can be inflated, leading to correlated errors in the regres-sion coefficients themselves, obscuring the relative importance of the predictors (Licht 1995, Graham
2003, Gimenez et al. 2009). Many studies avoid this problem by using a stepwise method, but the step-wise technique often does not select the best set of predictors and can generate idiosyncratic results (Licht 1995, Lukacs et al. 2010). Other studies have avoided collinearity problems by examining only a few predictors (Table 1), using separate regres-sion analyses, which can reduce the power of the analysis, or combining related predictors using principal component analysis, even though the re-sulting principal components might not be those most related with the outcome variable (weight, in this case; Gimenez et al. 2009). None of these tech-niques can assess the relative importance of several correlated predictor variables.
Path analysis, a type of structural equations modeling that does not include latent variables, allows simultaneous examination of correlated predictor variables. Path analysis not only mini-mizes the confounding effect of collinearity, but actually exploits correlations between predictors to infer both direct and indirect relationships. It can accommodate both ordinal and dichotomous variables (Byrne 2009, Garson 2012). Below, we enumerate other advantages of path analysis and use an extensive data set to compare the perfor-mance of path analysis against that of some other statistical approaches and show empirically that path analysis was the best choice.
What do we know about juvenile survival in birds from the best studies?—Reviewing the studies of pre-dictors of postfledging survival completed thus far (Table 1) presents some problems in interpretation, for several reasons. The period over which survival was monitored varied widely, including fledging (defined as nest-leaving in most studies) to inde-pendence, to dispersal, to migration, and to first winter (Table 1). Studies over these intervals provide important information on postfledging survival but cover only part of the life span between indepen-dence from parents and the start of breeding. Many studies that follow individual fledglings to adult-hood covered only local survival (e.g., Hochachka and Smith 1991, MacColl and Hatchwell 2003), so dispersal cannot be distinguished from cases of mortality. While this is valuable information for studies of local population dynamics, it should not be equated with juvenile survival. Some stud-ies have justified using local survival as a proxy for survival to breeding age when natal dispersal within the study area was not related to the pa-rameters measured (e.g., Lindén et al. 1992); how-ever, predictors of juvenile survival could covary with dispersal distance, so excluding results from
PREDICTORS OF JUVENILE SURVIVAL IN BIRDS 13
long-distance dispersers could bias survival esti-mates. Some studies used several univariate tests (e.g., Weimerskirch et al. 2000) to estimate a pa-rameter’s influence on survival, which (1) reduces the power of the test compared with a multivariate test, (2) does not determine the relative importance of each variable on juvenile survival, and (3) risks Type 1 error unless corrected for multiple com-parisons. Juvenile survival, particularly for long-lived species with delayed maturation, is rarely estimated robustly, considering unobservable states and detection rates. Limitations such as these may obscure important signal that might be more appar-ent when considering only the highest-quality stud-ies in the group.
Very few studies controlled offspring sex in their analyses (Table 1), in most cases because of understandable difficulties in detecting offspring sex before convenient molecular methods became available. Sex differences introduce fundamental heterogeneities into biological data sets, and when the sexes are pooled the investigator faces the potential for noise or biased results. For example, if the heavier of the sexes has higher juvenile survival resulting from its habitat preference, behavior, or another factor, but fledging weight itself is unrelated to survival, then weight may appear erroneously to be an informative predictor of survival. Sexual weight dimorphism is common in birds (Székely et al. 2007), including the subjects of some of the most influential studies in Table 1, such as Great Tits (males 6% heavier at fledging than females; Both et al. 1999). Of course, weight is only one potential axis of variation distinguishing the sexes.
To address these issues of quality control, we identified studies in Table 1 that met a set of stringent criteria, to determine whether this sub-set suggests a different general conclusion than consideration of all studies, regardless of quality. The criteria are as follows. (1) Offspring charac-ters of individual offspring (not pooled by brood or other group) were used as predictor variables. (2) Morphological measures of individual off-spring were measured near the end of parental care or when growth was approximately complete (often around the time of nest-leaving in altricial species). (3) Individual fledglings were followed from independence or just before independence to breeding age (survival to some point in the juvenile period does not meet this criterion). (4) There was high natal philopatry or, alternatively, dispersal areas were included in the analysis. (5) Offspring sex was known and included in the analysis. (6) Sample size was sufficient for the
analysis attempted (for example, logistic regres-sion requires that the smaller of the classes of the dependent variable have ≥10 cases per parameter in the model; Peduzzi et al. 1996). (7) No highly correlated predictors were used in the same model (Graham 2003) unless the model was designed to accommodate them. (8) If multiple statistical tests were performed, the critical values were adjusted for multiple comparisons. (9) Known surviv-ing birds were not considered nonsurvivors (this problem arises, for example, when “surviving” birds are limited to dead band recoveries after the juvenile period, culls, or a subset of the liv-ing banded population). (10) More than 1 year of data was used in the analysis, because differences in the quality of the year might alter the relative importance of some variables on survival. And (11) the study was done under approximately nat-ural conditions (e.g., supplemental food was not supplied).
We reduced Table 1 to only those studies that meet these criteria (for explanation of decisions to include or exclude particular studies, see Table S1 in the online supplemental material; see Acknowl-edgments), summarizing them by order (Table 2), longevity (annual adult survival probability; Table 3), and developmental mode (Table 4) to assess possible patterns in the results. Eleven studies including 10 species satisfied our criteria. These 11 studies provide a somewhat different picture of juvenile survival than those in the unfiltered collection. In the high-quality subset, weight is a predictor of juvenile survival in nine cases, and not associated with survival in only one (Table 2B), but in the unfiltered collection the respective totals are 40 and 34 (Table 2A). In both summaries, the body-reserve advantage hypothesis receives strong support from the studies in which a weight effect was detected (weight and juvenile survival were positively correlated), but only the high-quality subset suggests that this pattern is general in birds (only one study found no association). Both data sets suggest that large size and early breeding sometimes, but not nearly always, promotes ju-venile survival, and that cohort and sex effects are often important but are not ubiquitous. The high-quality subset has too few results for effects of size, clutch–brood size, hatching order–brood rank, and growth rate to make any inference. In fact, the sample size of 11 across all major clades highlights the need for many more studies that avoid the pitfalls that distinguish the unfiltered and filtered summaries. We especially need studies outside the Passeriformes (Table 2B); even the support for the

14 ORNITHOLOGICAL MONOGRAPHS NO. 78T
ab
le 2
. Ta
xono
mic
sum
mar
y fo
r st
udie
s on
the
rela
tion
ship
bet
wee
n po
stfl
edgi
ng s
urvi
val a
nd s
ever
al v
aria
bles
. (A
) Sum
mar
y of
all
stud
ies
in T
able
1. (
B) S
umm
ary
of th
ose
that
met
the
11 c
rite
ria
outl
ined
in th
e te
xt. K
ey: “
+”
= p
osit
ive
rela
tion
ship
, exc
ept i
n th
e ca
se o
f yea
r an
d s
ex, w
here
“+
” in
dic
ates
that
a r
elat
ions
hip
was
fo
und
; “–”
= n
egat
ive
rela
tion
ship
; “0”
= n
o re
lati
onsh
ip; a
nd “
U”
= p
aram
eter
not
exa
min
ed, r
esul
ts o
f mul
tipl
e st
udie
s in
conc
lusi
ve, o
r no
t app
licab
le to
the
spe-
cies
in q
uest
ion
(e.g
., cl
utch
siz
e in
Pro
cella
rifo
rmes
). Ta
xono
my
follo
ws
Eri
cson
et a
l. (2
006)
, Hac
kett
et a
l. (2
008)
, and
Che
sser
et a
l. 20
10.
A.
Sp
ecie
sW
eigh
tSi
zeTi
min
gC
lutc
h–
broo
d s
ize
Hat
chin
g or
der
– br
ood
ran
kG
row
th
rate
Coh
ort
Sex
Ord
er(n
)+
–0
U+
–0
U+
–0
U+
–0
U+
–0
U+
–0
U+
0U
+0
U
Gal
lifor
mes
1
1
1
1
1
1
1
1
1
Ans
erif
orm
es10
44
21
9
61
32
17
10
10
52
3
37
Col
umbi
form
es2
1
1
2
2
2
2
11
1
1
11
Cuc
ulif
orm
es1
1
1
1
1
1
1
1
1
Gru
ifor
mes
31
11
12
1
2
12
3
3
21
11
1
Wat
er
Bir
d
Cla
de
Proc
ella
rifo
rmes
43
11
1
22
1
31
4
4
2
41
3
4Sp
heni
scif
orm
es4
11
2
4
22
13
1
3
42
21
3C
icon
iifor
mes
1
1
1
1
1
1
1
1
1
Pele
cani
form
es1
1
1
1
1
1
11
1Su
lifor
mes
32
11
2
3
12
3
12
11
11
2C
hara
dri
ifor
mes
164
75
21
131
65
42
113
2
142
311
511
1
15
Lan
d
Bir
d
Cla
de
Cor
aciif
orm
es2
2
1
1
11
2
2
2
2
2
St
rigi
form
es2
2
2
1
1
11
2
2
2
11
Acc
ipit
rifo
rmes
31
2
3
1
2
21
3
1
2
21
11
1Fa
lcon
ifor
mes
1
1
1
1
1
1
1
1
1
Pass
erif
orm
es41
211
147
810
242
1313
153
515
19
22
38
537
1312
175
828
Tota
l95
402
3422
140
1469
333
2636
97
2159
04
488
30
1283
3119
4610
1966
B.
Sp
ecie
sW
eigh
tSi
zeTi
min
gC
lutc
h–
broo
d s
ize
Hat
chin
g or
der
–br
ood
ran
kG
row
th
rate
Coh
ort
Sex
Ord
er (n
)+
–0
U+
–0
U+
–0
U+
–0
U+
–0
U+
–0
U+
0U
+0
U
Ans
erif
orm
es1
1
11
1
11
1
1G
ruif
orm
es1
1
11
1
11
1
1
Wat
er B
ird
C
lad
eSp
heni
scif
orm
es1
1
11
11
11
1
Su
lifor
mes
11
1
1
1
11
1
1
C
hara
dri
ifor
mes
11
1
1
11
11
1
L
and
B
ird
Cla
de
Acc
ipit
rifo
rmes
11
1
11
11
1
1
Pass
erif
orm
es4
4
43
1
13
44
12
12
2
Tota
l10
90
10
10
09
05
23
00
28
00
010
10
09
54
15
41
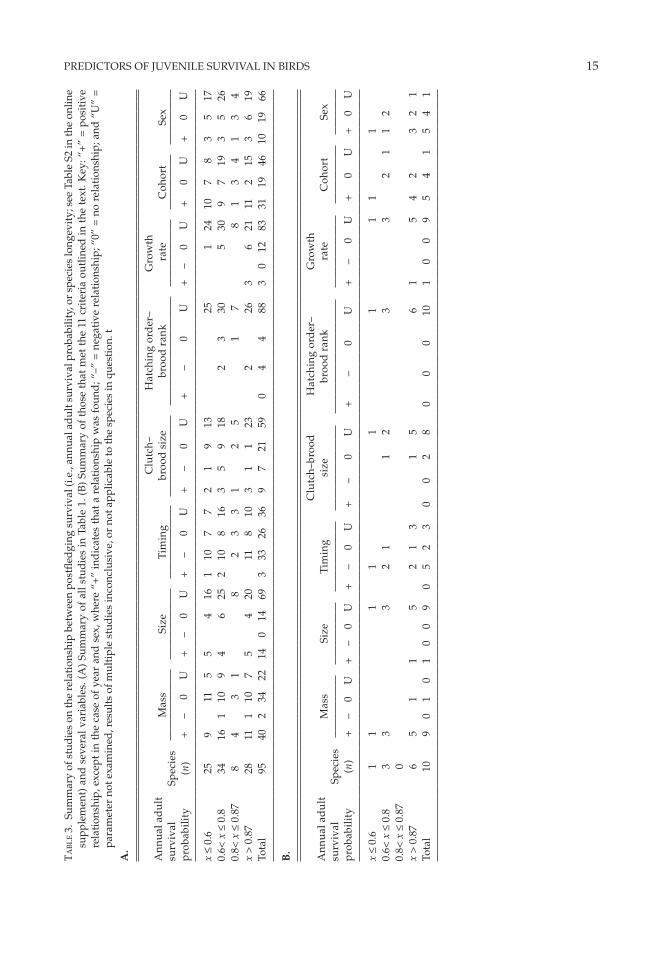
PREDICTORS OF JUVENILE SURVIVAL IN BIRDS 15T
ab
le 3
. Su
mm
ary
of s
tud
ies
on th
e re
lati
onsh
ip b
etw
een
post
fled
ging
sur
viva
l (i.e
., an
nual
ad
ult s
urvi
val p
roba
bilit
y, o
r sp
ecie
s lo
ngev
ity;
see
Tab
le S
2 in
the
onlin
e su
pple
men
t) a
nd s
ever
al v
aria
bles
. (A
) Su
mm
ary
of a
ll st
udie
s in
Tab
le 1
. (B
) Su
mm
ary
of t
hose
tha
t m
et t
he 1
1 cr
iter
ia o
utlin
ed in
the
tex
t. K
ey: “
+”
= p
osit
ive
rela
tion
ship
, exc
ept
in t
he c
ase
of y
ear
and
sex
, whe
re “
+”
ind
icat
es t
hat
a re
lati
onsh
ip w
as f
ound
; “–”
= n
egat
ive
rela
tion
ship
; “0”
= n
o re
lati
onsh
ip; a
nd “
U”
=
para
met
er n
ot e
xam
ined
, res
ults
of m
ulti
ple
stud
ies
inco
nclu
sive
, or
not a
pplic
able
to th
e sp
ecie
s in
que
stio
n. t
A.
Ann
ual
ad
ult
su
rviv
al
pro
babi
lity
Sp
ecie
s (n
)
Mas
sSi
zeTi
min
gC
lutc
h–
broo
d s
ize
Hat
chin
g or
der
– br
ood
ran
kG
row
th
rat
eC
ohor
tSe
x
+
–
0
U
+
– 0
U
+
–
0
U
+
–
0
U
+
–
0
U
+
–
0
U
+
0
U
+
0
U
x ≤
0.6
259
115
54
161
107
72
19
1325
124
107
83
517
0.6<
x ≤
0.8
3416
110
94
625
210
816
35
918
23
305
309
719
35
260.
8< x
≤ 0
.87
84
31
82
33
12
51
78
13
41
34
x >
0.8
728
111
107
54
2011
810
31
123
226
36
2111
215
36
19To
tal
9540
234
2214
014
693
3326
369
721
590
44
883
012
8331
1946
1019
66
B.
Ann
ual
ad
ult
su
rviv
al
pro
babi
lity
Sp
ecie
s (n
)
Mas
sSi
zeTi
min
gC
lutc
h–br
ood
si
zeH
atch
ing
ord
er–
broo
d r
ank
Gro
wth
ra
teC
ohor
tSe
x
+
–
0 U
+
–
0 U
+
–
0
U
+
–
0
U
+
–
0
U
+
–
0
U
+
0
U
+
0 U
x ≤
0.6
11
1
1
11
11
1
0.
6< x
≤ 0
.83
3
32
1
12
33
21
12
0.
8< x
≤ 0
.87
0
x
> 0
.87
65
1
15
21
31
56
15
42
3
21
Tota
l10
90
10
10
09
05
23
00
28
00
010
10
09
54
15
41

16 ORNITHOLOGICAL MONOGRAPHS NO. 78T
ab
le 4
. Su
mm
ary
of s
tud
ies
on th
e re
lati
onsh
ip b
etw
een
post
fled
ging
sur
viva
l and
sev
eral
var
iabl
es b
y d
evel
opm
enta
l mod
e (s
ee T
able
S2
in o
nlin
e su
pple
men
t). (
A)
Sum
mar
y of
all
stud
ies
in T
able
1. (
B) S
umm
ary
of th
ose
that
met
the
11 c
rite
ria
outl
ined
in th
e te
xt. K
ey: “
+”
= p
osit
ive
rela
tion
ship
, exc
ept i
n th
e ca
se o
f yea
r an
d
sex,
whe
re “
+”
ind
icat
es th
at a
rel
atio
nshi
p w
as fo
und
; “–”
= n
egat
ive
rela
tion
ship
; “0”
= n
o re
lati
onsh
ip; a
nd “
U”
= p
aram
eter
not
exa
min
ed, r
esul
ts o
f mul
tipl
e st
udie
s in
conc
lusi
ve, o
r no
t app
licab
le to
the
spec
ies
in q
uest
ion.
A.
Dev
elop
men
tal
mod
e
Spec
ies
(n)
Mas
sSi
zeTi
min
gC
lutc
h–br
ood
si
ze
Hat
chin
g or
der
–bro
od
rank
Gro
wth
ra
teC
ohor
tSe
x
+–
0U
+–
0U
+–
0U
+–
0U
+–
0U
+–
0U
+0
U+
0U
Prec
ocia
l 15
67
21
113
17
25
22
1115
114
62
71
410
Sem
i-pr
ecoc
ial
237
18
83
219
97
83
119
22
202
418
914
11
21A
ltri
cial
5727
119
1210
1137
217
1723
46
1929
22
1
7
1617
258
1435
Tota
l95
402
3422
140
1469
333
2636
97
2159
04
435
30
1232
3119
4610
1966
B.
Dev
elop
men
tal
mod
eSp
ecie
s (n
)
Mas
sSi
zeTi
min
gC
lutc
h–br
ood
si
ze
Hat
chin
g or
der
– br
ood
ran
kG
row
th
rat
eC
ohor
tSe
x
+–
0U
+–
0U
+–
0U
+–
0U
+–
0U
+–
0U
+0
U+
0U
Prec
ocia
l 2
2
21
11
12
22
1
1Se
mi-
prec
ocia
l2
2
21
12
22
2
11
A
ltri
cial
65
1
15
41
11
56
15
14
13
3
Tota
l10
90
10
10
09
05
23
00
28
00
010
10
09
54
15
41
PREDICTORS OF JUVENILE SURVIVAL IN BIRDS 17
body-reserve advantage hypothesis from Table 2B is effectively a passeriform result.
Summaries arranged by life span (Table 3) sug-gest similar observations. The longest-lived species appear to exhibit a stronger cohort effect than shorter-lived species in the unfiltered summary (Table 3A), as would be predicted by life-history considerations of parents observing a ceiling on reproductive effort (Goodman 1974, Mauck and Grubb 1995). During poor breeding conditions, poor-quality offspring would be produced by members of long-lived species, and these offspring would have poor juvenile survival, leading to a cohort effect. This effect is absent in the high-quality subset (Table 3B), but we suggest that we cannot evaluate this life-history prediction with confidence given the meager high-quality data and the problems of interpretation inherent in the unfiltered data set. Table 3A provokes some interest in a weaker sex effect among the longest-lived spe-cies than among others, but too few high-quality studies exist to conclude anything.
The opportunity for parents to influence the ju-venile survival of their offspring may be higher for species with more altricial development than more precocial development, if the reproductive effort per offspring increases as altriciality increases. Shortfalls in parental effort might be manifested more in poor juvenile survival in more altricial taxa as a result. Alternatively, altricial parents may be better able to buffer poor rearing conditions via their more extended parental effort. The unfil-tered data set provides little support for either of these ideas, with the exception of the cohort effect (Table 4A). Among the unfiltered studies, altri-cials appear to exhibit a weaker cohort effect than semi-precocials and precocials. The high-quality subset (Table 4B) is too sparse to draw a conclusion regarding the cohort effect (or any other effect). We have a palette of important questions to answer regarding juvenile survival in birds, but few easily interpretable results to answer those questions.
Juvenile survival in Nazca Boobies.—We addressed these issues in a study of sex-specific juvenile sur-vival in a seabird, the Nazca Booby (Sula granti). This species exhibits high natal philopatry (essen-tially 100%; Huyvaert and Anderson 2004), long life span (Anderson and Apanius 2003), and high encounter probabilities of adults in our annual band-resight surveys, removing a common source of bias in survival estimates of other species. Our earlier CMR model (Maness and Anderson 2007) of annual adult survival gave high average resight
probabilities for breeding males (0.994), breed-ing females (0.993), nonbreeding males (0.918), and nonbreeding females (0.896). Consider the logistically challenging life history of a female that appears in the colony as an adult at the typi-cal age (4 years, see below) and dies young (age 8) without breeding: the probability that she will never be seen as an adult, and considered to have died during the juvenile period, is only (1 – 0.896)4 = 0.0001. Sibling competition in multi-chick broods is an uncontrolled effect on development in many studies of the effects of parental care on juvenile survival. Nazca Boobies raise only a single offspring per annual breeding season (Humphries et al. 2006) from a clutch of one or two eggs (Anderson 1990). If two eggs hatch, only one nest-ling (usually the product of the first egg) survives siblicidal interactions that typically cause brood reduction before the nestling’s fifth day (Anderson 1989, Humphries et al. 2006), so sibling competition is ephemeral (usually <3% of the 158-day average period of offspring dependence; Humphries et al. 2006, Maness et al. 2011). As a consequence, brood size does not affect the duration of nestling devel-opment or morphological measures around the time of fledging (Humphries et al. 2006; however, behavioral effects in adulthood have been sug-gested; Müller et al. 2011), and sibling competition should not obscure other influences on survival.
Considering all 3,435 sexed fledglings with morphological measures taken at the 1% down stage (see below) in our study, females were the larger and heavier sex when they attained juvenal plumage (culmen length: females, mean ± SD = 103.9 ± 2.7 mm; males, 100.9 ± 2.6 mm; weight: females, 1,877 ± 260 g; males, 1,699 ± 225 g; n = 1,594 females and 1,841 males; T. J. Maness and D. J. Anderson unpubl. data). This size differ-ence of 10.5% is similar to that in a separate study (11.1%), whereas the parents of those fledglings differed by 13.0%, with absolute weights vary-ing according to a number of factors (for details, see Apanius et al. 2008). Several lines of evidence indicate that parents satisfy the food demand of daughters less often than that of sons (Anderson et al. 1993, Townsend et al. 2007, Apanius et al. 2008). Consistent with this result, Maness et al. (2007) used data from two cohorts to conclude that male Nazca Boobies survive the period between fledging and appearing in the colony as an adult (Fig. 1) at a higher rate than females, contributing to the development of a consistently male-biased adult sex ratio (Townsend and Anderson 2007a).

18 ORNITHOLOGICAL MONOGRAPHS NO. 78
Females should be expected to survive better than males under both the body-reserve advantage and the size advantage hypotheses, but they do not. Nonetheless, the weight or size advantage might still operate within sex if the sex difference in sur-vival is unrelated to size or weight differences. Here, we evaluate the high weight–high survival prediction within and between sexes, as well as the relationship of juvenile survival to several other indicators of the nestling experience: size in-dependent of weight, age at which the nestling at-tained juvenal plumage, hatching date, and clutch size (which appears to reflect general parental abil-ity; Clifford and Anderson 2001b, Townsend and Anderson 2007b). Temporally variable conditions are likely to influence juvenile survival, so we also examined the effect of cohort on juvenile survival.
We followed the fates of 2,631 Nazca Boobies from seven cohorts, sexed by molecular means and providing extensive data on their nestling experience, making this the largest study of sex-specific juvenile survival to date for any bird. To determine the sex ratios at fledging and upon reaching adulthood, we sexed 5,196 nestlings from the same seven cohorts and followed them to adulthood. This larger group of birds contained individuals from unmonitored nests (described below) and could not be included in the analysis of juvenile survival that included the monitored predictors described above. The large sample size permits the use of path analysis, not used in most previous studies (but see Blums et al. 2002).
sTudy siTe and MeThods
Terminology.—We construe the motivation of this area of research as an effort to explain variation in the survival probability of newly independent individuals, especially using aspects of life during the period of dependence on parents as predictors. After leaving the nest, young birds are difficult to monitor, and particularly to capture and measure, leading many investigators to use the last measure-ments available before permanent nest-leaving as proxies for those measurements at the end of parental care. Frequently this practice can be justi-fied, especially if parental care ends at nest-leaving. Parental care after nest-leaving might interact with, or override, the effect of condition at nest-leaving on survival after the end of parental care, so clear terminology regarding the timing of offspring measurement in relation to the timing of the end of parental care is helpful. Similarly, “fledging” can be used to indicate permanent nest-leaving, taking flight for the first time, or reaching the end of parental care, but these events may occur at different ages: precocial species may leave the nest permanently long before the first flight, and altricial species may leave the nest for the last time long after taking the first flight.
Throughout this monograph, we will use “fledging” to refer to taking flight for the first time, “fledgling” to refer to a dependent bird that can fly, and “juvenile” to refer to a bird no longer receiving parental care but not yet adult. By “nest-leaving,” we mean the final departure from the natal nest (ap-proximately coincident with becoming a juvenile in Nazca Boobies; Maness et al. 2011). The operational definition of the end of the juvenile period will be taxon specific and might involve attaining adult plumage or attending a breeding site. In our field study, we treat the period between the end of pa-rental care and the subsequent appearance in the breeding colony some years later (virtually always in adult plumage) as the “juvenile” period, and the probability of survival from the beginning of that period to the end as “juvenile survival.”
Our dependent variable is “survival to adult-hood” in two of our analyses (path analysis and logistic regression). By this we mean survival across the entire period from the end of paren-tal care until the bird appears as a functional adult, in adult plumage, in the breeding colony. We distinguish this from age-dependent survival during this period, which is not a dependent variable in our study. Survival to adulthood is a
Fig. 1. Age of first appearance in the breeding col-ony as adults for male and female Nazca Boobies from 16 cohorts (1984–1985 to 1987–1988, and 1992–1993 to 2003–2004). Brackets show 95% confidence intervals. Dashed line represents the age of the youngest cohort used in our analyses.
PREDICTORS OF JUVENILE SURVIVAL IN BIRDS 19
dichotomous variable: a bird either survived this period of variable length (Fig. 1) or did not. In a CMR analysis, we used a multistate model with recapture histories represented as three possible states in a given year: An unobservable juvenile state (J), an adult state (“A”), and “0” for a bird that could be observed but was not seen in the colony. We used the dichotomous outcome vari-able (survived to appear in the colony as adult or died) to test the prediction derived from the CMR model equation.
Field techniques.—Our group has conducted long-term demographic studies on a population of Nazca Boobies at Punta Cevallos, Isla Española, Galápagos Islands (1°23′S, 89°37′W), Ecuador, since 1984. The study site comprises three sub-colonies, detailed in Huyvaert and Anderson (2004) and Apanius et al. (2008). Breeding seasons include parts of two calendar years; most eggs are laid between October and January, and most young fledge by June of the following year. Begin-ning in the 1992–1993 breeding season, all nests in the study site with at least one banded parent were monitored daily (for details, see Apanius et al. 2008) from the date of clutch initiation until the nestling attained juvenal plumage or the repro-ductive attempt failed. Nests with two unbanded parents were “unmonitored,” except within a sub-section of subcolony 1 known as the “Study Area” (Apanius et al. 2008), in which all nests were moni-tored. Volant offspring in juvenal plumage leave the nest for increasingly longer periods each day, making difficult the determination of the actual date of permanent nest-leaving. Growth is virtu-ally complete in offspring when they attain juvenal plumage, although parental care continues beyond this point (Apanius et al. 2008, Maness et al. 2011), so we assessed a nestling’s weight and structural size at the end of parental care with data collected at the “1% down” developmental timepoint (when 99% of the nestling’s down has been replaced by pennaceous juvenal plumage). Nestlings reach the 1% down stage at a mean (± SD) age of 100.9 ± 8.8 days after hatching (Humphries et al. 2006), and take their first flight to the sea (indicated by the sudden absence of guano on their feet) approxi-mately 12.0 ± 5.4 days later (Maness et al. 2011). Offspring then leave the colony, on average, 45.3 ± 10.0 days after their first flight to the sea. During the 3 days before the offspring’s departure, par-ents do not attend the colony, which apparently triggers the offspring’s departure from it (Maness et al. 2011). Ages at first flight and at departure
from the colony are highly correlated with age at the 1% down stage (Humphries et al. 2006, Apa-nius et al. 2008), and little mortality occurs between the 1% down point and departure from the colony (Humphries et al. 2006, Maness et al. 2007, Maness et al. 2011). These circumstances justify the use of status (values of our predictor variables) at the 1% down stage as a proxy for status at permanent nest-leaving and the end of parental care. Nestlings at the 1% down stage have nearly fledged, so for con-venience we refer to them as “fledglings.” In most breeding seasons, we banded all fledglings from monitored and unmonitored nests. Fourteen birds that died between reaching the 1% down stage and taking their first flight to the sea were excluded from all analyses, because these birds did not reach independence.
Juveniles vacate the Punta Cevallos colony for several years, and band returns indicate that they live at sea off the Central American and Mexican Pacific coasts (Huyvaert and Anderson 2004). After attaining adult plumage, virtually all survivors return to Punta Cevallos and become permanent residents. The “age of first return” indicates the first sighting of a young adult in the colony in annual band-resight surveys (Huyvaert and Anderson 2004) or in nest monitoring of breeders (Huyvaert and Anderson 2004, Apanius et al. 2008). To iden-tify cohorts to include in our survival analysis, we determined the distribution of ages of first return for members of each cohort. To ensure essentially comprehensive coverage of surviving birds re-turning to the colony, the cohorts in the analysis all had at least 1 year pass (after peak return age) with ≤7 new individuals making first appearances during the year of our analysis. The four fledgling cohorts between 1984–1985 and 1987–1988 and the 12 cohorts between 1992–1993 and 2003–2004 (no young were banded from the 1988–1989 sea-son to the 1991–1992 season) satisfied this crite-rion (Table 5). Most (94.9%; Fig. 1) surviving birds first return to the breeding colony within 6 years of vacating it, and essentially all (99.97%; Fig. 1) return by age 12, so almost all surviving offspring from the 1998–1999 to 2004–2005 cohorts that will ever return as adults should have returned at the time of our analyses (2011), when the youngest subject birds were 6 years and the oldest birds were 12 years old. We did not conduct a band-resight survey in 1988–1989, and individuals from earlier cohorts that appeared for the first time that season would be attributed to older age classes; therefore, our estimates of age of first appearance here are
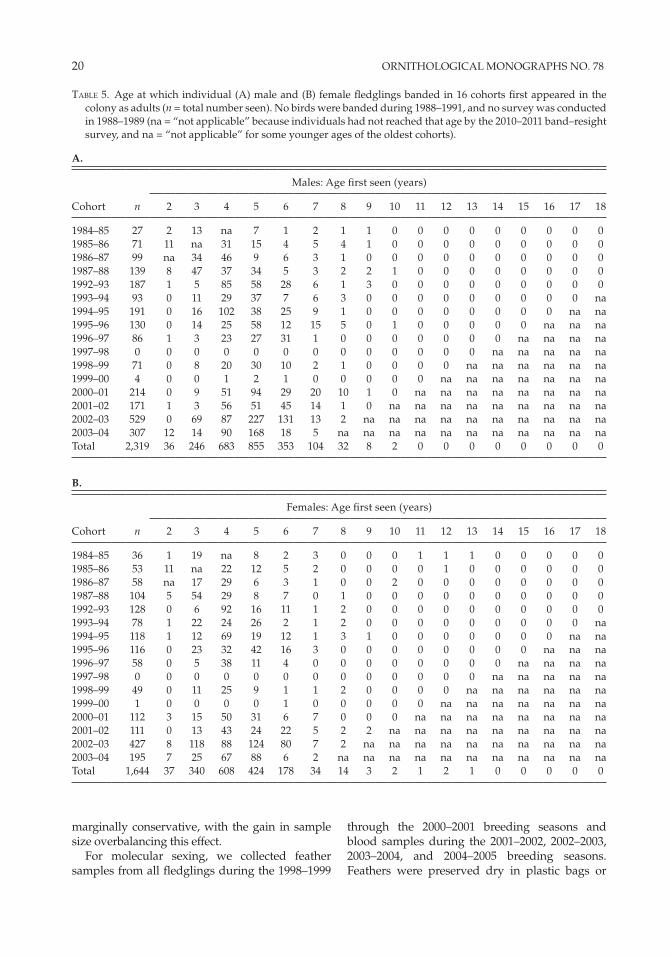
20 ORNITHOLOGICAL MONOGRAPHS NO. 78
Table 5. Age at which individual (A) male and (B) female fledglings banded in 16 cohorts first appeared in the colony as adults (n = total number seen). No birds were banded during 1988–1991, and no survey was conducted in 1988–1989 (na = “not applicable” because individuals had not reached that age by the 2010–2011 band–resight survey, and na = “not applicable” for some younger ages of the oldest cohorts).
A.
n
Males: Age first seen (years)
Cohort 2 3 4 5 6 7 8 9 10 11 12 13 14 15 16 17 18
1984–85 27 2 13 na 7 1 2 1 1 0 0 0 0 0 0 0 0 01985–86 71 11 na 31 15 4 5 4 1 0 0 0 0 0 0 0 0 01986–87 99 na 34 46 9 6 3 1 0 0 0 0 0 0 0 0 0 01987–88 139 8 47 37 34 5 3 2 2 1 0 0 0 0 0 0 0 01992–93 187 1 5 85 58 28 6 1 3 0 0 0 0 0 0 0 0 01993–94 93 0 11 29 37 7 6 3 0 0 0 0 0 0 0 0 0 na1994–95 191 0 16 102 38 25 9 1 0 0 0 0 0 0 0 0 na na1995–96 130 0 14 25 58 12 15 5 0 1 0 0 0 0 0 na na na1996–97 86 1 3 23 27 31 1 0 0 0 0 0 0 0 na na na na1997–98 0 0 0 0 0 0 0 0 0 0 0 0 0 na na na na na1998–99 71 0 8 20 30 10 2 1 0 0 0 0 na na na na na na1999–00 4 0 0 1 2 1 0 0 0 0 0 na na na na na na na2000–01 214 0 9 51 94 29 20 10 1 0 na na na na na na na na2001–02 171 1 3 56 51 45 14 1 0 na na na na na na na na na2002–03 529 0 69 87 227 131 13 2 na na na na na na na na na na2003–04 307 12 14 90 168 18 5 na na na na na na na na na na naTotal 2,319 36 246 683 855 353 104 32 8 2 0 0 0 0 0 0 0 0
B.
n
Females: Age first seen (years)
Cohort 2 3 4 5 6 7 8 9 10 11 12 13 14 15 16 17 18
1984–85 36 1 19 na 8 2 3 0 0 0 1 1 1 0 0 0 0 01985–86 53 11 na 22 12 5 2 0 0 0 0 1 0 0 0 0 0 01986–87 58 na 17 29 6 3 1 0 0 2 0 0 0 0 0 0 0 01987–88 104 5 54 29 8 7 0 1 0 0 0 0 0 0 0 0 0 01992–93 128 0 6 92 16 11 1 2 0 0 0 0 0 0 0 0 0 01993–94 78 1 22 24 26 2 1 2 0 0 0 0 0 0 0 0 0 na1994–95 118 1 12 69 19 12 1 3 1 0 0 0 0 0 0 0 na na1995–96 116 0 23 32 42 16 3 0 0 0 0 0 0 0 0 na na na1996–97 58 0 5 38 11 4 0 0 0 0 0 0 0 0 na na na na1997–98 0 0 0 0 0 0 0 0 0 0 0 0 0 na na na na na1998–99 49 0 11 25 9 1 1 2 0 0 0 0 na na na na na na1999–00 1 0 0 0 0 1 0 0 0 0 0 na na na na na na na2000–01 112 3 15 50 31 6 7 0 0 0 na na na na na na na na2001–02 111 0 13 43 24 22 5 2 2 na na na na na na na na na2002–03 427 8 118 88 124 80 7 2 na na na na na na na na na na2003–04 195 7 25 67 88 6 2 na na na na na na na na na na naTotal 1,644 37 340 608 424 178 34 14 3 2 1 2 1 0 0 0 0 0
marginally conservative, with the gain in sample size overbalancing this effect.
For molecular sexing, we collected feather samples from all fledglings during the 1998–1999
through the 2000–2001 breeding seasons and blood samples during the 2001–2002, 2002–2003, 2003–2004, and 2004–2005 breeding seasons. Feathers were preserved dry in plastic bags or
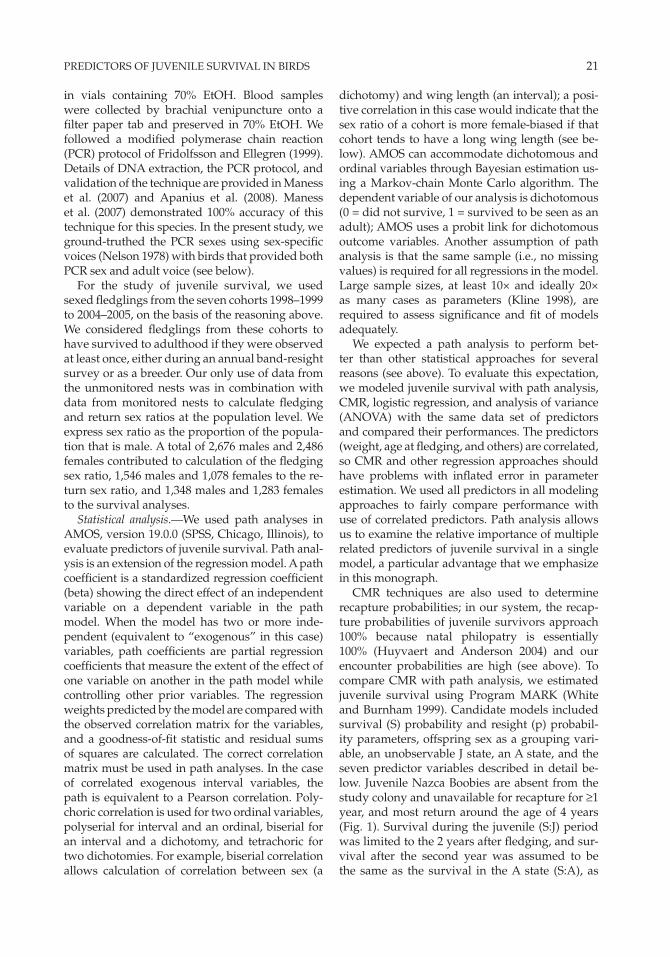
PREDICTORS OF JUVENILE SURVIVAL IN BIRDS 21
in vials containing 70% EtOH. Blood samples were collected by brachial venipuncture onto a filter paper tab and preserved in 70% EtOH. We followed a modified polymerase chain reaction (PCR) protocol of Fridolfsson and Ellegren (1999). Details of DNA extraction, the PCR protocol, and validation of the technique are provided in Maness et al. (2007) and Apanius et al. (2008). Maness et al. (2007) demonstrated 100% accuracy of this technique for this species. In the present study, we ground-truthed the PCR sexes using sex-specific voices (Nelson 1978) with birds that provided both PCR sex and adult voice (see below).
For the study of juvenile survival, we used sexed fledglings from the seven cohorts 1998–1999 to 2004–2005, on the basis of the reasoning above. We considered fledglings from these cohorts to have survived to adulthood if they were observed at least once, either during an annual band-resight survey or as a breeder. Our only use of data from the unmonitored nests was in combination with data from monitored nests to calculate fledging and return sex ratios at the population level. We express sex ratio as the proportion of the popula-tion that is male. A total of 2,676 males and 2,486 females contributed to calculation of the fledging sex ratio, 1,546 males and 1,078 females to the re-turn sex ratio, and 1,348 males and 1,283 females to the survival analyses.
Statistical analysis.—We used path analyses in AMOS, version 19.0.0 (SPSS, Chicago, Illinois), to evaluate predictors of juvenile survival. Path anal-ysis is an extension of the regression model. A path coefficient is a standardized regression coefficient (beta) showing the direct effect of an independent variable on a dependent variable in the path model. When the model has two or more inde-pendent (equivalent to “exogenous” in this case) variables, path coefficients are partial regression coefficients that measure the extent of the effect of one variable on another in the path model while controlling other prior variables. The regression weights predicted by the model are compared with the observed correlation matrix for the variables, and a goodness-of-fit statistic and residual sums of squares are calculated. The correct correlation matrix must be used in path analyses. In the case of correlated exogenous interval variables, the path is equivalent to a Pearson correlation. Poly-choric correlation is used for two ordinal variables, polyserial for interval and an ordinal, biserial for an interval and a dichotomy, and tetrachoric for two dichotomies. For example, biserial correlation allows calculation of correlation between sex (a
dichotomy) and wing length (an interval); a posi-tive correlation in this case would indicate that the sex ratio of a cohort is more female-biased if that cohort tends to have a long wing length (see be-low). AMOS can accommodate dichotomous and ordinal variables through Bayesian estimation us-ing a Markov-chain Monte Carlo algorithm. The dependent variable of our analysis is dichotomous (0 = did not survive, 1 = survived to be seen as an adult); AMOS uses a probit link for dichotomous outcome variables. Another assumption of path analysis is that the same sample (i.e., no missing values) is required for all regressions in the model. Large sample sizes, at least 10× and ideally 20× as many cases as parameters (Kline 1998), are required to assess significance and fit of models adequately.
We expected a path analysis to perform bet-ter than other statistical approaches for several reasons (see above). To evaluate this expectation, we modeled juvenile survival with path analysis, CMR, logistic regression, and analysis of variance (ANOVA) with the same data set of predictors and compared their performances. The predictors (weight, age at fledging, and others) are correlated, so CMR and other regression approaches should have problems with inflated error in parameter estimation. We used all predictors in all modeling approaches to fairly compare performance with use of correlated predictors. Path analysis allows us to examine the relative importance of multiple related predictors of juvenile survival in a single model, a particular advantage that we emphasize in this monograph.
CMR techniques are also used to determine recapture probabilities; in our system, the recap-ture probabilities of juvenile survivors approach 100% because natal philopatry is essentially 100% (Huyvaert and Anderson 2004) and our encounter probabilities are high (see above). To compare CMR with path analysis, we estimated juvenile survival using Program MARK (White and Burnham 1999). Candidate models included survival (S) probability and resight (p) probabil-ity parameters, offspring sex as a grouping vari-able, an unobservable J state, an A state, and the seven predictor variables described in detail be-low. Juvenile Nazca Boobies are absent from the study colony and unavailable for recapture for ≥1 year, and most return around the age of 4 years (Fig. 1). Survival during the juvenile (S:J) period was limited to the 2 years after fledging, and sur-vival after the second year was assumed to be the same as the survival in the A state (S:A), as

22 ORNITHOLOGICAL MONOGRAPHS NO. 78
has been assumed in other species with delayed maturity (e.g., Bailey et al. 2010). S:J could remain constant (.), or vary by year (t), offspring sex (sex), cohort (c), and by the predictors described below. S:A included a sex effect; resight probability of adults (p:A) included sex and age effects (de-termined by modeling age-specific survival of adults; T. J. Maness and D. J. Anderson unpubl. data). Transition probability between the J and A states (Psi:J-A) included sex and age effects (de-termined by modeling age-specific survival of adults; T. J. Maness and D. J. Anderson unpubl. data). We used Akaike’s information criterion (AIC) for model selection and ranking (Burnham and Anderson 2002). In practice, we used QAICc, a version of AIC incorporating adjustment of the variance inflation factor, based on an estimate of median ĉ (White 2002). Models with the low-est QAICc values were assumed to better explain variation in the data. The median ĉ procedure cannot be performed on a model with individual covariates, so we estimated median ĉ using a sim-plified input file that did not include covariates.
We also compared the outcome of our path analysis with logistic regression using nested, forward stepwise, and backward stepwise tech-niques. We predicted that the path analysis would perform better than these techniques because the correlation between predictors would impede the performance of a multifactorial logistic regres-sion and the separate-models technique would have low power. Path analysis uses a probit link function, and CMR and logistic regression use a logit link function, to predict which group (in our case, survivor or nonsurvivor) an individual should belong to, based on the associated model of dependent and predictor variables. We derived such predictions for each fledgling from each of the three modeling approaches and compared each bird’s predicted group with its actual postfledging survival or mortality. To compare the performance of the three modeling approaches, we used the percentage of birds classified correctly, a likelihood version of R2 (Anderson 2008), the complexity of the models, and the unconditional variance asso-ciated with parameter estimation (see equation in Anderson 2008:111) from each modeling approach.
Some researchers have used individual ANOVAs (t-tests) to assess predictors of juvenile survival (e.g., Weimerskirch et al. 2000). We cannot com-pare the performance of these tests with our other statistical approaches because the logi-cal direction of these tests is reversed, in that all other approaches attempt to predict which group
(survivor or nonsurvivor) a bird will fall into given its particular set of measurements, whereas the ANOVA approach categorizes birds in groups based on known survivor–nonsurvivor status, then ascertains whether differences exist in their measurements (reversing the direction of the test from prospective to retrospective). We rank indi-vidual tests using F ratios and P values because information-theory approaches cannot be used to rank ANOVAs when the outcome variables are different.
All statistical analyses, except the path analysis and CMR, were performed with SPSS unless we state otherwise.
Parameter conditioning.—We used the following predictors of juvenile survival, measured on the day that a nestling reached the 1% down stage (and so approximately “fledgling” status): weight (g), culmen length (mm), wing length (mm), age at fledging (days), hatching date (see below), clutch–brood effect (see below), cohort (encom-passing effect of breeding year), and sex. We also tested the quadratic of weight, culmen length, wing length, age at fledging, and hatching date to examine the possibility that these predictors are subject to stabilizing (or disruptive) selection (e.g., stabilizing selection on body size in Sociable Weav-ers; Covas et al. 2002). We examined saturated models initially, in which all predictor variables could correlate freely. We then reduced the models and used AICc (adjusted for small sample sizes) following Burnham and Anderson (2002) to select the best-performing model(s). We did not use tar-sus length as a predictor because it was difficult to measure consistently.
Hatching date (HD) was expressed in a 2-year Julian calendar format. Nazca Boobies breed sea-sonally at Punta Cevallos from October to June. Our calendar starts on 1 January of the year in which a given breeding season begins and extends to the end of that season in the following year. For example, one nestling in the 2000–2001 breed-ing season fledged on day 491 (5 May 2001) from an egg laid on day 334 (29 November 2000) and hatched on day 376 (10 January 2001). Laying date and HD expressed the same information (Pearson r = 0.97), so we used only HD in our analyses. HD was standardized (z-score) within breeding season to control between-season differences in mean and variance in HD.
We considered two proxies for environmental quality of a given breeding season: the number of breeding attempts and the number of young reach-ing the 1% down stage, both in an area in which
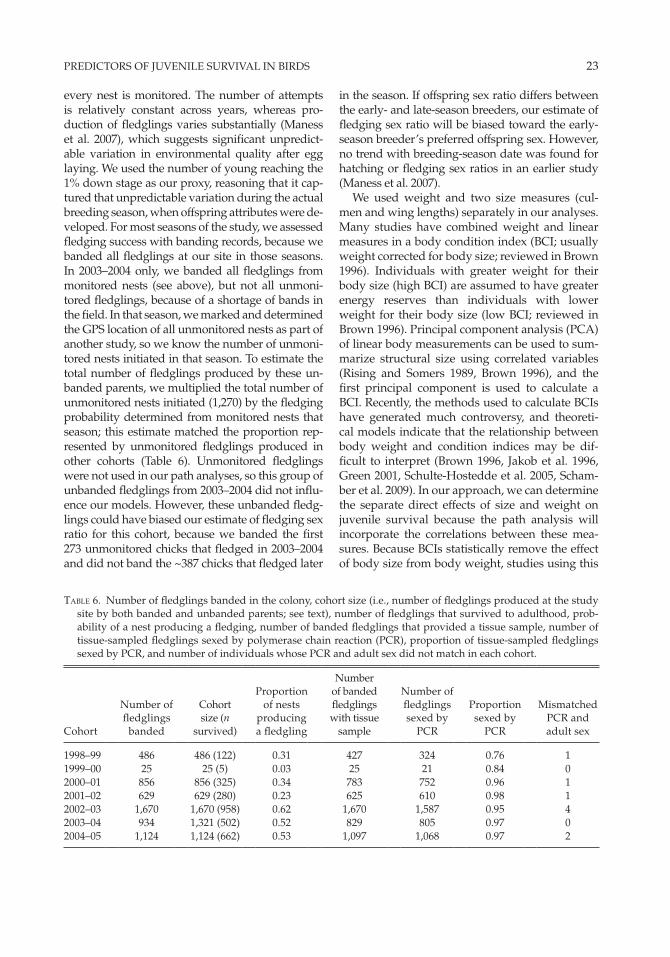
PREDICTORS OF JUVENILE SURVIVAL IN BIRDS 23
every nest is monitored. The number of attempts is relatively constant across years, whereas pro-duction of fledglings varies substantially (Maness et al. 2007), which suggests significant unpredict-able variation in environmental quality after egg laying. We used the number of young reaching the 1% down stage as our proxy, reasoning that it cap-tured that unpredictable variation during the actual breeding season, when offspring attributes were de-veloped. For most seasons of the study, we assessed fledging success with banding records, because we banded all fledglings at our site in those seasons. In 2003–2004 only, we banded all fledglings from monitored nests (see above), but not all unmoni-tored fledglings, because of a shortage of bands in the field. In that season, we marked and determined the GPS location of all unmonitored nests as part of another study, so we know the number of unmoni-tored nests initiated in that season. To estimate the total number of fledglings produced by these un-banded parents, we multiplied the total number of unmonitored nests initiated (1,270) by the fledging probability determined from monitored nests that season; this estimate matched the proportion rep-resented by unmonitored fledglings produced in other cohorts (Table 6). Unmonitored fledglings were not used in our path analyses, so this group of unbanded fledglings from 2003–2004 did not influ-ence our models. However, these unbanded fledg-lings could have biased our estimate of fledging sex ratio for this cohort, because we banded the first 273 unmonitored chicks that fledged in 2003–2004 and did not band the ~387 chicks that fledged later
in the season. If offspring sex ratio differs between the early- and late-season breeders, our estimate of fledging sex ratio will be biased toward the early-season breeder’s preferred offspring sex. However, no trend with breeding-season date was found for hatching or fledging sex ratios in an earlier study (Maness et al. 2007).
We used weight and two size measures (cul-men and wing lengths) separately in our analyses. Many studies have combined weight and linear measures in a body condition index (BCI; usually weight corrected for body size; reviewed in Brown 1996). Individuals with greater weight for their body size (high BCI) are assumed to have greater energy reserves than individuals with lower weight for their body size (low BCI; reviewed in Brown 1996). Principal component analysis (PCA) of linear body measurements can be used to sum-marize structural size using correlated variables (Rising and Somers 1989, Brown 1996), and the first principal component is used to calculate a BCI. Recently, the methods used to calculate BCIs have generated much controversy, and theoreti-cal models indicate that the relationship between body weight and condition indices may be dif-ficult to interpret (Brown 1996, Jakob et al. 1996, Green 2001, Schulte-Hostedde et al. 2005, Scham-ber et al. 2009). In our approach, we can determine the separate direct effects of size and weight on juvenile survival because the path analysis will incorporate the correlations between these mea-sures. Because BCIs statistically remove the effect of body size from body weight, studies using this
Table 6. Number of fledglings banded in the colony, cohort size (i.e., number of fledglings produced at the study site by both banded and unbanded parents; see text), number of fledglings that survived to adulthood, prob-ability of a nest producing a fledging, number of banded fledglings that provided a tissue sample, number of tissue-sampled fledglings sexed by polymerase chain reaction (PCR), proportion of tissue-sampled fledglings sexed by PCR, and number of individuals whose PCR and adult sex did not match in each cohort.
Cohort
Number of fledglings
banded
Cohort size (n
survived)
Proportion of nests
producing a fledgling
Number of banded fledglings with tissue
sample
Number of fledglings sexed by
PCR
Proportion sexed by
PCR
Mismatched PCR and adult sex
1998–99 486 486 (122) 0.31 427 324 0.76 11999–00 25 25 (5) 0.03 25 21 0.84 02000–01 856 856 (325) 0.34 783 752 0.96 12001–02 629 629 (280) 0.23 625 610 0.98 12002–03 1,670 1,670 (958) 0.62 1,670 1,587 0.95 42003–04 934 1,321 (502) 0.52 829 805 0.97 02004–05 1,124 1,124 (662) 0.53 1,097 1,068 0.97 2
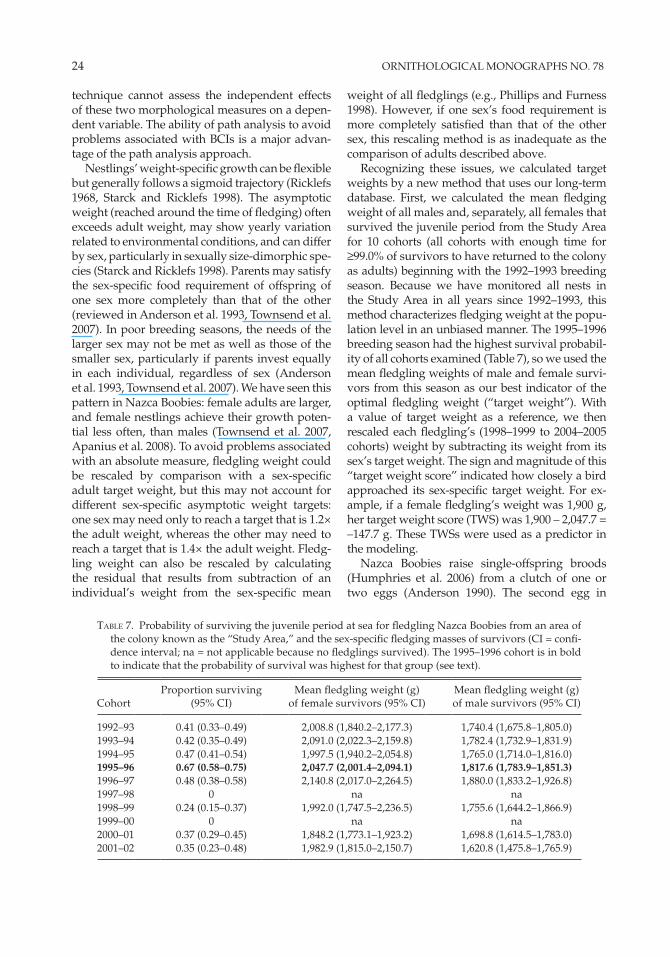
24 ORNITHOLOGICAL MONOGRAPHS NO. 78
technique cannot assess the independent effects of these two morphological measures on a depen-dent variable. The ability of path analysis to avoid problems associated with BCIs is a major advan-tage of the path analysis approach.
Nestlings’ weight-specific growth can be flexible but generally follows a sigmoid trajectory (Ricklefs 1968, Starck and Ricklefs 1998). The asymptotic weight (reached around the time of fledging) often exceeds adult weight, may show yearly variation related to environmental conditions, and can differ by sex, particularly in sexually size-dimorphic spe-cies (Starck and Ricklefs 1998). Parents may satisfy the sex-specific food requirement of offspring of one sex more completely than that of the other (reviewed in Anderson et al. 1993, Townsend et al. 2007). In poor breeding seasons, the needs of the larger sex may not be met as well as those of the smaller sex, particularly if parents invest equally in each individual, regardless of sex (Anderson et al. 1993, Townsend et al. 2007). We have seen this pattern in Nazca Boobies: female adults are larger, and female nestlings achieve their growth poten-tial less often, than males (Townsend et al. 2007, Apanius et al. 2008). To avoid problems associated with an absolute measure, fledgling weight could be rescaled by comparison with a sex-specific adult target weight, but this may not account for different sex-specific asymptotic weight targets: one sex may need only to reach a target that is 1.2× the adult weight, whereas the other may need to reach a target that is 1.4× the adult weight. Fledg-ling weight can also be rescaled by calculating the residual that results from subtraction of an individual’s weight from the sex-specific mean
weight of all fledglings (e.g., Phillips and Furness 1998). However, if one sex’s food requirement is more completely satisfied than that of the other sex, this rescaling method is as inadequate as the comparison of adults described above.
Recognizing these issues, we calculated target weights by a new method that uses our long-term database. First, we calculated the mean fledging weight of all males and, separately, all females that survived the juvenile period from the Study Area for 10 cohorts (all cohorts with enough time for ≥99.0% of survivors to have returned to the colony as adults) beginning with the 1992–1993 breeding season. Because we have monitored all nests in the Study Area in all years since 1992–1993, this method characterizes fledging weight at the popu-lation level in an unbiased manner. The 1995–1996 breeding season had the highest survival probabil-ity of all cohorts examined (Table 7), so we used the mean fledgling weights of male and female survi-vors from this season as our best indicator of the optimal fledgling weight (“target weight”). With a value of target weight as a reference, we then rescaled each fledgling’s (1998–1999 to 2004–2005 cohorts) weight by subtracting its weight from its sex’s target weight. The sign and magnitude of this “target weight score” indicated how closely a bird approached its sex-specific target weight. For ex-ample, if a female fledgling’s weight was 1,900 g, her target weight score (TWS) was 1,900 – 2,047.7 = –147.7 g. These TWSs were used as a predictor in the modeling.
Nazca Boobies raise single-offspring broods (Humphries et al. 2006) from a clutch of one or two eggs (Anderson 1990). The second egg in
Table 7. Probability of surviving the juvenile period at sea for fledgling Nazca Boobies from an area of the colony known as the “Study Area,” and the sex-specific fledging masses of survivors (CI = confi-dence interval; na = not applicable because no fledglings survived). The 1995–1996 cohort is in bold to indicate that the probability of survival was highest for that group (see text).
CohortProportion surviving
(95% CI)Mean fledgling weight (g)
of female survivors (95% CI)Mean fledgling weight (g) of male survivors (95% CI)
1992–93 0.41 (0.33–0.49) 2,008.8 (1,840.2–2,177.3) 1,740.4 (1,675.8–1,805.0)1993–94 0.42 (0.35–0.49) 2,091.0 (2,022.3–2,159.8) 1,782.4 (1,732.9–1,831.9)1994–95 0.47 (0.41–0.54) 1,997.5 (1,940.2–2,054.8) 1,765.0 (1,714.0–1,816.0)1995–96 0.67 (0.58–0.75) 2,047.7 (2,001.4–2,094.1) 1,817.6 (1,783.9–1,851.3)1996–97 0.48 (0.38–0.58) 2,140.8 (2,017.0–2,264.5) 1,880.0 (1,833.2–1,926.8)1997–98 0 na na1998–99 0.24 (0.15–0.37) 1,992.0 (1,747.5–2,236.5) 1,755.6 (1,644.2–1,866.9)1999–00 0 na na2000–01 0.37 (0.29–0.45) 1,848.2 (1,773.1–1,923.2) 1,698.8 (1,614.5–1,783.0)2001–02 0.35 (0.23–0.48) 1,982.9 (1,815.0–2,150.7) 1,620.8 (1,475.8–1,765.9)

PREDICTORS OF JUVENILE SURVIVAL IN BIRDS 25
two-egg clutches (“B-egg”) is laid several days after the “A-egg” (Anderson 1989), and if both eggs hatch, siblicidal interactions reduce the brood to one (usually the product of the A-egg), typically within a few days of the second chick’s hatching (Humphries et al. 2006). Clutch size can be used as a proxy for overall parental ability (Clifford and Anderson 2001a, Townsend and Anderson 2007b). Clutch size and hatching success also separate siblicidal birds (two-egg clutches that hatched two nestlings) from clutches that produce a sin-gle hatchling. Siblicidal nestlings experience an elevated level of androgen hormones that single-tons do not, and siblicidal behavior is associated with an adult behavior variant, which implies an organizational effect (Ferree et al. 2004; Müller et al. 2008, 2011). Similar effects could influence juvenile survival. Therefore, we examined the ef-fects of clutch and brood size on juvenile survival by creating a ranked clutch–brood effect (CBE) variable: one-egg clutches = 1, two-egg clutch with only one egg hatched = 2, and two-egg clutches with both eggs hatched = 3.
The predictors of juvenile survival examined were sex, cohort size (CS), CBE, HD, age at 1%, culmen length (CL), wing length (WL), TWS, and the quadratic of HD, age, CL, WL, and TWS. All predictors, except sex and HD (which was transformed within cohort; see above), were standardized (z-score) before entry into the model. For the quadratic effect tests, we performed an ad-ditional transformation: a number was added to make all values positive before squaring them, because without this step the square of negative numbers would have the same value as the square of their positive counterparts. The number added was constant within a variable and differed across variables.
Not all fledglings could be used in analyses, be-cause of incomplete data (missing measurements, dates, or tissue samples). In addition, individu-als that survived to adulthood but did not have a sex determined by PCR were omitted from all analyses. A small number of eggs or chicks have been adopted by nongenetic parents after being displaced from their home nests (Humphries et al. 2006); these cases were also omitted from all analyses. These omissions were random, not systematic, and the criteria for omitting them were applied objectively, so we do not expect them to have biased our analyses. The mini-mum number of cases per parameter estimated was 33, which exceeded the minimum number
required to assess model significance adequately (Kline 1998).
resulTs
Molecular sexing and sex ratios.—Genomic DNA isolated from feather samples (cohorts 1998–1999 through 2000–2001) did not amplify as well as DNA isolated from blood samples (cohorts 2001–2002 to 2004–2005; Table 6). DNA in feather samples is present in much lower copy number than DNA from blood or other tissue samples, and DNA from feathers may also be somewhat degraded if it originated from cells that died as the feather matured (Leeton et al. 1993, Horvath et al. 2005). In addition, our feather samples were stored in variable conditions (inadvertently frozen and thawed) before the DNA was extracted, and samples that did not amplify appeared to con-tain degraded DNA in electrophoresis gels (T. J. Maness pers. obs.). Of 2,622 fledglings sexed by PCR that survived to adulthood (1,546 males and 1,078 females), only nine individuals (0.34%) had a PCR sex that did not match their adult sex (Table 6). Only two of these cases occurred in co-horts with feather sampling (Table 6), so we are confident in the accuracy of sexes determined from these feather samples despite the problems with DNA degradation. The sex mismatches could be due to mislabeled sample tubes, errors in identifying the sex of the adults, or PCR error. Regardless, the possible PCR error rate is low, and individuals with mismatched sexes were omitted from all analyses.
The fledging sex ratio did not differ from an even sex ratio except in 1998–1999 and 2000–2001, when it was male biased (Fig. 2A). The overall fledging sex ratio suggested a male bias, with mar-ginal statistical significance (sex ratio = 0.519, 95% confidence interval [CI]: 0.505–0.532; c2 = 3.64, df = 1, P = 0.056). Cohort size explained 74.8% of the variation in fledging sex ratio (r = –0.86, P = 0.01). Generally, the fledging sex ratio became less male biased as cohort size increased. Variation in the fledging sex ratio explained more varia-tion in the return sex ratio (F = 626.7, df = 2 and 5, P < 0.001, r2 = 0.96) than cohort size (r2 = 0.86, P = 0.002). A cohort’s return sex ratio exceeded, or tended to exceed, its fledging sex ratio in all seven cohorts, and the 95% CI excluded 0.5 in all cohorts except 1999–2000 (Fig. 2A).
How important is male-biased juvenile sur-vival in the ontogeny of the male-biased return sex
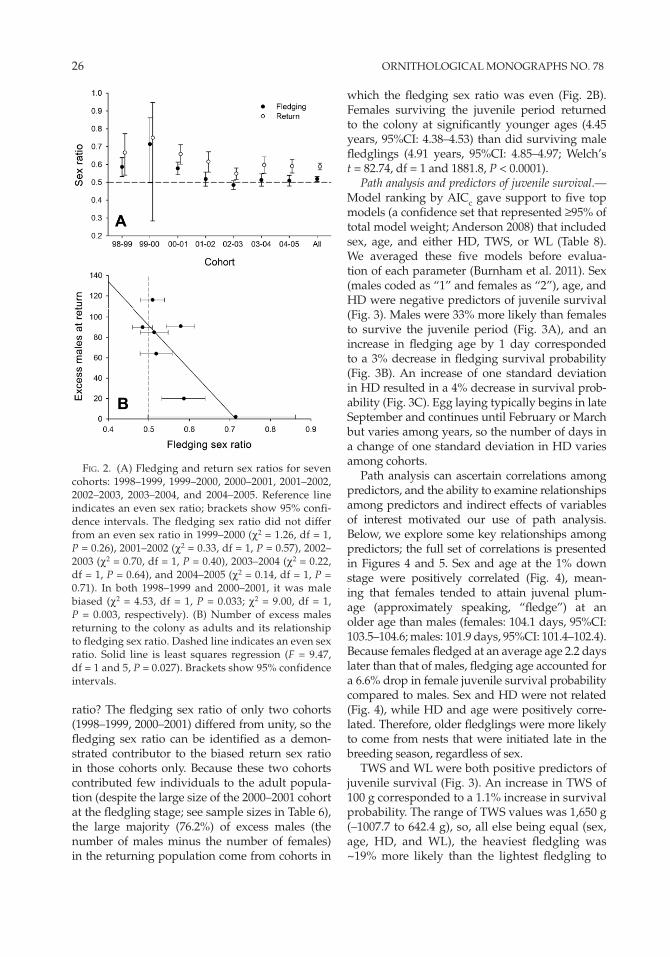
26 ORNITHOLOGICAL MONOGRAPHS NO. 78
ratio? The fledging sex ratio of only two cohorts (1998–1999, 2000–2001) differed from unity, so the fledging sex ratio can be identified as a demon-strated contributor to the biased return sex ratio in those cohorts only. Because these two cohorts contributed few individuals to the adult popula-tion (despite the large size of the 2000–2001 cohort at the fledgling stage; see sample sizes in Table 6), the large majority (76.2%) of excess males (the number of males minus the number of females) in the returning population come from cohorts in
which the fledging sex ratio was even (Fig. 2B). Females surviving the juvenile period returned to the colony at significantly younger ages (4.45 years, 95%CI: 4.38–4.53) than did surviving male fledglings (4.91 years, 95%CI: 4.85–4.97; Welch’s t = 82.74, df = 1 and 1881.8, P < 0.0001).
Path analysis and predictors of juvenile survival.—Model ranking by AICc gave support to five top models (a confidence set that represented ≥95% of total model weight; Anderson 2008) that included sex, age, and either HD, TWS, or WL (Table 8). We averaged these five models before evalua-tion of each parameter (Burnham et al. 2011). Sex (males coded as “1” and females as “2”), age, and HD were negative predictors of juvenile survival (Fig. 3). Males were 33% more likely than females to survive the juvenile period (Fig. 3A), and an increase in fledging age by 1 day corresponded to a 3% decrease in fledging survival probability (Fig. 3B). An increase of one standard deviation in HD resulted in a 4% decrease in survival prob-ability (Fig. 3C). Egg laying typically begins in late September and continues until February or March but varies among years, so the number of days in a change of one standard deviation in HD varies among cohorts.
Path analysis can ascertain correlations among predictors, and the ability to examine relationships among predictors and indirect effects of variables of interest motivated our use of path analysis. Below, we explore some key relationships among predictors; the full set of correlations is presented in Figures 4 and 5. Sex and age at the 1% down stage were positively correlated (Fig. 4), mean-ing that females tended to attain juvenal plum-age (approximately speaking, “fledge”) at an older age than males (females: 104.1 days, 95%CI: 103.5–104.6; males: 101.9 days, 95%CI: 101.4–102.4). Because females fledged at an average age 2.2 days later than that of males, fledging age accounted for a 6.6% drop in female juvenile survival probability compared to males. Sex and HD were not related (Fig. 4), while HD and age were positively corre-lated. Therefore, older fledglings were more likely to come from nests that were initiated late in the breeding season, regardless of sex.
TWS and WL were both positive predictors of juvenile survival (Fig. 3). An increase in TWS of 100 g corresponded to a 1.1% increase in survival probability. The range of TWS values was 1,650 g (–1007.7 to 642.4 g), so, all else being equal (sex, age, HD, and WL), the heaviest fledgling was ~19% more likely than the lightest fledgling to
Fig. 2. (A) Fledging and return sex ratios for seven cohorts: 1998–1999, 1999–2000, 2000–2001, 2001–2002, 2002–2003, 2003–2004, and 2004–2005. Reference line indicates an even sex ratio; brackets show 95% confi-dence intervals. The fledging sex ratio did not differ from an even sex ratio in 1999–2000 (c2 = 1.26, df = 1, P = 0.26), 2001–2002 (c2 = 0.33, df = 1, P = 0.57), 2002–2003 (c2 = 0.70, df = 1, P = 0.40), 2003–2004 (c2 = 0.22, df = 1, P = 0.64), and 2004–2005 (c2 = 0.14, df = 1, P = 0.71). In both 1998–1999 and 2000–2001, it was male biased (c2 = 4.53, df = 1, P = 0.033; c2 = 9.00, df = 1, P = 0.003, respectively). (B) Number of excess males returning to the colony as adults and its relationship to fledging sex ratio. Dashed line indicates an even sex ratio. Solid line is least squares regression (F = 9.47, df = 1 and 5, P = 0.027). Brackets show 95% confidence intervals.
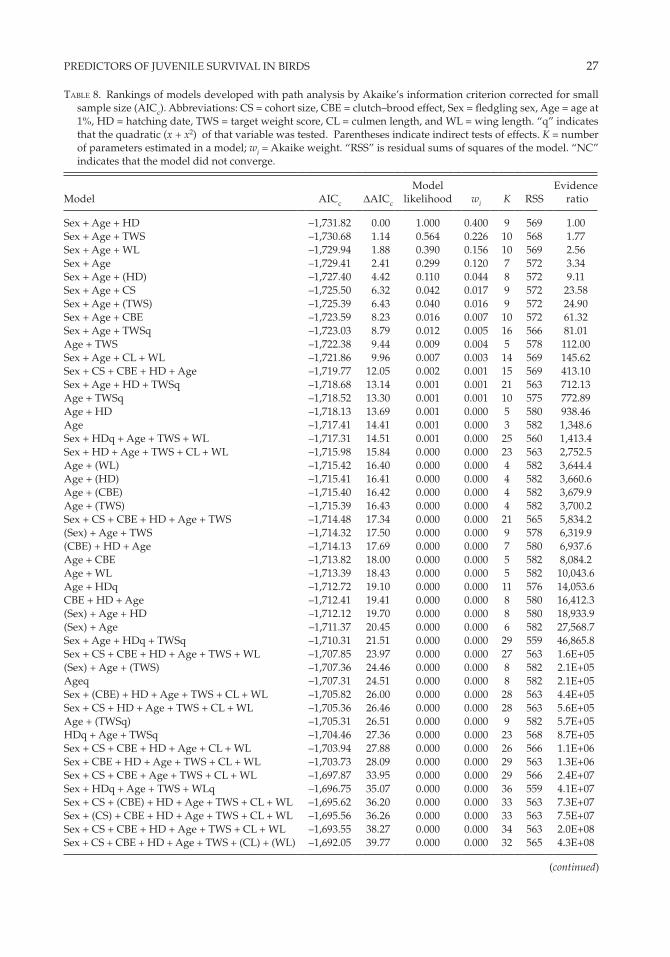
PREDICTORS OF JUVENILE SURVIVAL IN BIRDS 27
Table 8. Rankings of models developed with path analysis by Akaike’s information criterion corrected for small sample size (AICc). Abbreviations: CS = cohort size, CBE = clutch–brood effect, Sex = fledgling sex, Age = age at 1%, HD = hatching date, TWS = target weight score, CL = culmen length, and WL = wing length. “q” indicates that the quadratic (x + x2) of that variable was tested. Parentheses indicate indirect tests of effects. K = number of parameters estimated in a model; wi = Akaike weight. “RSS” is residual sums of squares of the model. “NC” indicates that the model did not converge.
Model AICc ΔAICc
Model likelihood wi K RSS
Evidence ratio
Sex + Age + HD –1,731.82 0.00 1.000 0.400 9 569 1.00Sex + Age + TWS –1,730.68 1.14 0.564 0.226 10 568 1.77Sex + Age + WL –1,729.94 1.88 0.390 0.156 10 569 2.56Sex + Age –1,729.41 2.41 0.299 0.120 7 572 3.34Sex + Age + (HD) –1,727.40 4.42 0.110 0.044 8 572 9.11Sex + Age + CS –1,725.50 6.32 0.042 0.017 9 572 23.58Sex + Age + (TWS) –1,725.39 6.43 0.040 0.016 9 572 24.90Sex + Age + CBE –1,723.59 8.23 0.016 0.007 10 572 61.32Sex + Age + TWSq –1,723.03 8.79 0.012 0.005 16 566 81.01Age + TWS –1,722.38 9.44 0.009 0.004 5 578 112.00Sex + Age + CL + WL –1,721.86 9.96 0.007 0.003 14 569 145.62Sex + CS + CBE + HD + Age –1,719.77 12.05 0.002 0.001 15 569 413.10Sex + Age + HD + TWSq –1,718.68 13.14 0.001 0.001 21 563 712.13Age + TWSq –1,718.52 13.30 0.001 0.001 10 575 772.89Age + HD –1,718.13 13.69 0.001 0.000 5 580 938.46Age –1,717.41 14.41 0.001 0.000 3 582 1,348.6Sex + HDq + Age + TWS + WL –1,717.31 14.51 0.001 0.000 25 560 1,413.4Sex + HD + Age + TWS + CL + WL –1,715.98 15.84 0.000 0.000 23 563 2,752.5Age + (WL) –1,715.42 16.40 0.000 0.000 4 582 3,644.4Age + (HD) –1,715.41 16.41 0.000 0.000 4 582 3,660.6Age + (CBE) –1,715.40 16.42 0.000 0.000 4 582 3,679.9Age + (TWS) –1,715.39 16.43 0.000 0.000 4 582 3,700.2Sex + CS + CBE + HD + Age + TWS –1,714.48 17.34 0.000 0.000 21 565 5,834.2(Sex) + Age + TWS –1,714.32 17.50 0.000 0.000 9 578 6,319.9(CBE) + HD + Age –1,714.13 17.69 0.000 0.000 7 580 6,937.6Age + CBE –1,713.82 18.00 0.000 0.000 5 582 8,084.2Age + WL –1,713.39 18.43 0.000 0.000 5 582 10,043.6Age + HDq –1,712.72 19.10 0.000 0.000 11 576 14,053.6CBE + HD + Age –1,712.41 19.41 0.000 0.000 8 580 16,412.3(Sex) + Age + HD –1,712.12 19.70 0.000 0.000 8 580 18,933.9(Sex) + Age –1,711.37 20.45 0.000 0.000 6 582 27,568.7Sex + Age + HDq + TWSq –1,710.31 21.51 0.000 0.000 29 559 46,865.8Sex + CS + CBE + HD + Age + TWS + WL –1,707.85 23.97 0.000 0.000 27 563 1.6E+05(Sex) + Age + (TWS) –1,707.36 24.46 0.000 0.000 8 582 2.1E+05Ageq –1,707.31 24.51 0.000 0.000 8 582 2.1E+05Sex + (CBE) + HD + Age + TWS + CL + WL –1,705.82 26.00 0.000 0.000 28 563 4.4E+05Sex + CS + HD + Age + TWS + CL + WL –1,705.36 26.46 0.000 0.000 28 563 5.6E+05Age + (TWSq) –1,705.31 26.51 0.000 0.000 9 582 5.7E+05HDq + Age + TWSq –1,704.46 27.36 0.000 0.000 23 568 8.7E+05Sex + CS + CBE + HD + Age + CL + WL –1,703.94 27.88 0.000 0.000 26 566 1.1E+06Sex + CBE + HD + Age + TWS + CL + WL –1,703.73 28.09 0.000 0.000 29 563 1.3E+06Sex + CS + CBE + Age + TWS + CL + WL –1,697.87 33.95 0.000 0.000 29 566 2.4E+07Sex + HDq + Age + TWS + WLq –1,696.75 35.07 0.000 0.000 36 559 4.1E+07Sex + CS + (CBE) + HD + Age + TWS + CL + WL –1,695.62 36.20 0.000 0.000 33 563 7.3E+07Sex + (CS) + CBE + HD + Age + TWS + CL + WL –1,695.56 36.26 0.000 0.000 33 563 7.5E+07Sex + CS + CBE + HD + Age + TWS + CL + WL –1,693.55 38.27 0.000 0.000 34 563 2.0E+08Sex + CS + CBE + HD + Age + TWS + (CL) + (WL) –1,692.05 39.77 0.000 0.000 32 565 4.3E+08
(continued)

28 ORNITHOLOGICAL MONOGRAPHS NO. 78
Model AICc ΔAICc
Model likelihood wi K RSS
Evidence ratio
CS + CBE + HD + Age + TWS + CL + WL –1,689.99 41.83 0.000 0.000 26 573 1.2E+09Sex + CS + CBE + HD + Age + (TWS) + CL + WL –1,689.66 42.16 0.000 0.000 33 566 1.4E+09Sex + CS + CBE + (HD) + Age + TWS + CL + WL –1,689.65 42.17 0.000 0.000 33 566 1.4E+09HDq + Age + TWSq + CL + WL –1,687.33 44.49 0.000 0.000 34 566 4.6E+09Sex + HDq + Age + TWSq + CL + WL –1,685.92 45.90 0.000 0.000 42 558 9.3E+09Sex + CS + CBE + HDq + Age + TWS + CL + WL –1,680.77 51.05 0.000 0.000 43 560 1.2E+11(Sex) + CS + CBE + HD + Age + TWS + CL + WL –1,675.52 56.30 0.000 0.000 33 573 1.7E+12Sex + CS + CBE + HD + Age + TWSq + CL + WL –1,672.54 59.28 0.000 0.000 46 561 7.4E+12Sex + CS + CBE + HD + Ageq + TWS + CL + WL –1,668.70 63.12 0.000 0.000 46 563 5.1E+13Sex + HDq + Age + TWS + CLq + WLq –1,668.42 63.40 0.000 0.000 52 557 5.8E+13TWS + WL –1,666.99 64.83 0.000 0.000 5 606 1.2E+14Sex + TWS + WL –1,664.96 66.86 0.000 0.000 10 602 3.3E+14Sex + TWS –1,661.37 70.45 0.000 0.000 7 607 2.0E+15TWS + CL + WL –1,660.95 70.87 0.000 0.000 8 606 2.4E+15Sex + TWS + CL + WL –1,660.31 71.51 0.000 0.000 13 601 3.4E+15Sex + CS + CBE + HD + TWS + CL + WL –1,660.30 71.52 0.000 0.000 26 588 3.4E+15Sex + TWSq –1,660.18 71.64 0.000 0.000 13 601 3.6E+15Sex + CS + CBE + HD + Age + TWS + CLq + WLq –1,653.06 78.76 0.000 0.000 57 559 1.3E+17TWSq –1,651.58 80.24 0.000 0.000 8 611 2.6E+17TWS –1,647.96 83.86 0.000 0.000 3 619 1.6E+18Sex + CS + CBE + HD + (Age) + TWS + CL + WL –1,645.95 85.87 0.000 0.000 33 588 4.4E+18(Age) + TWS –1,645.94 85.88 0.000 0.000 4 619 4.5E+18Sex + CS –1,634.03 97.79 0.000 0.000 6 623 1.7E+21Sex + HD –1,631.72 100.10 0.000 0.000 6 624 5.4E+21Sex + HDq –1,626.55 105.27 0.000 0.000 11 622 7.2E+22Sex + CL + WL –1,625.78 106.04 0.000 0.000 10 623 1.1E+23WL –1,625.33 106.49 0.000 0.000 3 631 1.3E+23Sex + CBE + HDq + Age + TWSq + CLq + WLq –1,624.56 107.26 0.000 0.000 74 556 2.0E+23Sex + WL –1,624.14 107.68 0.000 0.000 7 627 2.4E+23CL + WL –1,623.19 108.63 0.000 0.000 5 630 3.9E+23HDq + Age + TWSq + WLq –1,618.30 113.52 0.000 0.000 39 596 4.5E+24CS –1,607.61 124.21 0.000 0.000 3 641 9.4E+26HD –1,606.71 125.11 0.000 0.000 3 641 1.5E+27Sex –1,603.17 128.65 0.000 0.000 5 641 8.6E+27HDq –1,601.36 130.46 0.000 0.000 8 639 2.1E+28Sex + CBE –1,600.50 131.32 0.000 0.000 7 640 3.3E+28HDq + Age + TWSq + CLq + WLq –1,596.64 135.18 0.000 0.000 55 590 2.3E+29Sex + HDq + Age + TWSq + CLq + WLq –1,588.23 143.59 0.000 0.000 65 583 1.5E+31β –1,580.22 151.60 0.000 0.000 2 658 8.3E+32CBE –1,580.18 151.64 0.000 0.000 3 657 8.5E+32Sex + HDq + Ageq + TWS + CLq + WLq NCSex + HDq + Ageq + TWS + WLq NCSex + HDq + Ageq + TWSq + CLq + WLq NCHDq + Age + TWS + CLq + WLq NCCS + CBE + HDq + Ageq + TWSq + CLq + WLq NCSex + CBE + HDq + Ageq + TWSq + CLq + WLq NCSex + CS + CBE + HDq + Ageq + TWSq +
CLq + WLqNC
Sex + CS + CBE + HDq + Ageq + TWS + CLq + WLq
NC
Sex + CS + CBE + HDq + Ageq + TWSq + CL + WL
NC
Table 8. Continued.
(continued)

PREDICTORS OF JUVENILE SURVIVAL IN BIRDS 29
Model AICc ΔAICc
Model likelihood wi K RSS
Evidence ratio
Sex + CS + CBE + HD + Ageq + TWSq + CLq + WLq
NC
Sex + CS + CBE + HDq + Ageq + TWSq NC
Table 8. Continued.
Fig. 3. Relationship between predictor variables and juvenile survival from weighted average of top path analysis models. Error bars are 95% confidence intervals calculated from the unconditional variance that included a correction for model uncertainty (see equation on p. 111 of Anderson 2008). (A) Effect of offspring sex. (B) Effect of age at which the bird reached the 1% down developmental stage. (C) Effect of hatching date, expressed as standard deviation from a given year’s z-score (see text). (D) Effect of target weight score. (E) Effect of wing length.

30 ORNITHOLOGICAL MONOGRAPHS NO. 78
Fig. 4. Correlation between potential predictors of juvenile survival as determined by a saturated (all possible rela-tionships included) path analysis. Brackets indicate 95% bootstrap confidence intervals. Age = age at which 1% down developmental stage was reached; CBE = clutch–brood effect; CL = culmen length; CS = cohort size; HD = hatching date; Sex = offspring sex; TWS = target weight score; and WL = wing length. For sex, males = 1 and females = 2; thus, negative parameter estimates indicate that values of males are likely to exceed those of females for that variable, and vice versa. For example, the figure indicates that male fledglings are more likely than females to have a higher weight in relation to their target weight, and that females are more likely than males to have longer culmens.
survive the juvenile period (Fig. 3D). An increase in WL of 10 mm corresponded to a 1.1% increase in survival probability. WL ranged from 377 to 497 mm, so, all else being equal, the fledgling with the longest WL was ~13% more likely to sur-vive the juvenile period than the fledgling with the shortest WL (Fig. 3E). Female fledglings had longer wings than males (Fig. 4). This difference in WL increased female survival probability by 1.6% compared with male survival probability.
Sex and TWS were negatively correlated, while sex and WL were positively correlated (Fig. 4; an example of interpretation of correlations with discontinuous variables is given above, in the sections on study site and statistical analysis). Fe-males were much less likely than males to reach their target weight (females: mean TWS = –165.0 g, 95%CI: –179.0 to –151.0; males, mean TWS = –112.5 g, 95%CI: –124.3 to –100.7). However, this difference in mean TWS between the sexes corresponds to only a 0.6% decrease in female survival probability compared with male survival probability. Overall, juveniles that survived to adulthood were heavier (Table 9 and Fig 3D). Within sex, heavier female and male fledglings were more likely to survive the ju-venile period (Table 9 and Fig. 3D).
TWS and WL were negatively correlated, as were TWS and age, while age and WL were posi-tively correlated; but TWS and CL were positively correlated, as were WL and CL, while age and CL were negatively correlated (Fig. 4). Thus, slowly growing nestlings were underweight and exhib-ited stunted growth in some structures (CL) but not others (WL). The relationship between WL and age indicates that the wing feathers have had more time to grow in older fledglings.
HD and TWS were negatively correlated, while HD and WL were positively correlated (Fig. 4). So fledglings from nests initiated late in the breeding season were underweight, and their prolonged nestling period, as indicated by age (see above), allowed more time for wing feather growth.
We examined the relationship between the predictors included in the most supported path analyses and those that were not included to explain why being female, old, underweight, small, and late-hatching makes a fledgling less likely to survive to adulthood. We also examined the cor-relations between predictor variables within males and females separately; although path analysis can accommodate interactions between predictors by manually creating an interaction variable, the

PREDICTORS OF JUVENILE SURVIVAL IN BIRDS 31
effects of interactions are more easily interpreted in separate analyses (Fig. 5). The results of these separate analyses are presented below.
Female fledglings were more likely than male fledglings to be raised by low-quality parents (CBE = 1) (Figs. 4 and 6), and the fledging sex ratio of high-quality parents (CBE = 3) was male biased (Fig. 6). In addition, the fledging and return sex ratios of high-quality parents were more male biased than the fledging and return sex ratios of low-quality parents (Fig. 6). High-quality parents produced heavier fledglings with faster growth rates, and bred earlier in the season than low-quality parents (Fig. 4; correlations between CBE and TWS, age, and HD, respectively).
Nestlings in large cohorts (our proxy for envi-ronmental quality) grew faster and were heavier at
fledging than nestlings from small cohorts (Fig. 4). CS was also marginally associated with early HD and a female-biased sex ratio (Fig. 4). Structurally larger fledglings (CL) were also more likely to be produced in good years (Fig. 4). Larger fledglings (CL) were also heavier when they fledged (see above).
Within-sex examination of correlations betw- een predictor variables showed that, during good years (indicated by large CS), males were more likely than females to fledge at younger ages and to come from nests initiated earlier in the breeding season. Female growth improved more than male growth: female CLs were longer, and females were more likely to reach their tar-get weight as CS increased (Fig. 5). In addition, during good years, male fledglings were slightly
Model F PCriticalvalue
Survivormean L95 U95
Nonsurvivormean L95 U95
Association with
survival
Age 328.81 5.54E-69 0.006 99.69 99.26 100.12 106.32 105.74 106.90 –TWS 164.34 1.74E-36 0.013 –80.64 –91.85 –69.43 –197.14 –211.00 –183.28 +WL 109.41 4.12E-25 0.019 441.92 441.07 442.76 448.55 447.64 449.46 –CS 69.20 1.40E-16 0.025 1,282.30 1,264.20 1,300.40 1,162.40 1,140.70 1,184.20 +Sex 67.50 3.30E-16 0.031 1.41 1.38 1.44 1.57 1.54 1.59 –HD 66.28 6.05E-16 0.038 –0.19 –0.23 –0.14 0.11 0.05 0.16 –CBE 4.54 0.033 0.044 2.30 2.26 2.34 2.23 2.19 2.28 +CL 3.04 0.082 0.050 102.27 102.12 102.42 102.48 102.30 102.66 0
MalesAge 163.39 7.44E-32 0.007 99.22 98.59 99.86 105.67 104.91 106.42 –TWS 67.33 5.55E-16 0.014 –71.89 –86.94 –56.84 –169.47 –187.29 –151.64 +CS 46.07 1.71E-11 0.021 1,266.77 1,241.14 1,292.41 1,129.28 1,098.92 1,159.64 +HD 44.28 4.12E-11 0.029 –0.17 –0.23 –0.10 0.18 0.10 0.25 –WL 30.92 3.24E-08 0.036 436.22 435.25 437.20 440.50 439.35 441.66 –CBE 5.86 0.016 0.043 2.35 2.29 2.40 2.24 2.18 2.31 +CL 2.40 0.121 0.050 100.93 100.75 101.12 100.70 100.48 100.92 0
FemalesAge 143.6594 9.03E-34 0.007 100.36 99.56 101.16 106.82 106.13 107.51 –TWS 79.6083 2.23E-19 0.014 –93.26 –114.08 –72.44 –218.21 –236.13 –200.28 +CS 31.4442 2.51E-08 0.021 1,304.66 1,273.64 1,335.68 1,187.67 1,160.97 1,214.37 +HD 27.4245 1.91E-07 0.029 –0.21 –0.29 –0.14 0.06 –0.01 0.12 –WL 27.1345 2.21E-07 0.036 450.13 448.83 451.43 454.68 453.56 455.79 –CL 6.1873 0.013 0.043 104.20 103.98 104.42 103.83 103.64 104.02 +CBE 0.0029 0.957 0.050 2.23 2.16 2.29 2.23 2.17 2.28 0
Table 9. Results of analyses of variance of individual predictor variables, with sexes combined or separate. Abbre-viations: CS = cohort size, CBE = clutch–brood effect, Sex = fledgling sex, Age = age at 1% down stage (days), HD = hatching date (z-score), TWS = target weight score (g), CL = culmen length (mm), and WL = wing length (mm). Models are ranked by P values. Association with survival: “+” = positive, “–“ = negative, and “0” = no relationship. “Critical value” is P corrected for multiple comparisons using the false-discovery-rate method (di in Benjamini and Hochberg 1995; also see Curran-Everett 2000). P values less than the corresponding di (in bold) are considered significantly different using this method.

32 ORNITHOLOGICAL MONOGRAPHS NO. 78
more likely than female fledglings to be raised by higher-quality parents (Fig. 5). Old female fledglings were much more likely than old male fledglings to be underweight and to have short CLs (Fig. 5). Fledglings from nests initiated late in the breeding season were more likely than early-hatching fledglings to have longer wings, and
this effect was slightly stronger in males than in females (Fig. 5).
Capture–mark–recapture analysis.—The estimated median ĉ for the MARK analysis was 1.99, indi-cating minor overdispersion in the global model (White 2002). The confidence set (Anderson 2008) comprised 13 models (Table 10), which we aver-aged for parameter estimation (Burnham et al. 2011). Survival probability in the averaged model varied by sex, cohort, 1% age and its quadratic (see above), TWS and its quadratic, HD and its qua-dratic, WL and its quadratic, CL and its quadratic, CS, and CBE. CS and CBE were negative predic-tors of juvenile survival, while 1% age, HD, CL, WL, and TWS were subject to stabilizing selection with regard to juvenile survival probability (see Fig. S1 in online supplemental material).
We also estimated the detection probabilities of juveniles and age of first appearance in a sepa-rate, valid (no correlated predictor variables) CMR analysis, using a larger sample of birds and with no predictor variables in MARK. This analysis included monitored as well as unmonitored (see above) fledglings. The analysis was performed in the same way as our previous analysis, except that no covariates were included, we used a single state model with resight probability at age one constrained to zero, and the total sample size was much larger: 2,676 males and 2,486 females. The
Fig. 6. Fledging and return sex ratios of the different clutch–brood effect (CBE) ranks (1 = 1-egg clutch, 2 = 2-egg clutch with only 1 egg hatching, and 3 = 2-egg clutch with both eggs hatching). Error bars are 95% bootstrap confidence intervals. Reference line indi-cates an even sex ratio.
Fig. 5. Correlation between potential predictors of juvenile survival as determined by saturated (all possible relationships included) path analysis with sexes analyzed separately. Brackets indicate 95% bootstrap confidence intervals. Abbreviations of predictor names are as in Figure 4.

PREDICTORS OF JUVENILE SURVIVAL IN BIRDS 33
Table 10. Ranking by QAICc (quasi-likelihood Akaike’s information criterion corrected for small sample size) of models of juvenile survival in monitored fledglings only (developed in Program MARK). Survival in the unob-servable juvenile state (S:J) was held constant (.) or was allowed to vary by group (sex), by cohort (c), and by predictors of juvenile survival: CS = cohort size, CBE = clutch/brood effect, Age = age at 1%, HD = hatch date, TWS = target weight score, CL = culmen length, and WL = wing length. “q” indicates that the quadratic (x + x2) of that variable was tested. Survival in the adult state (S:A) varied by group (sex), resight probability in the J state was restricted to “0”, resight probability of adults varied by group (sex) and age (years), transition probability between the J and A states (Psi:J-A) varied by group (sex) and age (years), and transition probability between the A and J states (Psi:J-A) was constrained to “0” in all models. Only the variables that differed between models are shown below. K = number of parameters estimated in a model; wi = Akaike weight.
Model QAICc ΔQAICc wi
Model likelihood K QDeviance
{S:J(sex+c+Ageq+HDq+TWSq+CLq)} 5,193.84 0.000 0.211 1.000 40 5,113.60{S:J(sex+c+Ageq+HDq+TWS+CLq)} 5,194.56 0.722 0.147 0.697 39 5,116.34{S:J(sex+c+Ageq+HDq+TWSq+WLq+CLq)} 5,194.76 0.915 0.134 0.633 42 5,110.49{S:J(sex+c+Ageq+HDq+TWS+WLq+CLq)} 5,195.56 1.724 0.089 0.422 41 5,113.31{S:J(sex+c+Ageq+HDq+TWSq)} 5,195.69 1.847 0.084 0.397 38 5,119.47{S:J(sex+c+Ageq+HDq+TWSq+WLq)} 5,195.85 2.011 0.077 0.366 40 5,115.61{S:J(sex+c+Ageq+HDq+TWSq+CL)} 5,196.80 2.958 0.048 0.228 39 5,118.57{S:J(sex+c+Ageq+HDq+TWSq+WL+CL)} 5,197.18 3.340 0.040 0.188 40 5,116.94{S:J(sex+c+Age+HDq+TWSq+CLq)} 5,197.49 3.649 0.034 0.161 39 5,119.26{S:J(sex+c+Ageq+HD+TWSq+WLq+CLq)} 5,197.65 3.813 0.031 0.149 41 5,115.40{S:J(sex+c+Age+HDq+TWSq+WLq+CLq)} 5,198.03 4.185 0.026 0.123 41 5,115.78{S:J(sex+c+Ageq+HDq+TWSq+WLq+CLq+CS+CBE)} 5,198.76 4.914 0.018 0.086 44 5,110.47{S:J(sex+c+Age+HDq+TWSq+WLq)} 5,199.02 5.183 0.016 0.075 39 5,120.80{S:J(sex+c+Age+HDq+TWSq+WL+CL)} 5,199.79 5.947 0.011 0.051 39 5,121.56{S:J(sex+c+Age+HDq+TWSq+WLq+CLq+CS)} 5,200.04 6.196 0.010 0.045 42 5,115.77{S:J(sex+c+Age+HDq+TWS+WL+CL)} 5,201.48 7.636 0.005 0.022 38 5,125.26{S:J(sex+c+Ageq+TWSq+WLq+CLq)} 5,201.61 7.771 0.004 0.021 40 5,121.37{S:J(sex+c+Age+HDq+TWSq+WLq+CLq+CS+CBE)} 5,201.75 7.908 0.004 0.019 43 5,115.47{S:J(sex+c+Ageq+HDq+CLq)} 5,201.98 8.140 0.004 0.017 38 5,125.77{S:J(sex+c+Ageq+HDq+WLq+CLq)} 5,202.92 9.075 0.002 0.011 40 5,122.68{S:J(sex+c+HD+Age+WL+TWS)} 5,203.72 9.875 0.002 0.007 36 5,131.52{S:J(sex+c+Age+HD+TWSq+WL+CL)} 5,204.01 10.166 0.001 0.006 38 5,127.79{S:J(sex+c+Ageq+TWSq)} 5,204.37 10.525 0.001 0.005 36 5,132.17{S:J(sex+c+HD+Age+CL+WL+TWS)} 5,205.50 11.662 0.001 0.003 37 5,131.30{S:J(sex+c+CBE+HD+Age+CL+WL+TWS)} 5,207.47 13.628 0.000 0.001 38 5,131.25{S:J(sex+c+CS+CBE+HD+Age+CL+WL+TWS)} 5,209.48 15.640 0.000 0.000 39 5,131.25{S:J(sex+c+Ageq)} 5,215.20 21.357 0.000 0.000 35 5,145.02{S:J(sex+c+Age+HD)} 5,217.93 24.087 0.000 0.000 35 5,147.75{S:J(sex+c+Age+WL)} 5,218.10 24.262 0.000 0.000 35 5,147.92{S:J(sex+c+Age)} 5,222.83 28.992 0.000 0.000 34 5,154.66{S:J(sex+c+HDq+TWSq+WLq+CLq)} 5,233.53 39.692 0.000 0.000 40 5,153.30{S:J(sex+c+Age+HDq+TWSq+WL)} 5,241.00 47.155 0.000 0.000 38 5,164.78{S:J(sex+c+Age+HDq+TWSq)} 5,241.98 48.141 0.000 0.000 37 5,167.78{S:J(sex+c+Ageq+HDq+TWSq+WL)} 5,243.01 49.166 0.000 0.000 39 5,164.78{S:J(sex+c+Ageq+HDq)} 5,247.71 53.865 0.000 0.000 36 5,175.51{S:J(sex+c+Ageq+HDq)} 5,247.71 53.865 0.000 0.000 36 5,175.51{S:J(sex+c+HD+Age+TWS)} 5,249.51 55.666 0.000 0.000 35 5,179.32{S:J(sex+c+Age+TWSq)} 5,251.52 57.676 0.000 0.000 35 5,181.33{S:J(sex+c+Age+TWS)} 5,255.28 61.443 0.000 0.000 35 5,185.10{S:J(sex+c+Age+HDq)} 5,255.48 61.636 0.000 0.000 35 5,185.29{S:J(sex+c+TWSq)} 5,260.78 66.940 0.000 0.000 35 5,190.60{S:J(sex+c+TWS+WL+CL)} 5,263.34 69.504 0.000 0.000 35 5,193.16{S:J(sex+c+TWS)} 5,266.31 72.468 0.000 0.000 34 5,198.14{S:J(sex+c+Age+HDq+TWSq+WLq+CLq+CBE)} 5,275.92 82.081 0.000 0.000 42 5,191.66
(continued)

34 ORNITHOLOGICAL MONOGRAPHS NO. 78
estimated median ĉ for this analysis was 2.08, and the top model had much more support than the next best model did (Table 11). Survival estimates varied by sex and cohort, and recapture prob-abilities varied by sex and age at first appearance (Table 11 and Fig. 7). Survival probabilities of males exceeded those of females in five out of seven co-horts (Fig. 8), and recapture probabilities were high for both males and females after they were 6 years old (Fig. 7). Before age 6, females were more likely
to be recaptured than males, matching our analysis of age of first appearance above (Fig. 1).
Logistic regression models.—Forward and back-ward stepwise logistic regressions produced different top models, and nested logistic regres-sions yielded the same top model as the backward stepwise procedure (Table 12). The forward step-wise model included sex, 1% age, TWS and its quadratic, HD and its quadratic, and WL (Table 12). The backward stepwise model included the same
Model QAICc ΔQAICc wi
Model likelihood K QDeviance
{S:J(sex+c+HDq)} 5,294.80 100.959 0.000 0.000 35 5,224.62{S:J(sex+c+HD)} 5,300.58 106.744 0.000 0.000 34 5,232.41{S:J(sex+c+CLq)} 5,312.64 118.802 0.000 0.000 35 5,242.46{S:J(sex+c+WL)} 5,318.96 125.124 0.000 0.000 34 5,250.79{S:J(sex+c+WLq)} 5,319.01 125.168 0.000 0.000 35 5,248.83{S:J(sex+c+CL)} 5,320.43 126.589 0.000 0.000 34 5,252.26{S:J(sex+c)} 5,325.76 131.916 0.000 0.000 33 5,259.59{S:J(sex+c+CE)} 5,327.00 133.154 0.000 0.000 34 5,258.82{S:J(sex+c+CS)} 5,329.78 135.936 0.000 0.000 35 5,259.59{S:J(c)} 5,362.05 168.211 0.000 0.000 32 5,297.90{S:J(sex)} 5,395.61 201.767 0.000 0.000 27 5,341.50{S:J(.)} 5,431.92 238.080 0.000 0.000 26 5,379.82
Table 11. Ranking by QAICc (quasi-likelihood Akaike’s information criterion corrected for small sample size) of models of juvenile survival in monitored and unmonitored fledglings (developed in Program MARK). Survival (S) was held constant (.) or was allowed to vary by group (sex), time (t = year), cohort (c), and age in years (a). Resight probability (p) was held constant (.) or was allowed to vary by group (sex), time (t = year), or age in years (a). K = number of parameters estimated in a model; wi = Akaike weight.
Model QAICc ΔQAICc wi
Model likelihood K QDeviance
{S(sex*c) p(sex*a)} 10,424 0.00 1.000 1.000 50 856{S(sex*c) p(a)} 10,476 51.62 0.000 0.000 39 929{S(c) p(sex*a)} 10,481 56.54 0.000 0.000 36 940{S(t) p(sex*a)} 10,560 135.74 0.000 0.000 34 1,024{S(a) p(sex*a)} 10,622 197.49 0.000 0.000 33 1,087{S(sex) p(sex*a)} 10,842 418.12 0.000 0.000 24 1,326{S(.) p(sex*a)} 10,914 490.20 0.000 0.000 23 1,400{S(.) p(a)} 10,945 520.91 0.000 0.000 12 1,453{S(.) p(t)} 12,632 2,207.95 0.000 0.000 12 3,140{S(sex*c) p(sex)} 16,686 6,261.74 0.000 0.000 28 7,162{S(sex*c) p(.)} 16,691 6,267.30 0.000 0.000 27 7,169{S(c) p(.)} 16,736 6,312.31 0.000 0.000 15 7,238{S(a) p(.)} 16,871 6,447.26 0.000 0.000 13 7,377{S(t) p(.)} 17,587 7,162.93 0.000 0.000 13 8,093{S(sex) p(.)} 18,981 8,557.31 0.000 0.000 3 9,507{S(.) p(.)} 19,058 8,634.10 0.000 0.000 2 9,586{S(.) p(sex)} 19,059 8,634.36 0.000 0.000 3 9,584
Table 10. Continued.

PREDICTORS OF JUVENILE SURVIVAL IN BIRDS 35
predictors as the forward model, but also included the quadratic of WL and CL (Table 12). These same models received essentially no support in our path analysis when compared with the top path model (Table 8). The confidence set (Anderson 2008) com-prised the two best-supported models, which we averaged for parameter estimation. The averaged model consisted of negative effects of sex (males were the reference group), CBE, and age at 1% down stage, a positive effect of CS, and stabilizing effects on HD, CL, WL, and TWS (see Fig. S2 in online supplemental material). Logistic regression using individual predictor variables produced one top model, which was much more supported than other models (Table 13). This model included age as a negative predictor of survival.
Analysis of variance.—All ANOVAs of individ-ual predictor variables were significant except CL (Table 9). Age at 1% had the highest F ratio and lowest P value. In males, all ANOVAs except CL were significant and age at 1% had the highest F ratio and lowest P value. In females, all ANOVAs except CBE were significant and age at 1% had the highest F ratio and lowest P value. In all anal-yses (separate sexes and combined sexes), age, HD, and WL were negatively associated with sur-vival, while TWS, CS, and CBE were positively associated with survival.
Performance of statistical approaches.—The aver-aged path analysis model was relatively simple (five predictors), correctly classified 66.4% of
birds, and had a likelihood R2 (Anderson 2008) of 0.43. The averaged logistic regression model was more complex (12 variables) than the path analy-sis model (Tables 8, 13, and 14), correctly classified 66.3% of birds, and had an R2 of 0.42. The CMR model was also more complex (13 variables) than the path analysis model (Tables 8, 10, and 14), cor-rectly classified 65.2% of birds, and had an R2 of 0.39. The unconditional standard error (Anderson 2008) of parameters estimated with path analy-sis was low compared with the standard errors of parameters estimated with CMR or logistic regression (Table 14). The error associated with derived parameter estimates (calculated from the equation given by each statistical approach) of male and female juvenile survival probabilities is also lowest for path analysis (Fig. 9). We draw special attention to the result that path analysis was the only statistical approach whose error estimates did not overlap with the prediction of the null model (proportion of known survivors in all analyses; Fig. 9). The performance of the ANOVAs cannot be assessed because ANOVAs are not prospective.
discussion
Ecologists have long recognized the importance of the period of early independence in birds in un-derstanding demography, population dynamics,
Fig. 7. Relationship between a bird’s age in years and its probability of being observed in the colony as an adult at that age, as determined by a capture–mark–recapture analysis performed in Program MARK that included all unmonitored and monitored fledglings (see text). Solid circles indicate males, and open circles females. Brackets indicate 95% confidence intervals.
Fig. 8. Predicted male and female juvenile survival probabilities for all fledglings (monitored and unmon-itored; see text) from seven cohorts (1998–1999, 1999–2000, 2000–2001, 2001–2002, 2002–2003, 2003–2004, and 2004–2005), as determined by a capture–mark–recapture analysis performed in Program MARK. Solid circles indicate males, and open circles females. Brackets indicate 95% confidence intervals.

36 ORNITHOLOGICAL MONOGRAPHS NO. 78
Table 12. Ranking by Akaike’s information criterion corrected for small sample size (AICc) of models of juvenile survivorship performed with logistic regressions. ΔAICc = change in AICc value between the model in question and the top model, K = number of parameters in the model, and wi = Akaike weight; B = best model produced by backward stepwise regression, and F = best model produced by forward stepwise regression. Abbreviations: CS = cohort size, CBE = clutch–brood effect, Sex = fledgling sex, Age = age at 1% down stage (days), HD = hatch-ing date (z-score), TWS = target weight score (g), CL = culmen length (mm), and WL = wing length (mm). “q” indicates that the quadratic (x + x2) of that variable was tested.
Model AICc ΔAICc
Model likelihood wi K –2log(L)
Evidence ratio
Sex + HDq + Age + TWSq + WLq + [CL + CL2] 3,224 0.00 1.000 0.832 12 3,200.1 1.00 BCS + CBE + Sex + HDq + Age + TWSq + WLq + CLq 3,227 3.46 0.177 0.147 14 3,199.3 5.64Sex + HDq + Age + TWS + CLq + WLq 3,233 9.10 0.011 0.009 11 3,211.0 94.68Sex + HDq + Age + TWSq + WL 3,234 10.07 0.007 0.005 9 3,216.0 153.61 FSex + HDq + Ageq + TW + CLq + WLq 3,235 11.12 0.004 0.003 12 3,211.0 259.73Sex + HDq + Age + TWSq + CL + WL 3,236 11.58 0.003 0.003 10 3,215.5 327.68Sex + Age + HDq + TWSq 3,238 13.65 0.001 0.001 8 3,221.6 922.90Sex + HDq + Age + TWS + WLq 3,242 17.87 0.000 0.000 9 3,223.8 7,588.60Sex + HDq + Age + TWS + WL 3,244 19.65 0.000 0.000 8 3,227.6 1.85E+04Sex + CS + CBE + HD + Age + TWS + CLq + WLq 3,249 24.72 0.000 0.000 12 3,224.6 2.33E+05Sex + CS + CBE + HDq + Age + TWS + CL + WL 3,249 24.80 0.000 0.000 11 3,226.7 2.43E+05Sex + CS + CBE + HD + Age + TWSq + CL + WL 3,253 28.50 0.000 0.000 11 3,230.4 1.54E+06Sex + Age + CL + WL 3,254 30.13 0.000 0.000 6 3,242.1 3.49E+06Sex + Age + HD + TWSq 3,256 32.14 0.000 0.000 7 3,242.1 9.54E+06Sex + HD + Age + TWS + CL + WL 3,258 34.02 0.000 0.000 8 3,242.0 2.45E+07Sex + CBE + HD + Age + TWS + CL + WL 3,260 35.97 0.000 0.000 9 3,241.9 6.46E+07Sex + CS + HD + Age + TWS + CL + WL 3,260 35.97 0.000 0.000 9 3,241.9 6.46E+07Sex + CS + CBE + HD + Age + TWS + WL 3,260 36.27 0.000 0.000 9 3,242.2 7.51E+07Sex + CS + CBE + HD + Age + TWS + CL + WL 3,262 37.88 0.000 0.000 10 3,241.8 1.68E+08Sex + Age + TWSq 3,267 43.43 0.000 0.000 6 3,255.4 2.70E+09HDq + Age + TWSq + CL + WL 3,268 43.67 0.000 0.000 9 3,249.6 3.04E+09Sex + CS + CBE + HD + Age + TWS 3,271 47.05 0.000 0.000 8 3,255.0 1.65E+10Sex + CS + CBE + Age + TWS + CL + WL 3,274 49.77 0.000 0.000 9 3,255.7 6.41E+10Sex + CS + CBE + HD + Age + CL + WL 3,275 51.27 0.000 0.000 9 3,257.2 1.36E+11HDq + Age + TWSq 3,276 51.94 0.000 0.000 7 3,261.9 1.90E+11Sex + Age + TWS 3,279 54.52 0.000 0.000 5 3,268.5 6.91E+11Sex + Age + WL 3,282 58.22 0.000 0.000 5 3,272.2 4.40E+12Sex + Age + HD 3,282 58.32 0.000 0.000 5 3,272.3 4.62E+12Sex + CS + CBE + HD + Age 3,286 62.14 0.000 0.000 7 3,272.1 3.12E+13Sex + Age 3,294 70.42 0.000 0.000 4 3,286.4 1.95E+15Sex + Age + CBE 3,296 71.92 0.000 0.000 5 3,285.9 4.15E+15Age + TWSq 3,302 78.32 0.000 0.000 5 3,292.3 1.02E+17CS + CBE + HD + Age + TWS + CL + WL 3,304 79.57 0.000 0.000 9 3,285.5 1.90E+17Age + HDq 3,312 88.22 0.000 0.000 5 3,302.2 1.44E+19Age + TWS 3,317 93.00 0.000 0.000 4 3,309.0 1.56E+20Age + HD 3,327 102.82 0.000 0.000 4 3,318.8 2.12E+22CBE + HD + Age 3,328 104.22 0.000 0.000 5 3,318.2 4.28E+22Age 3,336 112.11 0.000 0.000 3 3,330.1 2.21E+24Age + CBE 3,337 113.32 0.000 0.000 4 3,329.3 4.04E+24Age + WL 3,338 114.12 0.000 0.000 4 3,330.1 6.02E+24Sex + CS + CBE + HD + TWS + CL + WL 3,372 148.47 0.000 0.000 9 3,354.4 1.74E+32Sex + TWSq 3,418 194.12 0.000 0.000 5 3,408.1 1.42E+42Sex + TWS + CL + WL 3,424 200.13 0.000 0.000 6 3,412.1 2.87E+43Sex + TWS + WL 3,425 201.42 0.000 0.000 5 3,415.4 5.48E+43TWS + WL 3,442 217.52 0.000 0.000 4 3,433.5 1.71E+47TWS + CL + WL 3,444 219.52 0.000 0.000 5 3,433.5 4.66E+47
(continued)

PREDICTORS OF JUVENILE SURVIVAL IN BIRDS 37
and the evolution of parental care. Despite a robust effort by many investigators to identify predictors of performance during this life history stage (Table 1), we argue that no strong signal has emerged; with respect to an effect of weight, only 42 of 74 studies found a correlation (mostly positive; Table 2A). In most of these studies that detected a relationship, the possibility cannot be rejected that a stronger case can be made for a correlate of weight (hatching date and sex are examples). Our goal in the present study was to
use a new analytical approach on a large data set to avoid some of the difficulties of previous studies. Our data provide an unusually good opportunity to evaluate the dominant view that heavy weight and/or large size at independence confer high juvenile survival, and to compare the predictive ability of weight and size with those of other potential predictors. Our previous work on the pattern of juvenile survival in Nazca Boo-bies indicated that females survived poorly com-pared with males in the two cohorts examined
Model AICc ΔAICc
Model likelihood wi K –2log(L)
Evidence ratio
Sex + TWS 3,446 221.82 0.000 0.000 4 3,437.8 1.47E+48TWSq 3,459 234.72 0.000 0.000 4 3,450.7 9.29E+50TWS 3,493 268.71 0.000 0.000 3 3,486.7 2.24E+58Sex + HDq 3,507 283.02 0.000 0.000 5 3,497.0 2.87E+61Sex + CS 3,513 289.02 0.000 0.000 4 3,505.0 5.74E+62Sex + CL + WL 3,516 292.02 0.000 0.000 5 3,506.0 2.58E+63Sex + HD 3,518 294.42 0.000 0.000 4 3,510.4 8.54E+63Sex + WL 3,532 307.62 0.000 0.000 4 3,523.6 6.28E+66CL + WL 3,543 319.22 0.000 0.000 4 3,535.2 2.07E+69WL 3,546 321.51 0.000 0.000 3 3,539.5 6.53E+69HDq 3,577 352.92 0.000 0.000 4 3,568.9 4.31E+76CS 3,585 360.51 0.000 0.000 3 3,578.5 1.92E+78Sex + CBE 3,586 361.62 0.000 0.000 4 3,577.6 3.34E+78Sex 3,587 362.71 0.000 0.000 3 3,580.7 5.77E+78HD 3,587 362.96 0.000 0.000 3 3,581.0 6.54E+78CBE 3,648 424.31 0.000 0.000 3 3,642.3 1.37E+92β 3,651 426.90 0.000 0.000 2 3,646.9 5.03E+92
Table 13. Ranking by Akaike’s information criterion corrected for small sample size (AICc) of models of juvenile survivorship performed with individual logistic regres-sions. ΔAICc = change in AICc value between the model in question and the top model, K = number of parameters in the model, and wi = Akaike weight. Abbrevia-tions: CS = cohort size, CBE = clutch–brood effect, Sex = fledgling sex, Age = age at 1% down stage (days), HD = hatching date (z-score), TWS = target weight score (g), CL = culmen length (mm), and WL = wing length (mm).
Model AICc ΔAICc
Model likelihood
AICc weight K –2Log(L)
Evidence ratio
Age 3,336 0.00 1.000 1.000 3 3,330.1 1.00
TWS 3,493 156.71 0.000 0.000 3 3,486.7 8.9E+33
WL 3,546 209.51 0.000 0.000 3 3,539.5 2.6E+45
CS 3,585 248.51 0.000 0.000 3 3,578.5 7.6E+53
Sex 3,587 250.71 0.000 0.000 3 3,580.7 2.3E+54
HD 3,587 250.96 0.000 0.000 3 3,581.0 2.6E+54
CBE 3,648 312.31 0.000 0.000 3 3,642.3 5.5E+67β 3,651 314.90 0.000 0.000 2 3,646.9 2.0E+68
Table 12. Continued.
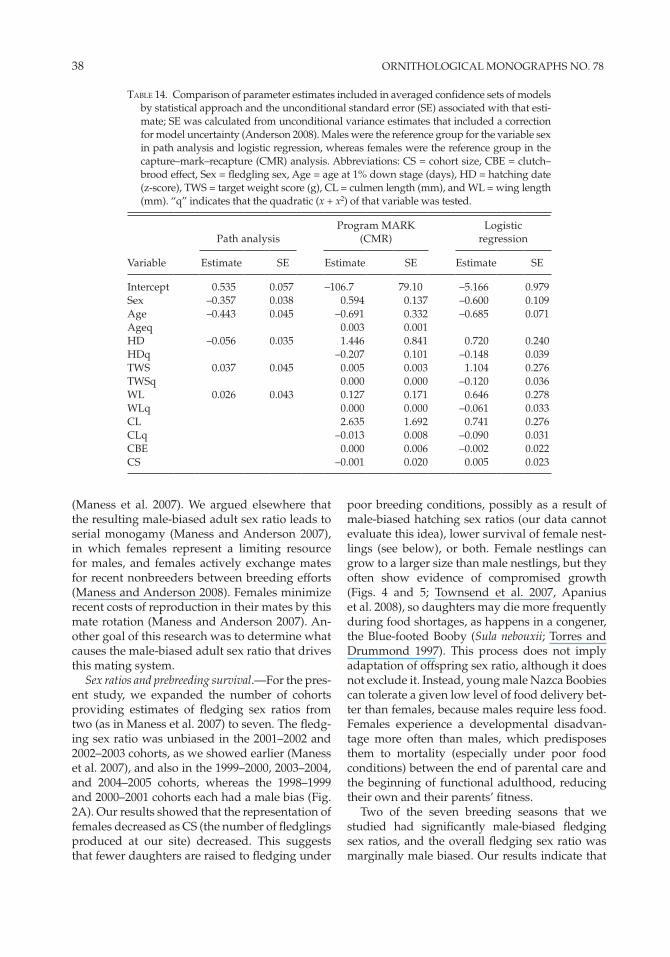
38 ORNITHOLOGICAL MONOGRAPHS NO. 78
Table 14. Comparison of parameter estimates included in averaged confidence sets of models by statistical approach and the unconditional standard error (SE) associated with that esti-mate; SE was calculated from unconditional variance estimates that included a correction for model uncertainty (Anderson 2008). Males were the reference group for the variable sex in path analysis and logistic regression, whereas females were the reference group in the capture–mark–recapture (CMR) analysis. Abbreviations: CS = cohort size, CBE = clutch–brood effect, Sex = fledgling sex, Age = age at 1% down stage (days), HD = hatching date (z-score), TWS = target weight score (g), CL = culmen length (mm), and WL = wing length (mm). “q” indicates that the quadratic (x + x2) of that variable was tested.
Path analysisProgram MARK
(CMR)Logistic
regression
Variable Estimate SE Estimate SE Estimate SE
Intercept 0.535 0.057 –106.7 79.10 –5.166 0.979Sex –0.357 0.038 0.594 0.137 –0.600 0.109Age –0.443 0.045 –0.691 0.332 –0.685 0.071Ageq 0.003 0.001HD –0.056 0.035 1.446 0.841 0.720 0.240HDq –0.207 0.101 –0.148 0.039TWS 0.037 0.045 0.005 0.003 1.104 0.276TWSq 0.000 0.000 –0.120 0.036WL 0.026 0.043 0.127 0.171 0.646 0.278WLq 0.000 0.000 –0.061 0.033CL 2.635 1.692 0.741 0.276CLq –0.013 0.008 –0.090 0.031CBE 0.000 0.006 –0.002 0.022CS –0.001 0.020 0.005 0.023
poor breeding conditions, possibly as a result of male-biased hatching sex ratios (our data cannot evaluate this idea), lower survival of female nest-lings (see below), or both. Female nestlings can grow to a larger size than male nestlings, but they often show evidence of compromised growth (Figs. 4 and 5; Townsend et al. 2007, Apanius et al. 2008), so daughters may die more frequently during food shortages, as happens in a congener, the Blue-footed Booby (Sula nebouxii; Torres and Drummond 1997). This process does not imply adaptation of offspring sex ratio, although it does not exclude it. Instead, young male Nazca Boobies can tolerate a given low level of food delivery bet-ter than females, because males require less food. Females experience a developmental disadvan-tage more often than males, which predisposes them to mortality (especially under poor food conditions) between the end of parental care and the beginning of functional adulthood, reducing their own and their parents’ fitness.
Two of the seven breeding seasons that we studied had significantly male-biased fledging sex ratios, and the overall fledging sex ratio was marginally male biased. Our results indicate that
(Maness et al. 2007). We argued elsewhere that the resulting male-biased adult sex ratio leads to serial monogamy (Maness and Anderson 2007), in which females represent a limiting resource for males, and females actively exchange mates for recent nonbreeders between breeding efforts (Maness and Anderson 2008). Females minimize recent costs of reproduction in their mates by this mate rotation (Maness and Anderson 2007). An-other goal of this research was to determine what causes the male-biased adult sex ratio that drives this mating system.
Sex ratios and prebreeding survival.—For the pres-ent study, we expanded the number of cohorts providing estimates of fledging sex ratios from two (as in Maness et al. 2007) to seven. The fledg-ing sex ratio was unbiased in the 2001–2002 and 2002–2003 cohorts, as we showed earlier (Maness et al. 2007), and also in the 1999–2000, 2003–2004, and 2004–2005 cohorts, whereas the 1998–1999 and 2000–2001 cohorts each had a male bias (Fig. 2A). Our results showed that the representation of females decreased as CS (the number of fledglings produced at our site) decreased. This suggests that fewer daughters are raised to fledging under
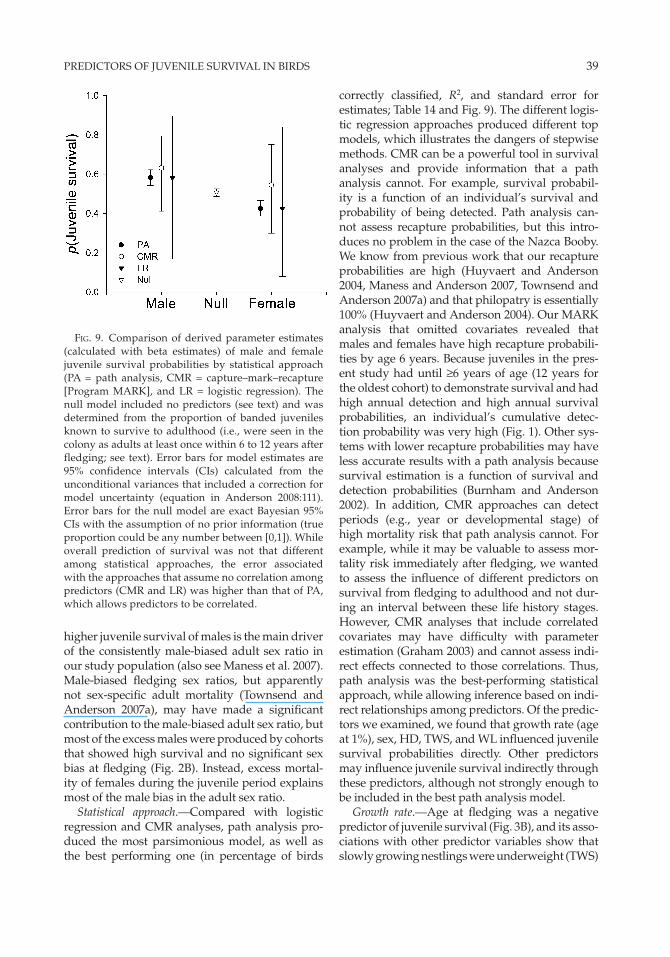
PREDICTORS OF JUVENILE SURVIVAL IN BIRDS 39
Fig. 9. Comparison of derived parameter estimates (calculated with beta estimates) of male and female juvenile survival probabilities by statistical approach (PA = path analysis, CMR = capture–mark–recapture [Program MARK], and LR = logistic regression). The null model included no predictors (see text) and was determined from the proportion of banded juveniles known to survive to adulthood (i.e., were seen in the colony as adults at least once within 6 to 12 years after fledging; see text). Error bars for model estimates are 95% confidence intervals (CIs) calculated from the unconditional variances that included a correction for model uncertainty (equation in Anderson 2008:111). Error bars for the null model are exact Bayesian 95% CIs with the assumption of no prior information (true proportion could be any number between [0,1]). While overall prediction of survival was not that different among statistical approaches, the error associated with the approaches that assume no correlation among predictors (CMR and LR) was higher than that of PA, which allows predictors to be correlated.
higher juvenile survival of males is the main driver of the consistently male-biased adult sex ratio in our study population (also see Maness et al. 2007). Male-biased fledging sex ratios, but apparently not sex-specific adult mortality (Townsend and Anderson 2007a), may have made a significant contribution to the male-biased adult sex ratio, but most of the excess males were produced by cohorts that showed high survival and no significant sex bias at fledging (Fig. 2B). Instead, excess mortal-ity of females during the juvenile period explains most of the male bias in the adult sex ratio.
Statistical approach.—Compared with logistic regression and CMR analyses, path analysis pro-duced the most parsimonious model, as well as the best performing one (in percentage of birds
correctly classified, R2, and standard error for estimates; Table 14 and Fig. 9). The different logis-tic regression approaches produced different top models, which illustrates the dangers of stepwise methods. CMR can be a powerful tool in survival analyses and provide information that a path analysis cannot. For example, survival probabil-ity is a function of an individual’s survival and probability of being detected. Path analysis can-not assess recapture probabilities, but this intro-duces no problem in the case of the Nazca Booby. We know from previous work that our recapture probabilities are high (Huyvaert and Anderson 2004, Maness and Anderson 2007, Townsend and Anderson 2007a) and that philopatry is essentially 100% (Huyvaert and Anderson 2004). Our MARK analysis that omitted covariates revealed that males and females have high recapture probabili-ties by age 6 years. Because juveniles in the pres-ent study had until ≥6 years of age (12 years for the oldest cohort) to demonstrate survival and had high annual detection and high annual survival probabilities, an individual’s cumulative detec-tion probability was very high (Fig. 1). Other sys-tems with lower recapture probabilities may have less accurate results with a path analysis because survival estimation is a function of survival and detection probabilities (Burnham and Anderson 2002). In addition, CMR approaches can detect periods (e.g., year or developmental stage) of high mortality risk that path analysis cannot. For example, while it may be valuable to assess mor-tality risk immediately after fledging, we wanted to assess the influence of different predictors on survival from fledging to adulthood and not dur-ing an interval between these life history stages. However, CMR analyses that include correlated covariates may have difficulty with parameter estimation (Graham 2003) and cannot assess indi-rect effects connected to those correlations. Thus, path analysis was the best-performing statistical approach, while allowing inference based on indi-rect relationships among predictors. Of the predic-tors we examined, we found that growth rate (age at 1%), sex, HD, TWS, and WL influenced juvenile survival probabilities directly. Other predictors may influence juvenile survival indirectly through these predictors, although not strongly enough to be included in the best path analysis model.
Growth rate.—Age at fledging was a negative predictor of juvenile survival (Fig. 3B), and its asso-ciations with other predictor variables show that slowly growing nestlings were underweight (TWS)
40 ORNITHOLOGICAL MONOGRAPHS NO. 78
and structurally (CL) smaller at fledging (Figs. 4 and 5). In addition, slowly growing nestlings were more likely to be female, to be raised by lower-quality parents (CBE), to come from nests initiated late in the breeding season (HD), and to be reared in poor-quality years (CS; Figs. 4 and 5). Most seabirds (Phaethontiformes, Procellariformes, Sphenisci-formes, Pelecaniformes, Suliformes, Alcidae, and Laridae; Ericson et al. 2006, Hackett et al. 2008, Chesser et al. 2010) rely on temporally and spatially unpredictable food resources, and parents, partic-ularly those in long-lived species, are expected to allocate nutritional resources consistently to self-maintenance and away from reproductive effort (Erikstad et al. 1998, Apanius and Nisbet 2006, Apanius et al. 2008). Nestlings of these species are expected to bear the costs of food shortages (Mauck and Grubb 1995) and to adjust growth accordingly if possible. Slow growth is associated with high nestling mortality in Roseate Terns (Sterna dou-galli; Nisbet et al. 1998, 1999) and Sandwich Terns (Stienen and Brenninkmeijer 2002), among other seabirds. Few studies have examined the effect of growth rate on juvenile survival (Table 1), and those that did showed mixed results. Slowly grow-ing nestlings of Black-legged Kittiwakes were less likely to return to natal areas (Coulson and Por-ter 1985), whereas growth rate was not associated with juvenile survival in Common Guillemots (Harris et al. 1992) or Sandwich Terns (Stienen and Brenninkmeijer 2002). Slow growth at par-ticular developmental stages may have important consequences for nestling survival: slow growth shortly after hatching predicted nestling mortality in Roseate Terns (Nisbet et al. 1998, 1999), whereas slow growth only during the linear growth phase predicted nestling mortality in Sandwich Terns (Stienen and Brenninkmeijer 2002).
Our results indicated that individuals that take longer to reach the 1% down developmental stage survive the juvenile period poorly but did not re-veal whether slow growth at a particular nestling stage was important. However, analysis of body weight during the 2002–2003 breeding season showed that Nazca Booby offspring with shorter nestling periods (at or below median fledgling age) were 5.9% heavier across the entire nestling period than offspring with longer nestling periods (Apanius et al. 2008), which suggests that long nestling periods are associated with poor parental performance throughout the nestling period.
Our results also showed that fast growth itself was important for juvenile survival, such that the
younger of two fledglings with identical mea-sures on all other variables would be more likely than the older fledgling to survive to adulthood. Several ideas, which are not necessarily mutually exclusive, have been put forth to explain the effect of growth rate on survival. First, maternal effects can arise from modification of egg components
and composition (yolk, albumen, and overall egg mass) and can influence offspring growth, me-tabolism, immune function, and stress response across taxa (reviewed in Ho and Burggren 2010). For example, elevated yolk corticosterone can slow offspring growth (Hayward and Wingfield 2004, Hayward et al. 2006; but see Chin et al. 2009), whereas androgens deposited in yolk can enhance growth and muscle development of offspring (Eising et al. 2001, 2006; Groothuis and Schwabl 2002, 2008). These same compounds can affect be-havior relevant to juvenile survival (Hayward and Wingfield 2004, Daisley et al. 2005, Eising et al. 2006, Uller and Olsson 2006, Tobler and Sandell 2007, Ruuskanen and Laaksonen 2010; reviewed in Biro and Stamps 2008, Smith and Blumstein 2008) and may be part of the advantage of fast growth. The external factors driving maternal ef-fects on Nazca Booby eggs are not known but could include maternal diet during egg formation (Clifford and Anderson 2001b) and management of sibling competition (Müller et al. 2008).
Second, growth can be limited by availability of food resources provided by the parents, and also by the individual offspring’s capacity to assimilate the food provided (level-2 constraints; Ricklefs et al. 1998). These constraints involve two types of tradeoff. One involves a limitation in which allocation of tissue to digestion and assimilation necessarily decreases development of other tissues and their functions (Ricklefs et al. 1998). Allocation to alimentary function when the tradeoff permits it might well lead to faster growth and could con-fer a survival advantage over individuals with less effective food processing while they are learning to forage as newly independent individuals. The second constraint involves allocation to growth versus other functions such as self-maintenance, activity, and thermoregulation (Ricklefs et al. 1998). Parents that are less efficient foragers may need to spend more time away from their nests to deliver the same quantity of food as more efficient foragers (e.g., Lescroël et al. 2010). Nazca Booby chicks left alone may need to divert energy from growth to thermoregulation, a constant concern at our equatorial study site, or to recovery from
PREDICTORS OF JUVENILE SURVIVAL IN BIRDS 41
often violent encounters with Non-Parental Adult Visitors (Anderson et al. 2004), which can induce stress. Chronic elevation of stress hormones has been shown to be detrimental across taxa (re-viewed in Sapolsky et al. 2000), and increased stress during growth can have negative long-term effects on cognitive ability (Sapolsky et al. 2000, Kitaysky et al. 2003).
Finally, differential growth may result from vari-ation in the quality of the nestling diet. For example, prey size, rather than total parental deliveries to broods, predicted juvenile survival in House Spar-rows (Schwagmeyer and Mock 2008). Considering the diet’s nutritional components, passerine nest-lings are fed mostly caterpillars, yet spiders are provided during early growth, irrespective of spi-der availability (Naef-Daenzer et al. 2000, Magrath et al. 2004, Arnold et al. 2007b, Radford 2008). Spiders contain more of the amino acid taurine (Ramsay and Houston 2003) and, therefore, are apparently of higher nutritional quality than cater-pillars (Magrath et al. 2004, Arnold et al. 2007b); in mammals, taurine is required for normal brain and visual development (Aerts and Van Assche 2002). Blue Tits supplemented with taurine as nestlings were less risk averse than controls and were bet-ter able to learn spatial tasks as juveniles (Arnold et al. 2007b). Offspring fed higher-quality food may grow faster and have a greater chance of surviving to adulthood (Schew and Rickefs 1998), but few studies have addressed the effect of growth rate on juvenile survival (Table 1). Even fewer have exam-ined why or how growth rate may be important for survival. More work is needed in this area.
Sex differences in juvenile survival.—Female fled-glings were less likely than male fledglings to sur-vive the juvenile period (Fig. 3A), and this excess mortality of female juveniles is the principal cause of the consistently male-biased adult sex ratio in our study population (Fig. 2; Maness et al. 2007, Townsend and Anderson 2007a). This bias affects the mating dynamics and evolution of strategies of the population (Maness and Anderson 2007, 2008). The results presented here suggest that the bias affects recruitment decisions as well, with male juveniles returning to the colony significantly later than females (Fig. 1). Males experience more com-petition for mates than females do and may wait to acquire any benefits of further maturity before engaging in colony-based activities.
Female fledglings were more likely than males to be underweight, to be raised by lower-quality par-ents, and to be older at fledging (Figs. 4–6). HD was
another important predictor of juvenile survival (Fig. 3C) and, as CS increased, males surviving to fledging were more likely to have hatched earlier in the breeding season, whereas females were not (Fig. 5: HD and CS). These early-hatching males in large cohorts should have higher survival proba-bilities than females. Hence, juvenile females were more likely to die than juvenile males, because fe-male fledglings were older than male fledglings, more underweight, produced by parents breeding later in season (in better years), and more likely to be raised by lower-quality parents (Figs. 4–6), pos-sibly with negative maternal and genetic effects (see below on HD and CBE).
Fledging age was associated with factors that in-dicated slow or reduced growth, such as low TWS and short CL (Figs. 4 and 5). Older fledglings were more likely to be underweight and to have shorter culmens than younger fledglings, and this effect was more pronounced in females than in males (Fig. 5). As predicted by life history theory for long-lived organisms, Nazca Booby parents may regu-late their parental effort under a cap (Apanius et al. 2008), and this effort level may not always meet the demands of their female offspring.
In addition, offspring sex had a direct effect on juvenile survival probability, independent of the other predictors in the model, which means that otherwise similar male and female offspring would have different probabilities of survival to adulthood, due to some correlate of sex that we did not measure (Fig. 3A). This might be explained in part by females being raised by lower-quality parents (see discussion of CBE below, although the indirect effect of CBE on sex and survival was not strong enough to be included among the best path models). A variety of other sex-specific factors could contribute to the direct sex effect; indeed, a recent meta-analysis of sex-specific environmental sensitivity suggests that the causation of sex dif-ferences in performance of young birds is likely multifactorial (Jones et al. 2009).
No previous study has assessed the effect of omitting this critical variable (sex) from an analysis of juvenile survival. In the case of Nazca Boobies, we repeated our path analyses with sex omitted to evaluate this effect (results not shown). In ef-fect, this is the approach that we would have taken without data on sex, and it is the approach taken by the majority of studies in Table 1. When the ef-fect of sex was omitted, weight and wing length were no longer significant positive predictors of survival, and culmen length became a marginally
42 ORNITHOLOGICAL MONOGRAPHS NO. 78
negative predictor of survival. If we had lacked in-formation on sex for our model, we would have made two erroneous conclusions: that weight did not influence juvenile survival, and that small structural size enhanced it. This exercise illustrates the importance of including the sex of fledglings in studies of juvenile survival.
Body size and weight (target weight score).—WL and TWS were positively related to juvenile sur-vival, while CL was not (Table 8 and Fig. 3). Females (the structurally larger sex) exhibited lower, not higher, juvenile survival than males (Fig. 3). The size measures had contrasting relationships with weight: WL was negatively correlated with TWS, while the relationship between CL and TWS was positive. In addition, CL and WL were positively correlated (Figs. 4 and 5). Individual ANOVAs and logistic regression analyses indicated that birds (sexes combined and analyzed separately) that sur-vived the juvenile period had shorter average WLs than birds that did not survive (Table 9). This could be interpreted as a size disadvantage. Yet in path analysis, multiple logistic regression, and CMR, WL was either positively associated with survival or was subject to stabilizing selection. This set of seemingly counterintuitive relationships among morphological measures illustrates the problem with using uninformed PCA or a single morpho-logical measure to determine a BCI, particularly among individuals with growth periods of variable duration. In Nazca Boobies, culmen growth is typi-cally complete by the 1% down stage, and WL is nearly complete, with males at 96.6% and females at 96.4% of the sex-specific adult length when offspring leave the colony (Townsend et al. 2007, Apanius et al. 2008, Maness et al. 2011). Nestlings that fledge at an older age have longer wings than individuals with growth periods of shorter dura-tion (Figs. 4 and 5). This is almost certainly because the feathers of older fledglings have had more time to grow and not because the bone structure of the wing is longer in older individuals. Accordingly, the relationship between fledging age and CL was negative: slowly maturing fledglings were more likely to have shorter culmens (reflecting poor growth) than nestlings that reached the fledgling stage more quickly (Fig. 4). This effect was more pronounced in females (Fig. 5), which suggests that food limitation affects the growth of females more frequently.
Structurally smaller individuals are unlikely to require longer developmental periods than larger individuals of the same species, especially given that Nazca Boobies have essentially a single-chick
brood, with only ephemeral sibling competition. We showed previously, from a single cohort, that Nazca Boobies that fledged at older ages tended to be underweight for their sex through-out the nestling period (Apanius et al. 2008). For the sample of seven cohorts in the present study, nestlings that fledged at older ages had much lower TWSs than faster-growing nestlings (Figs. 4 and 5). We suggest that undernourished nestling Nazca Boobies have a developmental syndrome of slow structural growth, long maturation peri-ods, and stunted or reduced structural growth of some features (e.g., culmen) but not others (e.g., feathers). A nestling with limited energetic re-sources may face developmental tradeoffs, and rather than reducing overall growth uniformly, energy could be directed toward growth of vital systems or structures, or growth could be slowed or reduced in some areas and not others (Schew and Ricklefs 1998). It may be worse for a seabird nestling approaching independence to compro-mise the growth of flight feathers as opposed to that of other structures, such as the culmen, because flight is required to forage when indepen-dent (Reid et al. 2000). In line with this reasoning, Grey-headed Albatross (Diomedea chrysostoma) chicks maintained feather and pectoral muscle growth at the expense of organ development and acquisition of fat stores during periods of reduced food availability (Reid et al. 2000). The positive relationship between WL and juvenile survival (Fig. 3), despite WL’s strong association with pre-dictors that reflect compromised growth (such as fledging age and TWS; Figs. 4 and 5), implicates satisfactory wing growth as a critical component of juvenile survival. This result demonstrates an advantage of the path model. With other variables in the model controlled, WL showed a positive re-lationship with survival, whereas an individual logistic regression and ANOVA found a negative association between WL and survival because the mean WL of nonsurvivors was typically longer than that of survivors (Table 9). This result par-tially supports the size advantage hypothesis, because a fledgling with long wings would more likely survive the juvenile period, all else being equal, but CL was not associated with survival.
TWS was a positive predictor of juvenile sur-vival in our path analysis (Table 8 and Fig. 3), which supports the weight advantage hypothesis. Underweight fledglings were much more likely than heavier fledglings to be older at fledging and to originate from nests initiated late in the breeding season (Figs. 4 and 5). Considering seabird species,

PREDICTORS OF JUVENILE SURVIVAL IN BIRDS 43
Stienen and Brenninkmeijer (2002) suggested that the degree of dependence on parental care during the postfledging period should predict the im-portance of fledging weight on juvenile survival, because all studies of seabirds that have found a positive relationship between fledging weight and survival were of species that become independent before or immediately after fledging. Nazca Booby parents feed young after they fledge until just before the juveniles vacate the colony ~45.3 days later (~30% of the posthatching parental care pe-riod), and parents are highly unlikely to care for their offspring after they leave (Maness et al. 2011). Therefore, parental care extends well into the post-fledging period in Nazca Boobies, and TWS was important for juvenile survival (also see Table 1), contradicting Stienen and Brenninkmeijer’s (2002) proposal.
Some species of birds reach a smaller size under poor food conditions during early development, whereas in other species there is no effect on final size (Schew and Ricklefs 1998). This discrepancy may reflect variation in the importance of struc-tural size in obtaining resources later in life. In addition to stunting structural growth, nutritional deficits in early growth can compromise learning and memory capabilities of adults (Nowicki et al. 2002, Pravosudov et al. 2005). Newly independent young seabirds must learn to locate temporally and spatially variable food sources over vast ar-eas, often using difficult and complex foraging techniques. If young seabirds are unable to master these skills quickly because their growth was com-promised, they are unlikely to survive the juvenile period. As adults, seabirds may compete for mates and nesting sites in often densely populated breed-ing colonies, and smaller individuals could be at a competitive disadvantage even if they survive the juvenile period.
Our results suggest that negative effects of nu-tritional deficits, including reduced growth and possible cognitive effects, will fall more heavily on females than on males in our study population. Few studies have examined sex-specific juvenile survival (Table 1). Our results agree with and ex-tend the large body of work on dependent young that suggests that the larger sex in size-dimorphic species often suffers more during food shortages (reviewed in Clutton-Brock 1991), particularly in the absence of sibling competition, when larger size can be converted into a competitive advantage over smaller nestmates (Breitwisch 1989, Olsen and Cockburn 1991, Mulvihill et al. 1992, Anderson et al. 1993, Arroyo 2002, Hipkiss et al. 2002).
We found support for Lack’s (1966) body-reserve advantage hypothesis and for Garnett’s (1981) size advantage hypothesis. Our analytical approach al-lowed us to test the relative importance of these hypotheses in relation to other potential predictors of survival, and we found that both advantages can simultaneously influence juvenile survival. We emphasize here that BCIs that correct for structural size are not designed to evaluate the influence of structural size itself on survival (e.g., large and small individuals can have identical regression re-sidual scores) and should be used with caution, if at all. Instead, an approach like path analysis allows evaluation of structural size in addition to other variables of interest in a multivariate framework. Accounting for differential growth of characters is an essential and often overlooked aspect of empirical evaluations of bird growth. Path analysis allowed us to assess effects of correlated predictors like culmen length, wing length, and TWS together in the same model, in which interactions like dif-ferential growth can be parsed. CMR and logistic regression cannot treat several correlated variables in this manner (Graham 2003) unless a principal component is calculated to combine all of these related variables into a single variable, losing infor-mation on interactive effects.
Hatching date.—HD predicted juvenile survival, although to a lesser degree than fledging age: male and female fledglings were less likely to survive the juvenile period if they hatched late in the breeding season (Fig. 3C). HD and fledging age were positively related (Figs. 4 and 5). Therefore, offspring fledging from nests initiated late in the breeding season were more likely to experience a protracted nestling period (Figs. 4 and 5). Fledg-lings from late nests exhibited the effects of poor parental care: they were underweight and took longer to reach the developmental milestone of the 1% down stage, consistent with Lack’s (1954) idea that high-performing parents begin breeding at the optimum time of year and that food may become less readily available as the breeding sea-son progresses. An equally plausible hypothesis is that food availability does not change during the breeding season and that late-breeding birds have intrinsically poor parental performance in general (rooted in age, experience, and a variety of other possible causes), making them unable to feed nest-lings adequately.
Beyond its association with predictors associated with poor parental care, HD had a direct negative effect on juvenile survival (Fig. 3C). Young birds, learning to forage while still colony-based, may
44 ORNITHOLOGICAL MONOGRAPHS NO. 78
face less competition and/or less depleted food resources at common foraging areas if they fledge early in the season. Juvenile Nazca Boobies vacate the colony ~45 days after reaching the 1% down stage, regardless of the date that stage is reached (Maness et al. 2011), so early-fledging birds can leave the colony early and arrive at common for-aging areas before their competitors do. Juvenile Nazca Boobies apparently spend at least part of their time off the Central American coast, possibly a common area for their first year or two at least (Huyvaert and Anderson 2004). Limited data from nonbreeding adults indicate that they stay in the vicinity of the Galápagos (D. J. Anderson unpubl. data) and do not overlap with the juveniles. For birds in general, early breeding is associated with higher juvenile survival probabilities than late breeding (Table 1). Our results implicate both poor parenting and separate temporal effects, such as reduced competition for food, as drivers of the as-sociation in Nazca Boobies.
Cohort size.—CS, our proxy for the environmen-tal quality during and just after the breeding season, was not directly related to juvenile survival (Table 8); rather, it influenced survival indirectly through other predictors of survival. As CS increased, TWS, a positive predictor of survival, increased, while fledging age, a negative predictor of survival, decreased (Figs. 4 and 5). Fledglings, especially females, were heavier and larger (CL) in better breeding seasons (Figs. 4 and 5), while growth rate (age at 1%), especially of males, was faster in better seasons (Figs. 4 and 5). Male fledglings hatched ear-lier in good breeding seasons, but the same was not true of females (Fig. 5). As CS increased, the propor-tion of female fledglings produced in that cohort increased marginally (Fig. 4).
Fledgling Nazca Boobies leave the colony, on average, 45.3 ± 10.0 [SD] days after fledging, re-gardless of sex (Maness et al. 2011). This suggests that the males that fledged at younger ages and from nests initiated earlier in the breeding season did not receive more postfledging care than female fledglings but were able to leave the island earlier, perhaps arriving at common foraging grounds be-fore their female competitors. All of these factors (younger fledging age, heavier TWS, earlier HD, and earlier colony departure dates of male fledg-lings in better seasons) probably contribute to the explanation of their improved survival in those seasons (Fig. 2A).
As CS increased, the proportion of female fledg-lings produced in that cohort increased marginally
(Fig. 4). This suggests that fewer daughters are produced in low-quality breeding seasons, that female nestlings are more likely to die in those sea-sons, or both.
Clutch–brood effect.—Our previous work has re-vealed correlation among various components of parental performance: pairs producing a second egg (acting primarily as insurance; Clifford and Anderson 2001b, Humphries et al. 2006) despite nutritional obstacles to its production (Clifford and Anderson 2001b) have higher success later in the breeding cycle in raising hatched chicks (Clifford and Anderson 2001a, Townsend and Anderson 2007b), and the mothers have higher survival and fecundity in future breeding seasons (Townsend and Anderson 2007b). The CBE variable served as a proxy for this positive covariance of compo-nents of parental performance in our analysis. We use the potentially ambiguous term (Wilson and Nussey 2010) “parental quality” to refer to this composite of reproductive skills, and the CBE as a proxy for parental quality.
The CBE was not directly related to juvenile sur-vival (Table 8) but was positively related to several other predictors that suggested improved paren-tal care, namely faster growth (age at 1%) and earlier HDs in both sexes, and increased TWS in males (Fig. 5). Parental quality is associated with the probability of juvenile survival, but indirectly, and the indirect effect is multifaceted and diffuse, manifesting itself through the CBE’s association with other predictors of juvenile survival. Like all our predictors of survival from the time of inde-pendence to joining a breeding colony, the timing of this indirect effect’s action is unknown, but it should not be assumed to be shortly after fledg-ing, given the evidence of longer-term effects of nestling experience on later performance even into adulthood (Lindström 1999, Saino et al. 2012, Drummond and Rodríguez 2013), including lon-gevity (Feare 2002). This result enlarges the set of fitness-related traits that show positive covari-ance in this species and projects the association between parental quality and reproductive out-come beyond the times of egg laying (Clifford and Anderson 2001a) and chick rearing (Clifford and Anderson 2001a, Townsend and Anderson 2007b) and into the offspring’s early adulthood.
The CBE influenced three different predictors of juvenile survival in the case of sons (HD, age, and TWS), while only influencing two in the case of daughters (HD and age; Fig. 5). Considering the past evidence in this species of a ceiling on

PREDICTORS OF JUVENILE SURVIVAL IN BIRDS 45
reproductive effort (Apanius et al. 2008) and of higher parental-care requirements for daughters than for sons (Townsend et al. 2007, Apanius et al. 2008), we interpret the stronger signal through sons as evidence that parents are more likely to reach the effort ceiling before daughters reach independence than before sons do. To caricature this interpretation in terms of TWS, high-quality parents produce many (cheap) sons at heavy TWS, and low-quality parents produce many sons with weights far below the male target weight, so an ef-fect of parental quality is revealed by the positive correlation. But in the case of parents of daughters, neither high-quality nor low-quality parents will or can, respectively, provide enough care for a daugh-ter to reach the female TWS, damping variation in weights of daughters and, thus, any association between parental quality and the daughter’s TWS.
The fledging sex ratio became more male biased at higher values of the CBE (Fig. 6), and parents that hatched two eggs had a significantly male-biased fledging sex ratio (Fig. 6), a result that seems un-likely to reflect adaptive control of the sex ratio by parents. From the perspective of a sex allocation argument (Fisher 1930, Charnov 1982) based on a higher cost for a daughter, lower-quality parents would be expected to avoid raising daughters. Males and females have similar variances in re-productive success (Maness and Anderson 2007), so the expectation of low-quality parents raising the low-variance sex (Trivers and Willard 1973) does not apply. Daughters have longer disper-sal distances than sons (Huyvaert and Anderson 2004), so both low- and high-quality parents can avoid local resource competition for nesting space (Clark 1978) by overproducing daughters. Other aspects of selection for biased offspring sex ratios (reviewed by Cockburn et al. 2002) appear not to apply to Nazca Boobies. Under this reasoning, the correlation of parental quality and offspring sex ra-tio must result from an unknown adaptive effect, or from a non- or maladaptive effect. Perhaps fe-males are more negatively affected than males by the high androgen level expressed during a sibli-cidal event (Ferree et al. 2004, Müller et al. 2008). Siblicide occurs only in two-egg clutches, and higher-quality parents produce two-egg clutches, so parents of two-egg clutches that produced sons would be favored by selection under this scenario. Alternatively, daughters that experience siblicide could die before fledging more frequently than males do, without any manipulation of the sex ra-tio by high-quality parents. More work, however,
is needed before any definitive conclusions can be made.
The finding that lower-quality parents (low CBE rank) were more likely than high-quality parents to produce a daughter suggests a link between breeding conditions and the fledging sex ratio. During poor breeding conditions, low-quality par-ents may be less likely to breed than high-quality parents, or their offspring may be more likely to die before fledging. Also during poor breeding condi-tions, we suspect that daughters are more likely to die before fledging (because of their higher food requirements; Townsend et al. 2007, Apanius et al. 2008). The combination of these two effects may skew the fledging sex ratio of high-quality parents toward males, even if they produce an even sex ra-tio at hatching (Maness et al. 2007).
Environmental heterogeneity.—Different cohorts of juvenile Nazca Boobies, and different members of the same cohort, may experience different en-vironments after becoming independent. We used cohort size as a proxy for environmental quality during the period of parental care, but it may not reflect conditions after independence reliably, for more than one reason. Chief among these is the movement of juveniles away from Galápagos: band recoveries of living and dead juveniles come from the continental coasts of the Americas from Ecuador to northern Mexico, and oceanic sites up to 3,000 km northwest of Galápagos (Huyvaert and Anderson 2004). Juveniles are thus displaced from the rearing environment in both time and space. We have not attempted to use the environmental conditions experienced by juveniles after indepen-dence to predict their survival, acknowledging significant uncertainty about the distribution of the juvenile population, which extends from the equator to outside the tropics. With better infor-mation on the location of juveniles, and on any age effect on location, informed a priori hypotheses can address specific potential environmental drivers of juvenile survival, such as the El Niño–Southern Oscillation.
Conclusions.—We draw attention to the ef-fectiveness of the analytical approach adopted here. Our multivariate approach allowed us to disentangle the relative importance of indi-vidual predictors of juvenile survival in Nazca Boobies from a group of correlated variables and to determine which predictors influenced survival directly. We found support for both the body-reserve advantage and size advantage hy-potheses, despite the difficulty in disentangling
46 ORNITHOLOGICAL MONOGRAPHS NO. 78
these two possibilities. Growth rate and timing of breeding also were important for juvenile survival. Finally, bringing data from several cohorts together demonstrated that nestling growth was compromised under poor rearing conditions: overall weight fell, the number of days needed to reach fledging status increased, and the growth of some structures, but not others, was reduced. These effects were more pronounced in females and led directly or in-directly to poor survival for females between independence and breeding age. Finally, we found that lower-quality parents were more likely than high-quality parents to produce fe-male fledglings, the larger and apparently more costly sex.
acknowledgMenTs
Online supplemental tables and figures for this mon- ograph are available at dx.doi.org/10.1525/om .2013.78.1.1. We thank the Galápagos National Park Ser- vice for permission to work in the park; the Charles Darwin Research Station, TAME Airline, and Doris Welch (Ecoventura) for logistical support; the National Geographic Society and Wake Forest University for research funding; our many field workers and col-leagues for assistance in producing our long-term data-bases; A. Calkins and A. D’Epagnier for lab work; and K. Huyvaert, H. Townsend, the members of the Anderson lab group, L. Anderson, K. Dugger, S. Forbes, and M. Morrison for comments on the manuscript. This material is based on work supported primarily by the National Science Foundation under grant nos. DEB 93045679, DEB 9629539, DEB 98-06606, DEB 0235818, and DEB 0842199 to D.J.A.
liTeraTure ciTed
aerTs, l., and F. a. van assche. 2002. Taurine and taurine-deficiency in the perinatal period. Jour-nal of Perinatal Medicine 30:281–286.
alaTalo, r. v., and a. lundberg. 1986. Heritability and selection on tarsus length in the Pied Flycatcher (Ficedula hypoleuca). Evolution 40:574–583.
anders, a. d., d. c. dearborn, J. Faaborg, and F. r. ThoMpson iii. 1997. Juvenile survival in a popula-tion of Neotropical migrant birds. Conservation Biology 11:698–707.
anderson, d. J. 1989. The role of hatching asynchrony in siblicidal brood reduction of two booby species. Behavioral Ecology and Sociobiology 25:363–368.
anderson, d. J. 1990. Evolution of obligate siblicide in boobies. 1. A test of the insurance-egg hypoth-esis. American Naturalist 135:334–350.
anderson, d. J., and v. apanius. 2003. Actuarial and reproductive senescence in a long-lived seabird: Pre-liminary evidence. Experimental Gerontology 38: 757–760.
anderson, d. J., e. T. porTer, and e. d. Ferree. 2004. Non-breeding Nazca Boobies (Sula granti) show social and sexual interest in chicks: Behavioural and ecological aspects. Behaviour 141:959–978.
anderson, d. J., J. reeve, J. e. M. goMez, w. w. weaTh-ers, s. huTson, h. v. cunninghaM, and d. M. bird. 1993. Sexual size dimorphism and food requirements of nestling birds. Canadian Journal of Zoology 71: 2541–2545.
anderson, d. r. 2008. Model Based Inference in the Life Sciences: A Primer on Evidence. Springer Science + Business Media, New York.
apanius, v., and i. c. T. nisbeT. 2006. Serum immuno-globulin G levels are positively related to reproductive performance in a long-lived seabird, the Common Tern (Sterna hirundo). Oecologia 147:12–23.
apanius, v., M. a. wesTbrock, and d. J. anderson. 2008. Reproduction and immune homeostasis in a long-lived seabird, the Nazca Booby (Sula granti). Ornithological Monographs, no. 65.
ardia, d. r. 2005. Super size me: An experimental test of the factors affecting lipid content and the abil-ity of residual body mass to predict lipid stores in nestling European Starlings. Functional Ecology 19: 414–420.
arnold, k. e., J. d. blounT, n. b. MeTcalFe, k. J. orr, a. adaM, d. housTon, and p. Monaghan. 2007a. Sex-specific differences in compensation for poor neonatal nutrition in the Zebra Finch Taeniopygia guttata. Journal of Avian Biology 38:356–366.
arnold, k. e., s. l. raMsay, c. donaldson, and a. adaM. 2007b. Parental prey selection affects risk-taking behaviour and spatial learning in avian offspring. Proceedings of the Royal Society of Lon-don, Series B 274:2563–2569.
arroyo, b. 2002. Sex-biased nestling mortality in the Montagu’s Harrier Circus pygargus. Journal of Avian Biology 33:455–460.
bailey, l. l., s. J. converse, and w. l. kendall. 2010. Bias, precision, and parameter redundancy in com-plex multistate models with unobservable states. Ecology 91:1598–1604.
benJaMini, y., and y. hochberg. 1995. Controlling the false discovery rate: A practical and powerful approach to multiple testing. Journal of the Royal Statistical Society, Series B 57:289–300.
berkeley, l. i., J. p. MccarTy, and l. l. wolFenbarger. 2007. Postfledging survival and movement in Dick-cissels (Spiza americana): Implications for habitat management and conservation. Auk 124:396–409.
bernardo, J. 1996. The particular maternal effect of propagule size, especially egg size: Patterns, models, quality of evidence and interpretations. American Zoologist 36:216–236.

PREDICTORS OF JUVENILE SURVIVAL IN BIRDS 47
biro, p. a., and J. a. sTaMps. 2008. Are animal personal-ity traits linked to life-history productivity? Trends in Ecology & Evolution 23:361–368.
blounT, J. d., n. b. MeTcalFe, k. e. arnold, p. F. surai, g. l. devevey, and p. Monaghan. 2003. Neonatal nutrition, adult antioxidant defences and sexual attractiveness in the Zebra Finch. Proceedings of the Royal Society of London, Series B 270:1691–1696.
bluMs, p., r. g. clark, and a. Mednis. 2002. Patterns of reproductive effort and success in birds: Path analyses of long-term data from European ducks. Journal of Animal Ecology 71:280–295.
boTh, c., M. e. visser, and n. verboven. 1999. Density-dependent recruitment rates in Great Tits: The importance of being heavier. Proceedings of the Royal Society of London, Series B 266:465–469.
braasch, a., c. schauroTh, and p. h. becker. 2009. Post-fledging body mass as a determinant of subadult survival in Common Terns Sterna hirundo. Journal of Ornithology 150:401–407.
breiTwisch, r. 1989. Mortality patterns, sex ratios, and parental investment in monogamous birds. Pages 1–50 in Current Ornithology, vol. 6 (D. M. Power, Ed.). Plenum Press, New York.
brinkhoF, M. w. g., a. J. cave, and a. c. perdeck. 1997. The seasonal decline in the first-year survival of juvenile coots: An experimental approach. Journal of Animal Ecology 66:73–82.
brown, c. r., and M. b. brown. 1999. Fitness compo-nents associated with laying date in the Cliff Swal-low. Condor 101:230–245.
brown, w. p., and r. r. roTh. 2004. Juvenile survival and recruitment of Wood Thrushes Hylocichla mustelina in a forest fragment. Journal of Avian Biology 35: 316–326.
burnhaM, k. p., and d. r. anderson. 2002. Model Selection and Multimodel Inference: A Practical Information-Theoretical Approach, 2nd ed. Springer-Verlag, New York.
burnhaM, k. p., d. r. anderson, and k. p. huyvaerT. 2011. AIC model selection and multimodel inference in behavioral ecology: Some background, observa-tions, and comparisons. Behavioral Ecology and Sociobiology 65:23–35.
byrne, b. M. 2009. Structural Equations Modeling with AMOS: Basic Concepts, Applications, and Pro-gramming, 2nd ed. Taylor & Francis, New York.
caM, e., J.-y. MonnaT, and J. e. hines. 2003. Long-term fitness consequences of early conditions in the kitti-wake. Journal of Animal Ecology 72:411–424.
caTry, p., n. raTcliFFe, and r. w. Furness. 1998. The influence of hatching date on different life-history stages of Great Skuas Catharacta skua. Journal of Avian Biology 29:299–304.
chargé, r., g. sorci, y. hingraT, F. lacroix, and M. sainT JalMe. 2011. Immune-mediated change in the expression of a sexual trait predicts offspring sur-vival in the wild. PLoS ONE 6(10):e25305.
charnov, e. l. 1982. The Theory of Sex Allocation. Monographs in Population Biology No. 18. Princ-eton University Press, Princeton, New Jersey.
chesser, r. T., r. c. banks, F. k. barker, c. cicero, J. l. dunn, a. w. kraTTer, i. J. loveTTe, p. c. rasMussen, J. v. reMsen, Jr., J. d. rising, d. F. sToTz, and k. winkler. 2010. Fifty-first supplement to the Ameri-can Ornithologists’ Union Check-list of North American Birds. Auk 127:726–744.
chin, e. h., o. p. love, J. J. verspoor, T. d. williaMs, k. rowley, and g. burness. 2009. Juveniles exposed to embryonic corticosterone have enhanced flight performance. Proceedings of the Royal Society of London, Series B 276:499–505.
chrisTe, p., F. de lope, g. gonzález, n. saino, and a. p. Møller. 2001. The influence of environmental con-ditions on immune responses, morphology and recapture probability of nestling House Martins (Delichon urbica). Oecologia 126:333–338.
clark, a. b. 1978. Sex ratio and local resource competi-tion in a prosimian primate. Science 201:163–165.
cleasby, i. r., s. nakagawa, d. o. s. gillespie, and T. burke. 2010. The influence of sex and body size on nestling survival and recruitment in the House Spar-row. Biological Journal of the Linnean Society 101: 680–688.
cliFFord, l. d., and d. J. anderson. 2001a. Experimen-tal demonstration of the insurance value of extra eggs in an obligately siblicidal seabird. Behavioral Ecology 12:340–347.
cliFFord, l. d., and d. J. anderson. 2001b. Food limita-tion explains most clutch size variation in the Nazca Booby. Journal of Animal Ecology 70:539–545.
cluTTon-brock, T. h. 1991. The Evolution of Parental Care. Princeton University Press, Princeton, New Jersey.
cockburn, a., s. legge, and M. c. double. 2002. Sex ratios in birds and mammals: Can the hypotheses be disentangled? Pages 266–286 in Sex Ratios: Con-cepts and Research Methods (I. C. W. Hardy, Ed.). Cambridge University Press, Cambridge, United Kingdom.
cooch, e. g. 2002. Fledging size and survival in snow geese: Timing is everything (or is it?). Journal of Applied Statistics 29:143–162.
cooke, F., c. s. Findlay, and r. F. rockwell. 1984. Recruit-ment and the timing of reproduction in Lesser Snow Geese (Chen caerulescens caerulescens). Auk 101:451–458.
coulson, J. c., and J. M. porTer. 1985. Reproductive suc-cess of the kittiwake Rissa tridactyla: The roles of clutch size, chick growth rates and parental quality. Ibis 127:450–466.
covas, r., c. r. brown, M. d. anderson, and M. b. brown. 2002. Stabilizing selection on body mass in the Sociable Weaver Philetairus socius. Proceed-ings of the Royal Society of London, Series B 269: 1905–1909.
48 ORNITHOLOGICAL MONOGRAPHS NO. 78
cronMiller, J. r., and c. F. ThoMpson. 1981. Sex ratio adjustment in malnourished Red-winged Black-birds. Journal of Field Ornithology 52:65–67.
curran-evereTT, d. 2000. Multiple comparisons: Phi-losophies and illustrations. American Journal of Physiology Regulatory, Integrative and Compara-tive Physiology 279:R1–R8.
daisley, J. n., v. broMundT, e. MösTl, and k. koTrschal. 2005. Enhanced yolk testosterone influences behav-ioral phenotype independent of sex in Japanese Quail chicks Coturnix japonica. Hormones and Behavior 47:185–194.
davies, J. M., and M. resTani. 2006. Survival and move-ments of juvenile Burrowing Owls during the post-fledging period. Condor 108:282–291.
davies, n. b. 1986. Reproductive success of dunnocks, Prunella modularis, in a variable mating system. I. Factors influencing provisioning rate, nestling weight and fledging. Journal of Animal Ecology 55:123–138.
dawson, r. d., and r. g. clark. 2000. Effects of hatch-ing date and egg size on growth, recruitment, and adult size of Lesser Scaup. Condor 102:930–935.
de sTeven, d. 1980. Clutch size, breeding success, and parental survival in the Tree Swallow (Iridoprocne bicolor). Evolution 34:278–291.
dhondT, a. a. 1979. Summer dispersal and survival of juvenile Great Tits in southern Sweden. Oecologia 42: 139–157.
dieTrich, v. c. J., T. schMoll, w. winkel, and T. lubJuhn. 2003. Survival to first breeding is not sex-specific in the Coal Tit (Parus ater). Journal für Ornithologie 144:148–156.
dolan, a. c., M. T. Murphy, l. J. redMond, and d. duFField. 2009. Maternal characteristics and the production and recruitment of sons in the Eastern Kingbird (Tyrannus tyrannus). Behavioral Ecology and Sociobiology 63:1527–1537.
druMMond, h., e. gonzalez, and J. l. osorno. 1986. Parent-offspring cooperation in the Blue-footed Booby (Sula nebouxii): Social roles in infanticial brood reduction. Behavioral Ecology and Sociobiology 19:365–372.
druMMond, h., and c. rodríguez. 2013. Costs of grow-ing up as a subordinate sibling are passed to the next generation in Blue-footed Boobies. Journal of Evolutionary Biology 26:625–634.
dzus, e. h., and r. g. clark. 1998. Brood survival and recruitment of Mallards in relation to wetland den-sity and hatching date. Auk 115:311–318.
eising, c. M., c. eikenaar, h. schwabl, and T. g. g. grooThuis. 2001. Maternal androgens in Black-headed Gull (Larus ridibundus) eggs: Consequences for chick development. Proceedings of the Royal Society of London, Series B 268:839–846.
eising, c. M., w. Müller, and T. g. g. grooThuis. 2006. Avian mothers create different phenotypes by hormone deposition in their eggs. Biology Letters 2:20–22.
elgar, M. a. 1990. Evolutionary compromise between a few large and many small eggs: Comparative evi-dence in teleost fish. Oikos 59:283–287.
eraud, c., a. JacqueT, and p. legagneux. 2011. Post-fledging movements, home range, and survival of juvenile Eurasian Collared-Doves in Western France. Condor 113:150–158.
ericson, p. g. p., c. l. anderson, T. briTTon, a. elza-nowski, u. s. Johansson, M. kallersJo, J. i. ohl-son, T. J. parsons, d. zuccon, and g. Mayr. 2006. Diversification of Neoaves: Integration of molecu-lar sequence data and fossils. Biology Letters 2: 543–547.
eriksTad, k. e., p. Fauchald, T. Tveraa, and h. sTeen. 1998. On the cost of reproduction in long-lived birds: The influence of environmental variability. Ecology 79:1781–1788.
Feare, c. J. 2002. Influence of date and body mass at fledging on long-term survival of Sooty Terns Sterna fuscata. Marine Ornithology 30:46–47.
Ferree, e. d., M. c. wikelski, and d. J. anderson. 2004. Hormonal correlates of siblicide in Nazca Boobies: Support for the challenge hypothesis. Hormones and Behavior 46:655–662.
Fiala, k. l., and J. d. congdon. 1983. Energetic conse-quences of sexual size dimorphism in nestling Red-winged Blackbirds. Ecology 64:642–647.
Fisher, r. a. 1930. The Genetical Theory of Natural Selec-tion. Clarendon Press, Oxford, United Kingdom.
Forbes, s., r. grosshans, and b. glassey. 2002. Multiple incentives for parental optimism and brood reduc-tion in blackbirds. Ecology 83:2529–2541.
Fox, c. w., and M. e. czesak. 2000. Evolutionary ecol-ogy of progeny size in arthropods. Annual Review of Entomology 45:341–369.
Francis, c. M., M. h. richards, F. cooke, and r. F. rock-well. 1992. Long-term changes in survival rates of Lesser Snow Geese. Ecology 73:1346–1362.
FridolFsson, a. k., and h. ellegren. 1999. A simple and universal method for molecular sexing of non-rat-ite birds. Journal of Avian Biology 30:116–121.
FuJioka, M. 1985. Sibling competition and siblicide in asynchronously-hatching broods of the Cattle Egret Bubulcus ibis. Animal Behaviour 33: 1228–1242.
garneTT, M. c. 1981. Body size, its heritability and influence on juvenile survival among Great Tits, Parus major. Ibis 123:31–41.
garson, g. d. 2012. Path Analysis. Statistical Associ-ates, Asheboro, North Carolina.
gasTon, a. J. 1997. Mass and date at departure affect the survival of Ancient Murrelet Synthliboramphus anti-quus chicks after leaving the colony. Ibis 139:673–678.
gebhardT-henrich, s., and h. richner. 1998. Causes of growth variation and its consequences for fitness. Pages 324–339 in Avian Growth and Development: Evolution within the Altricial–Precocial Spectrum (J. M. Starck and R. E. Ricklefs, Eds.). Oxford Univer-sity Press, Oxford, United Kingdom.
PREDICTORS OF JUVENILE SURVIVAL IN BIRDS 49
gibbons, d. 1987. Hatching asynchrony reduces paren-tal investment in the jackdaw. Journal of Animal Ecology 56:403–414.
giMenez, o., a. grégoire, and T. lenorMand. 2009. Estimating and visualizing fitness surfaces using mark–recapture data. Evolution 63:3097–3105.
goodMan, d. 1974. Natural selection and a cost ceiling on reproductive effort. American Naturalist 108: 247–268.
grace, J. k., k. dean, M. a. oTTinger, and d. J. anderson. 2011. Hormonal effects of maltreatment in Nazca Booby nestlings: Implications for the “cycle of violence.” Hormones and Behavior 60:78–85.
grahaM, M. h. 2003. Confronting multicollinearity in ecological multiple regression. Ecology 84:2809–2815.
grande, J. M., d. serrano, g. Tavecchia, M. carreTe, o. ceballos, r. díaz-delgado, J. l. Tella, and J. a. donázar. 2009. Survival in a long-lived territorial migrant: Effects of life-history traits and ecological conditions in wintering and breeding areas. Oikos 118:580–590.
green, a. J. 2001. Mass/length residuals: Measures of body condition or generators of spurious results? Ecology 82:1473–1483.
green, d. J., and a. cockburn. 2001. Post-fledging care, philopatry and recruitment in Brown Thornbills. Journal of Animal Ecology 70:505–514.
greenwood, p. J. 1980. Mating systems, philopatry and dis-persal in birds and mammals. Animal Behaviour 28: 140–162.
greño, J. l., e. J. belda, and e. barba. 2008. Influence of temperatures during the nestling period on post-fledging survival of Great Tit Parus major in a Mediterranean habitat. Journal of Avian Biology 39: 41–49.
griFFiThs, r., M. c. double, k. orr, and r. J. g. dawson. 1998. A DNA test to sex most birds. Molecular Ecol-ogy 7:1071–1075.
grooThuis, T. g. g., and h. schwabl. 2002. Determinants of within- and among-clutch variation in levels of maternal hormones in Black-Headed Gull eggs. Functional Ecology 16:281–289.
grooThuis, T. g. g., and h. schwabl. 2008. Hormone-mediated maternal effects in birds: Mechanisms matter but what do we know of them? Philosophi-cal Transactions of the Royal Society of London, Series B 363:1647–1661.
grüebler, M. u., and b. naeF-daenzer. 2008. Fitness consequences of pre- and post-fledging timing decisions in a double-brooded passerine. Ecology 89:2736–2745.
grüebler, M. u., and b. naeF-daenzer. 2010. Fitness consequences of timing of breeding in birds: Date effects in the course of a reproductive episode. Journal of Avian Biology 41:282–291.
gusTaFsson, l., and w. J. suTherland. 1988. The costs of reproduction in the Collared Flycatcher Ficedula albicollos. Nature 335:813–815.
hackeTT, s. J., r. T. kiMball, s. reddy, r. c. k. bowie, e. l. braun, M. J. braun, J. l. choJnowski, w. a. cox, k.-l. han, J. harshMan, c. J. huddlesTon, b. d. Marks, k. J. Miglia, w. s. Moore, F. h. sheldon, d. w. sTeadMan, c. c. wiTT, and T. yuri. 2008. A phylogenomic study of birds reveals their evolution-ary history. Science 320:1763–1768.
haFner, h., y. kayser, v. boy, M. Fasola, a.-c. Julliard, r. pradel, and F. cézilly. 1998. Local survival, natal dispersal, and recruitment in Little Egrets Egretta garzetta. Journal of Avian Biology 29:216–227.
harris, M. p., s. T. buckland, s. M. russell, and s. wanless. 1994. Post fledging survival to breeding age of shags Phalacrocorax aristotelis in relation to year, date of fledging and brood size. Journal of Avian Biology 25:268–274.
harris, M. p., M. Frederiksen, and s. wanless. 2007. Within- and between-year variation in the juvenile survival of Common Guillemots Uria aalge. Ibis 149:472–481.
harris, M. p., d. J. halley, and s. wanless. 1992. The post-fledging survival of young guillemots Uria aalge in relation to hatching date and growth. Ibis 134:335–339.
harris, M. p., and p. roThery. 1985. The post-fledging survival of young puffins Fratercula arctica in rela-tion to hatching date and growth. Ibis 127:243–250.
hayward, l. s., J. b. richardson, M. n. grogan, and J. c. wingField. 2006. Sex differences in the organi-zational effects of corticosterone in the egg yolk of quail. General and Comparative Endocrinology 146: 144–148.
hayward, l. s., and J. c. wingField. 2004. Maternal corti-costerone is transferred to avian yolk and may alter offspring growth and adult phenotype. General and Comparative Endocrinology 135:365–371.
hedgren, s. 1981. Effects of fledging weight and time of fledging on survival of guillemot Uria aalge chicks. Ornis Scandinavica 12:51–54.
hepp, g. r., r. a. kennaMer, and w. F. harvey iv. 1989. Recruitment and natal philopatry of Wood Ducks. Ecology 70:897–903.
heTMański, T. 2007. The timing of fledging and annual post-fledging survival of juvenile feral pigeons, Columba livia, in a city area (Pomerania, NW Poland). Polish Journal of Ecology 55:367–375.
heTMański, T., and M. barkowska. 2008. Breedingparameters and recruitment in feral pigeons Columba livia f. domestica. Acta Ornithologica 43:159–166.
hipFner, J. M. 2001. Fitness-related consequences of relaying in an Arctic seabird: Survival of offspring to recruitment age. Auk 118:1076–1080.
hipkiss, T., b. hornFeldT, u. eklund, and s. berlin. 2002. Year-dependent sex-biased mortality in supplementary-fed Tengmalm’s Owl nestlings. Journal of Animal Ecology 71:693–699.
50 ORNITHOLOGICAL MONOGRAPHS NO. 78
ho, d. h., and w. w. burggren. 2010. Epigenetics and transgenerational transfer: A physiological perspec-tive. Journal of Experimental Biology 213:3–16.
hochachka, w., and J. n. M. sMiTh. 1991. Determinants and consequences of nestling condition in Song Spar-rows. Journal of Animal Ecology 60:995–1008.
horvaTh, M. b., b. MarTinez-cruz, J. J. negro, l. kalMar, and J. a. godoy. 2005. An overlooked DNA source for non-invasive genetic analysis in birds. Journal of Avian Biology 36:84–88.
howe, h. F. 1977. Sex-ratio adjustment in the Common Grackle. Science 198:744–746.
huMphries, c. a., v. d. arevalo, k. n. Fischer, and d. J. anderson. 2006. Contributions of marginal offspring to reproductive success of Nazca Booby (Sula granti) parents: Tests of multiple hypotheses. Oecologia 147:379–390.
husby, M., and T. slagsvold. 1992. Post-fledging behav-iour and survival in male and female magpies Pica pica. Ornis Scandinavica 23:483–490.
huyvaerT, k. p., and d. J. anderson. 2004. Limited dispersal by Nazca Boobies Sula granti. Journal of Avian Biology 35:46–53.
hylTon, r. a., p. c. Frederick, T. e. de la FuenTe, and M. g. spalding. 2006. Effects of nestling health on post-fledging survival of Wood Storks. Condor 108:97–106.
Jakob, e. M., s. d. Marshall, and g. w. ueTz. 1996. Estimating fitness: A comparison of body condition indices. Oikos 77:61–67.
Jarvis, M. J. F. 1974. The ecological significance of clutch size in the South African Gannet (Sula capensis). Journal of Animal Ecology 43:1–17.
Johannesen, e., d. housTon, and J. russell. 2003. Increased survival and breeding performance of double breeders in Little Penguins Eudyptula minor, New Zealand: Evidence for individual bird qual-ity? Journal of Avian Biology 34:198–210.
Jones, k. s., s. nakagawa, and b. c. sheldon. 2009. Environmental sensitivity in relation to size and sex in birds: Meta-regression analysis. American Naturalist 174:122–133.
keedwell, r. J. 2003. Does fledging equal success? Post-fledging mortality in the Black-fronted Tern. Journal of Field Ornithology 74:217–221.
kershner, e. l., J. w. walk, and r. e. warner. 2004. Postfledging movements and survival of juvenile Eastern Meadowlarks (Sturnella magna) in Illinois. Auk 121:1146–1154.
kersTen, M., and a. brenninkMeiJer. 1995. Growth, fledging success and post-fledging survival of juve-nile oystercatchers Haematopus ostralegus. Ibis 137:396–404.
kiTaysky, a. s., e. v. kiTaiskaia, J. F. piaTT, and J. c. wingField. 2003. Benefits and costs of increased lev-els of corticosterone in seabird chicks. Hormones and Behavior 43:140–149.
kline, r. b. 1998. Principles and Practice of Structural Equation Modeling. Guilford Press, New York.
kloskowski, J. 2003. Brood reduction in the Red-necked Grebe Podiceps griseigena. Ibis 145:233–243.
kreMenTz, d. g., J. d. nichols, and J. e. hines. 1989. Postfledging survival of European Starlings. Ecol-ogy 70:646–655.
kruuk, l. e. b., b. c. sheldon, and J. Merilä. 2002. Severe inbreeding depression in Collared Flycatch-ers (Ficedula albicollis). Proceedings of the Royal Society of London, Series B 269:1581–1589.
lack, d. 1954. The Natural Regulation of Animal Num-bers. Clarendon Press, Oxford, United Kingdom.
lack, d. 1966. Population Studies of Birds. Oxford Uni-versity Press, Oxford, United Kingdom.
leeTon, p., l. chrisTidis, and M. wesTerMan. 1993. Feathers from museum bird skins—A good source of DNA for phylogenetic studies. Condor 95:465–466.
legge, s. 2002. Siblicide, starvation and nestling growth in the Laughing Kookaburra. Journal of Avian Biol-ogy 33:159–166.
lescroël, a., g. ballard, v. Toniolo, k. J. barTon, p. r. wilson, p. o. lyver, and d. g. ainley. 2010. Work-ing less to gain more: When breeding quality relates to foraging efficiency. Ecology 91:2044–2055.
lichT, M. h. 1995. Multiple regression and correlation. Pages 19–64 in Reading and Understanding Mul-tivariate Statistics (L. G. Grimm and P. R. Yarnold, Eds.). American Psychological Association, Wash-ington, D.C.
lindén, M., l. gusTaFsson, and T. pärT. 1992. Selection on fledgling mass in the Collared Flycatcher and the Great Tit. Ecology 73:336–343.
lindsTröM, J. 1999. Early development and fitness in birds and mammals. Trends in Ecology & Evolu-tion 14:343–348.
lloyd, c. s. 1979. Factors affecting breeding of Razor-bills Alca torda on Skokholm. Ibis 121:165–176.
lloyd, p., w. a. Taylor, M. a. du plessis, and T. e. MarTin. 2009. Females increase reproductive invest-ment in response to helper-mediated improvements in allo-feeding, nest survival, nestling provisioning and post-fledging survival in the Karoo Scrub-Robin Cercotrichas coryphaeus. Journal of Avian Biology 40:400–411.
lobaTo, e., J. Moreno, s. Merino, J. J. sanz, and e. arriero. 2005. Haematological variables are good predictors of recruitment in nestling Pied Flycatchers (Ficedula hypoleuca). Écoscience 12:27–34.
loMan, J. 1977. Factors affecting clutch and brood size in the crow, Corvus cornix. Oikos 29:294–301.
longcore, J. r., d. g. Mcauley, and c. Frazer. 1991. Survival of postfledging female American Black Ducks. Journal of Wildlife Management 55: 573–580.
lópez-rull, i., p. celis, c. salaberria, M. puerTa, and d. gil. 2011. Post-fledging recruitment in relation to nestling plasma testosterone and immunocompe-tence in the Spotless Starling. Functional Ecology 25: 500–508.
PREDICTORS OF JUVENILE SURVIVAL IN BIRDS 51
low, M., and T. pärT. 2009. Patterns of mortality for each life-history stage in a population of the endan-gered New Zealand Stitchbird. Journal of Animal Ecology 78:761–771.
lukacs, p. M., k. p. burnhaM, and d. r. anderson. 2010. Model selection bias and Freedman’s paradox. Annals of the Institute of Statistical Mathematics 62: 117–125.
Maccoll, a. d. c., and b. J. haTchwell. 2003. Heritabil-ity of parental effort in a passerine bird. Evolution 57: 2191–2195.
MagraTh, M. J. l., e. van lieshouT, g. h. visser, and J. koMdeur. 2004. Nutritional bias as a new mode of adjusting sex allocation. Proceedings of the Royal Society of London, Series B 271:S347–S349.
MagraTh, r. d. 1989. Hatch asynchrony and reproduc-tive success in the blackbird. Nature 339:536–538.
MagraTh, r. d. 1991. Nestling weight and juvenile survival in the blackbird, Turdus merula. Journal of Animal Ecology 60:335–351.
Maness, T. J., and d. J. anderson. 2007. Serial monogamy and sex ratio bias in Nazca Boobies. Proceedings of the Royal Society of London, Series B 274:2047–2054.
Maness, T. J., and d. J. anderson. 2008. Mate rotation by female choice and coercive divorce in Nazca Boo-bies, Sula granti. Animal Behaviour 76:1267–1277.
Maness, T. J., M. a. wesTbrock, and d. J. anderson. 2007. Ontogenic sex ratio variation in Nazca Boobies ends in male-biased adult sex ratio. Waterbirds 30: 10–16.
Maness, T. J., M. a. wesTbrock, k. J. Feeley, and d. J. anderson. 2011. Offspring sex and duration of post-fledging parental care in the sexually size dimorphic Nazca Booby (Sula granti). Neotropical Ornithology 22:347–359.
Marshall, d. J., T. F. bolTon, and M. J. keough. 2003. Offspring size affects the post-metamorphic perfor-mance of a colonial marine invertebrate. Ecology 84:3131–3137.
Marshall, d. J., and M. J. keough. 2007. The evolution-ary ecology of offspring size in marine invertebrates. Pages 1–60 in Advances in Marine Biology, vol. 53 (D. W. Sims, Ed.). Elsevier, San Francisco, California.
Marshall, d. J., and M. J. keough. 2009. Does inter-specific competition affect offspring provisioning? Ecology 90:487–495.
MarTín, c. a., J. c. alonso, J. a. alonso, c. palacín, M. Magaña, and b. MarTín. 2007. Sex-biased juvenile survival in a bird with extreme size dimorphism, the Great Bustard Otis tarda. Journal of Avian Biology 38:335–346.
MarTin, k., and s. J. hannon. 1987. Natal philopatry and recruitment of Willow Ptarmigan in north cen-tral and northwestern Canada. Oecologia 71:518–524.
Mauck, r. a., and T. c. grubb, Jr. 1995. Petrel par-ents shunt all experimentally increased reproduc-tive costs to their offspring. Animal Behaviour 49: 999–1008.
Mcclung, M. r., p. J. seddon, M. Massaro, and a. n. seTiawan. 2004. Nature-based tourism impacts on Yellow-eyed Penguins Megadyptes antipodes: Does unregulated visitor access affect fledging weight and juvenile survival? Biological Conservation 119: 279–285.
McFadzen, M. e., and J. M. MarzluFF. 1996. Mortality of Prairie Falcons during the fledging-dependence period. Condor 98:791–800.
MeaThrel, c. e., and M. J. carey. 2007. How important are intrinsic factors to natal recruitment in Short-tailed Shearwaters Puffinus tenuirostris? Journal of Ornithology 148:S385–S393.
Medeiros, M. c., and l. a. Freed. 2009. A fledgling-mass threshold greatly affects juvenile survival in the Hawaii Akepa (Loxops coccineus coccineus). Auk 126:319–325.
Menu, s., g. gauThier, and a. reed. 2005. Survival of young Greater Snow Geese (Chen caerulescens atlan-tica) during fall migration. Auk 122:479–496.
MiddleTon, h. a., and d. J. green. 2008. Correlates of postfledging survival, the timing of dispersal, and local recruitment in American Dippers. Canadian Journal of Zoology 86:875–881.
Mock, d. w., and g. a. parker. 1997. The Evolution of Sibling Rivalry. Oxford University Press, Oxford, United Kingdom.
Molina-Morales, M., J. g. MarTínez, and J. M. avilés. 2012. Factors affecting natal and breeding magpie dispersal in a population parasitized by the Great Spotted Cuckoo. Animal Behaviour 83:671–680.
Monrós, J. s., e. J. belda, and e. barba. 2002. Post-fledging survival of individual Great Tits: The effect of hatching date and fledging mass. Oikos 99:481–488.
Moreno, J., s. Merino, J. J. sanz, e. arriero, J. Morales, and g. ToMás. 2005. Nestling cell- mediated immune response, body mass and hatching date as predic-tors of local recruitment in the Pied Flycatcher Ficedula hypoleuca. Journal of Avian Biology 36:251–260.
Morrison, k. w., J. M. hipFner, c. gJerdruM, and d. J. green. 2009. Wing length and mass at fledging pre-dict local juvenile survival and age at first return in Tufted Puffins. Condor 111:433–441.
Müller, M., g. pasinelli, k. schiegg, r. spaar, and l. Jenni. 2005. Ecological and social effects on repro-duction and local recruitment in the Red-backed Shrike. Oecologia 143:37–50.
Müller, M. s., J. F. brennecke, e. T. porTer, M. a. oTTinger, and d. J. anderson. 2008. Perinatal androgens and adult phenotype vary with nest-ling social system in siblicidal boobies. PLoS ONE 3(6):e2460.
Müller, M. s., e. T. porTer, J. k. grace, J. a. awkerMan, k. T. birchler, a. r. gunderson, e. g. schneider, M. a. wesTbrock, and d. J. anderson. 2011. Malt-reated nestlings exhibit correlated maltreatment as
52 ORNITHOLOGICAL MONOGRAPHS NO. 78
adults: Evidence of a “cycle of violence” in Nazca Boobies (Sula granti). Auk 128:615–619.
Mulvihill, r. s., r. c. leberMan, and d. s. wood. 1992. A possible relationship between reversed sexual size dimorphism and reduced male survivorship in the Ruby-throated Hummingbird. Condor 94:480–489.
MuMMe, r. l. 1992. Do helpers increase reproductive success? Behavioral Ecology and Sociobiology 31: 319–328.
naeF-daenzer, l., b. naeF-daenzer, and r. g. nager. 2000. Prey selection and foraging performance of breeding Great Tits Parus major in relation to food availability. Journal of Avian Biology 31:206–214.
naeF-daenzer, b., F. widMer, and M. nuber. 2001. Dif-ferential post-fledging survival of Great and Coal tits in relation to their condition and fledging date. Journal of Animal Ecology 70:730–738.
nelson, J. b. 1978. The Sulidae: Gannets and Boobies. Oxford University Press, Oxford, United Kingdom.
newTon, i. 1979. Population Ecology of Raptors. T. & A. D. Poyser, Berkhamstead, United Kingdom.
newTon, i., and d. Moss. 1986. Post-fledging survival of sparrowhawks Accipiter nisus in relation to mass, brood size and brood composition at fledging. Ibis 128: 73–80.
nisbeT, i. c. T., and w. h. drury. 1972. Post-fledging survival in Herring Gulls in relation to brood-size and date of hatching. Bird-Banding 43:161–172.
nisbeT, i. c. T., J. s. haTField, w. a. link, and J. a. spendelow. 1999. Predicting chick survival and productivity of Roseate Terns from data on early growth. Waterbirds 22:90–97.
nisbeT, i. c. T., J. a. spendelow, J. s. haTField, J. M. zingo, and g. a. gough. 1998. Variations in growth of Roseate Tern chicks: II. Early growth as an index of parental quality. Condor 100:305–315.
norTe, a. c., J. a. raMos, p. M. arúJo, J. p. sousa, and b. c. sheldon. 2008. Health-state variables and enzymatic biomarkers as survival predictors in nestling Great Tits (Parus major): Effects of envi-ronmental conditions. Auk 125:943–952.
nowicki, s., w. a. searcy, and s. peTers. 2002. Brain development, song learning and mate choice in birds: A review and experimental test of the “nutri-tional stress hypothesis.” Journal of Comparative Physiology A 188:1003–1014.
nur, n. 1984. The consequences of brood size for breeding Blue Tits II: Nestling weight, offspring survival and optimal brood size. Journal of Animal Ecology 53: 497–517.
olsen, p. d., and a. cockburn. 1991. Female-biased sex allocation in Peregrine Falcons and other raptors. Behavioral Ecology and Sociobiology 28:417–423.
olsson, o. 1997. Effects of food availability on fledging condition and post-fledging survival in King Pen-guin chicks. Polar Biology 18:161–165.
owen, M., and J. M. black. 1989. Factors affecting the survival of Barnacle Geese on migration from the
breeding grounds. Journal of Animal Ecology 58: 603–617.
parsons, J., g. chabrzyk, and n. duncan. 1976. Effects of hatching date on post-fledging survival in Her-ring Gulls. Journal of Animal Ecology 45:667–675.
peduzzi, p., J. concaTo, e. keMper, T. r. holFord, and a. FeinsTein. 1996. A simulation study of the number of events per variable in logistic regres-sion analysis. Journal of Clinical Epidemiology 99:1373–1379.
perrins, c. M. 1965. Population fluctuations and clutch size in the Great Tit, Parus major L. Journal of Ani-mal Ecology 34:601–647.
perrins, c. M. 1966. Survival of young Manx Shearwa-ters Puffinus puffinus in relation to their presumed date of hatching. Ibis 108:132–135.
perrins, c. M. 1970. The timing of birds’ breeding sea-sons. Ibis 112:242–255.
perrins, c. M., M. p. harris, and c. k. briTTon. 1973. Sur-vival of Manx Shearwaters Puffinus puffinus. Ibis 115:535–548.
phillips, r. a., and r. w. Furness. 1998. Measurement of heritability of hatching date and chick condition in Parasitic Jaegers. Canadian Journal of Zoology 76: 2290–2294.
ponz Miranda, a., J. a. gil-delgado alberTi, and g. M. lópez iborra. 2007. Survival rates of young mag-pies Pica pica in a mountain population of eastern Spain. Acta Ornithologica 42:63–68.
poTTi, J., J. a. dávila, J. l. Tella, ó. Frías, and s. villar. 2002. Gender and viability selection on morphol-ogy in fledgling Pied Flycatchers. Molecular Ecol-ogy 11:1317–1326.
poTTi, J., and s. MonTalvo. 1991. Return rate, age at first breeding and natal dispersal of Pied Flycatch-ers Ficedula hypoleuca in central Spain. Ardea 79:419–428.
pravosudov, v. v., and a. s. kiTaysky. 2006. Effects of nutritional restrictions during post-hatching devel-opment on adrenocortical function in Western Scrub-Jays (Aphelocoma californica). General and Comparative Endochrinology 145:25–31.
pravosudov, v.v., p. lavenex, and a. oManska. 2005. Nutritional deficits during early development affect hippocampal structure and spatial memory later in life. Behavioral Neuroscience 119:1368–1374.
proMislow, d. e. l., r. MonTgoMerie, and T. e. Mar-Tin. 1992. Mortality costs of sexual dimorphism in birds. Proceedings of the Royal Society of London, Series B 250:143–150.
råberg, l., M. sTJernMan, and J.-å. nilsson. 2005. Sex and environmental sensitivity in Blue Tit nestlings. Oecologia 145:496–503.
radFord, a. n. 2008. Age-related changes in nestling diet of the cooperatively breeding Green Woodhoo-poe. Ethology 114:907–915.
raMsay, s. l., and d. c. housTon. 2003. Amino acid composition of some woodland arthropods and its
PREDICTORS OF JUVENILE SURVIVAL IN BIRDS 53
implications for breeding tits and other passerines. Ibis 145:227–232.
reed, e. T., g. gauThier, r. pradel, and J.-d. lebre-Ton. 2003. Age and environmental conditions affect recruitment in Greater Snow Geese. Ecology 84: 219–230.
reid, k., p. a. prince, and J. p. croxall. 2000. Fly or die: The role of fat stores in the growth and development of Grey-headed Albatross Diomedea chrysostoma chicks. Ibis 142:188–198.
reilly, p. n., and J. M. cullen. 1982. The Little Pen-guin Eudyptula minor in Victoria. III. Dispersal of chicks and survival after banding. Emu 82: 137–142.
richner, h. 1992. The effect of extra food on fitness in breeding Carrion Crows. Ecology 73:330–335.
rickleFs, r. e. 1968. Patterns of growth in birds. Ibis 110:419–451.
rickleFs, r. e., J. M. sTarck, and M. konarzewski. 1998. Internal constraints on growth in birds. Pages 266–287 in Avian Growth and Development: Evolu-tion within the Altricial–Precocial Spectrum (J. M. Starck and R. E. Ricklefs, Eds.). Oxford University Press, Oxford, United Kingdom.
ringsby, T. h., b.-e. saeTher, and e. J. solberg. 1998. Factors affecting juvenile survival in House Spar-row Passer domesticus. Journal of Avian Biology 29:241–247.
rising, J. d., and k. M. soMers. 1989. The measurement of overall body size in birds. Auk 106:666–674.
robles, h., c. ciudad, r. vera, and v. baglione. 2007. No effect of habitat fragmentation on post-fledging, first-year and adult survival in the Middle Spotted Woodpecker. Ecography 30:685–694.
røskaFT, e., and T. slagsvold. 1985. Differential mortal-ity of male and female offspring in experimentally manipulated broods of the Rook. Journal of Animal Ecology 54:261–266.
ross, h. a., and i. a. Mclaren. 1981. Lack of differen-tial survival among young Ipswich Sparrows. Auk 98:495–502.
ruuskanen, s., and T. laaksonen. 2010. Yolk hormones have sex-specific long-term effects on behavior in the Pied Flycatcher (Ficedula hypoleuca). Hormones and Behavior 57:119–127.
sagar, p. M., and d. s. horning, Jr. 1998. Mass-related survival of fledgling Sooty Shearwaters Puffinus gri-seus at The Snares, New Zealand. Ibis 140:329–331.
saino, n., M. roMano, r. aMbrosini, d. rubolini, g. boncoraglio, M. caprioli, and a. roMano. 2012. Longevity and lifetime reproductive success of Barn Swallow offspring are predicted by their hatching date and phenotypic quality. Journal of Animal Ecology 81:1004–1012.
sankaMeThawee, w., g. a. gale, and b. d. hardesTy. 2009. Post-fledgling survival of the cooperatively breeding Puff-Throated Bulbul (Alophoixus palli-dus). Condor 111:675–683.
sapolsky, r. M., l. M. roMero, and a. u. Munck. 2000. How do glucocorticoids influence stress responses? Integrating permissive, suppressive, stimulatory, and preparative actions. Endocrine Reviews 21: 55–89.
saraux, c., v. a. viblanc, n. hanuise, y. le Maho, and c. le bohec. 2011. Effects of individual pre-fledging traits and environmental conditions on return patterns in juvenile King Penguins. PLoS ONE 6(6):e20407.
sasvári, l., and z. hegyi. 2010. Parents raise higher pro-portion of high quality recruits from low fledgling production in the local population of Tawny Owls, Strix aluco. Folia Zoologica 59:206–214.
schaMber, J. l., d. esler, and p. l. FlinT. 2009. Evaluat-ing the validity of using unverified indices of body condition. Journal of Avian Biology 40:49–56.
schauroTh, c., and p. h. becker. 2008. Post-fledging body mass increase in Common Terns Sterna hirundo: Influence of age, sex and year. Ibis 150:50–58.
schew, w. a., and r. e. rickleFs. 1998. Developmental plasticity. Pages. 288–304 in Avian Growth and Devel-opment: Evolution within the Altricial–Precocial Spectrum (J. M. Starck and R. E. Ricklefs, Eds.). Oxford University Press, Oxford, United Kingdom.
schMuTz, J. a. 1993. Survival and pre-fledging body mass in juvenile Emperor Geese. Condor 95:222–225.
schulTe-hosTedde, a. i., b. zinner, J. s. Millar, and g. J. hickling. 2005. Restitution of mass–residuals: Validating body condition indices. Ecology 86: 155–163.
schwagMeyer, p. l., and d. w. Mock. 2008. Parental provisioning and offspring fitness: Size matters. Animal Behaviour 75:291–298.
shorrocks, b., s. albon, h. p. van der Jeugd, and k. larsson. 1998. Pre-breeding survival of Barnacle Geese Branta leucopsis in relation to fledgling charac-teristics. Journal of Animal Ecology 67:953–966.
shuTler, d., r. g. clark, c. Fehr, and a. w. diaMond. 2006. Time and recruitment costs as currencies in manipulation studies on the costs of reproduction. Ecology 87:2938–2946.
siMons, l. s., and T. e. MarTin. 1990. Food limitation of avian reproduction: An experiment with the Cactus Wren. Ecology 71:869–876.
slagsvold, T., e. røskaFT, and s. engen. 1986. Sex ratio, differential cost of rearing young, and differential mortality between the sexes during the period of parental care: Fisher’s theory applied to birds. Ornis Scandinavica 17:117–125.
sMiTh, b. r., and d. T. bluMsTein. 2008. Fitness conse-quences of personality: A meta-analysis. Behavioral Ecology 19:448–455.
sMiTh, h. g., h. källander, and J.-å. nilsson. 1989. The trade-off between offspring number and quality in the Great Tit Parus major. Journal of Animal Ecol-ogy 58:383–401.
snow, d. w. 1958. The breeding of the blackbird Turdus merula at Oxford. Ibis 100:1–30.

54 ORNITHOLOGICAL MONOGRAPHS NO. 78
soler, M., J. J. paloMino, J. g. MarTinez, and J. J. soler. 1994. Activity, survival, independence and migra-tion of fledgling Great Spotted Cuckoos. Condor 96: 802–805.
spear, l., and n. nur. 1994. Brood size, hatching order and hatching date: Effects on four life-history stages from hatching to recruitment in Western Gulls. Jour-nal of Animal Ecology 63:283–298.
sTarck, J. M., and r. e. rickleFs. 1998. Avian Growth and Development: Evolution within the Altri-cial–Precocial Spectrum. Oxford University Press, Oxford, United Kingdom.
sTienen, e. w. M., and a. brenninkMeiJer. 2002. Variation in growth in Sandwich Tern chicks Sterna sandvicensis and the consequences for pre- and post-fledging mortality. Ibis 144:567–576.
sTroMborg, k. l., c. e. grue, J. d. nichols, g. r. hepp, J. e. hines, and h. c. bourne. 1988. Postfledging survival of European Starlings exposed as nestlings to an organophosphorus insecticide. Ecology 69: 590–601.
sTyrsky, J. n., J. d. brawn, and s. k. robinson. 2005. Juvenile mortality increases with clutch size in a Neotropical bird. Ecology 86:3238–3244.
suedkaMp wells, k. M., M. r. ryan, J. J. Millspaugh, F. r. ThoMpson iii, and M. w. hubbard. 2007. Survival of postfledging grassland birds in Missouri. Condor 109:781–794.
sullivan, k. a. 1989. Predation and starvation: Age-specific mortality in juvenile juncos (Junco phaeno-tus). Journal of Animal Ecology 58:275–286.
svensson, e. 1997. Natural selection on avian breeding time: Causality, fecundity-dependent, and fecun-dity-independent selection. Evolution 51:1276–1283.
székely, T., T. lislevand, and J. Figuerola. 2007. Sexual size dimorphism in birds. Pages 27–37 in Sex, Size, and Gender Roles: Evolutionary Studies of Sexual Size Dimorphism (D. J. Fairbairn, W. U. Blanckenhorn, and T. Székely, Eds.). Oxford Uni-versity Press, Oxford, United Kingdom.
TaroF, s. a., p. M. kraMer, J. r. hill iii, J. TauTin, and b. J. M. sTuTchbury. 2011. Brood size and late breed-ing are negatively related to juvenile survival in a Neotropical migratory songbird. Auk 128:716–725.
TarwaTer, c. e., r. e. rickleFs, J. d. Maddox, and J. d. brawn. 2011. Pre-reproductive survival in a tropi-cal bird and its implications for avian life histories. Ecology 92:1271–1281.
TeaTher, k. l., and p. J. weaTherhead. 1989. Sex-specific mortality in nestling Great-tailed Grackles. Ecology 70:1485–1493.
ThoMpson, c. F., J. e. c. Flux, and v. T. TeTzlaFF. 1993. The heaviest nestlings are not necessarily the fat-test nestlings. Journal of Field Ornithology 64: 426–432.
Tinbergen, J. M., and M. c. boerliJsT. 1990. Nestling weight and survival in individual Great Tits (Parus major). Journal of Animal Ecology 59:1113–1127.
Tobler, M., and M. i. sandell. 2007. Yolk testosterone modulates persistence of neophobic responses in adult Zebra Finches, Taeniopygia guttata. Hormones and Behavior 52:640–645.
Todd, l. d., r. g. poulin, T. i. wellicoMe, and r. M. brighaM. 2003. Post-fledging survival of Burrowing Owls in Saskatchewan. Journal of Wildlife Manage-ment 67:512–519.
Torres, r., and h. druMMond. 1997. Female-biased mor-tality in nestlings of a bird with size dimorphism. Journal of Animal Ecology 66:859–865.
Townsend, h. M., and d. J. anderson. 2007a. Assess-ment of costs of reproduction in a pelagic seabird using multistate mark–recapture models. Evolu-tion 61:1956–1968.
Townsend, h. M., and d. J. anderson. 2007b. Production of insurance eggs in Nazca Boobies: Costs, benefits, and variable parental quality. Behavioral Ecology 18: 841–848.
Townsend, h. M., T. J. Maness, and d. J. anderson. 2007. Offspring growth and parental care in sexually dimorphic Nazca Boobies (Sula granti). Canadian Journal of Zoology 85:686–694.
Trivers, r. l., and d. e. willard. 1973. Natural selection of parental ability to vary the sex ratio of offspring. Science 179:90–92.
uller, T., and M. olsson. 2006. Direct exposure to corticosterone during embryonic development influences behaviour in an ovoviviparous lizard. Ethology 112:390–397.
valderrábano-ibarra, c., i. bruMon, and h. druMMond. 2007. Development of a linear dominance hierarchy in nestling birds. Animal Behaviour 74:1705–1714.
van noordwiJk, a. J., J. h. van balen, and w. scharloo. 1998. Heritability of body size in a natural popula-tion of the Great Tit (Parus major) and its relation to age and environmental conditions during growth. Genetical Research 51:149–162.
venable, d. l. 1992. Size–number trade-offs and the variation of seed size with plant resource status. American Naturalist 140:287–304.
verboven, n., and M. e. visser. 1998. Seasonal variation in local recruitment of Great Tits: The importance of being early. Oikos 81:511–524.
verhulsT, s., and J. M. Tinbergen. 1991. Experimental evidence for a causal relationship between timing and success of reproduction in the Great Tit Parus m. major. Journal of Animal Ecology 60:269–282.
verhulsT, s., J. h. van balen, and J. M. Tinbergen. 1995. Seasonal decline in reproductive success of the Great Tit: Variation in time or quality? Ecology 76:2392–2403.
viTz, a. c., and a. d. rodewald. 2011. Influence of con-dition and habitat use on survival of post-fledging songbirds. Condor 113:400–411.
weiMerskirch, h. 2002. Seabird demography and its relationship with the marine environment. Pages 115–135 in Biology of Marine Birds (E. A. Schreiber and J. Burger, Eds.). CRC Press, Boca Raton, Florida.

PREDICTORS OF JUVENILE SURVIVAL IN BIRDS 55
weiMerskirch, h., c. barbraud, and p. lys. 2000. Sex differences in parental investment and chick growth in Wandering Albatrosses: Fitness conse-quences. Ecology 81:309–318.
wheelwrighT, n. T., k. a. Tice, and c. r. FreeMan-gal-lanT. 2003. Postfledging parental care in Savannah Sparrows: Sex, size and survival. Animal Behav-iour 65:435–443.
whiTe, g. c. 2002. Discussion comments on: The use of auxiliary variables in capture–recapture model-ling. An overview. Journal of Applied Statistics 29: 103–106.
whiTe, g. c., and k. p. burnhaM. 1999. Program MARK: Survival estimation from populations of marked animals. Bird Study 46 (Supplement):S120–S138.
wiens, J. d., b. r. noon, and r. T. reynolds. 2006. Post-fledging survival of Northern Goshawks: The importance of prey abundance, weather, and dis-persal. Ecological Applications 16:406–418.
williaMs, T. d., and J. p. croxall. 1991. Chick growth and survival in Gentoo Penguins (Pygoscelis papua): Effect of hatching asynchrony and variation in food supply. Polar Biology 11:197–202.
wilson, a. J., and d. h. nussey. 2010. What is individ-ual quality? An evolutionary perspective. Trends in Ecology & Evolution 25:207–214.
yackel adaMs, a. a., s. k. skagen, and J. a. savidge. 2006. Modeling post-fledging survival of Lark Bun-tings in response to ecological and biological fac-tors. Ecology 87:178–188.