LONG-TERM CONSERVATION OF MIGRATORY BIRDS IN MÉXICO: THE VERACRUZ RIVER OF RAPTORS PROJECT
Management and Conservation Article
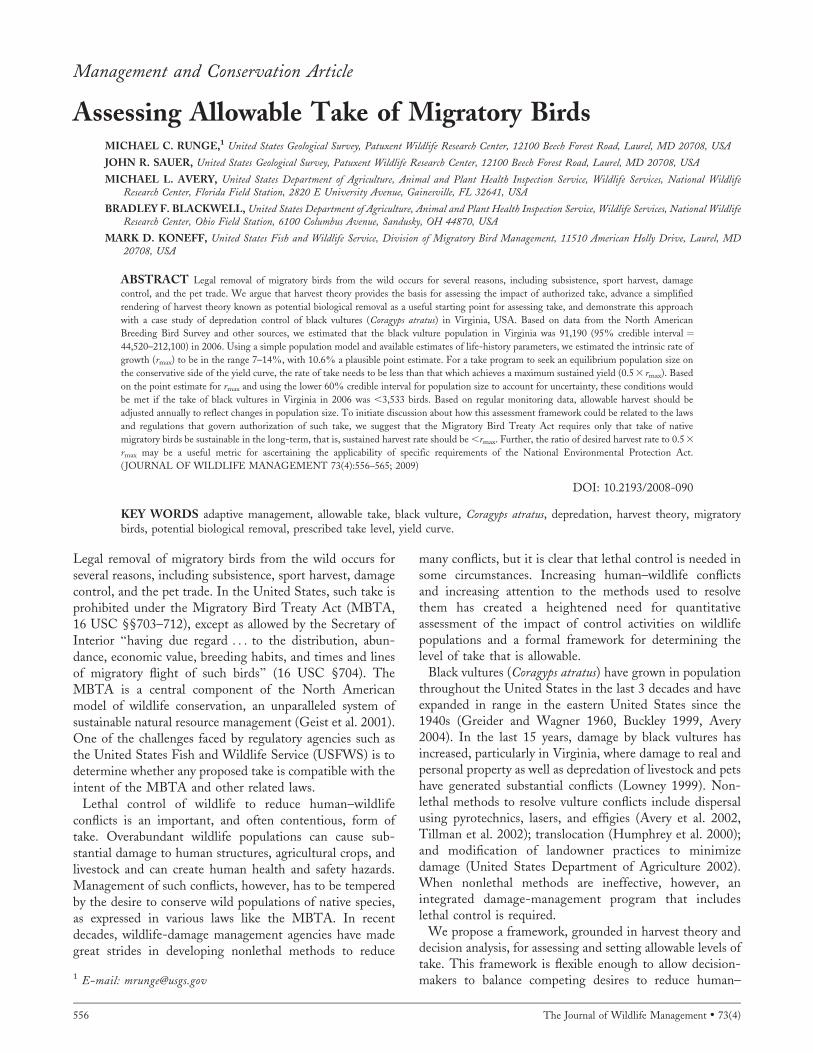
Assessing Allowable Take of Migratory BirdsMICHAEL C. RUNGE,1 United States Geological Survey, Patuxent Wildlife Research Center, 12100 Beech Forest Road, Laurel, MD 20708, USA
JOHN R. SAUER, United States Geological Survey, Patuxent Wildlife Research Center, 12100 Beech Forest Road, Laurel, MD 20708, USA
MICHAEL L. AVERY, United States Department of Agriculture, Animal and Plant Health Inspection Service, Wildlife Services, National WildlifeResearch Center, Florida Field Station, 2820 E University Avenue, Gainesville, FL 32641, USA
BRADLEY F. BLACKWELL, United States Department of Agriculture, Animal and Plant Health Inspection Service, Wildlife Services, National WildlifeResearch Center, Ohio Field Station, 6100 Columbus Avenue, Sandusky, OH 44870, USA
MARK D. KONEFF, United States Fish and Wildlife Service, Division of Migratory Bird Management, 11510 American Holly Drive, Laurel, MD20708, USA
ABSTRACT Legal removal of migratory birds from the wild occurs for several reasons, including subsistence, sport harvest, damage
control, and the pet trade. We argue that harvest theory provides the basis for assessing the impact of authorized take, advance a simplified
rendering of harvest theory known as potential biological removal as a useful starting point for assessing take, and demonstrate this approach
with a case study of depredation control of black vultures (Coragyps atratus) in Virginia, USA. Based on data from the North American
Breeding Bird Survey and other sources, we estimated that the black vulture population in Virginia was 91,190 (95% credible interval ¼44,520–212,100) in 2006. Using a simple population model and available estimates of life-history parameters, we estimated the intrinsic rate of
growth (rmax) to be in the range 7–14%, with 10.6% a plausible point estimate. For a take program to seek an equilibrium population size on
the conservative side of the yield curve, the rate of take needs to be less than that which achieves a maximum sustained yield (0.5 3 rmax). Based
on the point estimate for rmax and using the lower 60% credible interval for population size to account for uncertainty, these conditions would
be met if the take of black vultures in Virginia in 2006 was ,3,533 birds. Based on regular monitoring data, allowable harvest should be
adjusted annually to reflect changes in population size. To initiate discussion about how this assessment framework could be related to the laws
and regulations that govern authorization of such take, we suggest that the Migratory Bird Treaty Act requires only that take of native
migratory birds be sustainable in the long-term, that is, sustained harvest rate should be ,rmax. Further, the ratio of desired harvest rate to 0.5 3
rmax may be a useful metric for ascertaining the applicability of specific requirements of the National Environmental Protection Act.
(JOURNAL OF WILDLIFE MANAGEMENT 73(4):556–565; 2009)
DOI: 10.2193/2008-090
KEY WORDS adaptive management, allowable take, black vulture, Coragyps atratus, depredation, harvest theory, migratorybirds, potential biological removal, prescribed take level, yield curve.
Legal removal of migratory birds from the wild occurs forseveral reasons, including subsistence, sport harvest, damagecontrol, and the pet trade. In the United States, such take isprohibited under the Migratory Bird Treaty Act (MBTA,16 USC §§703–712), except as allowed by the Secretary ofInterior ‘‘having due regard . . . to the distribution, abun-dance, economic value, breeding habits, and times and linesof migratory flight of such birds’’ (16 USC §704). TheMBTA is a central component of the North Americanmodel of wildlife conservation, an unparalleled system ofsustainable natural resource management (Geist et al. 2001).One of the challenges faced by regulatory agencies such asthe United States Fish and Wildlife Service (USFWS) is todetermine whether any proposed take is compatible with theintent of the MBTA and other related laws.
Lethal control of wildlife to reduce human–wildlifeconflicts is an important, and often contentious, form oftake. Overabundant wildlife populations can cause sub-stantial damage to human structures, agricultural crops, andlivestock and can create human health and safety hazards.Management of such conflicts, however, has to be temperedby the desire to conserve wild populations of native species,as expressed in various laws like the MBTA. In recentdecades, wildlife-damage management agencies have madegreat strides in developing nonlethal methods to reduce
many conflicts, but it is clear that lethal control is needed insome circumstances. Increasing human–wildlife conflictsand increasing attention to the methods used to resolvethem has created a heightened need for quantitativeassessment of the impact of control activities on wildlifepopulations and a formal framework for determining thelevel of take that is allowable.
Black vultures (Coragyps atratus) have grown in populationthroughout the United States in the last 3 decades and haveexpanded in range in the eastern United States since the1940s (Greider and Wagner 1960, Buckley 1999, Avery2004). In the last 15 years, damage by black vultures hasincreased, particularly in Virginia, where damage to real andpersonal property as well as depredation of livestock and petshave generated substantial conflicts (Lowney 1999). Non-lethal methods to resolve vulture conflicts include dispersalusing pyrotechnics, lasers, and effigies (Avery et al. 2002,Tillman et al. 2002); translocation (Humphrey et al. 2000);and modification of landowner practices to minimizedamage (United States Department of Agriculture 2002).When nonlethal methods are ineffective, however, anintegrated damage-management program that includeslethal control is required.
We propose a framework, grounded in harvest theory anddecision analysis, for assessing and setting allowable levels oftake. This framework is flexible enough to allow decision-makers to balance competing desires to reduce human–1 E-mail: [email protected]
556 The Journal of Wildlife Management � 73(4)

vulture conflicts and to conserve wild vulture populations.We demonstrate use of this framework using black vulturesin Virginia.
Harvest Theory as a Framework for Allowable TakeThe fundamentals of harvest theory emerge from consid-eration of the simplest model for a population subjected totake, the discrete logistic model
Ntþ1 ¼ Nt þ rmaxNtð1� Nt=K Þ � htNt ; ð1Þ
where Nt is population size at time t, rmax is maximumgrowth rate, K is carrying capacity, and ht is harvest rate over
the time period between t and t þ 1. Under this model, anunharvested population that begins at a small fraction of Kwill grow quickly at first, then more slowly as it approachescarrying capacity (Fig. 1). A sustained level of take has 2effects: it slows initial growth of the population and it resultsin long-term stabilization at a population less than carryingcapacity (Fig. 1). At this equilibrium point (wherepopulation stabilizes), there is a sustainable annual harvest.The relationship between sustainable annual harvest andequilibrium population (Fig. 2) is known as a yield curve(Caughley 1977, Runge and Johnson 2002, Runge et al.2006). All points along the yield curve are solutions forsustainable take; a population can be held indefinitely at anypopulation between zero and K by annually removing thecorresponding level of take. For the logistic model, this takeis maximized (at rmaxK/4) when the population is held atone-half the carrying capacity (K/2); the harvest rate at thispoint is 0.5 3 rmax (Caughley 1977, Runge et al. 2004).
A yield curve shows equilibrium points for a harvestedpopulation, but a harvest strategy also needs to specifyharvest at points away from equilibrium. There is a richliterature on derivation and analysis of harvest strategies(e.g., Quinn and Deriso 1999, Runge and Johnson 2002);among many possible strategies, the fixed harvest-ratestrategy is simple and surprisingly robust to uncertaintyand stochasticity (Quinn and Deriso 1999). A fixed harvest-rate strategy is state-dependent; it adjusts harvest each yearbased on current population size to maintain a constantharvest rate (Fig. 3). State-dependency allows a harvest-ratestrategy to adapt to perturbations and avoid the populationvortex that can occur with a fixed harvest-yield strategy.When the population is lower than the equilibrium sizeassociated with a particular harvest rate, the growth rate is
Figure 1. Logistic growth of a population over time, either unconstrainedby take (intrinsic growth rate, rmax ¼ 12%) or in the presence of take (at6%/yr). Note that take decreases the initial rate of growth at low densityand lowers the long-term equilibrium to some fraction of carrying capacity(K).
Figure 2. Yield curve for a logistic population model subject to take. Weplotted sustainable annual harvest against the corresponding equilibriumpopulation. In the absence of take (harvest rate h ¼ 0), populationequilibrium is at carrying capacity (K), and the sustainable take is zero. Atmaximum sustained yield (h ¼ rmax/2), population equilibrium is at K/2and the sustainable take is rmaxK/4. If the harvest rate is greater than orequal to the maximum growth rate (h � rmax), the population will ultimatelydecline to zero.
Figure 3. Fixed harvest-rate strategy superimposed on equilibrium yieldcurve for logistic model. If harvest is less than that which would besustainable at a particular population, the population will increase. If harvestis greater than sustainable, the population will decrease. Over time, thisharvest strategy leads to equilibrium (circle). Any fixed harvest rate betweenzero and rmax has an associated equilibrium point on the yield curve and can,thus, be viewed as a sustainable strategy.
Runge et al. � Allowable Take of Migratory Birds 557
greater than the harvest rate and the population increases;when the population is higher than the equilibriumpopulation size associated with the harvest rate, the growthrate is less than the harvest rate and the population decreases(Fig. 3).
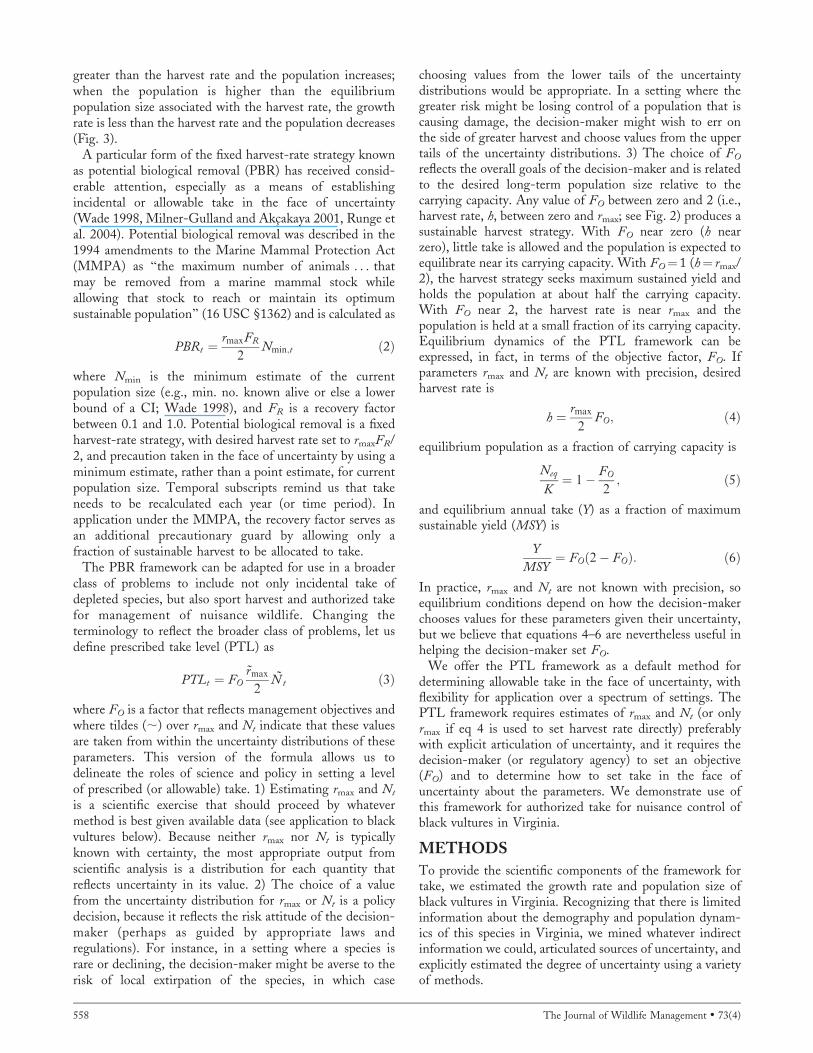
A particular form of the fixed harvest-rate strategy knownas potential biological removal (PBR) has received consid-erable attention, especially as a means of establishingincidental or allowable take in the face of uncertainty(Wade 1998, Milner-Gulland and Akcakaya 2001, Runge etal. 2004). Potential biological removal was described in the1994 amendments to the Marine Mammal Protection Act(MMPA) as ‘‘the maximum number of animals . . . thatmay be removed from a marine mammal stock whileallowing that stock to reach or maintain its optimumsustainable population’’ (16 USC §1362) and is calculated as
PBRt ¼rmaxFR
2Nmin;t ð2Þ
where Nmin is the minimum estimate of the currentpopulation size (e.g., min. no. known alive or else a lowerbound of a CI; Wade 1998), and FR is a recovery factorbetween 0.1 and 1.0. Potential biological removal is a fixedharvest-rate strategy, with desired harvest rate set to rmaxFR/2, and precaution taken in the face of uncertainty by using aminimum estimate, rather than a point estimate, for currentpopulation size. Temporal subscripts remind us that takeneeds to be recalculated each year (or time period). Inapplication under the MMPA, the recovery factor serves asan additional precautionary guard by allowing only afraction of sustainable harvest to be allocated to take.
The PBR framework can be adapted for use in a broaderclass of problems to include not only incidental take ofdepleted species, but also sport harvest and authorized takefor management of nuisance wildlife. Changing theterminology to reflect the broader class of problems, let usdefine prescribed take level (PTL) as
PTLt ¼ FO~rmax
2~N t ð3Þ
where FO is a factor that reflects management objectives andwhere tildes (;) over rmax and Nt indicate that these valuesare taken from within the uncertainty distributions of theseparameters. This version of the formula allows us todelineate the roles of science and policy in setting a levelof prescribed (or allowable) take. 1) Estimating rmax and Nt
is a scientific exercise that should proceed by whatevermethod is best given available data (see application to blackvultures below). Because neither rmax nor Nt is typicallyknown with certainty, the most appropriate output fromscientific analysis is a distribution for each quantity thatreflects uncertainty in its value. 2) The choice of a valuefrom the uncertainty distribution for rmax or Nt is a policydecision, because it reflects the risk attitude of the decision-maker (perhaps as guided by appropriate laws andregulations). For instance, in a setting where a species israre or declining, the decision-maker might be averse to therisk of local extirpation of the species, in which case
choosing values from the lower tails of the uncertaintydistributions would be appropriate. In a setting where thegreater risk might be losing control of a population that iscausing damage, the decision-maker might wish to err onthe side of greater harvest and choose values from the uppertails of the uncertainty distributions. 3) The choice of FO
reflects the overall goals of the decision-maker and is relatedto the desired long-term population size relative to thecarrying capacity. Any value of FO between zero and 2 (i.e.,harvest rate, h, between zero and rmax; see Fig. 2) produces asustainable harvest strategy. With FO near zero (h nearzero), little take is allowed and the population is expected toequilibrate near its carrying capacity. With FO¼ 1 (h¼ rmax/2), the harvest strategy seeks maximum sustained yield andholds the population at about half the carrying capacity.With FO near 2, the harvest rate is near rmax and thepopulation is held at a small fraction of its carrying capacity.Equilibrium dynamics of the PTL framework can beexpressed, in fact, in terms of the objective factor, FO. Ifparameters rmax and Nt are known with precision, desiredharvest rate is
h ¼ rmax
2FO; ð4Þ
equilibrium population as a fraction of carrying capacity is
Neq
K¼ 1� FO
2; ð5Þ
and equilibrium annual take (Y) as a fraction of maximumsustainable yield (MSY) is
Y
MSY¼ FOð2� FOÞ: ð6Þ
In practice, rmax and Nt are not known with precision, soequilibrium conditions depend on how the decision-makerchooses values for these parameters given their uncertainty,but we believe that equations 4–6 are nevertheless useful inhelping the decision-maker set FO.
We offer the PTL framework as a default method fordetermining allowable take in the face of uncertainty, withflexibility for application over a spectrum of settings. ThePTL framework requires estimates of rmax and Nt (or onlyrmax if eq 4 is used to set harvest rate directly) preferablywith explicit articulation of uncertainty, and it requires thedecision-maker (or regulatory agency) to set an objective(FO) and to determine how to set take in the face ofuncertainty about the parameters. We demonstrate use ofthis framework for authorized take for nuisance control ofblack vultures in Virginia.
METHODS
To provide the scientific components of the framework fortake, we estimated the growth rate and population size ofblack vultures in Virginia. Recognizing that there is limitedinformation about the demography and population dynam-ics of this species in Virginia, we mined whatever indirectinformation we could, articulated sources of uncertainty, andexplicitly estimated the degree of uncertainty using a varietyof methods.
558 The Journal of Wildlife Management � 73(4)
Demography of Black VulturesBlack vultures are long-lived birds with delayed onset ofbreeding, low fecundity, and long-term monogamous pairbonds (Buckley 1999). There has been only one long-termstudy of black vulture breeding biology (Rabenold andDecker 1990, Decker et al. 1993), and no analysis of survivalusing modern mark–recapture methods has been under-taken.
There is limited research on survival rates of black vultureadults, juveniles, and subadults. Leg bands cannot be usedon black vultures or turkey vultures (Cathartes aura) becausetheir habit of urohidrosis as a cooling mechanism can lead toinfection, swelling, and loss of banded legs (Henckel 1976),so alternate methods of estimating survival are used. Becauseof vultures’ long-term pair-bonding, Rabenold and Decker(1990) inferred mortality from single-mate turnovers inestablished pairs. Based on 12 turnovers at 17 nest sites over13 years, Rabenold and Decker (1990) estimated adultmortality to be 9.4% (12 turnovers in 128 pair-yr, exact95% binomial CI ¼ 4.94–15.80%). The record age for ablack vulture is 25 years and 6 months (Clapp et al. 1982,Klimkiewicz 2006). Rabenold (1986) observed 32 out of 41young black vultures (78.0%) surviving �2 months afterfledging; 2-month survival was 93% for fledglings withstrong parental associations but only 46% for fledglingswith weak parental associations.
There is limited data on survival rates of other vulturespecies, whether New World or Old World. In perhaps thebest study of vulture survival, adult survival of griffonvultures (Gyps fulvus) in a reintroduced population in Francewas 98.7% (95% CI¼ 96.5–99.5%), and annual survival ofyoung (,3 yr) born in the wild was 85.8% (95% CI¼76.1–91.9%; Sarrazin et al. 1994).
Black vultures, like other New and Old World vultures,exhibit delayed onset of sexual maturity. Blackwell et al.(2007) demonstrated via a stage-structured matrix modelthat age-at-first-breeding must be closer to 5 years than to 8years (the sole record for a known-age black vulture; Parkeret al. 1995). Age-at-first-breeding is typically 4 years ingriffon vultures (Blanco and Martinez 1996, Sarrazin et al.1996) and 4–6 years in Cape vultures (Gyps coprotheres;Robertson 1984).
Periodicity of nesting in New World vultures is not wellstudied, but there are suggestions that annual nesting maybe the norm for established pairs of vultures (Jackson 1983).The proportion of griffon vultures .4 years that nested wasbetween 85% and 99% in the last 6 years of the study of areintroduced population (Sarrazin et al. 1996).
Clutch size of black vultures is typically 2 eggs (Jackson1983). Mean number of eggs that hatch was estimated to be0.98 per nest, and total nesting success rate (from laying tofledging) was estimated to be 37.6% (Jackson 1983). In a13-year study in North Carolina, USA, mean fledglings pernesting attempt averaged 1.29, ranging from 0.68 in newsites to 1.34 in established nest sites (Rabenold and Decker1990). It is conceivable that fecundity values may be highernow than in the past (when many of these field studies were
conducted), as the concentration of dichloro-diphenyl-trichloroethane (DDT) metabolites and other persistentorganochlorine pesticides, and their reproductive effects,have decreased.
Estimating rmax
We desired an estimate of population growth rate in theabsence of take and at low density, under otherwise averageenvironmental conditions. This growth rate is rarelyobserved, unless through reintroduction, expansion of range,or recovery from a severely depleted status. A direct methodof estimation would be to fit equation 1 to a time-series ofpopulation size and harvest (e.g., Millar and Meyer 2000).Lacking the appropriate time-series to estimate rmax directly,an alternative is to build a population model based on thelife-history of the species, incorporating parameter estimatesthat reflect demography in the absence of take and at lowdensity. For a delayed breeder like the black vulture, age- orstage-structured matrix approaches are appropriate. Black-well et al. (2007) used such an approach to find a pointestimate for growth rate and perform sensitivity analysis butdid not seek specifically to estimate rmax and did notformally incorporate estimates of uncertainty. However, asnoted earlier (see also Blackwell et al. 2007), limited specieslongitudinal data necessitate a degree of speculation inestimating uncertainty.
To estimate rmax, we used Slade’s formula (Slade et al.1998, Runge et al. 2004), which requires estimates of age-at-first-breeding (a), age of senescence (x), number ofoffspring per reproductive adult (not per pair) per timeperiod (b), adult survival rate (p), and survival from birth toage-at-first-breeding (la); we find growth rate (k¼ rmaxþ 1)by solving
1 ¼ pk�1 þ labk�a � labpðx �a þ1Þk�ðx þ1Þ: ð7Þ
To account for uncertainty in demographic parameters forblack vultures (and specifically, black vultures in VA), wedescribed each parameter with a probability distribution,used Monte Carlo methods to sample from those distribu-tions independently, solved equation 7 numerically for k,and used the results from 10,000 replicates to describeuncertainty in rmax (i.e., k � 1).
We assumed that a was between 4 and 6, basedparticularly on comparison to Old World vultures, anddescribed uncertainty with a discrete uniform distribution(giving equal probability to an age-at-first-breeding of 4 yr,5 yr, or 6 yr). Similarly, we described uncertainty about xwith a discrete uniform distribution between 20 years and 30years, based on observed longevity and assuming thatreproductive senescence does not occur until old age, if atall. We used a uniform distribution for adult survival withrange (0.842, 0.995), taking the low end from the lowerconfidence interval from Rabenold and Decker (1990) andthe high end from the upper confidence interval fromSarrazin et al. (1994). We described number of young perreproductive adult as the product of propensity (uniformbetween 0.85 and 0.99) and fledglings per nesting attempt(uniform between 1.29 and 1.58; mean and upper estimates
Runge et al. � Allowable Take of Migratory Birds 559
from Rabenold and Decker [1990]), divided by 2 (the 2parents). We described survival to breeding (la) as theproduct of first-year survival (uniform between 0.7 and 0.9;a wide interval to capture substantial uncertainty) andsubadult survival (logit-normal to estimate the interval givenby Sarrazin et al. [1994]) raised to the power of a–1.
Estimating Population Size from North AmericanBreeding Bird Survey DataThere is no standardized survey designed specifically toestimate the population of black vultures in Virginia. Thereare many data sets that represent some ad hoc sampling ofblack vultures in different ways and at different times of year(e.g., Christmas Bird Count, roost counts), but it is difficultto know how to make inferences from these to the statewidepopulation. The North American Breeding Bird Survey(BBS; Sauer et al. 2007) is the only standardized,randomized survey with a known sampling frame that couldbe used to estimate vulture population size. There are severalproblems, however, with using the BBS for this purpose: 1)the BBS is designed to estimate population trends, notpopulation size; 2) the BBS has an incomplete samplingframe, because surveys are only conducted along roads; 3)detection probability and availability (birds that could besampled using the survey method) are not estimated duringthe BBS; and 4) the sampling radius is vague. Nevertheless,we attempted to estimate black vulture population size inVirginia from BBS data because there was no other option.We used auxiliary data to address deficiencies of the BBSdata. In particular, data were available from independentstudies to estimate probability of detection of black vulturesat BBS stops, on-road–off-road bias, and availability ofblack vultures for detection.
We assumed that any vulture in flight within the radius ofthe count was available for detection, and we were able toestimate frequency of flight from satellite telemetry. Somevultures that were perched or on the ground were alsoavailable for detection, but we did not have a way to estimatethe fraction of these birds that were available. Instead, weused information about the fraction of vultures detected inflight (vs. perched or on the ground) to calculate an estimateof availability from satellite telemetry data.
At Beaufort, South Carolina, USA, during September2006, we captured black vultures in a baited walk-in trapand attached satellite transmitters (PTT-100 Argos GlobalPositioning System; Microwave Telemetry, Inc., Columbia,MD) to 6 birds using a backpack harness of Teflon tape(DuPont, Inc., Wilmington, DE; Humphrey et al. 2000).We programed each transmitter to provide location,altitude, and speed hourly from 0500 hours to 2000 hours.For this analysis, we used data collected during April–June2007. We adjusted each hourly reading in relation to localsunrise, and for each bird we selected all locations recordedbetween 0.5 hours before sunrise and 4 hours after sunrise,which is when the BBS is conducted (Robbins et al. 1986).For each record, we determined whether the bird was flying(i.e., speed . 0). We viewed these as binomial trials, with
bird as a random effect, and calculated the probability that abird was flying in this interval of time.
To use the fraction of time spent in flight as an availabilityadjustment, we needed to use only flying birds in theanalysis (Rosenberg and Blancher 2005). However, not all ofthe vultures detected during the BBS are in flight; flightstatus of vultures is not regularly recorded during the BBS.To estimate the fraction of vultures detected in flight (vs.perched), we contacted several observers during the 2007survey and asked them to provide this information. We usedobserved numbers of birds perched and in flight from theseobservers to calculate the fraction of BBS observations thatwere of birds in flight.
We conducted a hierarchical analysis of BBS data inWinBUGS (Lunn et al. 2000) to estimate the black vulturepopulation in Virginia. We used raw observations from theBBS routes in Virginia for the 1966–2006 surveys, stratifiedinto 3 ecoregions. We assumed the radius of sampling foreach BBS stop was 400 m (Rosenberg and Blancher 2005)to calculate density of black vultures, which we multipliedby area of the state to estimate population size. We thencorrected this estimate for 3 components. First, we applieda visibility correction factor, based on results of double-observer estimation from data collected on and off roads inthe northeastern United States using BBS-style counts(Nichols et al. 2000). Second, we converted the result to acount of flying birds only, based on the estimate of thefraction flying. Third, we adjusted the result based on theestimated proportion of time that birds were in flightduring the time of day the survey was conducted(availability).
The hierarchical log-linear model used for analysis of BBSdata is described in Link and Sauer (2002) and Sauer et al.(2008). In the model, year effects are estimated controllingfor observer differences and other nuisance parameters, andannual indices of abundance are constructed from expo-nentiated year effects and variance components. In the blackvulture analysis, we converted these indices to abundanceestimates by 1) adding the log detection rate to year effectsbefore exponentiation, 2) multiplying the resulting index bythe effective area of sampling associated with each route, 3)multiplying the resulting population index by the proportionobserved to be flying during the survey, and 4) dividing theresulting estimate of flying black vultures by the availabilitydata estimated from radiotracked birds. We captured andpropagated through the model uncertainty in the estimatesof all these components. We incorporated detectability aslog-normally distributed variables with estimated detectionrates forming means and variances; we incorporated theproportion flying and availability data as beta distributionswith means and variances formed by field-based estimates.
RESULTS
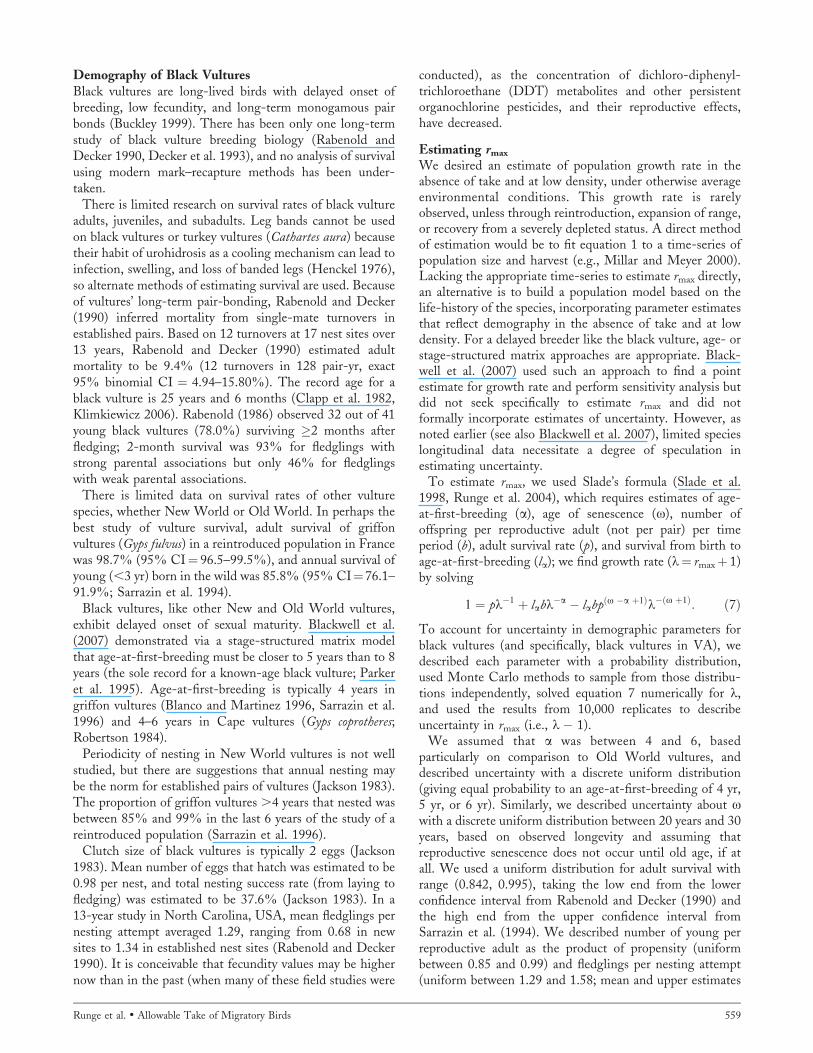
The median estimate of rmax was 10.58%, with the central95% of the uncertainty distribution contained in theinterval [2.06%, 19.23%] and the central 60% containedin the interval [6.86%, 14.33%] (Fig. 4). Uncertainty in the
560 The Journal of Wildlife Management � 73(4)
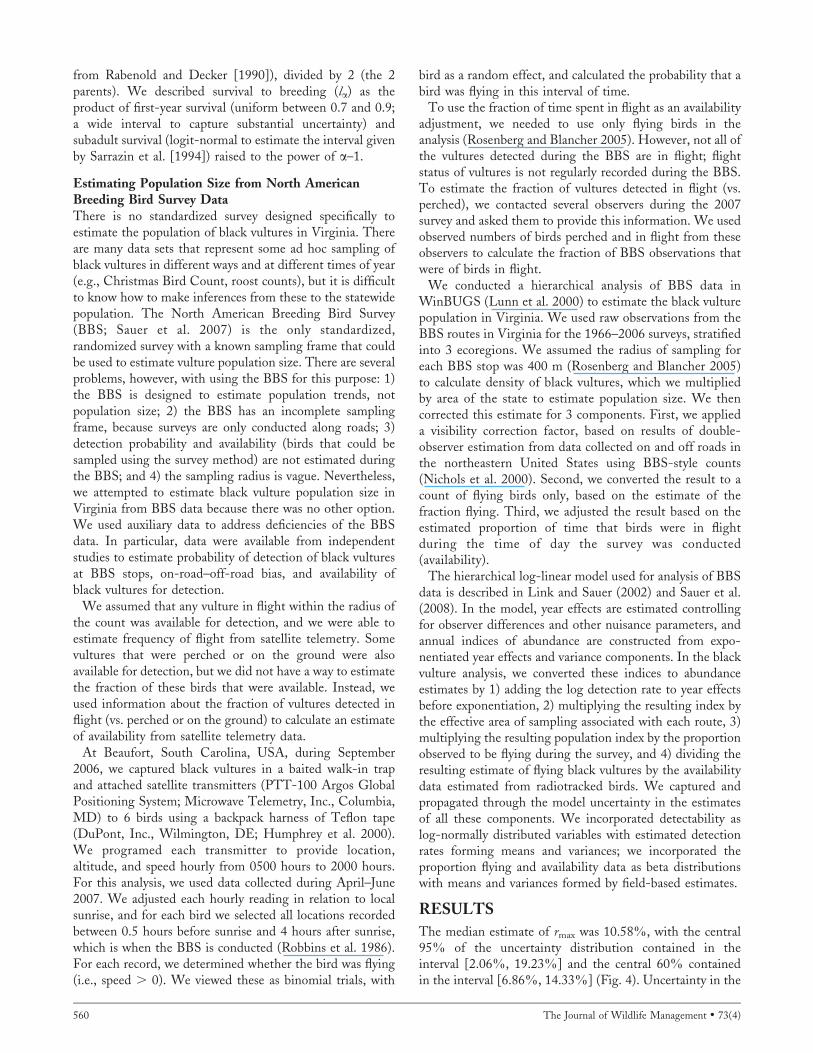
estimate of rmax was driven most strongly by uncertainty in
age-at-first-breeding, adult survival rate, and subadult
survival rate (Fig. 5).
We assumed that birds in flight were available for
detection. During April–June 2007, between 0.5 hours
before sunrise and 4 hours after sunrise, the 6 satellite-tagged black vultures were flying between 2.3% and 7.6%
of the time (Table 1). The mean fraction of time flying was
4.17% (95% Bayesian credible interval ¼ 2.13–6.85%).Because we based our availability correction on the fraction
of time flying, we needed to adjust BBS counts to reflectdetections of flying vultures only. In June 2007, 5 observers
in central Maryland, USA, recorded 86 vultures (both
species), of which 37 were in flight, on 6 BBS routes. Meanestimate for percent of birds in flight was 43.0% (95%
Bayesian credible interval ¼ 32.7–53.6%).
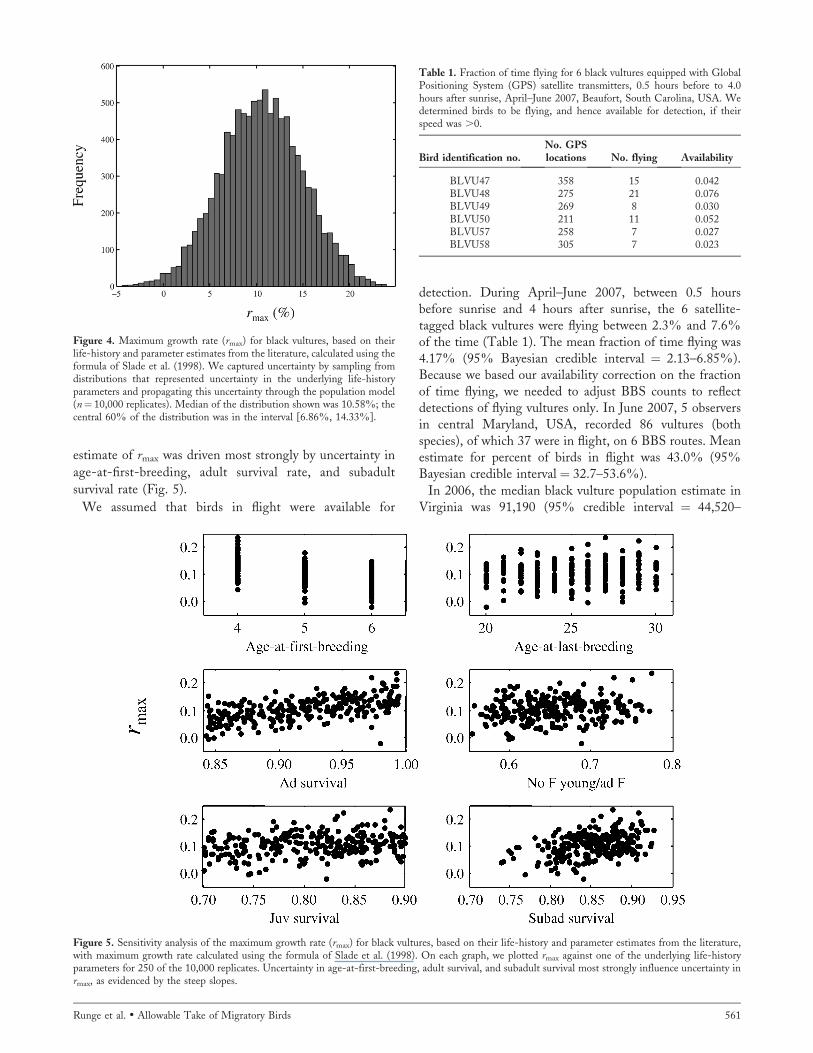
In 2006, the median black vulture population estimate in
Virginia was 91,190 (95% credible interval ¼ 44,520–
Figure 4. Maximum growth rate (rmax) for black vultures, based on theirlife-history and parameter estimates from the literature, calculated using theformula of Slade et al. (1998). We captured uncertainty by sampling fromdistributions that represented uncertainty in the underlying life-historyparameters and propagating this uncertainty through the population model(n¼ 10,000 replicates). Median of the distribution shown was 10.58%; thecentral 60% of the distribution was in the interval [6.86%, 14.33%].
Figure 5. Sensitivity analysis of the maximum growth rate (rmax) for black vultures, based on their life-history and parameter estimates from the literature,with maximum growth rate calculated using the formula of Slade et al. (1998). On each graph, we plotted rmax against one of the underlying life-historyparameters for 250 of the 10,000 replicates. Uncertainty in age-at-first-breeding, adult survival, and subadult survival most strongly influence uncertainty inrmax, as evidenced by the steep slopes.
Table 1. Fraction of time flying for 6 black vultures equipped with GlobalPositioning System (GPS) satellite transmitters, 0.5 hours before to 4.0hours after sunrise, April–June 2007, Beaufort, South Carolina, USA. Wedetermined birds to be flying, and hence available for detection, if theirspeed was .0.
Bird identification no.No. GPSlocations No. flying Availability
BLVU47 358 15 0.042BLVU48 275 21 0.076BLVU49 269 8 0.030BLVU50 211 11 0.052BLVU57 258 7 0.027BLVU58 305 7 0.023
Runge et al. � Allowable Take of Migratory Birds 561
212,100; Fig. 6). Our estimates of black vulture populationin Virginia from 1996 to 2006 (Fig. 6) incorporate detectionprobability (which we estimated as 0.95 based on limiteddata, and no differences existed on- vs. off-road), availability(including the fraction of BBS vulture observations inflight), and an area-correction. The lower end of the 60%credible interval was 66,660.
DISCUSSION
Our results provide several important advances for under-standing black vulture demography and take, with implica-tions for other species of migratory birds. First, we were ableto estimate the intrinsic rate of growth for black vulturepopulations, even with very sparse data, by explicitlyincorporating uncertainty. Second, we were able to estimatethe statewide population of black vultures from BBS dataand auxiliary information, providing a critical populationparameter to managers. Third, the PTL framework providesa context for integrating the scientific and policy elements oftake management for migratory birds.
Scientific ConsiderationsEstimating rmax for black vultures is challenging becausethere are no data to estimate rmax directly and the life-history data to estimate it indirectly are sparse. In ourapproach, we articulated wide bounds to describe ouruncertainty about each life-history parameter, basing thesebounds on published values for black vultures, turkeyvultures, and Old World vultures, and propagated thatuncertainty through to estimates of rmax. We believe thatthese ranges do, in fact, bound the possible values for theparameters, and thus our distribution for rmax (Fig. 4)bounds the possible values for this growth rate, although wesuspect we overstated uncertainty at the low ends of theparameter estimates. We note that the matrix modeldeveloped by Blackwell et al. (2007), and based on thesame data sources, produced an estimate of populationgrowth for the North Carolina black vulture population of
10.6% annually (and also demonstrated the markedsensitivity of this growth rate to the estimate of ad survivalrate). Our belief, therefore, is that the median estimate forrmax (10.6%) is the best to work with at this time, althoughit is likely conservative.
Conversion of BBS indices to population estimates iscontroversial (Rosenberg and Blancher 2005). Many of theconversion factors are not supported by credible data;collection of auxiliary information in the field to facilitatethese conversions should be a priority research activity. Themost important, and least well known, conversion factor isthe availability bias: the proportion of birds available to bedetected during the morning hours when the BBS isconducted. In this work, we have equated availability ofblack vultures with flying and have used data from satellite-tagged birds in South Carolina to estimate the fraction oftime spent flying. Additional data from other locationswould improve these estimates; alternative methods mightbe used for other species. The estimate of the fraction ofblack vultures observed in flight during the BBS is from asmall and informal sample. There may be value in seeking aformal estimate of this fraction by asking BBS observers torecord, as a part of operational procedures, whether vulturesand other diurnal raptors are perched or in flight.
The desired spatial scale of assessment and managementhas a bearing on estimation procedures, particularly becauseblack vulture populations can be influenced by emigrationand immigration. The PTL framework implicitly assumesthat the population being managed is closed to emigrationand immigration, and the framework will work best whenthe spatial extent of application is large enough that thecontribution of emigration and immigration to populationgrowth is minimal. An otherwise sustainable take, applied toa population that is experiencing substantial emigration,could result is an unintended reduction in population.Conversely, an otherwise aggressive take, applied to apopulation that is experiencing substantial immigration,could fail to control a nuisance problem. The degree ofpopulation movement in black vultures is not known, butthe observed annual population growth for 1990–2006 basedon the BBS was 4.5% across the United States and 4.8% inVirginia (Sauer et al. 2007), suggesting that there may nothave been net immigration of black vultures to Virginiaduring that period.
Even if there is minimal movement of birds, there are stillsome spatial considerations in application of this framework.In vulture damage management, one goal might besubstantial reduction, even extirpation, of a vulture pop-ulation at a local scale (i.e., that of a landowner’s property).If the PTL framework were applied at such a scale, it wouldprevent the specific objective of local damage reduction. Thequestion is, at what scale does take need to be sustainable—countywide, statewide, region-wide, nationwide? At what-ever scale it is applied, the conservation assurances of theframework hold over broader ranges but not necessarilymore local ones; that is, if take is managed using thisframework at the statewide level, then take at the regional
Figure 6. Population size of black vultures in Virginia, USA, 1966–2006.We show median and 95% credible intervals from the posteriordistributions. We based these estimates on Breeding Bird Survey trendsand incorporated correction factors for detectability, availability, and areasampled.
562 The Journal of Wildlife Management � 73(4)

level will also be sustainable and no larger than specified bythe policy parameters, but take at the local level may not.We believe that this decision, although it could be informedto some extent by an understanding of the species’ biology,is primarily a policy consideration.
The PTL framework also implicitly assumes that carryingcapacity is not changing, but what if it is? For black vulturesin Virginia, and elsewhere, their long-term increasingpopulation trend is likely driven in part by increases in keyresources, such as roost sites (Avery et al. 2002) and food(i.e., carrion; see Coleman and Fraser 1987, 1989; DeVaultet al. 2004). Fortunately, the PTL framework is robust tochanges in carrying capacity. For example, consider apopulation that is harvested at rmax/2 and is, thus, headedtoward equilibrium around K/2. If K doubles over a 15-yearperiod, then the equilibrium point will double as well, andthe population size should slowly increase toward that newequilibrium. As long as the management goal is to hold thepopulation near a particular fraction of K, rather than aparticular absolute population, the PTL framework willwork in the face of changing K. There is a more insidiousproblem, however, if the intrinsic growth rate changes,particularly if it decreases and take is not adjustedaccordingly, because the population will decline more thanintended. Conservatism in the face of uncertainty, andadaptive management, help guard against this risk.
The deterministic discrete logistic model is an over-simplification of the dynamics of any population, in that itleaves out stochastic fluctuations, nonlinear density-depen-dence, and stage-structure, among other nuances. To theextent any of these dynamics can be quantified, they shouldbe, and allowable take should be assessed with a moredetailed model. But we submit that this framework is arobust default framework to use in the absence of betterinformation, and further, this framework allows certainpolicy questions to be addressed that need to be answered nomatter what population model is used.
Policy ConsiderationsThe PTL framework requires 3 primary policy specifica-tions: the spatial scale of management (discussed above), thedesired allocation of growth to take (as expressed by FO),and the response to uncertainty. We propose some ways tolink biological guideposts to policy thresholds, but it isimportant to note that these proposals are meant tostimulate discussion and should not be construed torepresent any determination or policy of our respectiveagencies.
Setting FO is an important expression of managementobjectives. As discussed above, there are 3 values of FO thatare biological guideposts—0, 1, and 2. Take is sustainable if0 � FO , 2, and equilibrium population size is expected tobe greater than that at MSY if FO , 1. In a sense, if FO , 1,a conservation stance is taken, in that the framework guardsagainst allocating too much productivity to take. But, we canimagine that in some serious nuisance control settings, themanagement goal may be to reduce the population belowK/2 without extirpating it, in which case setting 1 , FO , 2
to determine take would be appropriate. It is important tonote that the risks (of overharvest and extirpation) due touncertainty increase greatly as FO approaches 2.
Can these biological guideposts be tied to policy thresh-olds under laws that play a role in regulating take in theUnited States? It would be advantageous if they could,because it would allow decision-makers to articulate theirpolicy thresholds in an explicit, transparent, and replicablemanner. However, we recognize the laws may have morecomplex interpretations than available biological guidepostsallow. Nevertheless, in the spirit of engendering discussionand encouraging management agencies to be explicit abouttheir policy thresholds, we propose the following linksbetween these biological guideposts and several relevantpolicy thresholds, and we apply them in the context of blackvulture management.
The MBTA prohibits take of migratory birds except asauthorized by the Secretary of Interior; regulations promul-gated by USFWS and upheld in court challenges supportthe legality of take of native migratory birds for severalpurposes, provided populations are not imperiled in theprocess. The range of take approved under the MBTAincludes several examples where the desired harvest level was.0.5 3 rmax (e.g., snow geese [Chen caerulescens]; USFWS2007). Thus, we propose that the MBTA requires only thattake of native migratory birds be sustainable, which suggests0 � FO , 2.
The National Environmental Policy Act (NEPA; 42 USC§§4321–4375) is a procedural law that requires, amongother things, Federal agencies to clearly articulate theexpected environmental consequences of their actions. Inparticular, NEPA requires an environmental impact state-ment (EIS) for any ‘‘major Federal action significantlyaffecting the quality of the human environment’’ (42 USC§4332). For actions with less impact, an EnvironmentalAssessment (EA) may be all that is required, or indeed, a‘‘categorical exclusion’’ can be granted, meaning neither anEIS nor an EA is required (40 CFR 1508.4). Theconsiderations that go into determination of significanceunder NEPA are complex and include economic, social, andpolitical, as well as biological impacts. We suggest that FO
may be a useful way to summarize biological impacts, butthere are no obvious biological guideposts to link to thesepolicy thresholds.
Another policy component to the decision is how tohandle uncertainty and risk. The proposed frameworkrequires scientific assessment of the intrinsic growth rateof the population (rmax) and the population size (N) for theappropriate spatial unit, with appropriate expression of theuncertainty in those estimates, preferably as a probabilitydistribution. The choice of a particular value for each ofthese parameters from the range that captures uncertaintyabout them is a decision that articulates the risk tolerance ofthe decision-maker. Choosing low values for these param-eters (e.g., taking the lower CLs) provides assurance that thepopulation will remain above the level prescribed by themanagement objective, FO (see eq 5), but being unnecessar-
Runge et al. � Allowable Take of Migratory Birds 563
ily conservative can undermine the ability to accomplish theoverarching management goals (e.g., nuisance control,hunter satisfaction). Wade (1998) found that using thelower end of a 60% confidence interval for N (i.e., the 20thpercentile), while using the best estimate for rmax, providedsufficient protection against the types of uncertainty typicalin application of PBR to marine mammals. Further work isneeded to determine whether this recommendation holdsfor a broader set of contexts, but we believe thisrecommendation is a good starting point for consideration.It should be adjusted, however, by consideration of the risktolerance for a specific context and perhaps also adapted asexperience provides feedback (see below). Note that it ispossible to perform a formal risk analysis and look at howthe choice of specific points in the uncertainty distributionsfor the 2 parameters affects long-term outcomes (e.g.,expected population size, risk of dropping below a specificpopulation size). This risk analysis requires a more detailedpopulation model (e.g., estimates of stochastic variance,expression of structural and parametric uncertainty) but canand should be performed when the consequences ofmanagement require a more detailed understanding of risk.
Adaptive Management of TakeTake can often be managed adaptively. In many cases, thedecision to authorize take is revisited periodically, and thereare monitoring data generated in between, which canprovide feedback about effects of the take. Monitoring canguard against effects of, and can reduce, uncertainty ifmanagement actions can be adjusted based on newinformation. This requires, first, that take levels be set in astate-dependent manner, that is, based on annual updates ofN, and perhaps other parameters. As new information isacquired about rmax and N, either from direct observation ofthe population being managed or from auxiliary studies, theparameters used to calculate allowable take should beupdated.
Adaptive management is often applied to resolve un-certainty about parameters that are part of the scientificassessment, but there has been increased attention in recentyears to double-loop learning (Lee 1993) in whichresolution of uncertainty about policy parameters is alsogiven attention, albeit at a less frequent rate. In the case ofallowable take, periodic review of the objectives (asexpressed by FO) and risk tolerance is appropriate andnecessary.
Allowable Take of Black Vultures in VirginiaTogether, the analytical results and the policy proposals wediscussed suggest the following assessment for allowabletake of black vultures in Virginia. We assume that theappropriate spatial scale for management is the state ofVirginia, but USFWS would have to determine, as a matterof policy, whether that is the appropriate scale at which topursue sustainability and manage take. Using the medianestimate for rmax (10.6%) and the 20th percentile for thepopulation size in 2006 (66,660), we calculate allowable takeat 3,533 (for FO¼ 1) or 7,066 (for FO¼ 2). In applying for a
take permit, the applicant would specify the managementobjective in terms of how much growth should be allocatedto take (FO). Take governed by FO between zero and 2 (takein 2006 between zero and 7,066) could possibly beauthorized. Take ,3,533/year contains some assurance thatthe long-term population size in Virginia will remain .K/2,but if the desire is to take .3,533/year (FO . 1), theresponsible agency might need to further analyze take todetermine its significance. Specification of a managementobjective (FO) and advance determination of how uncer-tainty is to be handled (e.g., using the median estimate forrmax and the 20th percentile of N), would help the agencymake clear to the public how annual allowable take would berecalculated based on updated estimates of rmax and Nt.Periodically, with renewal of the planning document, thepolicy parameters (as expressions of the managementobjectives) could be revisited.
MANAGEMENT IMPLICATIONS
Regulatory decisions about take of migratory birds, in NorthAmerica and elsewhere, have not always been made under acomprehensive and consistent approach grounded in harvesttheory, especially outside of the context of sport harvest.The PTL approach provides a decision-analytic frameworkfor assessing and setting allowable take of migratory birdsand other animals. The framework is applicable to a broadset of problems, including take associated with nuisancecontrol, sport harvest, falconry (Millsap and Allen 2006),and incidental take. The framework requires that manage-ment goals be explicit and transparent, provides a cleardelineation of the roles of policy and science, and can beimplemented adaptively. We believe this framework canimprove communication and coordination among regulatoryagencies and with affected constituencies, as it has in thecase of black vultures.
ACKNOWLEDGMENTSWe are grateful to G. Allen, R. Chipman, C. Dwyer, K.Fagerstone, P. Garrettson, M. Linnell, G. Littauer, M.Lowney, J. Lyons, J. Nichols, K. Pardieck, D. Pence, B.Peterjohn, B. and A. Rattner, D. Reinhold, C. Robbins, F.Rivera, M. Seamans, and M. Tobin for insights in thedevelopment of this paper. M. Chamberlain, D. Euler, and2 anonymous reviewers offered helpful suggestions thatimproved the paper. Conclusions contained in this paper arepresented for heuristic value and do not necessarily reflectpolicy of any agency.
LITERATURE CITED
Avery, M. L. 2004. Trends in North American vulture populations.Proceedings of the Vertebrate Pest Conference 21:116–121.
Avery, M. L., J. S. Humphrey, E. A. Tillman, K. O. Phares, and J. E.Hatcher. 2002. Dispersal of vulture roosts from communication towers.Journal of Raptor Research 36:44–49.
Blackwell, B. F., M. L. Avery, B. D. Watts, and M. S. Lowney. 2007.Demographics of black vultures in North Carolina. Journal of WildlifeManagement 71:1976–1979.
Blanco, G., and F. Martinez. 1996. Sex differences in breeding age ofgriffon vultures (Gyps fulvus). Auk 113:247–248.
564 The Journal of Wildlife Management � 73(4)
Buckley, N. J. 1999. Black vulture (Coragyps atratus). Account 411 in A.Pool and F. Gill, editors. The birds of North America. The Academy ofNatural Sciences, Philadelphia, Pennsylvania, and The AmericanOrnithologists’ Union, Washington, D.C., USA.
Caughley, G. 1977. Analysis of vertebrate populations. John Wiley andSons, New York, New York, USA.
Clapp, R. B., K. Klimkiewicz, and J. H. Kennard. 1982. Longevity recordsof North American birds: Gaviidae through Alicidae. Journal of FieldOrnithology 53:81–124.
Coleman, J. S., and J. D. Fraser. 1987. Food habits of black and turkeyvultures in Pennsylvania and Maryland. Journal of Wildlife Management51:733–739.
Coleman, J. S., and J. D. Fraser. 1989. Habitat use and home ranges ofblack and turkey vultures. Journal of Wildlife Management 53:782–792.
Decker, M. D., P. G. Parker, D. J. Minchella, and K. N. Rabenold. 1993.Monogamy in black vultures: genetic evidence from DNA fingerprinting.Behavioral Ecology 4:29–35.
DeVault, T. L., B. D. Reinhart, I. L. Brisbin, Jr., and O. E. Rhodes, Jr.2004. Home ranges of sympatric black and turkey vultures in SouthCarolina. Condor 106:706–711.
Geist, V., S. P. Mahoney, and J. F. Organ. 2001. Why hunting has definedthe North American model of wildlife conservation. Transactions of theNorth American Wildlife and Natural Resources Conference 66:175–185.
Greider, M., and E. S. Wagner. 1960. Black vulture extends breeding rangenorthward. Wilson Bulletin 72:291.
Henckel, E. 1976. Turkey vulture banding problem. North American BirdBander 1:126.
Humphrey, J. S., M. L. Avery, and A. P. McGrane. 2000. Evaluatingrelocation as a vulture management tool in North Florida. Proceedings ofthe Vertebrate Pest Conference 19:49–53.
Jackson, J. A. 1983. Nesting phenology, nest site selection, and reproductivesuccess of black and turkey vultures. Pages 245–270 in S. R. Wilbur and J.A. Jackson, editors. Vulture biology and management. University ofCalifornia Press, Berkeley, USA.
Klimkiewicz, M. K. 2006. Longevity records of North American birds.Version 2006.1. Patuxent Wildlife Research Center Bird BandingLaboratory, Laurel, Maryland, USA. ,http://www.pwrc.usgs.gov/bbl/homepage/longvrec.htm.. Accessed 24 Jan 2007.
Lee, K. N. 1993. Compass and gyroscope: integrating science and politicsfor the environment. Island Press, Washington, D.C., USA.
Link, W. A., and J. R. Sauer. 2002. A hierarchical model of populationchange with application to cerulean warblers. Ecology 83:2832–2840.
Lowney, M. S. 1999. Damage by black and turkey vultures in Virginia,1990–1996. Wildlife Society Bulletin 27:715–719.
Lunn, D. J., A. Thomas, N. Best, and D. Spiegelhalter. 2000. Win-BUGS—a Bayesian modelling framework: concepts, structure, andextensibility. Statistics and Computing 10:325–337.
Millar, R. B., and R. Meyer. 2000. Non-linear state space modelling offisheries biomass dynamics by using Metropolis–Hastings within-Gibbssampling. Applied Statistics 49:327–342.
Millsap, B. A., and G. T. Allen. 2006. Effects of falconry harvest on wildraptor populations in the United States: theoretical considerations andmanagement recommendations. Wildlife Society Bulletin 34:1392–1400.
Milner-Gulland, E. J., and H. R. Akcakaya. 2001. Sustainability indices forexploited populations. Trends in Ecology & Evolution 16:686–692.
Nichols, J. D., J. E. Hines, J. R. Sauer, F. W. Fallon, J. E. Fallon, and P. J.Heglund. 2000. A double-observer approach for estimating detectionprobability and abundance from points counts. Auk 117:393–408.
Parker, P. G., T. A. Waite, and M. D. Decker. 1995. Kinship andassociation in communally roosting black vultures. Animal Behavior 49:395–401.
Quinn, T. J., II, and R. B. Deriso. 1999. Quantitative fish dynamics.Oxford University Press, New York, New York, USA.
Rabenold, P. P. 1986. Family associations in communally roosting blackvultures. Auk 103:32–41.
Rabenold, P. P., and M. D. Decker. 1990. Black vultures in NorthCarolina: statewide population surveys and analysis of Chatham Countypopulation trends. Final report to North Carolina Wildlife ResourcesCommission, Nongame and Endangered Wildlife Program, Contract no.1989SG07. Purdue University, West Lafayette, Indiana, USA.
Robbins, C. S., D. Bystrak, and P. H. Geissler. 1986. The Breeding BirdSurvey: its first fifteen years, 1965–1979. U.S. Fish and Wildlife ServiceResource Publication 157, Washington, D.C., USA.
Robertson, A. S. 1984. Aspects of the population dynamics of cape vulturesin the Cape Province. Ostrich 55:196–206.
Rosenberg, K. V., and P. J. Blancher. 2005. Setting numerical populationobjectives for priority landbird species. Pages 57–67 in C. J. Ralph and T.D. Rich, editors. Proceedings of the Third International Partners inFlight Conference. U.S. Department of Agriculture Forest ServiceGeneral Technical Report PSW-GTR-191, Albany, California, USA.
Runge, M. C., and F. A. Johnson. 2002. The importance of functional formin optimal control solutions of problems in population dynamics. Ecology83:1357–1371.
Runge, M. C., F. A. Johnson, M. G. Anderson, M. D. Koneff, E. T. Reed,and S. E. Mott. 2006. The need for coherence between waterfowl harvestand habitat management. Wildlife Society Bulletin 34:1231–1237.
Runge, M. C., W. L. Kendall, and J. D. Nichols. 2004. Exploitation. Pages303–328 in W. J. Sutherland, I. Newton, and R. E. Green, editors. Birdecology and conservation: a handbook of techniques. Oxford UniversityPress, Oxford, United Kingdom.
Sarrazin, F., C. Bagnolini, J. L. Pinna, and E. Danchin. 1996. Breedingbiology during establishment of a reintroduced griffon vulture Gyps fulvus
population. Ibis 138:315–325.
Sarrazin, F., C. Bagnolini, J. L. Pinna, E. Danchin, and J. Clobert. 1994.High survival estimates of griffon vultures (Gyps fulvus fulvus) in areintroduced population. Auk 111:853–862.
Sauer, J. R., J. E. Hines, and J. Fallon. 2007. The North American BreedingBird Survey, results and analyses 1966–2006. Version 10.13.2007. U.S.Geological Survey Patuxent Wildlife Research Center, Laurel, Maryland,USA. ,http://www.mbr-pwrc.usgs.gov/bbs/bbs.html.. Accessed 16 Jan2008.
Sauer, J. R., W. A. Link, W. L. Kendall, J. R. Kelley, Jr., and D. K. Niven.2008. A hierarchical model for estimating change in American woodcockpopulations. Journal of Wildlife Management 72:204–214.
Slade, N. A., R. Gomulkiewicz, and H. M. Alexander. 1998. Alternativesto Robinson and Redford’s method of assessing overharvest fromincomplete demographic data. Conservation Biology 12:148–155.
Tillman, E. A., J. S. Humphrey, and M. L. Avery. 2002. Use of effigies anddecoys to reduce vulture damage to property and agriculture. Proceedingsof the Vertebrate Pest Conference 20:123–128.
United States Department of Agriculture. 2002. Environmental assessmentfor the management of vulture damage in the Commonwealth ofVirginia. U.S. Department of Agriculture, Animal and Plant HealthInspection Service, Wildlife Services, Moseley, Virginia, USA.
United States Fish and Wildlife Service [USFWS]. 2007. Final Environ-mental Impact Statement: light goose management. U.S. Department ofInterior, Fish and Wildlife Service, Washington, D.C., USA.
Wade, P. R. 1998. Calculating limits to the allowable human-causedmortality of cetaceans and pinnipeds. Marine Mammal Science 14:1–37.
Associate Editor: Euler.
Runge et al. � Allowable Take of Migratory Birds 565
Copyright © 2022 FDOKUMEN