CMS - SPWG - Convention on the Conservation of Migratory ...
ARTICLE IN PRESS
Journal of Theoretical Biology 257 (2009) 203–211
Contents lists available at ScienceDirect
Journal of Theoretical Biology
0022-51
doi:10.1
� Corr
E-m
amoller
journal homepage: www.elsevier.com/locate/yjtbi
A quantitative measure of migratory connectivity
Roberto Ambrosini a,�, Anders Pape Møller b, Nicola Saino c
a Dipartimento di Biotecnologie e Bioscienze, Universita degli Studi di Milano Bicocca, piazza della Scienza 2, I-20126 Milano, Italyb Laboratoire de Parasitologie Evolutive, CNRS UMR 7625, Universite Pierre et Marie Curie, 7 quai St. Bernard, Case 237, F-75252 Paris Cedex 05, Francec Dipartimento di Biologia, Universita degli Studi di Milano, via Celoria 26, I-20133 Milano, Italy
a r t i c l e i n f o
Article history:
Received 12 February 2008
Received in revised form
18 October 2008
Accepted 26 November 2008Available online 6 December 2008
Keywords:
Barn swallow
Hirundo rustica
k-Means clustering
Mantel test
Migration
93/$ - see front matter & 2008 Elsevier Ltd. A
016/j.jtbi.2008.11.019
esponding author. Tel.: +39 0264483464; fax
ail addresses: [email protected] (R
@snv.jussieu.fr (A.P. Møller), nicola.saino@uni
a b s t r a c t
The study of the extent of the connection between areas where populations of birds breed and areas
where they winter has flourished in recent years mainly thanks to the development of new techniques,
but also due to traditional ringing and recovery schemes, which allow tracking of individuals or
populations linking wintering and breeding distributions. Currently, studies on migratory connectivity
focus on retention of breeding population spatial structure on the non-breeding grounds and vice versa.
Here we propose a method to quantify migratory connectivity based on Mantel correlation
coefficients and to statistically test for deviations of the observed connectivity from a random mix of
individuals. In addition, we propose a procedure, based on clustering algorithms, to identify whether
observed connectivity depends on aggregation of individuals or on rigid transference of distribution
patterns between areas.
We applied this method to a large dataset of ringing recoveries of barn swallows (Hirundo rustica L)
migrating from their Western Palearctic breeding areas to sub-Saharan winter quarters. We show that
migration of barn swallow populations connects specific breeding and wintering areas, and that the
‘‘sub-populations’’ quantitatively identified by our method are consistent with qualitative patterns of
migratory connectivity identified by studies of individual geographical populations based on other
methods. Finally, we tested the performance of the method by running simulations under different
scenarios. Such simulations showed that the method is robust and able to correctly detect migratory
connectivity even with smaller datasets and when a strong geographical pattern is not present in the
population. Our method provides a quantitative measure of migratory connectivity and allows for the
identification of populations showing high connectivity between the breeding and wintering areas. This
method is suitable for a generalized application to diverse animal taxa as well as to large scale analyses
of connectivity for conservation purposes.
& 2008 Elsevier Ltd. All rights reserved.
1. Introduction
Migratory connectivity has been defined as the links betweenbreeding and non-breeding areas of migratory animals due tomigration (Webster et al., 2002). Several different approacheshave been proposed for the study of migratory connectivity, suchas ringing recoveries (Anderson et al., 2001), satellite radiotelemetry (Cohn, 1999), stable isotope analysis of feathers(e.g. Hobson and Wassenaar, 1997; Marra et al., 1998; Møllerand Hobson, 2003; Hobson, 2005), genetic analysis (Websteret al., 2002; Lopes et al., 2006), and correlation analysis betweenpoint estimates of annual survival rates and proxies of ecologicalconditions putatively affecting survival (e.g. the NormalizedDifference Vegetation Index; Szep et al., 2006).
ll rights reserved.
: +39 0264483565.
. Ambrosini),
mi.it (N. Saino).
A qualitative measure of migratory connectivity has beenproposed by Webster et al. (2002), who argued that ‘‘strong’’connectivity occurs when most individuals from one breedingpopulation move to the same non-breeding location, while a‘‘weak’’ or ‘‘diffuse’’ connectivity occurs when individuals from asingle breeding population spread through several non-breedinggrounds. Statistical approaches that have been proposed toquantify migratory connectivity are based on the same procedurethat is commonly used to solve the problem of the ‘‘derivation ofharvest’’ in waterfowl management (Marra et al., 2006). Theyimply the definition of transition probabilities that describe howindividuals from a breeding population move to each winteringlocation and the calculation of conditional probabilities ofderivation of an individual from a given site (‘‘origin probabil-ities’’) using Bayes’ rule (Marra et al., 2006). This procedure,however, requires an a priori identification of ‘‘sub-ranges’’(see Webster et al., 2002; Marra et al., 2006), which may be adifficult and somewhat arbitrary task, at least in species withcontinuous breeding and/or non-breeding ranges. In addition,

ARTICLE IN PRESS
R. Ambrosini et al. / Journal of Theoretical Biology 257 (2009) 203–211204
estimating conditional probabilities in such Bayesian frameworkrequires prior knowledge of population sizes, at least relative toeach other, among the various origin sub-ranges (Marra et al.,2006) that may be difficult to acquire unless information fromintensive, large-scale population survey programs is available.Finally, recovery probabilities must be assumed to be proportionalto the relative abundance on the origin grounds. If this assump-tion is unwarranted, true connectivity among sub-populationsmay be overlooked.
Currently, studies on migratory connectivity focus on theretention of breeding population structure on the non-breedinggrounds (and vice versa) (Marra et al., 2006). If individuals thatbreed close to each other also winter close to each other(allohiemy sensu Salomonsen, 1955) then a strong connectivityoccurs, while if they mix (sinhiemy) connectivity is weak.Theoretically, if the positions of individuals, both in the breedingand in the wintering grounds are known, then two distancematrices can be calculated, representing the distance within eachpair of individuals in the breeding or the wintering grounds,respectively. Besag and Diggle (1977) proposed to test for thesignificance of the maintenance of reciprocal distribution inbreeding and wintering grounds in a blackbird (Turdus merula L)population by testing for the significance of the correlationbetween the matrix of distances in the breeding grounds andthat in the wintering grounds. If individuals that breed closetogether also winter close together (i.e. the population showsstrong connectivity), then a strong positive correlation is expectedbetween the two matrices. Conversely, if individuals mix (weakconnectivity) a weak correlation is expected. A measure of thecorrelation between the two distance matrices can therefore beused to quantify migratory connectivity and to statistically test forthe probability of observing a given pattern, under the nullhypothesis of a random mix among individuals at the breedingand/or the non-breeding grounds, a condition for which acorrelation coefficient of zero is expected. Such a test, known asthe Mantel test (Sokal and Rohlf, 1995), does not imply an a prioriidentification of separated sub-ranges in the breeding andwintering grounds. We emphasize that, in this approach, thelength of the migration journey is not taken into account as theonly measures involved in the analysis are distances betweenindividuals in the breeding and in the wintering grounds.
A significant correlation between the distance matrices,however, can result from two different processes. The firstconsists of individuals that maintain the same reciprocal positionin the breeding and wintering grounds. Following Besag andDiggle (1977) we refer to this process as to ‘‘distribution patterntransfer’’. We note that the correlation between the distancematrices will not vary under translation, rotation and scalechange of the pattern of distribution of individuals. Alternatively,if the population under study consists of groups of individualsthat stay close together both in the breeding and in the winteringgrounds, then a significant correlation between the distancematrices is also expected, as within-group distances will, onaverage, be smaller than distances between individuals ofdifferent groups.
A procedure for the quantitative study of migratory connectiv-ity should ideally allow disentangling these two processes and, ifnecessary, to identify the clusters of individuals that breed andwinter together. These goals can be achieved by applying aclustering algorithm to a distance matrix obtained from thecombination of the two matrices of distances between individualsat the breeding grounds and in the winter quarters. A significantconnectivity in a non-structured (i.e. non-clustered) populationindicates that migratory connectivity arises from a processof distribution pattern transference. Conversely, if clusteranalysis reveals a structure in the population, then grouping of
individuals that always stay together contributes to migratoryconnectivity. Within (main) clusters, individuals may thenshow pattern transference or further grouping, resulting insub-clusters.
In this study, we thus propose a novel approach to quantifymigratory connectivity. The method is based on Mantel test toassess the strength of migratory connectivity and cluster analysisto investigate the process that generates it and to unravel theclustered structure of the population.
We first assessed the performances of the method by runningsimulations under three different scenarios. In the first scenario,the connectivity was due to a process of distribution patterntransference. In the second, connectivity arose from the clusteredstructure of the simulated population, but no pattern transferenceoccurred for the individuals of the same cluster. In the third, wesimulate a condition where both processes occur simultaneously.In addition, to exemplify the use of this method, we apply it to alarge dataset of recoveries of barn swallows (Hirundo rustica L)ringed in their breeding range in Europe and recovered in theirsub-Saharan wintering quarters or vice versa.
Data from recoveries of ringed birds as a tool in the study ofconnectivity have been criticized on several bases, such as thelarge biases in the probability of recovery of individuals betweendifferent parts of the world (Webster et al., 2002). Still, theyrepresent the largest (and largely under-utilized) datasets cur-rently available on numerous migratory species. The resultsobtained from the analysis of the present dataset should thereforebe considered with this caveat in mind, and they will be comparedto other available information about the migration of barnswallows, including stability of the genetic variance–covariancematrix of different populations (Roff et al., 2004) and stableisotope analyses of feathers of different populations (Evans et al.,2003; Møller and Hobson, 2003).
The barn swallow is a small passerine bird that migrates eachyear from Europe to Africa south of the Sahara desert. Aconsiderable effort has been spent in the last decades to captureand ring barn swallows both in Africa and Europe mainly withinthe EURING and SAFRING ringing schemes. Recoveries andrecaptures of barn swallows are available from the entire breedingand wintering range of the species, encompassing an extremelywide geographical area and a very long time span. To the best ofour knowledge, this is one of the largest available data setsof ringing recoveries and we are convinced that the amount ofinformation it contains largely overcomes the ‘‘noise’’ due todifferences in ringing and capture efforts in different locationsand years.
2. Materials and methods
The method we are proposing is based on the coordinates ofindividuals recorded in the areas occupied in different phasesof the annual cycle. We assume that such grounds are geographi-cally separated and individuals move annually between themduring migrations. Since the large majority of the data aboutmigrants come from ornithological studies, we will refer to theseareas as the breeding and the wintering grounds, albeitthese definitions may not be strictly applicable to othermigrants (e.g. whales, for which ‘‘breeding’’ and ‘‘feeding’’grounds may be more appropriate). In all the analysis, includingthe simulations, we always started from datasets where theposition of individuals was expressed by geographical coordinates,since in real datasets position of individuals is usually recorded inthis way. Nevertheless, this method is applicable to any othercoordinate system as it basically requires only distances betweenindividuals.

ARTICLE IN PRESS
R. Ambrosini et al. / Journal of Theoretical Biology 257 (2009) 203–211 205
2.1. Analysis of migratory connectivity
From geographical coordinates of individuals both in thebreeding and wintering grounds, we calculated two matrices oforthodromic distances (i.e. the minimum path on the surface ofthe Earth), between all pairs of barn swallows both in thebreeding and the wintering quarters (see Fig. 1 for further details).
Mantel correlation coefficient (rM) was used to test for thecorrelation between orthodromic distance matrices. It corre-sponds to a simple Pearson product moment correlation coeffi-cient between the two matrices, whose significance is assessedwith a randomization procedure because distances betweenindividuals within each distance matrix are not statisticallyindependent (Sokal and Rohlf, 1995). We randomly permutatedthe position of individuals at the breeding grounds 999 times; foreach permutation, a distance matrix was calculated and itscorrelation coefficient with the actual distance matrix of indivi-duals at the wintering grounds was calculated. The significance ofthe observed Mantel coefficient was determined based on its rankin the set of the coefficients from the randomization procedure asP ¼ [(1000�rank)/1000].
The analysis of the spatial structure of the dataset was basedon a cluster detection approach. First, we combined the twodistance matrices into one by computing, for each pair ofindividuals, the square root of the sum of their squaredorthodromic distances at the breeding and wintering grounds.This measure can be considered an overall distance index similarto the Euclidean distance between two points that also takes theround shape of the Earth into account as it is based onorthodromic distances.
Cluster detection was then performed with the pam algorithmin S-Plus 4.5 applied to the overall distance indices matrix. Thenumber of clusters was identified as the number that maximizedthe overall average silhouette width (hereafter oasw for brevity)(Rousseeuw, 1987). The pam procedure (fully described inKaufman and Rousseeuw, 1990) is a partitioning clusteringalgorithm where the number of clusters must be indicated a
priori. The oasw is a measure of the goodness of the overallclassification of points in a given number of clusters. It is a
Fig. 1. Calculation of orthodromic distance between points A and B along a
spherical surface. Geographical coordinates (latitude ¼ j and longitude ¼ l) are
first converted into three-dimensional Cartesian coordinates (x, y, z) with Eqs.
(1)–(3) in figure. r is the average radius of the Earth (6371 km; Marshak, 2001).
Euclidean distance (d) between the points is easily calculated from Cartesian
coordinates by means of Pythagoras’ theorem and then converted into ortho-
dromic distance (l) with Eq. (4).
dimensionless coefficient of the extent of structure of clusteringthat has been identified. It is defined as the average value of thesilhouettes s(i) computed over all objects in the dataset where
sðiÞ ¼bðiÞ � aðiÞ
maxfaðiÞ;bðiÞg
a(i) being the average dissimilarity of i to all other objects of thecluster to which i belongs and b(i) the average dissimilarity of i toall objects of the nearest cluster to which i does not belong. s(i)values range between �1 and 1 and the larger the value, the betterthe classification of an object in a given cluster (Rousseeuw, 1987).The best number of clusters corresponds to the number thatmaximizes the oasw. The oasw values lower than 0.25 indicatethat no substantial structure has been found in the data, valuesbetween 0.26 and 0.50 indicate a ‘‘weak’’ structure, between 0.51and 0.70 a ‘‘reasonable’’ structure and values larger than 0.71 a‘‘strong’’ structure (Rousseeuw, 1987). Each cluster detected in thefirst step was investigated further with the same procedure, and, ifa significant structure was recognized, it was divided into sub-clusters, numbered as (dataset) � (main cluster) � (sub-cluster).
2.2. Simulations
In all simulations we assumed a uniform spherical surface withno limits to the movement of individuals. The centre of thecluster(s) of individuals in the breeding grounds were always setat 301N, while at 301S in the wintering grounds. Longitude of thecluster centre(s) varied during simulations (see below). Positionsof individuals were generated as a random determination from abivariate Gaussian distribution with unit standard deviation (SD)centred on the centre(s) of the cluster(s). The distance betweencluster centres and the random noise added to individualpositions (see below) were expressed as SD of the bivariateGaussian used to generate individual position within clusters. Ateach step of the simulation, all the analyses were run according to
Fig. 2. Results from the second simulation. Oasw: overall average silhouette width.
Gray surface colour indicates a simulation with a significant (Pp0.05) Mantel
correlation coefficient. Black surface colour represents non-significant simulations.
Plans represent oasw values of 0.5 and 0.7, respectively. Distances between cluster
centres are expressed as standard deviations (SD) of the bivariate Gaussian used to
generate individual position within clusters.

ARTICLE IN PRESS
R. Ambrosini et al. / Journal of Theoretical Biology 257 (2009) 203–211206
the method described above, and the significance of the Mantelcorrelation coefficient, the oasw value, the number of clustersidentified and the proportion of individuals correctly classifiedwere recorded.
The first simulation aimed at testing the ability of the methodwe propose to detect migratory connectivity arising from aprocess of distribution pattern transference (Besag and Diggle,1977). One cluster with 200 individuals was generated in thebreeding ground. In a process of pure pattern transference, thereciprocal position of individuals in the wintering grounds shouldstrictly reflect that in the breeding grounds except for randomvariation. This process was simulated by generating positions inthe wintering grounds corresponding to those in the breedinggrounds plus a bivariate normal random noise added to theposition of each individual. At each step of the simulation, the SDof the noise increased by 0.1 SD from 0 to 4 SD. Hence, thissimulation was run 41 times.
The second simulation aimed at testing the ability of themethod to detect migratory connectivity arising from a clusteredstructure in the population. Two clusters of 100 individuals weregenerated. The position of individuals within each cluster both inthe breeding and in the wintering grounds was randomlydetermined. Hence, no pattern transference existed within eachcluster. At each run of the simulation, the distance betweencluster centres in the wintering and/or in the breeding groundsincreased by 1 SD from 0 (i.e. clusters superimposed both in the
All (n = 11rM = 0.024
P = 0.054
oasw = 0.6
All.1 (n = 141)rM = 0.0644
P = 0.055
oasw = 0.433
All.1.1 (n = 96)rM = 0.0175
P = 0.292
All.1.2 (n = 45)rM = 0.2381
P = 0.004
AE (n = 432)rM = 0.4156
P < 0.001
oasw = 0.728
AE.1 (n = 86)rM = 0.0880
P = 0.046
oasw = 0.442
AE.1.1 (n = 60)rM = -0.0124
P = 0.404
AE.1.2 (n = 26)rM = 0.1642
P = 0.126
ArM
P
Fig. 3. Dendrogram of the analysis (a) of the whole set of recoveries and recaptures of ba
in Europe as adults (AE). rM: Mantel correlation coefficient; P: significance of the Mantel
width.
breeding and in the wintering grounds) to 10 SD, so that thissimulation was run 121 times.
The third simulation investigated a situation when bothclustering and pattern transference occurred. This third simula-tion followed the general scheme of the second, involving twoclusters of individuals with increasing distance between clustercentres, but, as in the first simulation, the reciprocal position ofindividuals within clusters in the wintering grounds reflected thatin the breeding grounds plus a random Gaussian noise withSD ¼ 0.2. This value was arbitrarily chosen as the first simulationdemonstrated that the amount of noise does not influence theperformance of the method (see below).
2.3. The barn swallow dataset
The whole dataset consisted of recoveries of individuallymarked barn swallows between 1911 and 1998. Only firstrecoveries were selected in order to avoid pseudo-replication.Individuals breeding east of longitude 601E (approximatelycorresponding to the Ural Mountains) were excluded. A firstdataset (hereafter called ‘‘All’’ for brevity) of 1103 barn swallowsincluded all individuals that were within the breeding range of thespecies between April and September and within the winteringrange between October and March. We then quantitativelyassessed the potential noise arising from recoveries of individuals
03)7
10
All .2 (n = 962)rM = 0.0593
P < 0.001
oasw = 0.553
All.2.1(n = 388)rM = 0.0804
P = 0.002
All.2.2 (n = 574)rM = 0.0251
P = 0.181
AE.2 (n = 346)rM = 0.2349
P < 0.001
oasw = 0.331
E.2.1 (n = 224)= 0.3466
< 0.001
AE.2.2 (n = 122)rM = 0.1413
P = 0.026
rn swallows (All) and (b) of the subset of data only including barn swallows ringed
test as assessed with the randomization procedure; oasw: overall average silhouette

ARTICLE IN PRESS
R. Ambrosini et al. / Journal of Theoretical Biology 257 (2009) 203–211 207
during migration by selecting a second dataset (‘‘FP’’) of 225 barnswallows that were within the breeding range in May–June andwithin the winter quarters in December–February, i.e. in the focalperiods of reproduction and wintering, respectively. Natal dis-persal in the barn swallow is larger than breeding dispersal(Turner, 1994). This may bias the results if the proportion of ringedadults and young varies geographically. In addition, in Africa alarge number of barn swallows were ringed in a rather smallnumber of sites so that cluster detection could be biased by thesmall distance between ringing sites of many individuals. Hence, athird dataset (‘‘AE’’) was selected, only including barn swallowsringed in Europe as adults. Finally, the two previous selectioncriteria were combined to obtain a fourth restricted dataset (‘‘R’’)of 71 barn swallows ringed as adults in Europe in May–June andrecovered in Africa in December–February. We then compared theresults of the analyses based on the four datasets by investigatingconsistency of classification of individuals into clusters.
3. Results
3.1. Simulations
In all the 41 runs of the first simulations, a highly significantMantel correlation coefficient was found (rMo0.001 in all cases).No cluster structure was present in the data and thereforeclassification of individuals into clusters was not relevant.
Fig. 2 summarizes the results of the second simulation.In 14 cases, the method failed to detect connectivity, i.e. boththe Mantel correlation coefficient was not significant and the oasw
value was lower than 0.5. In all these cases, the distance betweencluster centres in one area was 0 or 1 SD. Clusters generated asrandom determination from a bivariate Gaussian are roughlycircular and about 90% of individuals lie within 2 SD from thecentre. Hence, a distance of 1 SD between cluster centres impliesthat at least 60% of individuals lie in the common area. We notethat no within-cluster pattern transference occurred in thissimulation, so that non-significant Mantel coefficients wereexpected when clusters were close together. In another 14 casesthe oasw value did not indicate a reasonable structure in the data,but the Mantel coefficient was significant. In all these cases thetwo clusters partly overlapped at least in one area. However, alsoin these cases more than 90% of individuals were correctlyclassified into two clusters.
Mantel correlation coefficient was significant in all the 121runs of the third simulation. In 24 cases, always with partlyoverlapping clusters, oasw values did not reveal a reasonablestructure in the data albeit only in 10 cases cluster analysiscorrectly classified less than 90% of individuals.
3.2. Barn swallow dataset
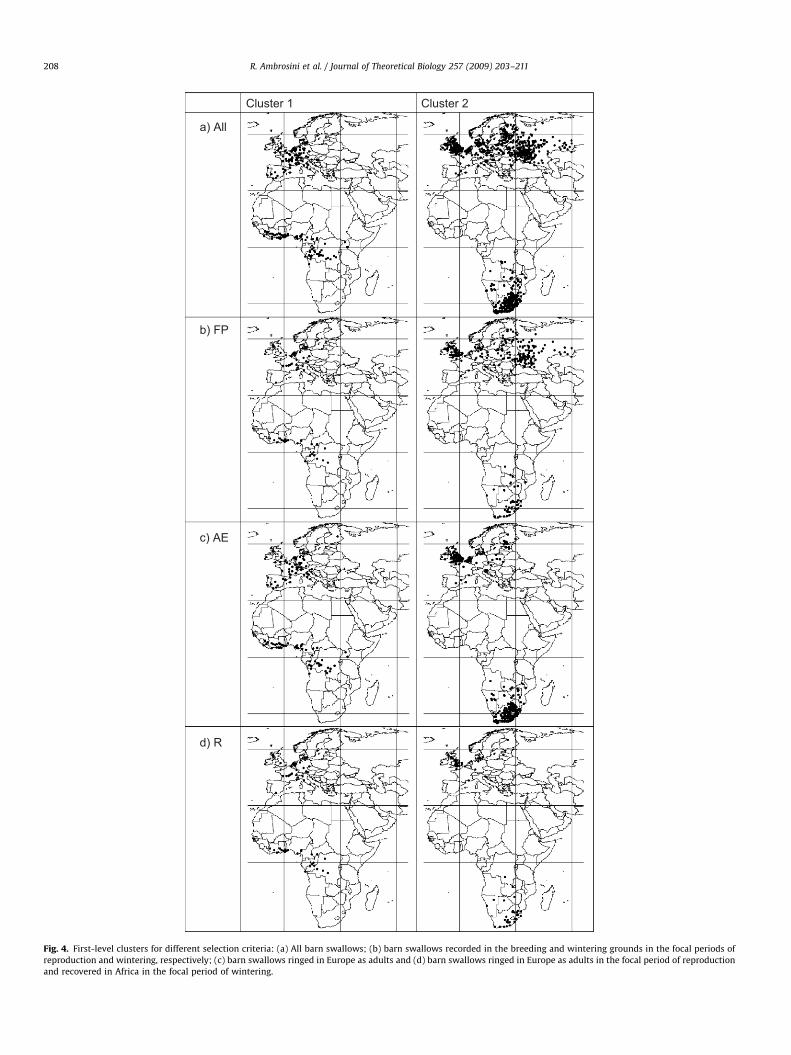
The Mantel correlation coefficient for the ‘‘All’’ dataset was0.0247 (Fig. 3a). In the randomization procedure we obtained 54times a correlation coefficient larger than the observed one.Migratory connectivity should therefore be considered marginallynon-significant (P ¼ 0.054). However, the oasw value suggested a‘‘reasonable’’ structure with two clusters that also emerged fromthe analysis of the data subsets (see below). For this reason, weidentified two clusters that are shown in Fig. 4a and pictorially inFig. 5a. The corresponding silhouette plot is shown in Fig. 6. Meanorthodromic distance between individuals in Europe was 1358.16(941.673 SD) km (range 0–5400.34 km) while in Africa it was1493.67 (1553.880 SD) km (range 0–6192.57 km). Hence, distancesin both ranges were similar, and the pattern of distribution in the
two ranges had similar effects on cluster detection and composi-tion. Cluster All.1 mainly included barn swallows breeding inSouth-Western Europe and wintering from Liberia to Uganda,while cluster All.2 was mainly constituted of barn swallows fromNorthern Europe that winter south of the Equator, from Zaire toSouth Africa. The clusters partly overlap at the breeding groundswhile they are well separated in the wintering grounds.
Mantel tests showed a significant migratory connectivity forcluster All.2 and a marginally non-significant connectivityfor cluster All.1 that, however, showed an oasw of 0.433(i.e. reasonably high) (Fig. 3). We therefore analysed the structureof both clusters (see also Discussion) that could be divided intotwo sub-clusters each (All.1.1, All.1.2, All.2.1 and All.2.2, pictoriallyshown in Fig. 5b). In the next step of the analysis, only clustersAll.1.2 and All.2.1 could be further divided into two and six third-level sub-clusters, respectively. However, the results at this finelevel were inconsistent between data subsets (see below), andthey are therefore not presented in detail.
The ‘‘FP’’ subset showed a significant connectivity (n ¼ 255,rM ¼ 0.0701, P ¼ 0.005). The oasw reached its maximum value( ¼ 0.582) for two clusters, thus indicating a reasonable structurein the data. At the second step of analysis, cluster FP.1 could bedivided into two second-level sub-clusters based on oasw value(n ¼ 32, rM ¼ 0.0768, P ¼ 0.140, oasw ¼ 0.484), while cluster FP.2was significantly structured with two sub-clusters (n ¼ 223,rM ¼ 0.0670, P ¼ 0.002, oasw ¼ 0.510), none of which could befurther subdivided (details not shown). These results are con-sistent with the results of the analysis of the ‘‘All’’ set of data.Indeed, all individuals classified in cluster FP.1 had been classifiedin cluster All.1 and all individuals in FP.2 had been classified inAll.2. At the second level of analysis, only three individuals weremisclassified.
The details of the results of the analysis of the ‘‘AE’’ set of barnswallows are shown in Fig. 3b. The individuals showed significantconnectivity and could be grouped into two clusters that, in turn,were both structured in two sub-clusters. Sub-clusters AE.1.1 andAE.1.2 showed non-significant connectivity, while AE.2.1 andAE.2.2 were structured and could be divided into two and fourthird-level sub-clusters, respectively (details not shown). How-ever, as we did for the ‘‘All’’ dataset, we cautiously considered theresults only to the second step of the analysis. The resultsobtained from this selection criterion were highly consistent withthe results of the analysis of the ‘‘All’’ dataset at the first level ofanalysis, and at the second level for cluster AE.1. Indeed only threeout of the 86 individuals classified in AE.1 were classified in All.2,and three individuals of AE.1.2 were classified in All.2.1. Thepartitioning of cluster AE.2 was not consistent with that obtainedfrom the ‘‘All’’ dataset. This was due to the small number of barnswallows (32) in cluster All.2.1 that were ringed in Europe asadults and thus included in the ‘‘AE’’ subset.
The most restricted subset of data (‘‘R’’) only included 71 barnswallows. The Mantel test indicated a significant connectivity(rM ¼ 0.2243, Po0.001), and the oasw value ( ¼ 0.646) showedthat it could be divided into two sub-clusters. The first clustercould be divided into two sub-clusters according to oasw value(R.1: n ¼ 32, rM ¼ 0.0768, P ¼ 0.155, oasw ¼ 0.484) while thesecond was not structured (R.2: n ¼ 39, rM ¼ �0.0371, P ¼ 0.555,oaswp0.367). All individuals in R.1 had previously been classifiedinto All.1 and all individuals in R.2 into All.2. Consistent resultsemerged also at the second level with no individual beingmisclassified.
Thus, the four levels of selection of the dataset, despitediffering in composition and number of individuals, led to highlyconsistent clustering of individual barn swallows, whereby thelarge majority of individuals were assigned to correspondingclusters in the different analyses.
ARTICLE IN PRESS
Cluster 1 Cluster 2
a) All
b) FP
c) AE
d) R
Fig. 4. First-level clusters for different selection criteria: (a) All barn swallows; (b) barn swallows recorded in the breeding and wintering grounds in the focal periods of
reproduction and wintering, respectively; (c) barn swallows ringed in Europe as adults and (d) barn swallows ringed in Europe as adults in the focal period of reproduction
and recovered in Africa in the focal period of wintering.
R. Ambrosini et al. / Journal of Theoretical Biology 257 (2009) 203–211208
ARTICLE IN PRESS
1.1
1.2
2.1
1.1
1
1
2.1
2.2 2
2
2.2
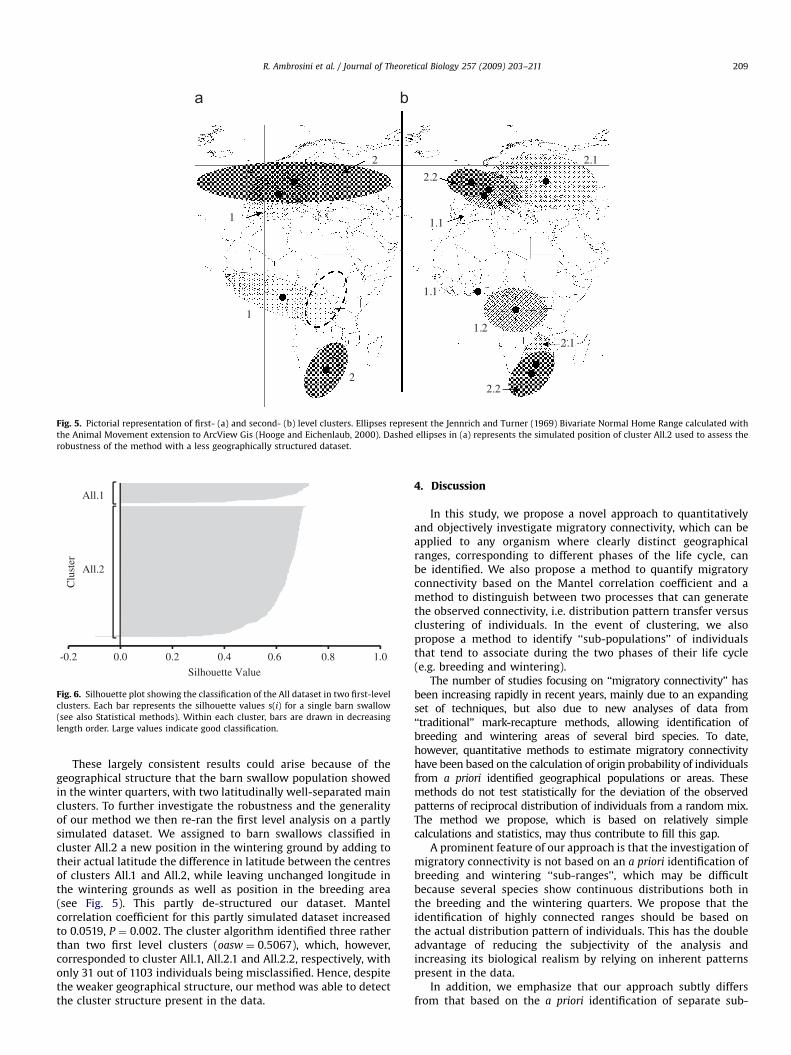
Fig. 5. Pictorial representation of first- (a) and second- (b) level clusters. Ellipses represent the Jennrich and Turner (1969) Bivariate Normal Home Range calculated with
the Animal Movement extension to ArcView Gis (Hooge and Eichenlaub, 2000). Dashed ellipses in (a) represents the simulated position of cluster All.2 used to assess the
robustness of the method with a less geographically structured dataset.
-0.2 0.2 0.4 0.6 0.8 1.00.0
Silhouette Value
Clu
ster
All.1
All.2
Fig. 6. Silhouette plot showing the classification of the All dataset in two first-level
clusters. Each bar represents the silhouette values s(i) for a single barn swallow
(see also Statistical methods). Within each cluster, bars are drawn in decreasing
length order. Large values indicate good classification.
R. Ambrosini et al. / Journal of Theoretical Biology 257 (2009) 203–211 209
These largely consistent results could arise because of thegeographical structure that the barn swallow population showedin the winter quarters, with two latitudinally well-separated mainclusters. To further investigate the robustness and the generalityof our method we then re-ran the first level analysis on a partlysimulated dataset. We assigned to barn swallows classified incluster All.2 a new position in the wintering ground by adding totheir actual latitude the difference in latitude between the centresof clusters All.1 and All.2, while leaving unchanged longitude inthe wintering grounds as well as position in the breeding area(see Fig. 5). This partly de-structured our dataset. Mantelcorrelation coefficient for this partly simulated dataset increasedto 0.0519, P ¼ 0.002. The cluster algorithm identified three ratherthan two first level clusters (oasw ¼ 0.5067), which, however,corresponded to cluster All.1, All.2.1 and All.2.2, respectively, withonly 31 out of 1103 individuals being misclassified. Hence, despitethe weaker geographical structure, our method was able to detectthe cluster structure present in the data.
4. Discussion
In this study, we propose a novel approach to quantitativelyand objectively investigate migratory connectivity, which can beapplied to any organism where clearly distinct geographicalranges, corresponding to different phases of the life cycle, canbe identified. We also propose a method to quantify migratoryconnectivity based on the Mantel correlation coefficient and amethod to distinguish between two processes that can generatethe observed connectivity, i.e. distribution pattern transfer versusclustering of individuals. In the event of clustering, we alsopropose a method to identify ‘‘sub-populations’’ of individualsthat tend to associate during the two phases of their life cycle(e.g. breeding and wintering).
The number of studies focusing on ‘‘migratory connectivity’’ hasbeen increasing rapidly in recent years, mainly due to an expandingset of techniques, but also due to new analyses of data from‘‘traditional’’ mark-recapture methods, allowing identification ofbreeding and wintering areas of several bird species. To date,however, quantitative methods to estimate migratory connectivityhave been based on the calculation of origin probability of individualsfrom a priori identified geographical populations or areas. Thesemethods do not test statistically for the deviation of the observedpatterns of reciprocal distribution of individuals from a random mix.The method we propose, which is based on relatively simplecalculations and statistics, may thus contribute to fill this gap.
A prominent feature of our approach is that the investigation ofmigratory connectivity is not based on an a priori identification ofbreeding and wintering ‘‘sub-ranges’’, which may be difficultbecause several species show continuous distributions both inthe breeding and the wintering quarters. We propose that theidentification of highly connected ranges should be based onthe actual distribution pattern of individuals. This has the doubleadvantage of reducing the subjectivity of the analysis andincreasing its biological realism by relying on inherent patternspresent in the data.
In addition, we emphasize that our approach subtly differsfrom that based on the a priori identification of separate sub-

ARTICLE IN PRESS
R. Ambrosini et al. / Journal of Theoretical Biology 257 (2009) 203–211210
ranges. In fact, following that approach, the level of connectivitywould appear to differ depending on which of the differentbreeding and wintering populations is currently under focus.Imagine, for example, a single group (population) of individualsthat breeds in an area (B) and winter in two well-separated areas(W1 and W2). B would be defined as moderately connected toeither W1 or W2, whereas both W1 and W2 would be defined asstrongly connected to B. Thus, an asymmetry is implicit in thatapproach, with a larger relevance usually given to the breedingareas. Our approach solves this problem as equal relevance isgiven to each distance matrix, and number and composition ofgroups of individuals is assessed a posteriori by means of clusteranalysis. In our approach, identification of sub-ranges and highlyconnected areas follows from the identification of clusters ofindividuals that connect regions by means of their migration.
Some of the features of our method deserve close considera-tion. First, the method we used to combine the two distancematrices into the overall Euclidean distance matrix implies that,for a given distance between two data-points in one range, theirchances to be classified in the same cluster declines as theirdistance in the other range increases. This is desirable because,according to the symmetric approach that we are proposing(see above), only individuals that tend to both breed and wintertogether should be classified into the same group. Second, theclustering procedure we chose involves the comparison of theclustering efficiency, based on the oasw, when data are forcedinto 2;3; . . . ;n clusters and the univocal identification of the bestnumber of clusters. As a drawback of the method, however, if thepattern of distribution of sampling locations varies markedlybetween the breeding and the wintering areas, some clusters maybe obscured and forced by the clustering algorithm to join withother clusters. Finally, high connectivity does not imply, per se, ahighly clustered population. If, for example, uniformly dispersedindividuals in the breeding areas tend to maintain the sameposition, relative to the other individuals, in the wintering areas(i.e. in the case of distribution pattern transfer), the connectivitywill be high even in the absence of a clear grouping of individuals.Thus, our approach allows inferring connectivity arising fromdistribution pattern transfer when the Mantel correlation coeffi-cient is significant, but the whole population cannot be parti-tioned into well-defined clusters.
The simulations we run under three different scenarios givefurther insights into the interpretation of the results and therobustness of this method. First of all, the Mantel correlationcoefficient is able to detect connectivity due to distributionpattern transference even when a large random noise is added tothe data. This clearly emerges from the results of the first and thethird simulations. In the second and third simulation, oasw valueslower than the suggested threshold of 0.5 were recorded in severalruns where a cluster structure could then be identified, asindicated by the fact that the same clustering algorithm was ableto detect the correct number of clusters and to correctly classifymore than 95% of individuals in all but 18 simulations of thesecond and third types. In all cases where the method failed todetect connectivity, the distance between cluster centres was notlarger than 3 SD in one area and not larger than 2 SD in the other,implying that the grouping structure was obscured by the factthat about 13% of individuals mixed in one ground and about 60%in the other (details of this calculations are not shown for brevity).On the other hand, Mantel correlation coefficients seemed rathersensitive in detecting a structure in a population also when itarose from grouping of individuals. Based on these results, wesuggest to always investigate the cluster structure of a populationwhen the Mantel test is significant, and to use the value of theMantel correlation coefficient as a measure of migratory con-nectivity. In addition, we tentatively suggest to investigate the
structure of a group of individuals when the oasw is larger than0.4, since, based on our simulations, the suggested threshold of0.5 may be too high. We admit, however, that further investiga-tion is needed to identify an optimal threshold for the oasw value.
Our method can be widely applied to different kinds of dataabout migratory birds (and other migratory animals). Indeed, thismethod of analysis is applicable to any pair of matrices of distanceindices between individuals and not to geographical distancesonly. For example, a large number of studies about migratoryconnectivity is based on the analysis of the isotopic compositionof feathers (see e.g. Hobson, 2005). Differences in the isotopiccomposition are considered to be related to the distance in thelocations where individuals moult their feathers at least in areaswhere specific geographical gradients in isotopic abundance exist(Hobson, 2005). Hence, a measure of the migratory connectivityfor a population can be obtained by correlating the matrix ofgeographic distances between places where individuals werecaptured and the matrix of differences in the isotopic compositionof their feathers. During moult, birds simultaneously wear bothrecently moulted and old feathers when in the wintering or in thebreeding areas. The two matrices derived from isotopic profiles ofnewly moulted and old feathers should be readily suitable for theanalyses proposed here. Likewise, our method could be applied toa matrix of isotopic profiles produced in winter and a secondmatrix of genetic markers for the same individuals reflecting thepopulation genetic structure of individuals at the breedinggrounds. We emphasize, however, that our method could beapplied to distances in the isotopic profiles and/or geneticdistances provided that they are univocally related to geographicdistances between individuals. For example, deuterium values inNorth America vary along a latitudinal gradient and weretherefore used to study migration of birds moving in a north–south direction (Hobson, 2005), but this may not be the case forother areas or other isotopes, like 13C and 15N in Africa, whichprovide habitat-specific, rather than geographic area-specificmarkers (Møller and Hobson, 2003), so that distance in isotopiccomposition may not reflect true geographic distance betweenindividuals. As concerns genetic distances, these usually fulfil thecriterion because isolation by distance is a common feature ofsuch distances.
We applied our method to a large ringing and recovery datasetof a Palearctic migratory bird species that has been subject tointensive ringing programmes. We found that the WesternPalearctic breeding population of barn swallows is structuredinto two main ‘‘sub-populations’’. The first population breeds inSouth-Western Europe and winters in an elongated belt fromLiberia to Uganda, while the second population breeds in North-ern Europe and winters south of the Equator. A second level ofanalysis showed that both main groups could be split into twosub-groups. Barn swallows breeding in South-Western Europecould be divided according to segregation in the winteringquarters with a first sub-group including barn swallows winteringfrom Liberia to Cameroon and a second including barn swallowsthat winter from Cameroon to Uganda. Conversely, the secondmain group can be divided according to segregation in thebreeding grounds, with a first sub-cluster that includes barnswallows mainly breeding in North-Eastern Europe and a secondgroup including barn swallows that breed in North-WesternEurope (Fig. 5b).
This pattern was identified based on the entire dataset (1103individuals), although the analyses were possibly confounded bythe fact that either breeding and wintering ringing or recoverycould partly refer to migrating individuals. In addition, differencesin ringing effort at each ringing location may skew the results asthe number of ringed birds recovered at each location canbe considered proportional to capture effort. This problem could

ARTICLE IN PRESS
R. Ambrosini et al. / Journal of Theoretical Biology 257 (2009) 203–211 211
be exacerbated by the fact that larger ringing effort may bedevoted in areas with higher bird densities. Unfortunately, noquantitative measure of ringing effort was available so it wasimpossible to correct for this potential bias. However, the analysesbased on different subsets of data identified according toincreasingly conservative criteria gave largely consistent resultsto those based on the entire dataset, suggesting that the analysiswas robust to the interference of different potential sources of biasand even sample size. However, for several bird species less than200 recoveries may be available and small sample size mayreduce the power of the tests. Further theoretical as well assimulation studies are therefore needed to assess the effect ofsample size on the detection of migratory connectivity. However,some preliminary results indicate that this method is robust whenat least 35 recaptures are available (R. Ambrosini, unpublishedresults). In addition, we emphasize that our main goal was topropose a method to quantify migratory connectivity, and thatthis large set of real data was only used to exemplify itsapplication.
Despite these potential drawbacks, the results of the presentanalysis of connectivity can be qualitatively compared to theresults obtained using different approaches. The subdivision ofthe Western Palearctic barn swallow population in two main sub-populations is roughly consistent with the observation ofdifferences in the quantitative genetic variance–covariance matrix(G-matrix) between barn swallows from Northern and SouthernEurope (Roff et al., 2004). In addition, in an analysis of the isotopiccomposition of feathers, Evans et al. (2003) identified segregationin the wintering quarters of barn swallows breeding in Englandand Switzerland. This is consistent with our results, as British barnswallows are mainly classified in a group that winters in SouthernAfrica, while Swiss barn swallows were included in the clusterwintering north of the Equator. Moreover, stable isotope composi-tion of feathers of barn swallows indicates that birds that breed inDenmark winter in at least two different areas with differentlevels of d15N (Møller and Hobson, 2003). This is consistent withour results, since barn swallows breeding in Denmark wereclassified partly in the first and partly in the second first-levelclusters, whose African wintering grounds are separated. Highd15N values in willow warbler (Phylloscopus trochilus L) featherssampled in South Africa was reported by Bensch et al. (2006). Ifwe assume that isotopic profiles in barn swallow feathers are notdissimilar to those in the willow warbler, we can go further andtentatively suggest that d15N enriched cluster of Møller andHobson should correspond to cluster All.2 and the d15N depletedone to cluster All.1.
These results suggest that analyses of stable isotopes or othermarkers of group identity of barn swallows should provideevidence of clusters similar to those reported in Fig. 4, both whenbased on captures in the winter quarters in Africa or at thebreeding grounds in Europe. Hence, the connectivity pattern wefound based on ringing recoveries is largely consistent with thepicture provided by studies of individual breeding populationsbased on different approaches. In addition, although the identi-fication of a structure of the barn swallow population under focusis not novel, our analysis provides a first quantitative measure ofmigratory connectivity.
In conclusion, we have proposed a quantitative measureof migratory connectivity and a method for identification of‘‘sub-populations’’ that are amenable to inferential statisticalanalysis and open the possibility of quantitatively investigatingthe relationships between different areas due to the movementof migrants between them. This measure can be quickly calculatedfor several species as large sets of data from recoveries arealready available at least for the most common species, anddatasets on genetic and isotopic distances between populations
are rapidly growing. In addition, a quantitative measure ofmigratory connectivity allows the comparison of migrationstrategies of different species and/or populations and thusallows further investigation of the ecological bases of theevolution of migratory systems. Finally, this method allowsestimates of migratory connectivity between geographicregions based on assemblages of species that migrate betweenthem. Such a measure may provide a substantial contribution inthe planning of effective conservation strategies for migratoryspecies.
Acknowledgements
EURING, SAFRING and numerous ringing centres in Europekindly provided access to their recoveries of ringed barn swallowsto APM. We are grateful to Dr. Riccardo Borgoni and to twoanonymous referees whose comments greatly improved thequality of the manuscript.
References
Anderson, A., Follestad, A., Nilsson, L., Persson, H., 2001. Migration patterns ofNordic Greylag Geese Anser anser. Ornis Sve 11, 19–58.
Bensch, S., Bengtsson, G., Akesson, S., 2006. Patterns of stable isotope signatures inwillow warbler feathers collected in Africa. J. Avian Biol. 37, 323–330.
Besag, J., Diggle, P.J., 1977. Simple Monte Carlo tests for spatial pattern. Appl. Stat.26, 327–333.
Cohn, J.P., 1999. Tracking wildlife: high-tech devices help biologists trace themovement of animals though sky and sea. BioScience 49, 12–17.
Evans, K.L., Waldron, S., Bradbury, R.B., 2003. Segregation in African winteringranges of England and Swiss swallow Hirundo rustica populations: a stableisotope study. Bird Study 50, 294–299.
Hobson, K.A., 2005. Stable isotopes and the determination of avian migratoryconnectivity and seasonal interactions. Auk 122, 1037–1048.
Hobson, K.A., Wassenaar, L.I., 1997. Linking breeding and wintering grounds ofneotropical migrant songbirds using stable hydrogen isotopic analysis offeathers. Oecologia 109, 142–148.
Hooge, P.N., Eichenlaub, B., 2000. Animal movement extension to Arcview. Ver.2.0.—Alaska Science Centre—Biological Science Office, US Geological Survey,Anchorage, AK, USA. Available from: /http://www.absc.usgs.gov/glba/gistools/index.htmS (accessed July 2007).
Jennrich, R.I., Turner, F.B., 1969. Measurement of non-circular home range. J. Theor.Biol. 22, 227–237.
Kaufman, L., Rousseeuw, P.J., 1990. Finding Groups in Data: An Introduction toCluster Analysis. Wiley, New York.
Lopes, R.J., Marques, J.C., Wennerberg, L., 2006. Migratory connectivity andtemporal segregation of dunlin (Calidris alpina) in Portugal: evidence formmorphology, ringing recoveries and mtDNA. J. Ornithol. 147, 85–94 doi: 10.007/s10336-005-0048-y.
Marra, P.P., Hobson, K.A., Holmes, R.T., 1998. Linking winter and summer eventsin a migratory bird by using a stable-carbon isotopes. Science 288,2040–2042.
Marra, P.P., Norris, D.R., Haig, S.M., Webster, M., Royle, J.A., 2006. Migratoryconnectivity. In: Crooks, K.R., Sanjan, M. (Eds.), Connectivity Conservation.Cambridge University Press, Cambridge, pp. 157–183.
Marshak, S., 2001. Earth: Portrait of a Planet. W.W. Norton & Company, New York.Møller, A.P., Hobson, K.A., 2003. Heterogeneity in stable isotopes profiles predicts
coexistence of populations of barn swallows Hirundo rustica differing inmorphology and reproductive performance. Proc. R. Soc. B 71, 1355–1362.
Roff, D.A., Mousseau, T., Møller, A.P., de Lope, F., Saino, N., 2004. Geographicvariation in the G matrices of wild populations of barn swallow. Heredity 93,8–14.
Rousseeuw, P.J., 1987. Silhouettes: a graphical aid to the interpretation andvalidation of cluster analysis. J. Comput. Appl. Math. 20, 53–65.
Salomonsen, F., 1955. The evolutionary significance of bird migration. Biol. Medd.22, 1–62.
Sokal, R.R., Rohlf, F.J., 1995. Biometry: The Principles and Practice of Statistics inBiological Research, third ed. Freeman, New York.
Szep, T., Møller, A.P., Piper, S., Nuttall, R., Szabo, Z.D., Pap, P.L., 2006. Searching forpotential wintering and migration areas of a Danish barn swallow populationin South Africa by correlating NDVI with survival estimates. J. Ornithol. 147,245–253.
Turner, A.K., 1994. The Swallow. Hamlyn, London.Webster, M.S., Marra, P.P., Haig, S.M., Bensch, S., Holmes, R.T., 2002. Links between
worlds: unravelling migratory connectivity. Trends Ecol. Evol. 17, 76–83 doi:10.106/S0169-5347(01)02380-1.
Copyright © 2022 FDOKUMEN