Simulations with complex measure
34
ratio of proporti 20 30 40 50 60 0.15 0.2 0 0 10 20 30 40 50 60 Linear Lattice Dimensions Re(J) R
Transcript of Simulations with complex measure

ratio of proportional errors
2030
4050
60 0.150.2
0.25
0
10
20
30
40
50
60
Linear Lattice Dimensions
Re(J)
R
ratio of proportional errors
2030
4050
60 0.60.65
0.7
0123456789
10
Linear Lattice Dimensions
Re(J)
R

arX
iv:h
ep-l
at/9
6100
06v2
20
Oct
199
7
Simulations with Complex Measure
J F Markhama and T D Kieua,b
aSchool of Physics, University of Melbourne, Parkville 3052, AustraliabDepartment of Physics, Columbia University, New York, NY 10027, USA
Abstract
A method is proposed to handle the sign problem in the sim-
ulation of systems having indefinite or complex-valued measures.
In general, this new approach, which is based on renormalisation
blocking, is shown to yield statistical errors smaller than the crude
Monte Carlo method using absolute values of the original mea-
sures. The improved method is applied to the 2D Ising model
with temperature generalised to take on complex values. It is
also adapted to implement Monte Carlo Renormalisation Group
calculations of the magnetic and thermal critical exponents.

1 The Monte Carlo sign problem
In order to evaluate a multi-dimensional integral
I ≡∫
fdV (1)
using Monte Carlo (MC) one can sample the points in the integration domain
with a non-uniform distribution, p, which reflects the contribution from the
measure f at each point, as in the importance sampling [1]. This sampling
gives the following estimate for the integral:
I ≈⟨
f
p
⟩
±√
S
N, (2)
where N is the number of points sampled, p ≥ 0 and is normalised∫
pdV = 1,
〈f/p〉 ≡ 1
N
N∑
i=1
f(xi)/p(xi).
and
S ≡∫
∣
∣
∣
∣
∣
f
p− I
∣
∣
∣
∣
∣
2
pdV,
≈⟨
f 2
p2
⟩
−⟨
f
p
⟩2
. (3)
The best choice of p is the one that minimises the standard deviation
squared S. This can be found by variational method leading to the crude
average-sign MC weight [2]
pcrude =|f |
∫ |f | dV, (4)
giving the optimal
Scrude =(∫
|f | dV)2
−∣
∣
∣
∣
(∫
fdV)∣
∣
∣
∣
2
. (5)
1

Applying to physical systems, MC method can be used to evaluate the
expectation value of some measurable quantity Θ
〈Θ〉 =
∑
{s}Θe−H
∑
{s}e−H
,
Z ≡∑
{s}
e−H , (6)
where s denotes the dynamical variables and H is the hamiltonian of an
equilibrium statistical system or the action of some Euclidean quantum field
theory.
Since an estimate of the denominator of (6) is independent of a particular
measurable and is needed in calculating all observables, it is to this that we
apply the MC method. The integral (1) now assumes the form of the partition
function Z, upon which the crude weight (4) takes on the explicit form
pcrude → |e−H |/∑
{s}
|e−H |. (7)
The Boltzmann weight e−H can in general be real but non-definite, or
even be complex-valued, in which case it is possible to generalise the absolute
values of real numbers in the above expressions to those of complex numbers.
And the error bars now can be visualised as the error radius in the complex
plane of a circle centred at the complex-valued central MC estimate. The
variational derivation still goes through as with real numbers.
We then have in the MC approximation
〈Θ〉 ≈
∑
MCconfigurations
Θ(
e−H/∣
∣
∣e−H∣
∣
∣
)
∑
MCconfigurations
(e−H/ |e−H |) ≡ 〈〈Θ〉〉crude
〈〈sign〉〉crude
. (8)
In the above 〈〈sign〉〉 also denotes the average, with respect to a given MC
weight, of the phase when e−H is complex.
2

The sign problem [3] arises when |〈〈sign〉〉| is vanishingly small: then un-
less a huge number of configurations are MC sampled, the large statistical
fluctuations of (8), because of the small denominator, render the measure-
ment meaningless.
Unfortunately, many interesting and important physical problems suffer
the sign problem like the real-time path integrals of quantum mechanics and
quantum field theory, lattice QCD at finite temperature and non-zero chem-
ical potential, lattice chiral gauge theory, quantum statistical system with
fermions . . . None of the existing proposals is quite satisfactory: complex
Langevin simulations [4] cannot be shown to converge to the desired distri-
bution and often fail to do so; others [5] are either restricted to too small a
lattice, too complicated, or not general enough or rather speculative.
In the next section we present another improved method, which is then
applied to the Ising model in two dimensions and the results will be compared
with the crude MC of this section, as well as with series-expansion data.
2 The improved method
One way of smoothing out the sign problem is to do part of the integral
analytically, and the remainder using MC [6]. The analytical summation is
not just directly over a subset of the dynamical variables; in general it can
be a renormalisation group (RG) blocking where coarse-grained variables are
introduced. We will show below that this does yield certain improvement
over the crude MC in general.
Let P{V ′, V } be the normalised RG weight relating the original variables
V to the blocked variables V ′ [7],
P{V ′, V } ≥ 0,
3

∫
P{V ′, V }dV ′ = 1.
Inserting this unity resolution into the integral (1)
I =∫
dV∫
dV ′P{V ′, V }f,
≡∫
dV ′g(V ′), (9)
and assuming that the blocking can be done exactly or approximated to a
good degree such that we then obtain g as a function of blocked variables in
closed form. An example of the RG blocking which we will employ in the next
section for the Ising model is the sum over spins on odd sites of the lattice,
leaving behind a measure g in terms of the other half of the spins on even
sites. Thus, an MC estimator is only needed for the remaining integration
over V ′ in (9). As with the crude method of the last section, variational
minimisation for S of (3), with g in place of f , leads to the improved MC
pimproved =|g|
∫ |g|dV ′. (10)
This one-step exact RG blocking already improves over the crude average-
sign method of the last section. Firstly, the improved weight sampling yields
in (8) a denominator of magnitude not less than that sampled by the crude
weight:
∣
∣
∣〈〈sign〉〉improved
∣
∣
∣ ≡ Z∫ |g|dV ′
,
=Z
∫ |∫ P{V ′, V }fdV | dV ′,
≥ Z∫ |f |dV
,
≡ |〈〈sign〉〉crude| , (11)
where we have used the definitions of the sampling weights in the second
equality, g in (9). The inequality is the triangle inequality from the properties
4

of P . In other words, from their definitions, 〈〈sign〉〉improved is proportional to
〈〈sign〉〉crude, with the proportionality constant is some function of temper-
ature and external fields. Both of them vanish when the partition function
does; away from this point, however, the improved method is no worse than
the crude one.
Secondly, it is also not difficult to see that the statistical fluctuations
associated with improved MC is not more than that of the crude MC,
Simproved − Scrude =∫
∣
∣
∣
∣
∣
g2
pimproved
∣
∣
∣
∣
∣
dV ′ −∫
∣
∣
∣
∣
∣
f 2
pcrude
∣
∣
∣
∣
∣
dV,
=(∫
|g|dV ′)2
−(∫
|f |dV)2
,
=(∫∣
∣
∣
∣
∫
P{V ′, V }fdV
∣
∣
∣
∣
dV ′)2
−(∫
|f |dV)2
,
≤ 0, (12)
where we have used the definitions of the sampling weights in the second
equality, definition of g (9) in the third. The last inequality is the triangle
inequality from the properties of P .
Thus the RG blocking always reduces, sometimes significantly, the statis-
tical fluctuations of an observable measurement by reducing the magnitude
of √S
|〈〈sign〉〉| .
Note that the special case of equality in (11,12) occurs iff there was no
sign problem to begin with. How much improvement one can get out of the
new MC weight, i.e. how large are the above inequalities, depends on the
details of the RG blocking and on the original measure f .
5

3 Application to the 2D Ising model
The Hamiltonian for the Ising model on a square lattice is
H = −j∑
〈nn′〉
snsn′ − h∑
n
sn. (13)
Here we allow j and h to take on complex values in general. The sum
over {s} in the partition function is a sum over all possible values of the
spins sn = {+1,−1} at site n. The sum over 〈n′n〉 is a sum over all nearest
neighbours on the lattice. For the finite lattice, periodic boundary conditions
are used.
The phase boundaries for the complex temperature 2D Ising model with
h = 0 are found by [8]
Re (u) = 1 + 232 cos ω + 2 cos 2ω
Im (u) = 232 sin ω + 2 sin 2ω (14)
where ω is taken over the range 0 ≤ ω ≤ 2π, and
u = e−4j . (15)
In the u plane, this is a limacon, which transforms to the j plane as shown
in Fig. 1.
Figure 1: Phase diagram in the complex j plane, h = 0.
FM=ferromagnetic, PM=paramagnetic, AFM=antiferromagnetic.
As e−H/∣
∣
∣e−H∣
∣
∣ takes values on the unit circle, the crude MC estimator for the
denominator of (8) might be vanishingly small, but its standard variance S
is of order unity, leading to the sign problem.
For the improved method, we adopt a simple RG blocking over the odd
sites, labeled ◦. That is, the analytic summation is done over the configu-
ration space spanned by the ◦ sites; while MC is used to evaluate the sum
6

over the remaining lattice of the • sites. The following diagram shows the
two sublattices, and how the • sites are to be labelled relative to the ◦ sites,
for the site labelled x.
Figure 2: Relative spin positions on a partitioned lattice.
In general, with finite-range interactions between the spins, one can always
subdivide the lattice into sublattices, on each of which the spins are indepen-
dent and thus the partial sum over these spins could be carried out exactly.
Summing over the spins s◦,
Z =∑
{s•}
eh∑
•sites
s• ∏
◦sites
2 cosh[
js+• + h
]
(16)
where s+• ≡ s↑•+s→• +s↓•+s←• . The improved MC weight is then the absolute
value of the summand on the right hand side of the last expression for Z.
The quantities to be measured are magnetisation, M , and susceptibility,
χ. These can be expressed in terms of the first and second derivatives of Z
respectively, evaluated at h = 0. Using the above notation:
∂Z
∂h=
∑
•spins
{[
eh∑
•sites
s• ∏
◦sites
2 cosh[
js+• + h
]
]
[
∑
◦sites
(
s↑• + tanh(
js+• + h
))
]}
, (17)
and
∂2Z
∂h2=
∑
•spins
{[
eh∑
•sites
s• ∏
◦sites
2 cosh[
js+• + h
]
]
×
(
∑
◦sites
(
s↑• + tanh(
js+• + h
))
)2
+
∑
◦sites
(
1
cosh2 (js+• + h)
)]}
. (18)
7

4 Numerical results
In all the simulations, square two-dimensional lattices of various sizes with
periodic boundary conditions are used. After the RG blocking, half the spins
go, and the original boundary conditions are maintained. The heat-bath
algorithm is used to obtained configurations that are distributed with the
required weights. One heat bath sweep involves visiting every site in the
lattice once.
4.1 Autocorrelation
Two additional benefits arise from the improved method. The first is that
the number of sites to be visited is halved. While the expressions to be
calculated at the remaining sites turn out to be far more complicated, the
use of table look-up means that evaluating them need not be computationally
more expensive. The second benefit is that correlation between successive
configurations and hence the number of sweeps required to decorrelate data
points is reduced. This correlation is quantified in terms of the normalised
relaxation function φA (t) for some observed quantity A,
φA (t) =〈〈A (0)A (t)〉〉 − 〈〈A〉〉2
〈〈A2〉〉 − 〈〈A〉〉2(19)
The following graph is typical of the behavior near to criticality and
demonstrates the improvement which is possible. The observable used is the
real part of the magnetisation versus the number of sweeps. Table 1 shows
the data used in generating Fig. 3.
Figure 3: Autocorrelation of the real parts of magnetisation.
8
Table 1: Data for Figure 3.
Quantity Value
Lattice Size 32x32
Total Sweeps 5,000,000
Applied Field, h 0 + 0i
Interaction, j 0.435 + 0.1i
Start Cold
Walk Heatbath
4.2 Improved estimate of << sign >>
As a test of the improved method, it is compared to the crude one along the
path OX in Fig. 1.
Figure 4: | << sign >> | vs Re(j), Im(j) = 0.1, h = 0
Table 2 shows the data used in generating the remainder of the graphs:
• Thermalising sweeps is the number of sweeps performed before data is col-
lected.
• Data points is the number of configurations used in a measurement.
• Sweeps between points is the number of sweeps performed between mea-
surements.
Note the followings from Fig. 4:
• Both methods fail close to the phase boundary around Re ( j )= 0.4
(actually actually no methods can work where Z vanishes) and so results for
this region are not presented. The important thing is that for a given error,
the improved method is able to get closer to the phase boundary than the
crude one.
9

Table 2: Data for Figs. 4-7.
Quantity Value
Lattice Size 20x20
Thermalising Sweeps 1000
Data Points 1000
Sweeps Between Points 100
Applied Field, h 0 + 0i
Interaction, j Re(j) + 0.1i
Start Cold
Walk Heatbath
• In agreement with the analytic consideration of section 2, the error bars
on |<< sign >>| obtained using the improved method are never worse than
for the crude one.
• Especially for 0.1 < j < 0.2, the improved method has lifted |<< sign >>|drastically, showing that Z 6= 0 but the crude method cannot. This results
in a big improvement on the satistical errors of the observables, as we will
see in the following sections. The reason that the value of |<< sign >>| is
increased more at high temperatures is that the summing of opposite spins
in cosh [js+• + h] causes a greater reduction in the variance of e−H/
∣
∣
∣e−H∣
∣
∣.
The gains are more striking if we plot the ratio of the proportional errors,
R where
Rsign =
(
Ssign
<<sign>>
)
crude(
Ssign
<<sign>>
)
improved
. (20)
This is an important comparison because the errors on the physical observ-
ables, like magnetisation and susceptibility M and χ, depend on the propor-
10

tional error of |<< sign >>|.
Figure 5: Rsign vs Re(j), Im(j) = 0.1, h = 0.
4.3 Improved estimate of < M >
The equivalent graphs for estimates of |< M >| are presented below. For
clarity, in Fig. 6, only every second data point is shown. The data agrees
with known behaviour of the magnetisation at high and low temperatures.
Figure 6: | < M > | vs Re(j) where Im(j) = 0.1, h = 0.
Figure 7: Ratio of MC error radii of magnetisation.
4.4 Improved estimate of susceptibility χ
The magnitudes of susceptibility for crude and improved MC are shown in
Fig. 8. In the region of OX line in the ferromagnetic phase, both methods
are comparable and consistent with zero. Fig. 9 depicts the ratio of error
radii of the two simulation methods.
Figure 8: | < χ > | vs Re(j) where Im(j) = 0.1, h = 0.
Figure 9: Ratio of MC error radii of susceptibility.
Comparison with series-expansion data are plotted in Figs. 10 and 11.
Figure 10: Improved | < χ > | vs Re(j). Expansion shown as line.
Figure 11: Improved < χ > vs Re(j). Expansion shown as line.
The discs in Fig. 11 are the circles of statistical errors for simulated results.
11

4.5 Dependence on lattice size
Fig. 5 is actually a slice from Fig 12 and Fig 13. These show how the im-
provement in Rsign depends on the linear lattice dimensions. Two interesting
trends are apparent:
• At low temperature the amount of improvement increase with lattice size.
• At high temperature the amount of improvement decrease with lattice
size. We do not attempt to explain this behavior, but note that for high
temperatures one would expect Rsign to approach some limiting value for
large lattice sizes. The reason for this is as follows. For both methods, the
quantity e−H/∣
∣
∣e−H∣
∣
∣ is the sum of arg’s over all sites. Hence, by the central
limit theorem for large lattices it is normally distributed. Its variance is a
function of the spin statistics, which are not size dependent.
Figure 12: Rsign vs Re(j) and linear lattice dimension, 0.1 < Re(j) < 0.3
Im(j) = 0.1, h = 0.
Figure 13: Rsign vs Re(j) and linear lattice dimension, 0.5 < Re(j) < 0.8
Im(j) = 0.1, h = 0.
4.6 MC renormalisation group
We explore the MCRG with both the standard and improved methods at the
critical temperature on the positive, real axis. It is found that the critical
exponents of the blocked lattice are the same as those on the original. The
values of the critical exponents γ0 and γ1, measured using MCRG are dis-
played in Table 3. The exact values of 8/15 and 1 are shown at the top of
the table.
The data used in generating Table 3 is shown in Table 4:
• The bootstrap method [10] is used to calculate errors on the critical expo-
nents. The number of bootstrap samples used, B, is 500. In theory, the limit
12

Table 3: Critical exponents.
γ0 (0.533) γ1 (1.00)
RG iterations Crude Improved Crude Improved
1 0.532(1) 0.546(1) 1.13(4) 1.08(4)
2 0.536(2) 0.539(3) 1.12(5) 1.04(4)
3 0.535(4) 0.539(4) 1.20(7) 1.10(5)
4 0.535(8) 0.519(5) 1.05(7) 1.11(6)
of B → ∞ should be taken. In practice it is found that the distribution
changes little for B > 500.
• The results from the crude and improved methods agree within error.
• The consistent deviation from the exact value is in agreement with similar
simulations [9] and can be explained by truncation of the hamiltonian during
MCRG and finite size effects.
• No improvement should be expected (nor is it observed) as there is no sign
problem in this case. The purpose of these figures is only to demonstrate
that the improved method is adaptable for use in MCRG.
Concluding remarks
We have presented a method towards a partial alleviation of the sign problem;
it is the earlier proposal in [6] generalised to include exact RG transforma-
tions. The sign problem is lessened because of some partial phase cancellation
among the original indefinite or complex-valued measure after an exact RG
transformation.
A particular RG blocking is chosen for our illustrative example of the
13

Table 4: Data for Table 3.Quantity Value
Lattice Size 64x64
Data Points 1000
Sweeps Between Points 8000
Applied Field, h 0.001 + 0i
Interaction, j 0.440687 + 0i
Start Cold
Walk Heatbath
RG Blockings 5
Bootstrap Samples 500
2D Ising model with complex-valued measure. And this summation over a
sublattice is the natural choice which always exists for short-ranged interac-
tions. But other choices of RG blocking are feasible and how effective they
are depends on the physics of the problems.
When the quantity to be averaged is not smooth on the length scale of
the crude weight function, there is an additional source of systematic error
in the crude, average-sign method. The cancellation in the partial sums may
reduce this error by reducing the difference in length scales of the measured
quantities and that of the sampling weights.
Acknowledgements
We are indebted to Robert Shrock for discussions and for providing us the
series-expansion data of the susceptibility; to Andy Rawlinson for the prepa-
ration of some graphs. One of us, TDK, wants to thank Norman Christ and
14
the Theory Group at Columbia University for their hospitality during his
stay. The authors also wish to thank the Australian Research Council and
Fulbright Program for financial support.
References
[1] K. Binder D. W. and Heermann, Monte Carlo Simulation in Statisti-
cal Physics, An Introduction, second corrected edition (Springer-Verlag,
Berlin Heidelberg New York, 1992).
[2] H. de Raedt and A. Lagendijk, Phys. Rev. Lett. 46, 77 (1981).
[3] H. de Raedt and A. Lagendijk in [2];
A.P. Vinogradov and V.S. Filinov, Sov. Phys. Dokl. 26, 1044 (1981);
J.E. Hirsch, Phys. Rev. B31, 4403 (1985);
For a recent review, see W. von der Linden, Phys. Rep. 220, 53 (1992).
[4] G. Parisi, Phys. Lett. 131B, 393 (1983);
J.R. Klauder and W.P. Petersen, J. Stat. Phys. 39, 53 (1985);
L.L. Salcedo, Phys. Lett. 304B, 125 (1993);
H. Gausterer and S. Lee, unpublished (preprint October, 1992).
[5] A. Gocksh, Phys. Lett. 206B, 290 (1988);
S.B. Fahy and D.R. Hamann, Phys. Rev. Lett. 65, 3437 (1990); Phys.
Rev. B43, 765 (1991);
M. Suzuki, Phys. Lett. 146A, 319 (1991);
C.H. Mak, Phys. Rev. Lett. 68, 899 (1992);
A. Galli, unpublished (hep-lat/9605026).
[6] T.D. Kieu and C.J. Griffin, Phys Rev E 49, 3855 (1994).
15

[7] K. Huang, Statistical Mechanics, Second Edition (John Wiley and Sons,
New York, 1987).
[8] R. Shrock, Nucl Phys (Proc Supp) B47, 731 (1996);
V. Matveev and R. Shrock, J Phys A28, 1557 (1995); Phys Rev E53,
254 (1996).
[9] R.H. Swendsen, in Real-Space Renormalisation, ed. T.W. Burkhardt
and J.M.J. van Leeuwen (Springer-Verlag, Berlin-Heidelberg-New York,
1982).
[10] B. Efron and R.J. Tibshitani, An Introduction to the Bootstrap (Chap-
man and Hall, New York, 1993).
16
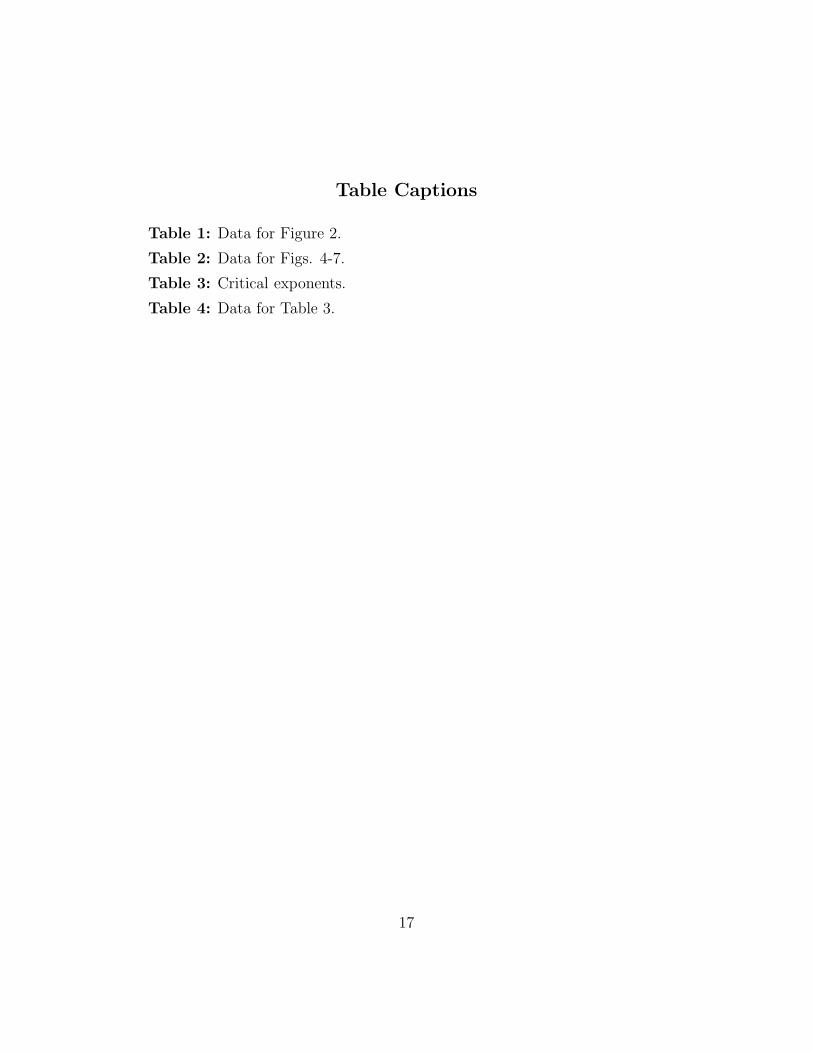
Table Captions
Table 1: Data for Figure 2.
Table 2: Data for Figs. 4-7.
Table 3: Critical exponents.
Table 4: Data for Table 3.
17

Figure Captions
Figure 1: Phase diagram in the complex j plane, h = 0. FM=ferromagnetic,
PM=paramagnetic, AFM=antiferromagnetic.
Figure 2: Relative spin positions on a partitioned lattice.
Figure 3: Autocorrelation of the real parts of magnetisation.
Figure 4: | << sign >> | vs Re(j), Im(j) = 0.1, h = 0
Figure 5: Rsign vs Re(j), Im(j) = 0.1, h = 0.
Figure 6: | < M > | vs Re(j) where Im(j) = 0.1, h = 0.
Figure 7: Ratio of MC error radii of magnetisation.
Figure 8: | < χ > | vs Re(j) where Im(j) = 0.1, h = 0.
Figure 9: Ratio of MC error radii of susceptibility.
Figure 10: Improved | < χ > | vs Re(j). Expansion shown as line.
Figure 11: Improved < χ > vs Re(j). Expansion shown as line.
Figure 12: Rsign vs Re(j) and linear lattice dimension, 0.1 < Re(j) < 0.3
Im(j) = 0.1, h = 0.
Figure 13: Rsign vs Re(j) and linear lattice dimension, 0.5 < Re(j) < 0.8
Im(j) = 0.1, h = 0.
18

arX
iv:h
ep-l
at/9
6100
06v2
20
Oct
199
7
-0.75 -0.5 -0.25 0 0.25 0.5 0.75 1
Re(j)
-1
-0.75
-0.5
-0.25
0
0.25
0.5
0.75
1
Im(j)
AFM FMPM
O X
Figure 1

x
S
SS
S
Figure 2

-0.2
0
0.2
0.4
0.6
0.8
1
0 500 1000 1500 2000 2500 3000 3500 4000
Aut
ocor
rela
tion
of R
e(M
ag)
Sweeps
CrudeImproved
Figure 3

0
0.2
0.4
0.6
0.8
1
0.1 0.2 0.3 0.4 0.5 0.6 0.7 0.8
|<<
sign
>>
|
Re(j)
crudeimproved
Figure 4

0
5
10
15
20
25
30
35
40
45
0.1 0.2 0.3 0.4 0.5 0.6 0.7 0.8
R
Re(j)
ratio of proportional errors
0
5
10
15
20
25
30
35
40
45
0.1 0.2 0.3 0.4 0.5 0.6 0.7 0.8
R
Re(j)
ratio of proportional errors
Figure 5

-2
-1
0
1
2
3
4
0.1 0.2 0.3 0.4 0.5 0.6 0.7 0.8
|<M
>|
Re(j)
crudeimproved
Figure 6

0
1
2
3
4
5
6
7
8
0.1 0.2 0.3 0.4 0.5 0.6 0.7 0.8
R
Re(j)
ratio of proportional errors
0
1
2
3
4
5
6
7
8
0.1 0.2 0.3 0.4 0.5 0.6 0.7 0.8
R
Re(j)
ratio of proportional errors
Figure 7

-20
-15
-10
-5
0
5
10
15
20
0.1 0.12 0.14 0.16 0.18 0.2 0.22 0.24 0.26 0.28 0.3
|<S
usce
ptib
ility
>|
Re(j)
crudeimproved
Figure 8

0
50
100
150
200
0 0.05 0.1 0.15 0.2 0.25
R
Re(j)
ratio of errors
Figure 9

0
2
4
6
8
10
0 0.05 0.1 0.15 0.2 0.25
|<S
usce
ptib
ility
>|
Re(j)
expansionimproved
Figure 10

0
1
2
0
0.51
1.5
0
0.05
0.1
0.15
0.2
0
1
2
0
0.51
1.5
Re(Sus)
Im(Sus)
Re(j)
Figure 11

ratio of proportional errors 42.4 33.9 25.4 17 8.5
2030
4050
60 0.150.2
0.250.3
0
10
20
30
40
50
60
Linear Lattice Dimensions
Re(J)
R
Figure 12

ratio of proportional errors 8.19 6.58 4.98 3.37 1.76
2030
4050
60 0.60.65
0.70.75
0.8
0123456789
10
Linear Lattice Dimensions
Re(J)
R
Figure 13