A MULTl-ATTRIBUTE SURVEY OF RESTAURATEURS ...
137
A MULTl-ATTRIBUTE SURVEY OF RESTAURATEURS' ATTITUDES TOWARD WINE TRAINING, LOCAL WINES, AND WINE SUPPLIERS by HASAN MURAT GULTEK, B.S., M.S. A DISSERTATION IN FAMILY AND CONSUMER SCIENCES EDUCATION Submitted to the Graduate Faculty of Texas Tech University in Partial Fulfillment of the Requirements for the Degree of DOCTOR OF PHILOSOPHY Approved December, 2003
-
Upload
khangminh22 -
Category
Documents
-
view
2 -
download
0
Transcript of A MULTl-ATTRIBUTE SURVEY OF RESTAURATEURS ...
A MULTl-ATTRIBUTE SURVEY OF RESTAURATEURS' ATTITUDES
TOWARD WINE TRAINING, LOCAL WINES, AND WINE SUPPLIERS
by
HASAN MURAT GULTEK, B.S., M.S.
A DISSERTATION
IN
FAMILY AND CONSUMER SCIENCES EDUCATION
Submitted to the Graduate Faculty of Texas Tech University in
Partial Fulfillment of the Requirements for
the Degree of
DOCTOR OF PHILOSOPHY
Approved
December, 2003
A MULTI-ATTRIBUTE SURVEY OF RESTAURATEURS' ATTITUDES TOWARD
WINE TRAINING, LOCAL WINES AND WINE SUPPLIERS.
by
HASAN MURAT GULTEK, B.S., M.S.
A DISSERTATION
IN
FAMILY AND CONSUMER SCIENCES EDUCATION
Submitted to the Graduate Faculty of Texas Tech University in
Partial Fulfillment of the Requirements for
the Degree of
DOCTOR OF PHILOSOPHY
ACKNOWLEDGEMENTS
I dedicate this dissertation to the great memory of my grandfather, Musliun
Pekdarcanlar who passed away during the course of my graduate work.
First and foremost, I would like to thank Dr. Tim Dodd, my advisor and mentor at
Texas Tech University. This dissertation would not be possible without his guidance,
support and wisdom. It was his vision that started this research, and I am forever gratefiil
for his invaluable assistance with every aspect of this dissertation.
I would also like to thank the members of the dissertation committee. Dr. Girmy
Felsetahusen, Dr. Linda Hoover, Dr. Kenny Wu and Dr. Charlie Adams at Texas Tech
University, for their invaluable advice, continuous guidance and encouragement in the
accomplishment of this dissertation.
My special thanks go to Dr. Levent Dumenci, a bright colleague and a dear fiiend
at the psychiatry department of the University of Vermont. It was his immense
knowledge in statistical analyses that made this research possible.
I also wish to thank my family and my close fiiends, for they have contributed in
many tangible as well as intangible ways to this accomplishment. I am especially grateful
to my mother, Mrs. Nihal Pekdarcanlar, and my father, Mr. Irfan Gultek.
Finally, I would like to express my deepest gratitude to my wife, life partner and
closest fiiend, Christele Clarin. It was her love, support, imderstanding that have helped
me complete this research.
TABLE OF CONTENTS
ACKNOWLEDGEMENTS ii
LIST OF TABLES v
LIST OF FIGURES viii
ABSTRACT x
CHAPTER
L INTRODUCTION 1
Restaurants and Wine Sales 1
Wine Training and Restaurants 2
Wine Production in Texas 6
Problem Statement and Research Questions 10
Definition of Terms II
Scope and Limitations 12
IL REVIEW OF LITERATURE 14
Attitude Research 14
Training Attributes 17
Product Attributes 24
Service Attributes 28
m. METHODOLOGY 36
Research Design 36
Sample Selection 39
Data Collection 39
111

Interview Guidelines and Results 42
Questionnaire 47
Pilot Study, Validity and Reliability 50
Summary of Data Analysis 52
IV. FINDINGS 54
Descriptive Data 55
Statistical Analysis 63
Siunmary of Findings 84
V. CONCLUSIONS 86
Discussion and Implications 86
Summary and Conclusions 97
Recommendations for Further Research 98
LIST OF REFERENCES 99
APPENDIX
A. PERCENTAGE PIE CHARTS 102
B. DIFFERENCE BETWEEN TELEPHONE AND MAIL SURVEY TABLES Il l
C. COVER PAGE AND QUESTIONNAIRE 119
IV
LIST OF TABLES
1. Interview Results 44
2. Frequency Distribution of the Interview Results 46
3. Reliability Coefficient Scores for the Pilot Study 52
4. Siunmary of Data Analysis 53
5. Descriptive Statistics for Restaurant Types 56
6. Descriptive Statistics for General Wine Training 57
7. Descriptive Statistics for Wine Purchases 58
8. Descriptive Statistics for Wine Suppliers 59
9. Descriptive Statistics for Training, Product, Service Attributes Importance 60
10. Attitude Toward Wine Training, Local Wines and Wine Suppliers 61
11. "Favorability" Determination 62
12. Frequency Distribution of the "Favorability" Determination for Attitude Toward Wine Training, Local Wines and Wine Suppliers 63
13. Sununary of Mean Differences 64
14. Significance Scores for All Three Categories;
Training, Product, and Service Under the MAIL Variable 65
15. Correlation Matrix for Training Attributes 68
16. Factor Loadings Matrix for Training Attributes 70
17. Communalities for Wine Training Attributes 71
18. Total Variance Explained by Attitude Toward Wine Training 71

19. Correlation Matrix for Product Attributes 72
20. Factor Loadings Matrix for Product Attributes 73
21. Communalities for Product Attributes 74
22. Total Variance Explained by Attitude
Toward Local Wines 75
23. Correlation Matrix for Service Attributes 75
24. Factor Loadings Matrix for Service Attributes 77
25. Communalities for Service Attributes 78
26. Total Variance Explained by Attitude Toward Wine Suppliers 78
27. Descriptive Statistics for Amount of Local Wines, Telephone and Mail Survey Difference, and Product Attitude Scores 79
28. Correlations among the three variables to predict the amount of local wines purchased (dependent variable) fi-om attitudes toward local wines (independent variable) 79
29. Adjusted Score of Finite Sample 80
30. Coefficient Score of Product Attitude Scores 80
31. Restaurants Based on Size, Service Type,
and Type of Ownership 81
32. Between-Subjects Factors for Restaurant Types 82
33. Tests of Between-Subjects Effects 82
34. Attitude Toward Local Wines Mean Scores 83 35. Significance Scores for Training Attiibutes
"Likelihood" -MANOVA Difference Between Telephone and Mail Survey 112
VI

36. Significance Scores for Product Attributes "Likelihood" -MANOVA Difference Between Telephone and Mail Survey 113
37. Significance Scores for Service Attributes "Likelihood" - MANOVA Difference Between Telephone and Mail Survey 114
38. Significance Scores for Training Attributes "Importance" -MANOVA Difference Between Telephone and Mail Survey 115
39. Significance Scores for Product Attributes "Importance" MANOVA Difference Between Telephone and Mail Survey 116
40. Significance Scores for Service Attributes "Importance" -MANOVA Difference Between Telephone and Mail Survey 117
41. Frequency Distribution for the Restaurant Types Difference Between Telephone and Mail Survey 118
Vll

LIST OF FIGURES
1. An Emerging Model of Professional Education 5
2. Table Wine Consumption in Texas 7
3. The Research Design 38
4. Scree Plot Test for Training Attributes 69
5. Scree Plot Test for Product Attributes 73
6. Scree Plot Test for Service Attributes 76
7. Attitude Toward Local Wines Mean Factor Scores for 7 Different Restaurant Type Combinations 83
8. Restaurant Type Based on Seating Capacity 103
9. Restaurant Type Based on Service Type 103
10. Restaurant Type Based on Type of Ownership 104
11. Restaurant Type Based on Main Menu Concept 104
12. Have you ever received wine training? 105
13. How often is wine training offered at your restaurant? 105
14. How important is wine training for your restaiuant? 106
15. Wine sales percentage in total alcohol sales 106
16. Percentage of Texas wines pm-chased 107
17. Major origins of wine purchases 107
18. Major suppliers of wine 108
19. The number of wine suppliers used to purchase wine 108
Vlll

20. How satisfied are you with current wine supplier? 109
21. Attitude Toward Wine Training 109
22. Attitude Toward Local Wines 110
23. Attitude Toward Wine Suppliers 110
IX
ABSTRACT
Wine production in Texas has increased substantially in recent years. Wines
produced in the state have begun winning awards at national and international events.
Despite these factors, many wineries have considerable difficulty selling wine through
distribution charmels or getting restaurants to include local wines on their menus.
Restaiuants represent a significant sales potential for the wine industry since the
two industries use their products to complement each other. The two industries can
increase their sales by helping increase the sales of each other.
Selling wine to restaurants constitutes a significant portion of wine sales. Wine
producers can benefit fi-om direct selling to restaurants because the process of direct
selling can help wineries, especially newly developing local wineries, promote their
wines and establish brand recognition. Therefore, it is particularly important for wineries
to target restaurants as part of their sales efforts.
The success of wine sales at restaurants, however, depends on the knowledge
level of the employees. In other words, in order to effectively purchase and market wine,
the restaurant employees and the managers have to possess the necessary knowledge. For
this reason, wine instruction is an important part of the entire process of marketing wine
to and at restaurants.
Also, the issue of buyer-supplier relationship is an important component of
marketing local wines to restaurants. Service attributes that are important when
restaurateurs make their purchasing decisions is an issue worth investigating.
There is little or no research on restaurateurs' attitudes towards wine training,
local wines, and wine suppliers based on the investigation of the training, product and
service attributes. If winery managers, wine distributors, and wine marketing
associations that promote regional wines can better understand the importance of these
various attributes on restaurateurs attitudes, then these individuals can focus on those
attributes to develop wine sales in the restaurant market.
Therefore, the purpose of this study was to examine the influences of various
attributes affecting restaurateurs' attitudes toward wine training, local wines, and wine
suppliers.
This research empirically examined the following questions:
(1) Which training attributes influence restaurateurs' attitudes toward wine
training?
(2) Which product attributes influence restaurateurs' attitudes toward local wines?
(3) Which service attributes influence restaurateurs attitudes toward wine
suppliers?
(4) Does the attitude toward local wines have any effect on the actual amount of
local wines purchased?
(5) What types of restaurants offer better opportunities for local wines?
Multi attribute analysis of attitudes toward all three categories, wine training,
local wines and wine suppliers were positive. Attitude toward wine suppliers was the
strongest positive attitude that was followed by wine ti-aining and local wines.
XI

Factor analysis was performed that compared training attributes to overall attitude
toward wine training, product attributes to overall attitude toward local wines and service
attributes to overall attitude toward wine suppliers. The results revealed that location,
flexibility and outcome attributes were most significantly related to attitude toward wine
ti-aining, taste, design and brand attributes were most significantly related to attitude
toward local wines and fi-iendliness, product availability and reliability attributes were
most significantly related to attitude toward wine suppliers.
A linear regression model was used to predict the amount of local wines
purchased fi-om attitude toward local wines. The results revealed that there was a
significant positive relationship between attitude toward local wines and the amount of
local wines purchased.
Multivariate analysis of covariance was used to compare attitude toward local
wines among 27 different restaurant types to see whether a particular restaurant type(s)
offered better opportunities for local wines. The results of this analysis revealed that
medium-casual-independent and medium-fine dining-independent restaurant type
categories offered the most significant opportimities for local wineries to target.
Based on the overall results of the study, it was concluded that attitudes had a
significant impact on local wine purchases, and investigation of these attitudes revealed
that some attributes were more important than others and some restaurant types offered
better opportunities for local wines than others.
Replication of this study in other new wine growing regions of the country is
recommended. Further research is needed that will take attitude determination a step
Xll

further and predict behavior from attitude so that we can better understand the purchasing
behavior of restaurateurs by linking the two concepts together.
More attributes may have to be determined and tested to better understand the
attitudes toward wine training. Incentives need to be implemented in fiiture research to
increase the response rate, and other means of data collection besides mail and telephone
surveys, need to be considered.
Xlll

CHAPTER I
INTRODUCTION
Restaiuants and Wine Sales
As the nation's largest private-sector employer, the restaurant industry generates a
significant impact on the nation's economy. According to the National Restaurant
Association (2003), restaurant sales are expected to reach $425 billion by the end of
2003. The wine industry can benefit fi-om the enormous sales potential of the restaurant
industry since the two industries use their products to complement each other. The two
industries can increase their sales by helping increase the sales of each other.
Selling wine to restaurants constitutes a significant portion of wine sales. Wine
producers can benefit fi-om direct selling to restaurants because the process of direct
selling can help wineries, especially newly developing local wineries, promote their
wines and establish brand recognition. Therefore, it is especially important for wineries to
target restaurants.
The importance of restaurants for the distribution of wines can be explained fi-om
several perspectives. First, the appearance of wine on a restaurant's wine list can provide
consumers with a sense of comfort that the wine has been accepted as a quality product
by the restaurant. Consumers who try wines at restaurants may wish to make additional
purchases at retail wine outlets. Thus, wines fi-om new regions or those trying to widen
their distiibution network are especially interested in the restaurant market.
Second, consumers may be more willing to try a new wine product in a restaurant
situation. Gatignon and Robertson (1985) noted that the trialability of a product is closely
related to the speed with which diffusion of that product occurs. This is especially true for
the restaurants that provide wine tasting so that consumers try wines before making a
purchase. In addition, wine sales by the glass allow a consumer to try a small amount
without the risk of piuchasing a whole bottle. Many successfiil restaurateurs agree that
much of their success in generating profit is embedded in the strength of their wine sales,
particularly in the abimdant selection of wine by the glass.
Third, by making local wines available at restaurants, wineries can provide
tourists with the opportunity to learn about and purchase local wines. Fourth, direct
piuchase of wines fi-om wineries by restaurants can develop an outlet for their products
before it is accepted by wine store retailers that may be reluctant to stock an imknown
wine. Therefore, targeting restaiuants as possible distribution outlets can be a crucial
point of sale for wineries that are trying to expand their wine sales potential, and in tum
can help an entire industry develop into a well known and respected one that creates jobs
and generates income.
Wine Training and Restaurants
The education of foodservice employees regarding wine service and sales is an
important issue. The service and sales of wine require a certain degree of knowledge
compared to other beverages. For instance, a customer might want to know about the
differences among the types of wines served in a restaurant. Furthermore, a foodservice
employee should have adequate training on how to open and serve wine appropriately.
There is also the issue of getting the restaurant customers to choose local wine
brands over well-known domestic or imported brands. Many restaurant customers choose
well-known brands over little known local wines and are willing to pay more for them.
This is also why wine training is essential. Through training, restaurants can increase the
knowledge of the wait-staff about local wines, and in tum, this knowledge can be
translated into increased sales and enthusiasm for local wines. This may be an important
factor in selling relatively unknown but good quality local wines.
Kolpan, Smith, and Weiss (2002) suggested that recommending wines and food
together fi-om the menu with descriptions is the single most powerfiil tool a restaurateur
can employ to give the customers the direction he or she wants. As time consuming and
absolutely essential as culinary responsibilities are, leaming the basics of food and wine
harmony, as well as training food servers on all aspects of wine knowledge should be
among the most important responsibilities of a restaurateiu. This is why many
restaiuants send their food and beverage employees to training events and seminars to
enhance their knowledge on wine.
As we enter the new century, the trends indicate that more Americans are dining
out a great deal, and the same trend seems to exist for wine sales in restaiuants.
Restaiu-ant managers today realize they have to offer the highest possible level of service
and professional counsel to the dining public. So the inevitable role of the restaurateur
and the wait staff is to leam as much as they can about wine, the wine list, and wine's
relation to food, therefore making beverage training an integral part of successfiil
restaurant management.

Tremendous forces of change are confi-onting today's workforce, and the
restaurant industry, being the largest employer in the country, is no exception to these
changes. The economy, corporate downsizing, globalization, technology, and cultural
diversity are a few of the changes.
Employee training and education as part of career development have become
more important tiian ever before. As a result, employees are called upon to make shifts in
the way they think, work, and interact with others. Restaurant employees are now
responsible for directing their own careers and leaming opportimities because of
increased competitive conditions in the job market. Therefore, it is essential for
employees in the restaurant industry to stay up-to-date with the constantly changing
conditions.
Career enhancement training can prepare individuals for this constantly changing
process. As conditions surrounding us change, we as individuals try to change and equip
ourselves with the necessary skills and knowledge to stay focused. Continuing education
(adult leaming) programs can play a major role on meeting the challenge of preparing the
fiiture workforce.
Wine training is a career enhancement activity and therefore can be considered
continuing education. Ashford (1996) stated that career enhancement activities can help
employees with their career transitions, such as entering a new organization or
transferring within an organization. Career enhancement activities are critical for both
employees and organizations because they set the stage for employees' eventual success
and longevity of their employers. Based on these assumptions, the implementation of
career enhancement programs in the restaurant industry is definitely needed.
Even among fairly stable organizations, career development programs make
sense so that they can refi-esh employees' skills and help them move within the
organization toward different career paths. Therefore, there is a need for wine training as
a continuing education activity that is geared toward improving and refi-eshing food
server employees' professional skills.
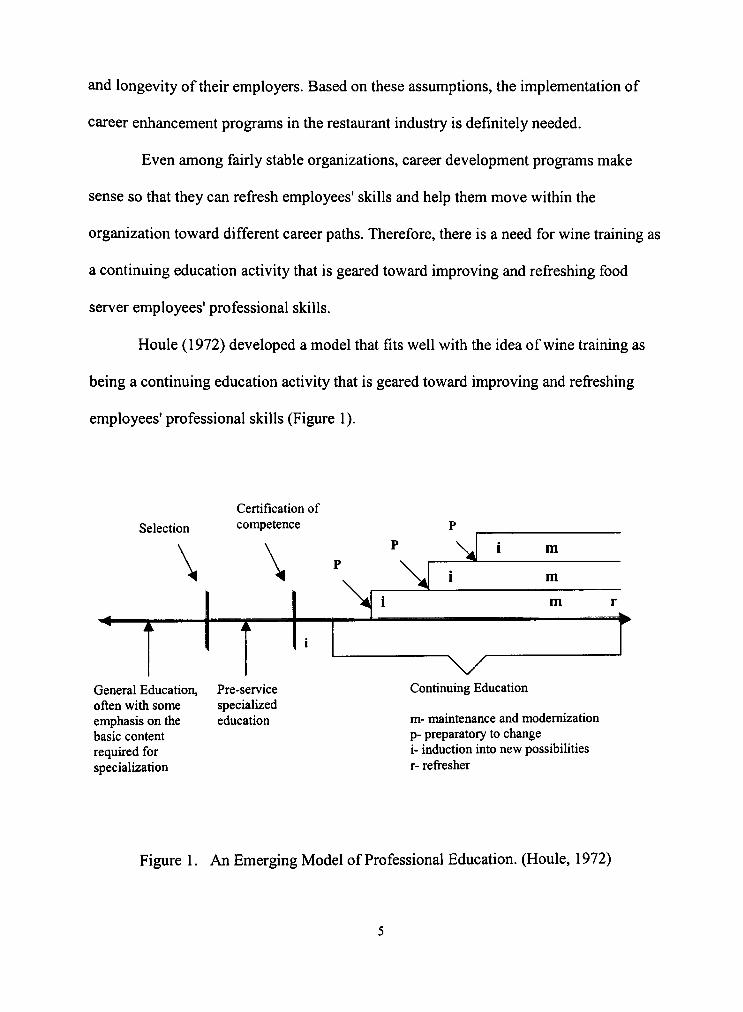
Houle (1972) developed a model that fits well with the idea of wine training as
being a continuing education activity that is geared toward improving and refi-eshing
employees' professional skills (Figure 1).
Certification of Selection competence
\ \
^ ' i " i i
i
P
\ i
\ \ .
\ i
m
m
m r *-
\ / General Education, Pre-service often with some specialized emphasis on the basic content required for specialization
education
Continuing Education
m- maintenance and modernization p- preparatory to change i- induction into new possibilities r- refresher
Figure 1. An Emerging Model of Professional Education. (Houle, 1972)

The model begins with basic education prior to employment. Then it moves on to
selection of the professional specialization and pre-service vocational training. Finally,
after receiving the certificate of competence in the specialized area, the model focuses on
continuing education based on improved and renewed job skills as a part of career
development activity.
The success of wine sales in restaurants, therefore, depends on the knowledge
level of the employees. In other words, in order to effectively purchase and market wine,
the restaurant employees and the managers have to possess the necessary knowledge. For
this reason, wine instruction is an important part of the entire process of marketing wine
at restaurants. Wine training, as part of an overall career development activity, can help
restaurant employees broaden their professional knowledge about purchasing and selling
wine.
Wine Production in Texas
Wine production has increased substantially in recent years in a number of states
that ti-aditionally have produced little wine (Dodd & Gustafson, 1997). The wines fi-om
these states have begun witming awards at national and intemational events and are
earning increased respect fi-om wine judges, writers, and the general public. The growth
of new wine industries in these regions has necessitated that winery managers find ways
of effectively distributing their wines to consumers.
Many wineries, however, have considerable difficulty selling wine through
distribution channels such as local grocery stores, wine retailers, liquor stores, and
restaurants. This is because of the skepticism fi-om these distribution outlets that good
quality grapes and wines can be grown and made in the region (Dodd & Gustafson,
1997).
According to Dodd and Gustafson (1997), this assumption may be the most
challenging factor for wineries to overcome, and surprisingly, this can occur despite the
wines receiving top honors at various national and intemational wine competitions. Part
of this problem may be due to the lack of education and training on the part of restaurant
managers and employees.
Texas is one state that has recently started producing considerable quantities of
wine. Texas wineries are trying to grow and develop distribution outlets in retail stores
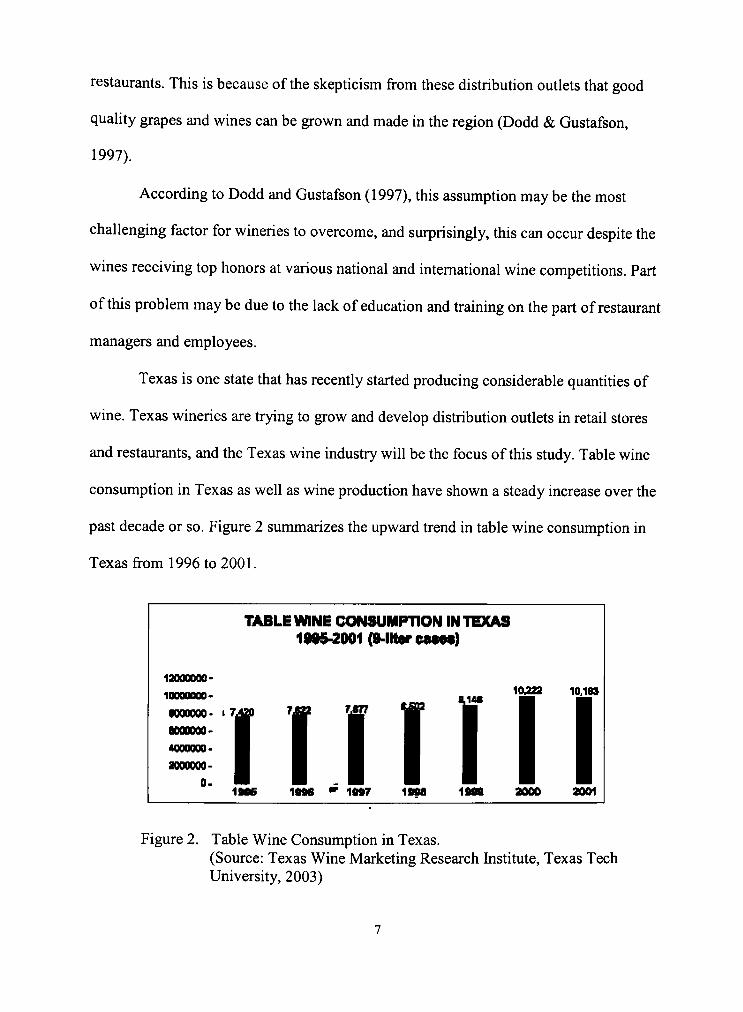
and restaurants, and the Texas wine industry will be the focus of this study. Table wine
consumption in Texas as well as wine production have shown a steady increase over the
past decade or so. Figure 2 summarizes the upward trend in table wine consumption in
Texas fi-om 1996 to 2001.
TABLE WINE CONSUMPTION IN TEXAS 1996^001 (S-IHarcMw)
12000000-looonooo-
•000000- i 7,
6000000-
4000000-aoooooo-
0 .
rMp 10223 ^o^n
1«M ^ 1M7 iBsa ISM 2000 aOQi
Figure 2. Table Wine Consumption in Texas. (Source: Texas Wine Marketing Research Institute, Texas Tech University, 2003)

One of the major threats to a newly developing wine industry is the large number
of imported wines that are becoming available. Keown and Casey (1995) concluded that
the "country of origin" was the most influential factor for choosing wine, and French and
Italian wines continued to be the dominant suppliers of imported wines in the newly
developing wine producing regions.
Although imported wines are important sources of wine for consumers who enjoy
different wines, they can also make it increasingly difficult for new local wine producers
to enter the various distribution channels.
California is the leading wine growing region in the countiy. The reason behind
the success of California's wine production and promotion has been long applauded
because it is one of the few states that has been able to make the wine industry an integral
part of the state's agriculture and overall economy. However, there are 46 other states
besides California in this country that also make wine. Many of those local wines might
not be mainstream wines in terms of their grape varieties or their taste, but they deserve
to be supported because they represent a local connection to grape growing and wine
making. When consumers can relate to a wine because they've seen the vineyards or
visited the wineries — and not just because it's the fashionable variety or brand ~ they
forge a personal coimection with wine that is fiindamental to the emergence of a wine
culture (McCarthy, 2002)
The issue of getting restaurants to feature local wines is a difficult task for many
wineries in Texas. It might be partly because many restaurateurs make their wine
selection in accordance with the restaurant's ambiance and food. For example, a
restaurant that features Italian cuisine would be more likely to have some depth in its
selection of Italian wines. A restaurant that showcases regional American cuisine, on the
other hand, may not require many European wines on its wine list. Focusing more on
local wines could be a feasible alternative for such a restaurant.
There is no doubt that today's diners usually prefer wines fi-om Europe,
California, Chile, Australia and other well-known wine producing regions and may
hesitate to order local or lesser-known wines. However, this does not mean the market
for local wines carmot be developed. In increasingly developing wine-producing regions
such as Texas, a large selection of local wines might give a special, regional emphasis to
a restaurant's wine list.
Tourists enjoy sampling local wines or dishes, and residents are often eager to
support their community by eating and drinking local food products. So such
understanding and cooperation might be just what the Texas wine industry is looking for.
Despite numerous studies concerning the relationship between beliefs, attitudes,
and behavior, no research has been conducted that asked restaurateurs about tiraining,
product, and service attributes that influence their attitudes toward the purchase of local
wines.
The relationship between various attributes of products and services and
consumer attitudes toward that product or service has been widely studied by consumer
researchers to better understand the purchasing behavior. There is little or no information
concerning restaurateurs' perceptions of local wines, the barriers to improving the

buyer/supplier relationship, and the perceptions of wine training programs. If winery
managers, wine distributors, and wine marketing associations that promote regional
wines can better understand the importance of various attributes, then these individuals
can focus on those attributes to develop wine sales in the restaurant market.
Problem Statement and Research Questions
There is no doubt that restaurants are very significant distribution outlets for local
wines. Marketers of local wines have a difficult marketing task. First, they have to get
restaurateurs to accept the local wines, and then they have to get restaurateurs to carry
and sell local wines at restaurants. Therefore, awareness of restaurateurs' attitudes is a
centi-al concern for wine marketers. It is difficult to imagine any wine marketing research
project that does not include the measurement of some aspect of consumer attitudes. As
the wine industry grows at a rapid pace in Texas, the need to identify the attitudes of
restaurateurs toward local wines and wine suppliers has become more important than
ever. Also, the need to educate restaurant employees about wine service and purchasing
has become very significant because training can increase the product knowledge, selling
skills, and service techniques, and in retiim, possibly lead to increased sales of wine in
restaurants. Therefore, the providers of wine training should also be concerned about the
restaurateurs' attitudes toward training. Finally, wine suppliers' service quality is another
area of concern when it comes to selecting a supplier. The relationship between wine
supplier and restaurant buyer has not been investigated fiiUy to understand the various
attributes associated with quality wine supplier service.
10
The purpose of this study was to examine the influences of various attributes
affecting restaurateurs' attitudes toward wine training, local wines, and wine suppliers.
This research empirically examined the following questions:
1. Which training attributes influence restaurateurs' attitudes toward wine
training?
2. Which product attributes influence restaurateurs' attitudes toward local wines?
3. Which service attributes influence restaurateurs attitudes toward wine
suppliers?
4. Does the attitude toward local wines have any effect on the actual amount of
local wines purchased?
5. What types of restaurants offer better opportunities for local wines?
Definition of Terms
1. Attitude - specific or organized set of beliefs that reflect a stable disposition
toward an object or situation. This disposition could be favorable or
unfavorable.
2. Attribute - a characteristic or a trait closely associated with an object or
situation. In this study, the attributes are specifically associated with wine
training programs, local wines, and wine suppliers.
3. Local wine - a wine that is produced and sold in a particular district or region.
In this study, all wines that are grown in and around the State of Texas are
considered local wines.
11

4. Restaurant industry - a set of business activities concerned with the supplying
and distribution of food products.
5. Restaurateur - the operator or proprietor of a restaurant.
6. Wine - fermented grape juice used as a beverage.
7. Wine supplier - a business entity that serves as the provider of wine for the
restaurants in this study.
8. Wine training - vocational education on wine service and purchasing for food
service employees.
9. Casual dining restaurant - A restaurant providing table service, relaxing
environment, and a meal costing fi-om $6.00 to $15.00 (Sondra, 2001).
10. Fine dining restaurant - A type of restaurant emphasizing waiting on the
customer hand and foot and providing high quality food and upscale
ambience. The cost of a meal in a fiiU-service restaurant is usually above
$15.00 (Sondra, 2001).
11. Quick service restaurant- A restaurant serving low-cost meals (under $7.00)
through counter service. The emphasis is on speed of service and
convenience (Sondra, 2001).
Scope and Limitations
It may not be possible to generalize all of the results to other states because there
may be some differences from state to state. However, the development of the
12
questionnaire and the research design were helpful in terms of setting a precedent for
other researchers who wish to conduct similar research in their regions.
The response rate in this study was limited due to the nature of the study. The
respondents of the study were professionals with busy schedules. This problem was
overcome to some degree by having a large sample and sending out additional reminders
to nonrespondents.
There is little previous research conceming restaurateurs' purchasing behavior to
help guide the study. Therefore, other applications of purchasing behavior from related
studies were used in this study as a starting point for investigating restaurateurs attitudes.
It was impossible to determine all the attributes that could potentially be
important to be included in the questionnaire. The literature on consumer attitude
research suggested that the relevant attributes are not likely to exceed seven to thirteen
attiibutes. However, by carefiiUy examining the related literature, conducting in-depth
interviews with restaurateurs, and administering a pilot test, the most relevant product
and service attributes were included in the final questionnaire.
13

CHAPTER II
REVIEW OF LITERATURE
Four major fi-ameworks comprise the review of literature; the first section
explores the role of attitudes in consumer research. The second part investigates the
restaurateurs' attitudes toward wine training by focusing on the certain attributes of
training. The third part investigates the influences of product attributes on restaurateurs'
attitudes toward local wines. The final part concerns the buyer/supplier relationship and
investigates the influences of service attributes on restaurateurs' attitudes toward wine
suppliers. All of these fi-ameworks will be discussed with respect to wine purchases by
restaurateurs.
Attitude Research
The term attitude is a word used in everyday conversation. While the everyday
use of the term attitude is common, it has a more prominent and precise meaning in
psychology. This is the starting point of many consumer behavior or marketing studies.
The majority of these sttidies utilize theories that view understanding of attitudes as the
first step in understanding consumer behavior.
An attitude can be defined as a learned predisposition to respond in a consistently
favorable or unfavorable manner with respect to a given object, issue or behavior
(Fishbein & Ajzen, 1975). Attitude research reveals several aspects about attitudes in
general. For example, one underlying assumption about attitudes is that they are learned.
14

In other words, people are not bom with attitudes. Rather, they leam or develop feelings
whether favorable or unfavorable through their experiences or the information that is
available to them.
Personal experiences with the product, brand or issue help consumers form
attitudes. For example tiying a new brand of wine can help a consumer form an attitude
toward that wine. Information is also obtained through advertising and plays a critical
role in the formation of attitudes. This is why marketers try very hard to gauge consumer
attitudes toward a particular brand and product to direct their marketing efforts to
influence those attitudes.
Because attitudes are learned, marketers can attempt to create or modify attitudes
toward their brands through the use of marketing communication tools like advertising or
product sampling. Awareness of consumer attitudes is such a significant concern for
marketers that it is difficult to imagine any consumer research project that does not
include the measurement of some aspect of consumer attitudes (Biehal, Stephens &
Curio, 1992).
Another aspect of attitudes is the issue of consistency. Several studies suggest that
attitudes are somewhat consistent with the behavior they reflect. A considerable amount
of research in this area attempts to predict behavior fi-om attitudes. The idea is that by
measuring attitudes, one can predict the likelihood of the resulting behavior.
Fishbein and Ajzen (1975) developed a model of the relationship between
attitude and behavior. The underlying assumption of this model is that in order to predict
a specific behavior, such as the purchase of a particular wine brand, it is necessary to
15

measure the person's attitude toward the object and the subjective norm, which is the
measure of social influences on a person's behavior. These social influences are usually
in the form of fiiend's and family members' expectations. So by measuring the overall
attitude toward an object and the social influence on the person, intention to perform a
particular behavior, like purchasing a local wine brand, is measured.
Despite all the theories that operate under this assumption, one still cannot say
attitudes are always consistent with the behavior. The counter theories suggest that
attitudes are not necessarily permanent or consistent with the immediate behavior. In fact
attitudes may change over time.
Many factors influence the purchase decision such as income level, importance of
the purchase, influence of family or fiiends, or simply a sudden change of attitude. Many
attitude theories suggest that attitudes are very susceptible to change over time.
Something that is viewed highly positive today may not necessarily be the same
tomorrow and vise versa. So the measure of attitudes itself cannot be the only predictor
of behavior, although it is found to be significantly relevant to the overall pattern of
behaviors in many studies.
Predicting consumers' fiiture behaviors, especially their purchase behavior is a
critically important aspect of marketing planning. Many marketing managers or
researchers rely on the attitude construct because of its supposed causal influence on
behavior. That is, attitude is multidimensional, which represents the degree of
favorability or unfavorability toward an object or concept, and the more favorable a
16

person's attitude toward a given product or object, the more likely the person is to buy or
use that product.
Although this proposition is the underiying principle of any attitude-measuring
model, this does not mean that higher favorable attitudes can always be translated into
specific behaviors. For example, many consumers may have positive attitudes toward a
certain car brand, but this does not necessarily mean that every customer with a positive
attitude toward this car will purchase the car.
Altiiough Fishbein and Ajzen (1975), with the theory of reasoned action, take the
multiattribute theory one step ftuther to measure the intention or likelihood to engage in
the selected behavior, in this study, the measure of intention relating to purchasing
behavior was not included in this study.
The multi-attribute model is especially suitable for this research because the
purpose of the model is to measure attitudes toward a certain product or service.
According to this model, the consumers' attitude toward a product or service is a fiinction
of the presence or absence and evaluation of certain product-specific beliefs and
attributes. In other words, consumers generally have a favorable attitude toward those
products or services that they evaluate as positive and have unfavorable attitudes toward
those products or services that they evaluate as having too many negative attributes.
Training Attributes
Wine training is a career development training activity that can also be considered
as continuing education since the term continuing education comprises training activities
17

of adults for professional development. Although the term continuing education is a
broad term that encompasses many educational experiences, Cookson (1998) defined
continuing education as the process by which adults (alone, in groups, or in institutional
settings) seek to improve themselves or their society by increasing their skills,
knowledge, or sensitiveness; or it is any process by which individuals, groups, or
institutions try to help adults improve in these ways.
The continuing education program itself may be a workshop, seminar,
professional training, conference, or even a short course. It could be held in the facilities
of the sponsor or in a hotel, conference center, university, or community center. No
matter what name is attached to the program, how complex it is, or where it is held, it is
an educational experience that is directed toward adult learners. Consequently, wine-
ti-aining programs that are offered as part of continuing education programs can help
restaurant employees.
When it comes to selling wine, wine education may be the last thing that the
restaurateur has the time to think about because of his/her busy schedule. However, wine
can be one of the things that will impact the restaurateur's profit line significantly. That is
the reason many wine-distributing companies take time to offer server wine-training
programs. Such training programs can teach servers and managers how to sell wine more
effectively.
A typical wine training program can focus on not only what certain wines taste
like, but also on whether or not a certain type of wine goes with a certain type of food.
This is a process known as wine-and-food matching. By possessing such knowledge, a
18

server can recommend certain wines, and many customers like the fact that their server is
knowledgeable about wine because it gives them confidence in their wine selection.
Servers' wine sales abilities can be profoundly improved through training by
emphasizing during the training that selling wine is much like selling a menu item.
Frequently, servers view wine selling as a complicated process if they feel that they do
not possess the necessary knowledge about wine, and therefore they may opt for not
promoting wine sales.
Granucci (1989) investigated the effect of wine instruction on the amount of wine
sold in restaurants. The study also investigated the attitudes of the food servers toward
wine instruction. A wine-training program was established in her study as part of an adult
leaming or continuing education activity to observe its effects.
Although the results of the study concluded that wine instruction was not related
to a significant increase in wine sales, there was a significant increase in employees'
knowledge about wine as a result of wine instruction. The study also concluded that the
attitude of employees toward wine instruction was positive. In other words, the
participants rated all training attributes as highly favorable.
Wine ti-aining, as part of a career development effort, should be realistic and give
employees an opporttmity to leam new skills and coping strategies since managing career
is an individual as well as organizational responsibility. Career development is a concept
that is often ignored in many organizations although it can be the difference between
success and failure. Although managing a career is both an individual and organizational
19
responsibility, the greater responsibility lies with the individual. It is the individual's
responsibility to reevaluate the concept of career and life goals.
Macaulay and Harding (1996) suggested that loyalty no longer guaranteed job
security or promotion, and employees had to place emphasis on their career development
to stay employable. New skills can be learned through training. Implementation of wine
training programs can provide employees with a broader view of work and increased self-
esteem. Human resource development or other informal means can provide information
regarding setting up such programs.
One thing that organizations must be very carefiil about when implementing a
wine-training program is that they should not tum the program into a job security issue.
In other words, employees who attend these programs should not feel as if they are going
to lose their jobs if they do not successfiiUy complete the program.
Goldenkoff (1996) stated that if the concept of job security replaces the concept
of career development, employees will no longer fiinction effectively, and the training
does not add value to the organization because of increased pressure and uncertainty. The
purpose of the program should be assisting the employees with their employment needs,
and not a means of discarding them.
A wine training program may, in fact, have a positive impact on wine sales at
restaurants. If the management and employees are ti-ained on various aspects of
purchasing and serving wine, it may lead to increased sales because of the increased
knowledge on how to effectively sell and present wine. This level of sophistication in
employees' knowledge can be translated into increased sales.
20

Reizenstein and Bamaby (1980) stated that a substantial market opportunity may
exist for restaurants to increase wine sales and consumption by means of educational
vehicles such as wine appreciation courses, wine societies, sponsored wine tasting, and
upgrading of restaurant wine lists. Such educational tools would seem most critical in the
short run for retail sales people on whom consumers depend as information sources.
Kotschevar and Tanke (1991) stated that knowing how to serve wine and
champagne, when to serve it and how much to serve, can lead to increased sales for the
business and increased tips for the service staff. There is no doubt that the elegant service
of wine has high visual appeal, an appeal that can act as a merchandising tool and prompt
other guests to make similar purchases.
The term suggestive selling, as described by Dodd (1997), is a fi-equently used
term in the restaurant industry. The idea simply implies that the restaurant employees
should try to increase sales by drawing customers' attention to certain products. However,
if the employees are not well informed about these products, expecting them to
successfiilly market those products would be unrealistic. Therefore, the very notion of
suggestive selling relies on the degree of knowledge about certain products. This
knowledge on wine can be achieved through specialized training in wine selling and
service.
Restaurant customers often perceive that a bartender or beverage server who takes
time to guide them through the selection of wine is someone who truly cares about the
profession and is genuinely concerned about providing quality service. In order to
provide effective suggestive selling, the service staff should be thoroughly familiar with
21
the products they serve. The service staff also should use correct service techniques,
beverage terminology, and understand the various aspects of wine service. Therefore,
wine training is indispensable for the restaurants that serve wine. Employees may be
willing to do their best, but if they are not properly trained in how to correctly present
suggestive selling techniques, the results will not be satisfactory.
Offering wine training as part of an organizational training program may not
always be possible. In this case, contacting outside training agencies or sending
employees to training workshops or seminars can be an altemative. The wine training
programs offered by outside programs as a part of continuing education efforts can play
an important role in this direction. These types of activities can be very effective since
they specifically focus on the content area. The workshops or seminars on wine ti-aining
can address the majority of the problems that are associated with wine service and
purchasing.
When implementing a wine training program, another area of importance appears
to be the idea of flexibility. The organizations and the training programs must botii be
flexible to accommodate the needs of the employees. Organizations of today tiy to create
flexible work schedules for their employees who are attending training programs. Also,
the ti-aining program staff should be willing to work around the schedules of the
participants.
Many continuing education programs fail because of the lack of flexibility. The
issue of flexibility indeed goes both ways, for employees and employers. Employees can
be willing to go the extra mile for the organization, only if the organization has been
22
flexible and patient for them in the past. For example, if the manager of a restaurant is
taking college courses to get a college degree so that he/she can be promoted to the upper
levels of management, naturally any flexibility fi-om the organization, in terms of flexible
hours or college tuition assistance, will be very much appreciated by the employee during
this transition.
The flexibility issue is not restiicted to organizations only. The training programs
also need to consider tiiis issue if they want to market their product. For example, a
number of Restaurant, Hotel, and Institutional Management (RHIM) programs offer
courses online for those who wish to pursue a master's degree in Restaurant and Hotel
Management. It is flexible enough to accommodate the needs of professionals in
Restaurant and Hotel Management by bringing the courses to them since they cannot
attend regular courses because of their work. Therefore, being flexible is not only the
responsibility of organizations, it should also be the responsibility of training programs to
accommodate differing needs.
Another area that can be investigated is the perception of career development
training. Many times, people tend to view career development training as a negative
phenomenon because it causes the status quo to change, and change itself can be an
alarming concept. Very often, career development training is associated with job security
because people think they may lose their jobs if they do not successfully complete the
training process. They may view training as a process of discarding the incompetent.
The challenge of a wine training program is to get employees and organizations to
view training as an opportunity for development that will help them advance in their
23
career path. It can also create employee loyalty and increased productivity, rather than
adding anotiier barrier to their success. What is essential today, as a required skill to
perform a specific task may not necessarily be what is needed tomorrow.
The skills of today can be very much obsolete tomorrow if one does not follow
change and prepare oneself to remain competitive. For employees going through the
process of career development training, it may be more beneficial to look at it fi-om this
perspective and see it as an opportunity for development. Changing the overall
perspective that people view career development training might be the first issue
organizations and continuing education plarmers might have to work on.
Product Attributes
One of the three main components of this research was to determine the
influences of product attributes on attitudes toward local wines. The study of consumer
attitudes has been one of the most important concepts in the study of consumer behavior.
The interest in the link between product or service attributes and attitude started
gaining popularity among consumer researchers during the 1970s. The relationship
between the various attributes of products or services and consumer attitude toward those
products or services has been widely studied and have made it possible to better
understand how important various attributes are to the investigation of consumer
attitudes. Much of this knowledge on consumer attitudes is derived fi-om psychology
where researchers found links between beliefs, attitudes, and behavior.
24

Consumer researchers and marketers consider attitude to be cmcial to the
understanding of consumer behavior and constantly seek to determine and influence
attitudes about products, brands, and services. According to Dodd and Gustafson (1997),
the rationale behind this approach has been that by understanding attitudes, researchers
hope to be able to predict and, if possible, manipulate behavior since attitudes are
considered to be strong predictors of the subsequent purchasing behavior.
Each year, marketing managers spend millions of dollars researching consumers'
attitudes toward products and brands, and even greater sums of money trying to
manipulate those attitudes through their sales efforts. The purpose of such efforts is to
determine the desired knowledge about consumers' attitudes toward a brand or a product.
By obtaining this knowledge, marketers then hope to focus their attention on
influencing consumer attitudes in order to obtain the desired behavioral response. A
significant amount of consumer behavior research has focused on developing models for
predicting the attitudes. Fishbein and Ajzen (1975) developed a multi-attribute attitude
model that focused on consumers' beliefs about several product and brand attributes. This
model has been one of the most influential attitude models in marketing.
Marr (1994) utilized the multi-attribute model to examine the perceived
importance of customer service fi-om the management and customers' perspective. First,
the study carried out a survey to elicit fi-om both management and customers what
elements or factors in their opinions, made a contribution to a customer service offering.
Seven attributes emerged as salient attributes to be used in the second stage of the attitude
survey. The attitude survey revealed a significant difference between the management
25
and customers' perspective of service quality. The attributes that were important to
customers were significantly different than the attributes that were important to the
management.
Barsky (1992) noted the importance of including most relevant attributes in any
attitude model. Marketers need to know which attributes influence attitiides and which
do not. Otherwise, including potentially irrelevant attributes in promotional activities or
sales efforts may not interest buyers. Moreover, it is the inclusion of relevant attiibutes
that helps marketers to understand why products and services are purchased.
Identifying the attributes that must be included in an attitude model proves to be
the vital point for the success of a model. A few studies have been conducted that
examined wine sales and attributes of wine and service. For example, in a study by Dodd
and Gustafson (1997), the results indicated that the most significant attributes associated
with attitude towards wine purchasing at a winery were in the following order: taste, wine
label, wine quality, courteousness of winery personnel, knowledge of winery personnel,
and believability of winery personnel.
Another study by Keown and Casey (1995) looked at the purchasing behavior in
the wine market and asked respondents which of the attributes were important when they
were selecting their wine. The following order of significance emerged: country of origin,
brand name, grape variety, and region of origin, volume of alcohol, vintage, and
classification. Zaichkowsky (1988) determined the label, grape variety, brand name, and
price as the most important attributes conceming red wine.
26

Many wine purchasing related surveys seem to indicate brand name as one of the
most significant product attributes influencing wine purchasing decision, especially in a
restaurant setting. Quality, consistency, taste and confidence are known to be the key
characteristics of well-known name-brand wines. Therefore, one of the most significant
challenges that a local wine brand must face is the challenge of achieving brand
recognition and hoping that the brand recognition can lead to brand awareness or loyalty.
Undoubtedly, well-known branded wines are by definition wines that sell. They
do not require as much labor as local wines to sell because of their proven value to
consumers. Some argue that when an establishment offers um-ecognizable names, it may
have to contend with price objections fi-om customers. This may be one of the possible
reasons why restaurateurs are reluctant to offer such wines. This means that local wine
brands have yet to overcome this obstacle to improve wine sales.
Price also appears in many wine purchasing surveys as a significant product
attribute. However, the price issue can be somewhat different for restaurateurs than it is
for regular consumers in the sense that restaurateurs purchase wine to make a profit fi-om
it. Therefore, the price of a wine is a relevant product attribute since it is directly related
to making a profit.
Clearly, restaurateurs, like other consumers, may consider many product attributes
such as taste, bottle design and quality, vintage, and origin as relevant attributes for
purchasing wine. Therefore, this study attempted to determine the most relevant and
influential attributes when it comes to restaurateurs' attitudes toward local wines.
27
Service Attributes
Purchasing is an important activity in the restaurant industry. Much of the
purchasing activity in food services takes place in the selection and acquisition of food
and beverage. Restaurants must develop effective strategies on how to select and buy
these items.
Many food service operations today attempt to implement effective purchasing as
a part of an overall organizational and financial strategy to control cost.
According to Kotschevar and Doimelly (1999), five individuals or groups of
individuals make decisions regarding what is purchased when it comes to purchasing
decisions in restaurants. The first and very dominant influence is the patron, the second is
production (kitchen staff and related units), third is service (dining room and related
units), fourth is the buyer, and the final and very important element is the management.
The selection of a supplier is an elaborate and a critical decision for the successfiil
fimctioning of a food service operation and good coordination and cooperation between
buyer and supplier are essential. Reid and Riegel (1989) examined the purchasing
practices of large foodservice organizations. The authors concluded that the most
important attributes when selecting a supplier were accurate and timely delivery,
consistent quality at reasonable prices, and supplier willingness to work together with the
buyer. Other attributes that respondents considered to be important were bulk discounts,
fi-equency of delivery, and knowledge of sales staff.
Many firms have recently changed their approach to purchasing as a means to
lower costs and improve quality and productivity (Griffin, 1990). In ahnost all of the
28

buyer-seller research, the trend seems to be moving toward more cooperative and long
term-oriented relations. The relationship between the two is no longer considered
adversarial.
Salkin (1991) suggested that food service suppliers and restaurants must work
together in order to enhance mutual purchasing relations to reduce product costs. It was
suggested in this study that attacking supplier's profit margins was not the way to lower
costs in restaurants. In fact, price was fifth on the list of priorities for supplier selection
following reports, rapport, working together, and sharing information. Reliability,
delivering the right product on the right day at the right time, was a primary concern for
restaurants.
Larson (1994) investigated the link between buyer-supplier co-operation, and
product quality and total cost. Based on the survey responses fi-om more than five
hundred purchasing professionals, the results of the study linked buyer-supplier co
operation to higher product quality and lower total costs. Because purchasing and
logistics are fimctions of interorganizational impact, they must take a leadership role in
developing higher levels of buyer-supplier co-operation (Larson, 1994).
The new relationship between buyer and supplier has been labeled a partnership
by some researchers. To create successfiil partnerships between buyers and suppliers,
long-term relations have to be launched. Strauss (1999) noted that developing strong
personal relationships based on tiust and fiiU disclosure are the keys to successfiil long-
term partnerships.
29

Dronkers (1995) emphasized how restaurants and their suppliers should seek
partnerships to increase their sales. He suggested that to develop a true partnership
between buyer and supplier, both should be open and honest about their needs. Problems
arise when both parties may have been unspecific about their particular needs. As a
result, neitiier side understands what the other wants, and the relationship breaks down.
Kotschevar and Donnelly (1999) discussed the importance of developing the
purchase specifications in a foodservice operation. The authors suggested that before a
purchase can be made, a buyer must be able to specify to the supplier exactly what is
wanted, and there are three kinds of specifications: internal, purchase, and general
specifications.
Intemal specifications are used only within an operation and are derived fi-om
menu offerings. These specifications give employees all the information needed to
indicate what is required to provide a satisfactory product. Purchase specifications are
derived fi-om intemal product specifications but differ in that they list factors needed in a
product so suppliers can quote on the right product to be delivered. General specifications
define business conditions that are required for the overall purchasing activity, such as
delivery times and fi-equency, delivery conditions, payment arrangements and so on.
Therefore, developing purchase specifications is a significant step in creating effective
communication between a buyer and supplier.
Campbell (1997) noted that understanding each side's perspective is important in
buyer-supplier relationship because when firms understand and appreciate each other's
viewpoints, they are able to arrive at a working consensus and manage their partnership
30

model more effectively. In this context, it is usefiil for managers to understand the
attitudes and expectations buyers and suppliers bring to their "partnerships." Clearly,
effective communication is one of the important variables in a buyer-seller relationship.
A true partnership, however, may not always be possible to achieve. In this case, a
buyer must make a decision to choose between using a single supplier with possible
partnership opportunities and using a large array of suppliers with fewer opportunities for
partnerships.
Quayle (1995) discussed the positive and negative factors involving this decision.
The likely benefits of using a single supplier were reducing administrative complexity
due to the repetitive nature of ordering fi-om the same supplier, obtaining more access to
supplier's market information, making prompt deliveries and assuring quality control.
The disadvantage of using a single supplier was the possibility of increasing the buyer's
reliance on specific suppliers.
On the other hand, using a large array of suppliers increased the chances for
obtaining lower prices, more variety, and better service. The disadvantages of using a
large array of suppliers included increased bookkeeping costs, less chances for prompt
deliveries, and higher chances for inconsistent product quality.
In order to avoid either of the two extremes of purchasing fi-om a single supplier
or purchasing fi-om a large array of suppliers, Quayle (1995) suggested the strategy of
splitting purchases between two suppliers, one being the major supplier and the other
being the secondary with merely a nominal order quantity. This way a buyer can reduce
31
dependence on either source by having orders balanced between suppliers and still being
able to negotiate better prices and service.
Zaccarelli and Hayes (1994) indicated that the more suppliers a buyer uses, the
more time is spent coordinating purchases. Ordering, receiving, paying, and evaluating
takes up time tiiat could be more effectively used in other ways. Clearly, whatever
sti-ategy is used, botii sti-ategies have tiieir advantages and disadvantages, and neither is
necessarily better than the other. Therefore, there is not a single suitable strategy for
every restaurant when choosing a supplier. Each restaurant develops its own strategy
depending on tiie type of operation and the market in which it operates.
The criteria that restaurants should consider when selecting a supplier are also
critical. Correll (1992) suggested buyers should rank characteristics based on quality,
service and price when evaluating suppliers. Coltman (1990) suggested that a supplier
must be selected using several criteria. The buyer should consider the supplier's overall
reputation, reliability, quality consistency, and delivery consistency.
Another area that should be explored when considering attributes having an
impact on supplier selection is how purchasing is handled by restaurant chains. Some
chains make all purchasing decisions at the main headquarters. In other words, individual
units do not always have a say in what items or brands are purchased. This may have a
major impact on wine sales in certain areas where a local product is popular with
customers, but is not on the menu. For example, a restaurant's menu may only include
European wines, whereas some of the customers of that region may prefer certain
regional wines. This may create a problem in terms of supplier selection.
32

Another area of interest when it comes to investigating the buyer-supplier
relationship is to what extent suppliers' sales representatives are helping restaurant
operators become more knowledgeable about wine sales. Many restaurants send their
food and beverage employees to ti-aining events and seminars to enhance their knowledge
on wine. Perhaps restaurants can keep the cost of sending their employees to such events
at a modest level if they partner with suppliers, who not only can invest in such efforts
but also can host seminars tiiemselves. Therefore, the strongest virtue of any purveyor of
wines should be the commitment to the study of wine.
An educated purveyor who is passionate about the wines in his/her portfolio
would acknowledge the fact that he/she would have a better chance of placing those
wines if the buyer is also educated about wine and appreciates a good quality wine.
Wine suppliers also can take an active role in helping restaurants design the wine
list to go with the menu. If food and service are the heart and soul of a restaurant, the
menu is an operator's vision put into words. Because the menu defines an operation, it
probably is the single most important document that a supplier should look into when
targeting a restaurant. By doing so, a supplier can understand what types of wines are
suitable, and what can be done to boost wine sales in a restaurant.
Wine suppliers, in addition to helping restaurateurs become more knowledgeable
about wine, need to educate themselves about wine. One of the important attributes when
it comes to selecting a wine supplier is the degree to which a wine supplier is
knowledgeable about wine. It is only natural that a restaurateur may demand to interact
with a sales person who tmly knows about wine. This means that suppliers need to be
33

educated experts on the wines they sell. Unfortunately, many purveyors rely on their own
charisma to sell wines.
The wine buyer, however, may find it more helpful to receive pertinent facts
about the wine itself, such as the winemaker's philosophy, the vineyard conditions and
the nature of the vintage. In this way, education between purveyors and buyers might
become a two-way street in which they leam from one another.
Many suppliers take an active role in designing restaurants' wine lists. Smith and
Owens (1995) noted that suppliers might be able to differentiate themselves by
identifying the buyers' specific needs and focusing on those needs through their
salespeople. When a restaurateur develops a wine list, he/she puts the reputation of the
restaurant at stake. Therefore, wine suppliers or purveyors trying to place their wines on
restaurant wine lists need to acknowledge the importance of this process and work with
restaurateurs in this direction. Any good wine list, regardless of its size or scope, must
reflect the specific cuisine. Restaurateurs who are well informed about wine use the
restaurant's cuisine as their starting point when it comes to purchasing wine. Thus, it
follows that purveyors who wish to be represented on a specific restaurant's wine list
should also have an understanding of the restaurant's cuisine.
The ordering procedure for wines also seems to be an important issue to examine.
Not every restaurant has the same purchasing needs. For example, the wine needs of a
steak house might be different fi-om a seafood restaurant because of the difference in
menu themes. Therefore, the suppliers need be sensitive to this diversity and help
34

restaurants develop their own, customized wine-ordering list. This will help ensure the
consistency of timely and accurate delivery.
Clearly, the investigation of the buyer-seller relationship is very important since it
sheds light on the issue of becoming more effective as an industry. Unfortunately, few
studies have dealt specifically with the issue of wine purchasing by restaurants and know
the product and service attributes that are important when restaurateurs make their
purchasing decisions. Little research has been published that specifically addresses this
issue in the foodservice industry. However, in other industries there has been some
research conceming the buyer-seller relationship and what is important to each of the
parties. Careful examination of these studies were helpful to this research. In addition, a
number of articles in trade publications by industry analysts provided some initial
insights for the study.
35
CHAPTER III
METHODOLOGY
Research Design
The main proposition of the Fishbein and Ajzen (1975) multi-attribute model is
that overall attitude toward an object is a fiinction of two factors: the strengths of the
salient beliefs associated with the object and the evaluations of those beliefs. The salient
beliefs are defined as consumers' acquired beliefs about products, brands, and other
subjects. So the two main components of the model are the determination of the salient
belief strengths and the evaluations of the salient beliefs. The salient beliefs may be in the
form of product attributes and/or service attributes associated with that product or brand.
The evaluation of those salient beliefs may be favorable or unfavorable.
A consumer might have a variety of beliefs associated with a product or a brand.
However, the model suggests that due to the limited capacity of active memory, only a
few of these beliefs can be activated and considered at once. These activated beliefs are
called salient beliefs. According to the model, the typical number of salient beliefs about
an object is not likely to be more than seven to nine. The multi attribute attitude model
attempts to measure overall attitude toward an object by a consumer, and to do that, it
focuses on the strengths of the salient beliefs and the evaluation of these beliefs. Simply
stated, the model says there is a relationship between product attributes and overall
attitude toward that product, therefore it is possible to predict behavior by measuring
36
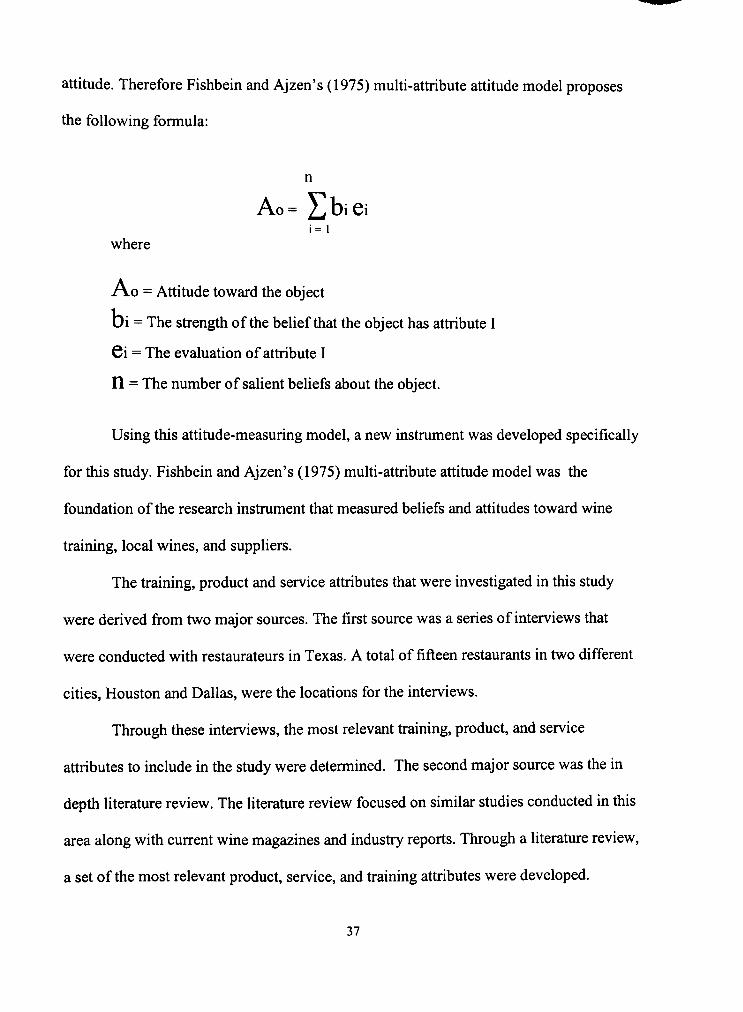
attitude. Therefore Fishbein and Ajzen's (1975) multi-attribute attitude model proposes
the following formula:
Ao= J^biCi i = 1
where
A o = Attitude toward the object
bi = The strength of the belief that the object has attribute I
6i = The evaluation of attribute I
n = The number of salient beliefs about the object.
Using this attitude-measuring model, a new instmment was developed specifically
for this study. Fishbein and Ajzen's (1975) multi-attribute attitude model was the
foundation of the research instrument that measured beliefs and attitudes toward wine
training, local wines, and suppliers.
The training, product and service attributes that were investigated in this study
were derived from two major sources. The first source was a series of interviews that
were conducted with restaurateurs in Texas. A total of fifteen restaurants in two different
cities, Houston and Dallas, were the locations for the interviews.
Through these interviews, the most relevant ti-aining, product, and service
attributes to include in the study were determined. The second major source was the in
depth literature review. The literature review focused on similar studies conducted in this
area along with current wine magazines and industry reports. Through a literature review,
a set of the most relevant product, service, and training attributes were developed.
37

After determining the most relevant attributes to include in the study, they were
broken down into three main categories. The attributes relating to training were
investigated under wine training attributes. The attributes directly related to the product
characteristics were investigated under product attributes. The attributes that were
directly related to the buyer/supplier relationship were investigated under service
attributes. Figure 3 illustrates the research design that was used for the study:
Training attributes Provider Outcome Flexibility Cost Location Frequency
Factor
< • Attitude
toward wine training
Product attributes Brand name Compatibility Design Taste Price Flavor variety
Factor
< H Attitude toward local
wines
Regression Amount of local wines
purchased
Service attributes Knowledge Reliability Discoimts Product availability Reputation Friendliness
Factor
^ w Attitude toward wine
supplier
MANCOVA
Types of restaurants offer better
opportunity for local wines
Figure 3. The Research Design
38

Sample Selection
The selection of the sample for this study was a random sampling from the
complete restaurant population with alcoholic beverage licenses in Texas. In order to
select the sample, the complete list of the restaurants was obtained fi-om the web site of
TABC, Texas Alcoholic Beverage Commission.
Although this web site contained the names and addresses of all establishments
that had an alcoholic beverage license, only restaurants were chosen fi-om the list. After
the population was identified, a random sampling of eighteen hundred restaurants was
conducted.
The estimated required sample size for this study was calculated to be 112. The
estimated response rate, based on a previous research, was approximately 10 percent.
Because of this low response rate, it was determined that twelve hundred restaurants were
necessary to generate the required sample size. After the respondents had been identified,
the questiormaires were mailed to restaurant managers. The main reason for keeping the
sample size large for this study was to compensate for the possibility of a low response
rate that had been indicated in the limitations section of the proposal.
Data Collection
The data were collected in the form of a mailed survey. The respondents of the
study, the restaurateurs, received the questionnaire in the mail and were asked to reply
accordingly. A cover page was attached to the questionnaire indicating the purpose of the
study, the supporting institution, and the contact information. In addition to the cover
39

page, a prepaid envelope with the return address was included. Six weeks after the
mailing date, a second questionnaire with a reminder note was sent to those who had not
responded.
Three weeks after the second reminder, the remaining non-respondents were
telephoned in an effort to collect additional responses. Through these telephone
interviews, 56 additional responses were obtained. This was added to the 96 mail survey
responses that brought up the total number of responses to 152 out of 1800 questionnaires
sent (8.5% response rate).
A low response rate was anticipated as a limitation for this study for the reasons
explained earlier. Similar studies that had restaurateurs as respondents received relatively
low response rates. It is not uncommon for marketing surveys that are directed toward
business professionals with busy schedules to have a low response rate.
Marketing surveys that are directed toward businesspeople are considered
successful with a response rate as low as 10% or 15%. Green, TuU, and Albaum (1990)
suggested that a 10 to 15 % response rate is modal for marketing mail surveys that are
directed toward business professionals.
The type of subject under investigation in this study should be noted when
considering the response rate. Although the survey is answered by the individuals
(restaurateurs), the questions may be interpreted about the characteristics of organization.
Surveys of organizations typically receive substantially lower return rates than surveys of
individuals, with 15% return rates sometimes reaching a level of acceptability for
organizational surveys (Baldauf, Reisinger, & Moncrief, 1999).
40
Since organizational surveys are usually delivered to workplaces, factors such as
preoccupation with work, confidentiality of information, or workplace rules and policies
cause organizations to return surveys at low rates (Greer, Chuchinprakam & Seshadri,
2000). Kennedy and Vargus (2001) noted that although mail surveys were the single
most popular form of self-administered survey, low return rates and the consequent threat
of nonresponse bias were among the greatest challenges to the success of mail surveys.
Therefore the issue of exerting additional efforts to achieve improved return rates
becomes paramount.
Additional efforts such as telephoning the non-respondents are not an unusual
follow-up practice for studies that are designed to gather data through mail surveys. It is
especially recommended for studies that anticipate a low response rate due to the nature
of its respondents.
Although a significant difference was found between the responses that were
obtained through telephone versus mail, the potential confounding effect of this
difference was controlled for with the use of appropriate data analyses.
Finding such a difference should not be confused with response bias that occurs
when a significant difference is found between the respondents and non-respondents of a
study. The telephone survey results are not the results of non-respondents because they
were indeed, through additional follow up efforts, the respondents of the study.
Conducting telephone interviews to collect data is a widely accepted method in research.
Therefore, the difference found in this study is not any different than a study, for
example, that finds a significant difference between its male and female respondents.
41

This difference can be ti-eated the same way as the difference between telephone and mail
survey results.
The issue of how this difference was managed statistically is explained in detail in
chapter four. It should be noted that although the difference was controlled for, the
objective of this study has no relation to investigating the differences between the
telephone and mail surveys. Therefore, it should not have any bearing on the results of
the study.
Interview Guidelines and Results
The interviews with the restaurateurs constituted a very important step in this
study. Through the interviews with the restaurateurs, the major attributes that tend to be
important to the restaurateurs were determined. The interviews focused on three sets of
attributes: product, service, and training. The objective of the interviews was to collect
the most relevant attributes to include in the questionnaire. These attributes constituted
the final attributes that were used in the questiotmaire. The interview questions were as
follows:
1. What is the position of the interviewee in the restaurant?
2. What is the name and location of the restaurant?
3. How would you describe the service type of your restaurant? (Quick service,
casual or fine dining)
4. How would you describe the main menu concept of your restaurant?
(American, Chinese, Italian, Mexican, steakhouse, seafood)
42

5. What product attributes are important to you for purchasing wine?
6. What service attiibutes are important to you for purchasing wine?
7. What training attributes are important to you for implementing wine training?
All the relevant attributes that the interviewee mentioned were recorded. The six
most frequently mentioned attributes were selected to include in the final questionnaire
for each of the following categories; product, service and training.
The cities chosen for the interviews were Dallas and Houston. The restaurants
were not confined to one or two particular geographical locations within the two cities.
Rather they were chosen fi-om throughout these areas.
A total of fifteen restaurateurs were interviewed. Ten of them were located in
Houston, five in Dallas. The types of the restaurants for the interviews also were kept
broad. They consisted of independent restaurants as well as franchise restaurants, and the
scale ranged from casual dining to up-scale. The menu type was also diversified. The
names of the restaurants are not reported in the table for the purpose of maintaining
confidentiality. The following responses were obtained from the interviews (Table 1).
43
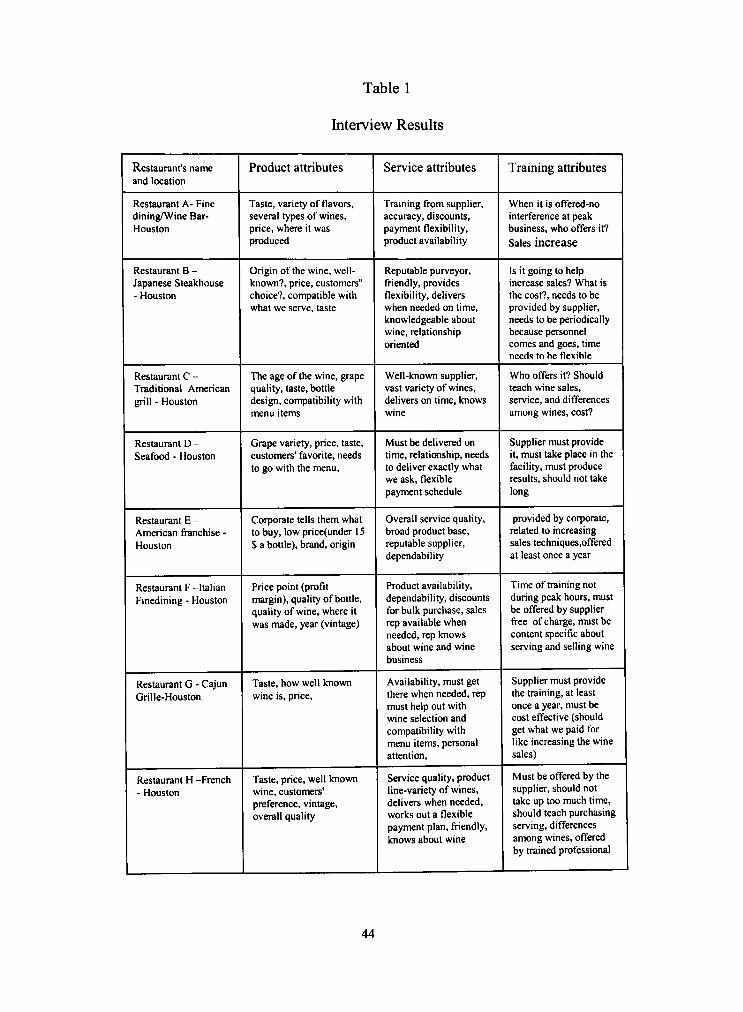
Table 1
Interview Results
Restaurant's name and location
Restaurant A- Fine dining/Wine Bar-Houston
Restaui^nt B -Japanese Steakhouse - Houston
Restaurant C -Traditional American grill - Houston
Restaurant D -Seafood • Houston
Restaurant E -American franchise -Houston
Restaurant F -Italian Finedining - Houston
Restaurant G - Cajun Grille-Houston
Restaurant H -French - Houston
Product attributes
Taste, variety of flavors, several types of wines. price, where it was produced
Origin of the wine, well-known?, price, customers" choice?, compatible viith what we serve, taste
The age of the wine, grape quality, taste, bottle design, compatibility with menu items
Grape variety, price, taste, customers' favorite, needs to go with the menu.
Corporate tells them what to buy, low price(under 15 $ a bottle), brand, origin
Price point (profit margin), quality of bottle. quality of wine, where it was made, year (vintage)
Taste, how well known wine is, price.
Taste, price, well known wine, customers' preference, vintage. overall quality
Service attributes
Training from supplier. accuracy, discounts, payment flexibility. product availability
Reputable purveyor. friendly, provides flexibility, delivers when needed on time. knowledgeable about wine, relationship oriented
Well-known supplier. vast variety of wines. delivers on time, knows wine
Must be delivered on time, relationship, needs to deliver exactly what we ask, flexible payment schedule
Overall service quality. broad product base. reputable supplier, dependability
Product availability. dependability, discounts for bulk purchase, sales rep available when needed, rep knows about wine and wine business
Availability, must get there when needed, rep must help out wdth wine selection and compatibility with menu items, personal attention.
Service quality, product line-variety of wines, delivers when needed. works out a flexible payment plan, friendly, knows about wine
Training attributes
When it is offered-no interference at peak business, who offers it? Sales increase
Is it going to help increase sales? What is the cost?, needs to be provided by supplier. needs to be periodically because personnel comes and goes, time needs to he flexible
Who offers it? Should teach wine sales. service, and differences among wines, cost?
Supplier must provide it, must take place in the facility, must produce results, should not take long
provided by corporate. related to increasing sales techniques.offered at least once a year
Time of training not during peak hours, must be offered by supplier free ofcharge, mustbe content specific about serving and selling wine
Supplier must provide the training, at least once a year, must be cost effective (should get what we paid for like increasing the wine sales)
Must be offered by the supplier, should not take up too much time. should teach purchasing serving, differences among wines, offered by trained professional
44
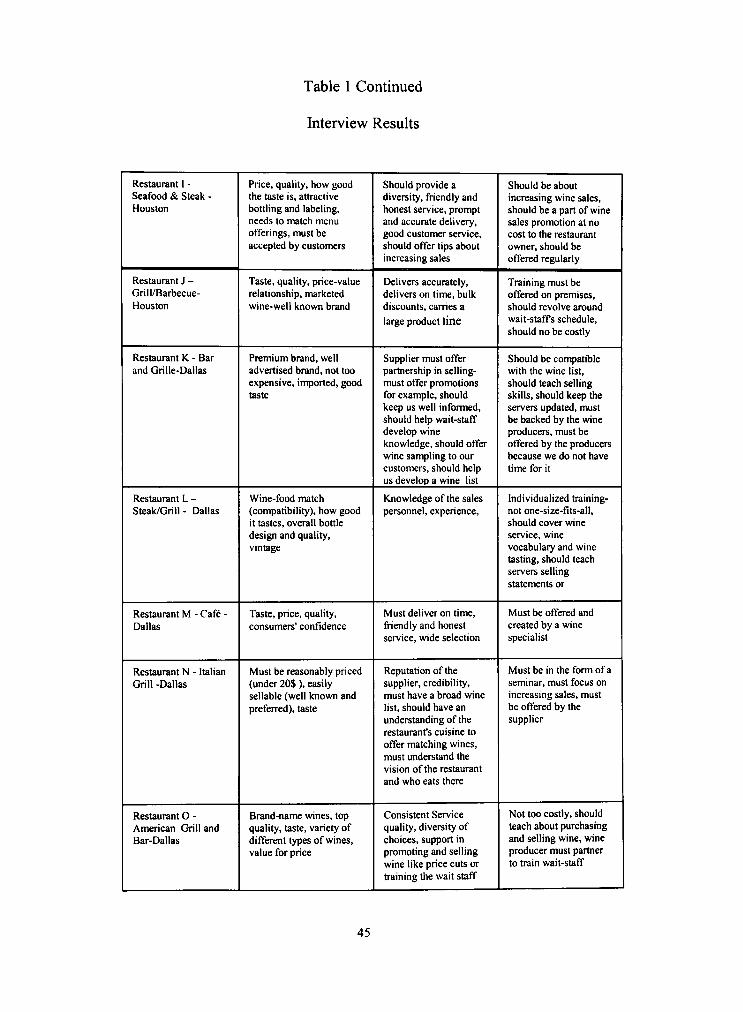
Table 1 Continued
Interview Results
Restaurant 1 -Seafood & Steak -Houston
Restaurant J -Grill/Barbecue-Houston
Restaurant K - Bar and Grille-Dallas
Restaurant L -Steak/Grill - Dallas
Restaurant M - Cafe -Dallas
Restaurant N - Italian Grill -Dallas
Restaurant O -American Grill and Bar-Dallas
Price, quality, how good the taste is, attractive bottling and labeling. needs to match menu otTerings, must be accepted by customers
Taste, quality, price-value relationship, marketed wine-well known brand
Premium brand, well advertised brand, not too expensive, imported, good taste
Wine-food match (compatibility), how good it tastes, overall bottle design and quality. vintage
Taste, price, quality. consumers' confidence
Must be reasonably priced (under 20$), easily sellable (well known and preferred), taste
Brand-name wines, top quality, taste, variety of different types of wines. value for price
Should provide a diversity, fi-iendly and honest service, prompt and accurate delivery. good customer service. should offer tips about increasing sales
Delivers accurately. delivers on time, bulk discounts, carries a large product line
Supplier must offer partnership in selling-must offer promotions for example, should keep us well informed. should help wait-staff develop wine knowledge, should offer v^ne sampling to our customers, should help us develop a wine list
Knowledge of the sales personnel, experience.
Must deliver on time, friendly and honest service, vnde selection
Reputation of the supplier, credibility. must have a broad wine list, should have an understanding of the restaurant's cuisine to offer matching wines. must understand the vision of the restaurant and who eats there
Consistent Service quality, diversity of choices, support in promoting and selling wine like price cuts or training the wait staff
Should be about increasing wine sales. should be a pari of wine sales promotion at no cost to the restaurant owner, should be offered regularly
Training must be offered on premises. should revolve around wait-staffs schedule, should no be costly
Should be compatible with the wine list. should teach selling skills, should keep the servers updated, must be backed by the wine producers, must be offered by the producers because we do not have time for it
Individualized training-not one-size-fits-all. should cover wine service, wine vocabulary and wine tasting, should teach servers selling statements or
Must be offered and created by a wine specialist
Must be in the form of a seminar, must focus on increasing sales, must be offered by the supplier
Not too costly, should teach about purchasing and selling wine, wine producer must partner to train wait-staff
45
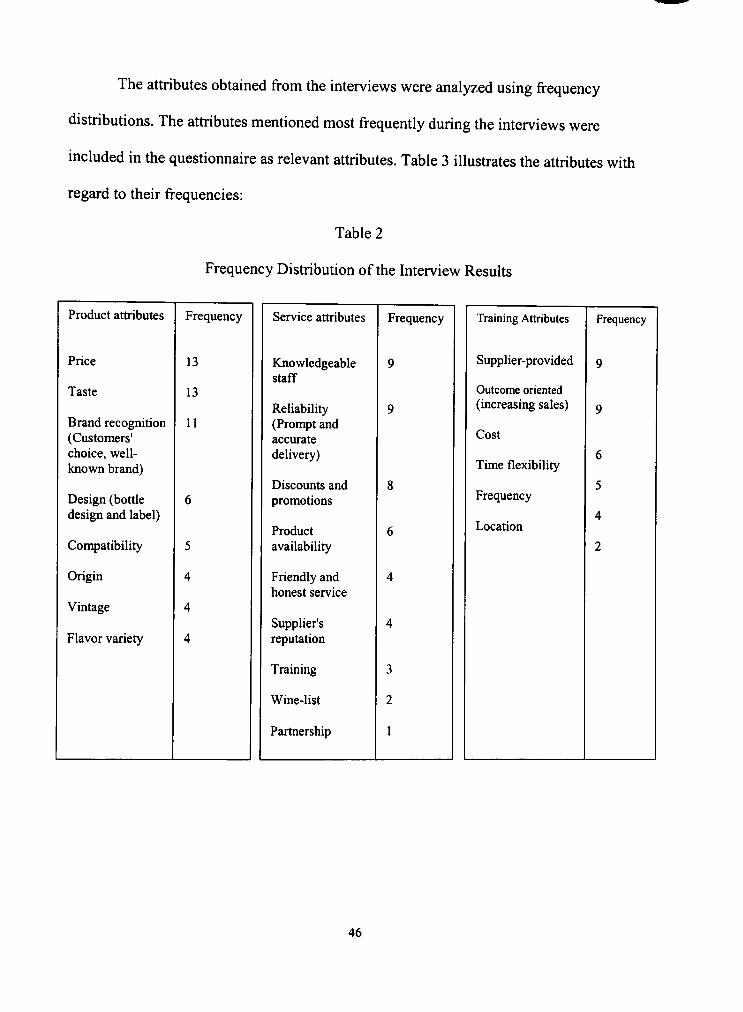
The attributes obtained from the interviews were analyzed using frequency
distiibutions. The attiibutes mentioned most frequently during the interviews were
included in the questionnaire as relevant attributes. Table 3 illustrates the attributes with
regard to their frequencies:
Table 2
Frequency Distribution of the Interview Results
Product attributes
Price
Taste
Brand recognition (Customers' choice, well-known brand)
Design (bottle design and label)
Compatibility
Origin
Vintage
Flavor variety
Frequency
13
13
11
6
5
4
4
4
Service attributes
Knowledgeable staff
Reliability (Prompt and accurate delivery)
Discounts and promotions
Product availability
Friendly and honest service
Supplier's reputation
Training
Wine-list
Partnership
Frequency
9
9
8
6
4
4
3
2
1
Training Attributes
Supplier-provided
Outcome oriented (increasing sales)
Cost
Time flexibility
Frequency
Location
Frequency
9
9
6
5
4
2
46
Questionnaire
The questionnaire included four main sections. The first section contained general
questions that were used to categorize each restaurant based upon its size, service type,
main menu concept, type of ownership and wine sales percentage. This section also
focused on questions regarding quantities of various wines purchased, purchasing
responsibilities of employees, the wine purchasing fraining background of the purchasing
decision-maker, the types of suppliers used to purchase of local wines, and satisfaction
levels with the supplier. Although restaurants can be categorized in many ways, keeping
the categorization applicable to the sample was essential. The other three sections of the
questionnaire focused on specific questions about training, product and service attributes
important in the wine purchasing decision.
Fishbein and Ajzen's (1975) multi-attribute model was utiHzed to design the
questionnaire. This model is especially suitable for measuring attitudes toward a product,
service, or specific concepts. According to this model, the consumer's attitude toward a
product, service, or specific concept is the evaluation of certain product or service
specific beliefs and/or attributes. Therefore, the questionnaire for this study was designed
to indicate how the model could be used to measure and calculate restaurateurs' attitudes
with respect to three categories. These categories were wine training, local wines, and
wine suppliers.
Fishbein and Ajzen's (1975) multi-attribute model utilizes a separate assessment
of two main elements, belief strengths and evaluation of attributes. The questions for
each category were designed to reflect this aspect. In the questionnaire, for each category.
47

the first six questions were the belief questions. They used a point scale that went from -3
to +3 (-3= very unlikely and -+-3= very likely) measuring the strength of the belief that the
object contained the attribute. The second six questions were the evaluation of the belief
questions. They used a point scale that went from -3 to +3 (-3= not important and +3=
very important) measuring the evaluative dimension associated with the attribute.
The attributes in the questionnaire were decided after a series of focus group
interviews with the restaurateurs and an in-depth literature review. However, the final
determination of the attributes that were included in the questionnaire was made after the
pilot study was conducted in Lubbock. The purpose of the pilot study was to determine if
all relevant attributes were included and reliability and validity were established.
The specific guidelines of the interviews can be found in the interview guideline
section. Although six major attributes had been determined through the interviews for
each category, none of those attributes were final until the pilot study was completed. The
purpose of illustrating the attributes in the following form is only to present an example
of how the attributes were integrated into the questionnaire.
Training attributes
(1) Provider:
"Whetiier a wine training program is offered by a wine supplier"
(2) Outcome:
"Whether a wine fraining program can increase wine sales in restaurants"
(3) Flexibility:
"Whether a wine training program has a flexible schedule"
48

(4) Cost:
"Whether the cost of a wine training program is paid by a supplier"
(5) Location:
"Whether a wine fraining program is offered on-premise"
(6) Frequency:
"Whether a wine fraining program is offered periodically"
Product attributes
(1) Price:
"Whether a local wine has a low price"
(2) Variety:
"Whether a local wine includes several wine varieties"
(3) Design:
"Whether a local wine has an attractive bottle and label design"
(4) Taste:
"Whether a local wine has a pleasant taste and aroma"
(5) Brand name:
"Whether a local wine is a well-known and popular brand"
(6) Compatibility:
"Whether a local wine includes several flavors to match variety of menu items"
Service attributes
(1) Knowledge:
"Whether a wine supplier has a knowledgeable sales staff about wine"
49

(2) Reliability:
"Whether a wine supplier offers an prompt and accurate delivery"
(3) Discounts:
"Whether a wine supplier offers bulk discounts or promotions"
(4) Product availability:
"Whetiier a wine supplier carries a broad line of wine selections"
(5) Reputation:
"Whether a wine supplier is a well known and reputable supplier"
(6) Friendliness:
"Whether a wine supplier has a friendly and honest sales staff
The development of the questionnaire was followed by the pilot study to
determine if all questions were understandable and relevant. After the appropriate
revisions had been made, the questiormaire was distributed to a sample of twelve hundred
restaurants with mixed-beverage licenses in the state of Texas.
Pilot Stiidy, Validity and Reliability
Determining the most relevant attributes (salient beliefs) to include in the
questionnaire was very important for the completion of this study. Fishbein and Ajzen
(1975) pointed out the importance of determining most relevant attributes to ensure the
reliability of measuring attitudes.
After developing the questiormaire, a pilot study was conducted in Lubbock,
Texas to test the validity and reliability of the survey instrument. The first concern was
50

the face validity to see how the instrument appeared whether it seemed like a reasonable
way to gain the information needed. The respondents indicated that the overall design and
instiiictions of the survey were easy to understand and follow. The average time needed
to complete the questionnaire did not exceed ten minutes.
The second concern was the content validity of the survey instmment. Content
validity was established by developing multiple items (attributes) that represented each of
the three content areas measured, attitude toward wine training, local wines and wine
suppliers. The selection of the content areas and multiple items were established after the
initial interviews with 15 restaurateurs in Texas. The multiple items in the questionnaire
were designed to answer the research questions.
To measure the reliability of the survey instmment, a reliability coefficient was
used. Reliability coefficients for attitudes toward wine-training, local-wines and wine-
suppliers were estimated. All reliability estimates indicated high reliability for the pilot
study.
Table 3 summarizes the reliability coefficient scores for the pilot and actual
stiidies. The reliability coefficient score for attitude toward local-wines was .89 in the
pilot study indicating high reliability of variables measuring attitude toward local-wines.
The other results were .85 for wine-training and .73 for wine-supplier in the pilot sttidy.
Although the reliability coefficient score for wine-supplier was lower than the others for
the pilot study, it was much higher in the actual study with a reliability coefficient at .84
as indicated in Table 3. No changes were made to the research instrument after tiie pilot
study, and the difference in the reliability coefficients between the pilot and the actual
51

study was due to the sample size. The pilot study had a smaller sample size than the
actual study.
Table 3
Reliability Coefficient Scores for the Pilot and Actual Study
PILOT STUDY - Reliability Coefficients
Attitude toward wine training N of Cases = 14.0 N of Items = 6 Alpha = .8459
Attitude toward local wines N of Cases = 16.0 N of Items = 6 Alpha = .8999
Attitude toward wine supplier N of Cases = 15.0 N of Items = 6 Alpha = .7374
ACTUAL STUDY - ReHability CoefTicients
Attitude toward wine training N of Cases = 138.0 N of Items = 6 Alpha = .8450
Attitude toward local wines N of Cases = 140.0 N of Items = 6 Alpha = .8369
Attitude toward wine supplier N of Cases = 144.0 N of Items = 6 Alpha = .8409
Summary of Data Analysis
The data analysis included a factor analysis to examine the sfrength of the relation
between the various training, product, and service attributes and attitudes of restaurateurs
towards wine-fraining, local wines, and wine suppliers. A linear regression model was
52

used to predict the amount of local wines purchased from attitude toward local wines
factor scores. For this analysis, the difference between the telephone and mail survey was
controlled.
In addition, a general linear model was used to assess differences between various
types of restaurants to determine the ones that offer better opportunities for local wines
based on attitude toward local wines scores. For this analysis too, the difference between
the telephone and mail survey was controlled.
A general linear model was also used to compare the telephone and mail survey
scores. Table 4 summarizes the statistical analyses used in the study.
Table 4
Summary of Data Analysis
Area Explored
Statistical Analysis Used
Attitude Toward Wine Training
Factor Analysis
Attitude Toward Local Wines
Factor Analysis
Attitude Toward Wine Suppliers
Factor Analysis
Difference Between Telephone and Mail Survey
General Linear Model MANOVA
Effects of Attitude Toward Local Wines on Actual Local Wines Purchased Linear Regression Model with telephone/mail difference controlled for
Restaurant Types Offering Better Opportunities for Local Wines General Linear Model MANCOVA with telephone/mail difference controlled for
53
CHAPTER IV
FINDINGS
This chapter reports the findings of the study in three main sections. The first section
reports the descriptive findings. The second section of the chapter is the statistical
analysis. In this section, the first set of findings reported is the difference that was found
between the mail and telephone surveys. This analysis explains the nature of this
difference and how it was confrolled in the statistical analysis to eliminate its
confounding or limiting effects on the data analysis. Following this, are the statistical
analyses that were applied to each of the five research questions. Based on the objectives
of the research and review of literature, the following questions were established and
tested:
1. Which fraining attributes influence restaurateurs' attitudes toward wine
training?
2. Which product attributes influence restaurateurs' attitudes toward local wines?
3. Which service attributes influence restaurateurs attitudes toward wine
suppliers?
4. Does the attitude toward local wines have any effect on the actual amount of
local wines purchased?
5. What types of restaurants offer better opportunities for local wines?
The final section of this chapter is the summary of the findings that attempts to
put all the statistical analyses into perspective based on the objectives of the study.
54

Descriptive Data
Restaurant size was broken down to three categories; seating capacity up to 70
(small), between 70 and 140 (medium), and 140 and above (large). The large restaurants
constituted the majority of the sample with 47%. This was followed by medium and
small restaurants with 33.6% and 19.5%, respectively.
Restaurant type by service type revealed casual restaurants in the majority with
61.8%, which was followed by fine dining and quick service restaurants with 32.2% and
5.9%, respectively. Independent restaurants were the majority for the type of restaurants
based on the type of ownership with 75%. This was followed by chain and franchise
restaurants with 15.8% and 9.2%, respectively.
Among the 7 categories of the restaurant types by main menu concept, American
was the majority witii 27.2%. The second major category was the "other" category with
24.5%, which was established to indicate the categories besides the six pre-established
ones. This was followed by Italian, Seafood, Steakhouse, Mexican, and Chinese with
13.9%, 13.9%, 8.6%, 8.6%, and 3.3%., respectively. Table 5 summarizes the data for
restaurant types based on seating capacity (size), service type, type of ownership, and
main menu concept.
55

Table 5
Descriptive Statistics for Restaurant Types
Restaurant type by seating capacity
Valid small
medium
large
Total
Missing System
Total
Restaurant type by service type
Valid Quick
Casual
Fine Dining
Total
Restaurant type by type of ownership
Valid Chain
Franchise
Independent
Total
Restaurant type by main menu concept
Valid American
Chinese
Italian
Mexican Steakhouse
Seafood
Other
Total
Missing System
Total
Frequency
29
50
70
149
3
152
Frequency
9
94
49
1-52
Frequency
24
14
114
152
Frequency
41
5
21 13 13
21
37
151
1 152
Percent
19.1
32.9
46.1
98.0
2.0
100.0
Percent
5.9
61.8
32.2
100.0
Percent
15.8
9.2
75.0
100.0
Percent
27.0
3.3
13.8
8.6 8.6
13.8
24.3
99.3
.7 100.0
Valid Percent
19.5
33.6
47.0
100.0
Valid Percent
5.9
61.8
32.2
100.0
Valid Percent
15.8
9.2
75.0
100.0
Valid Percent
27.2
3.3
13.9
8.6 8.6
13.9
24.5
100.0
Cumulative Percent
19.5
53.0
100.0
Cumulative Percent
5.9
67.8
100.0
Cumulative Percent
15.8
25.0
100.0
Cumulative Percent
27.2
30.5
44.4
53.0
61.6
75.5
100.0
56

Table 6 is the summary of the general questions about wine training. Of all
respondents, 69.1% said they received wine training, while 30.9% had never received any
form of wine fraining.
Table 6
Descriptive Statistics for General Wine Training
Ever received wine training?
Valid No
Yes
Total
How often is wine training offered at your restaurant?
Valid Never
Once a year
More than once a year
Total
How important is wine training for your restaurant?
Valid N 149 (list wise)
How important is wine training for your restaurant? Valid .00
1.00
2.00
3.00
4.00
5.00
6.00
7.00
Total
Missing System
Total
Frequency
47
105
152
Frequency
53
32
67
152
Minimum
.00
Frequency
1
19
8
19
18
15
14
55
149
3
152
Percent
30.9
69.1
100.0
Percent
34.9
21.1
44.1
100.0
Maximum
7.00
Percent
.7
12.5
5.3
12.5
11.8
9.9
9.2
36.2
98.0
2.0
100.0
Valid Percent
30.9
69.1
100.0
Valid Percent
34.9
21.1
44.1
100.0
Mean
4.7517
Valid Percent
.7
12.8
5.4
12.8
12.1
10.1
9.4
36.9
100.0
Cumulative Percent
30.9
100.0
Cumulative Percent
34.9
55.9
100.0
Std. Deviation
2.20536
Cumulative Percent
.7
13.4
18.8
31.5
43.6
53.7
63.1
100.0
57

For the question of how often wine training is offered at the restaurant, 44.1%
said more than once a year, 34.9% never and 21.1% once a year only.
On a scale from 1 (not important) to 7 (very important), for the question of how
important is wine fraining for the restaurant, the majority 36.9% indicated 7 (very
important). The mean score for this question was 4.75.
Table 7 indicates the wine purchase percentages. Of all respondents, 52% said
less than 25% of their alcohol sales were from wine sales while 27.7% sold above 50%
and 19.7%) sold between 25 to 50%.
Table 7
Descriptive Statistics for Wine Purchases
Percentage of wine sales in total alcohol sales Valid 0-25 percent
25-50 percent Above 50 percent Total
Missing System Total
Percentage of Texas wines purchased Valid Less than 25 percent
25 to 50 percent More than 50 percent Total
Wines purchased by origin (based on majority purchase) Valid California
France Italy Texas Other Total
Missing System
Total
Frequency
77 30 41
148 4
152
Frequency 119 11
22
152
Frequency 91 10 19 22
6 148
4
152
Percent
50.7 19.7 27.0 97.4
2.6 100.0
Percent 78.3
7.2
14.5
100.0
Percent 59.9 6.6
12.5 14.5 3.9
97.4
2.6
100.0
Valid Percent
52.0 20.3 27.7
100.0
Valid Percent 78.3
7.2
14.5
100.0
Valid Percent 61.5
6.8 12.8 14.9 4.1
100.0
Cumulative Percent
52.0 72.3
100.0
Cumulative Percent
78.3 85.5
100.0
Cumulative Percent
61.5 68.2 81.1 95.9
100.0
58
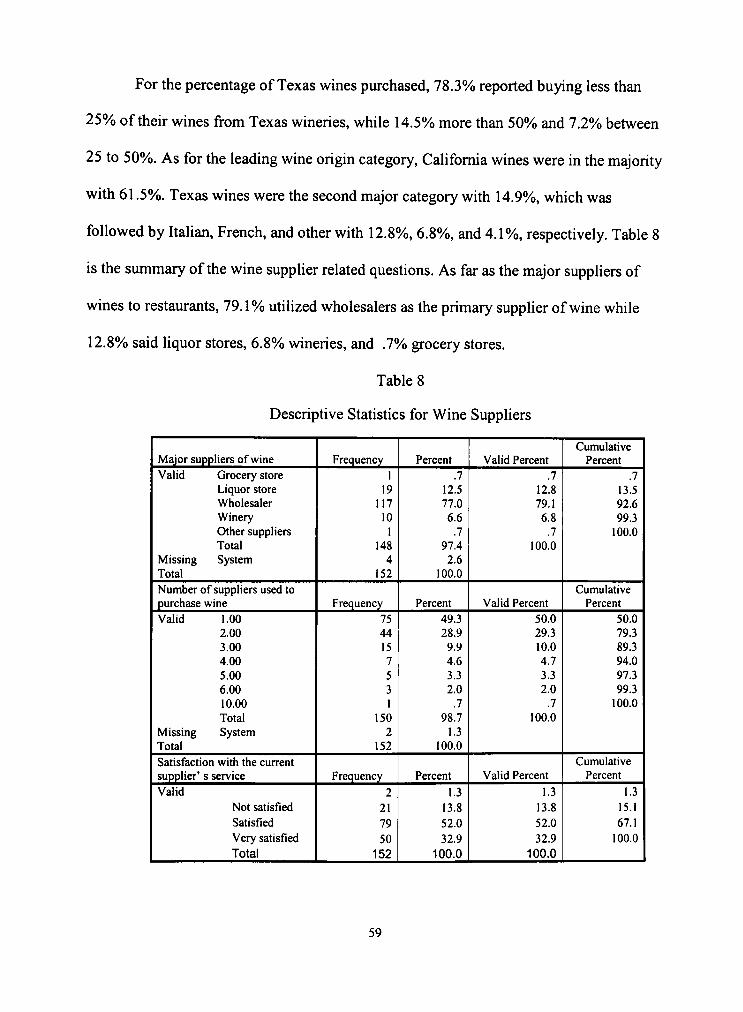
For the percentage of Texas wines purchased, 78.3% reported buying less than
25% of their wines from Texas wineries, while 14.5% more than 50%) and 7.2% between
25 to 50%. As for the leading wine origin category, Califomia wines were in the majority
with 61.5%). Texas wines were the second major category with 14.9%, which was
followed by Italian, French, and other with 12.8%, 6.8%, and 4.1%), respectively. Table 8
is the summary of the wine supplier related questions. As far as the major suppliers of
wines to restaurants, 79.1% utilized wholesalers as the primary supplier of wine while
12.8% said liquor stores, 6.8% wineries, and .7% grocery stores.
Table 8
Descriptive Statistics for Wine Suppliers
Major suppliers of wine Valid Grocery store
Liquor store Wholesaler Winery Other suppliers Total
Missing System Total Number of suppliers used to purchase wine Valid 1.00
2.00 3.00 4.00 5.00 6.00 10.00 Total
Missing System Total Satisfaction with the current supplier' s service Valid
Not satisfied Satisfied Very satisfied Total
Frequency 1
19 117
10 1
148 4
152
Frequency 75 44 15 7 5 3 1
150 2
152
Frequency 2
21 79 50
152
Percent .7
12.5 77.0 6.6
.7 97.4 2.6
100.0
Percent 49.3 28.9 9.9 4.6 3.3 2.0
.7 98.7
1.3 100.0
Percent 1.3
13.8 52.0 32.9
100.0
Valid Percent .7
12.8 79.1 6.8
.7 100.0
Valid Percent 50.0 29.3 10.0 4.7 3.3 2.0
.7 100.0
Valid Percent
1.3 13.8 52.0 32.9
100.0
Cumulative Percent
.7 13.5 92.6 99.3
100.0
Cumulative Percent
50.0 79.3 89.3 94.0 97.3 99.3
100.0
Cumulative Percent
1.3 15.1 67.1
100.0
59
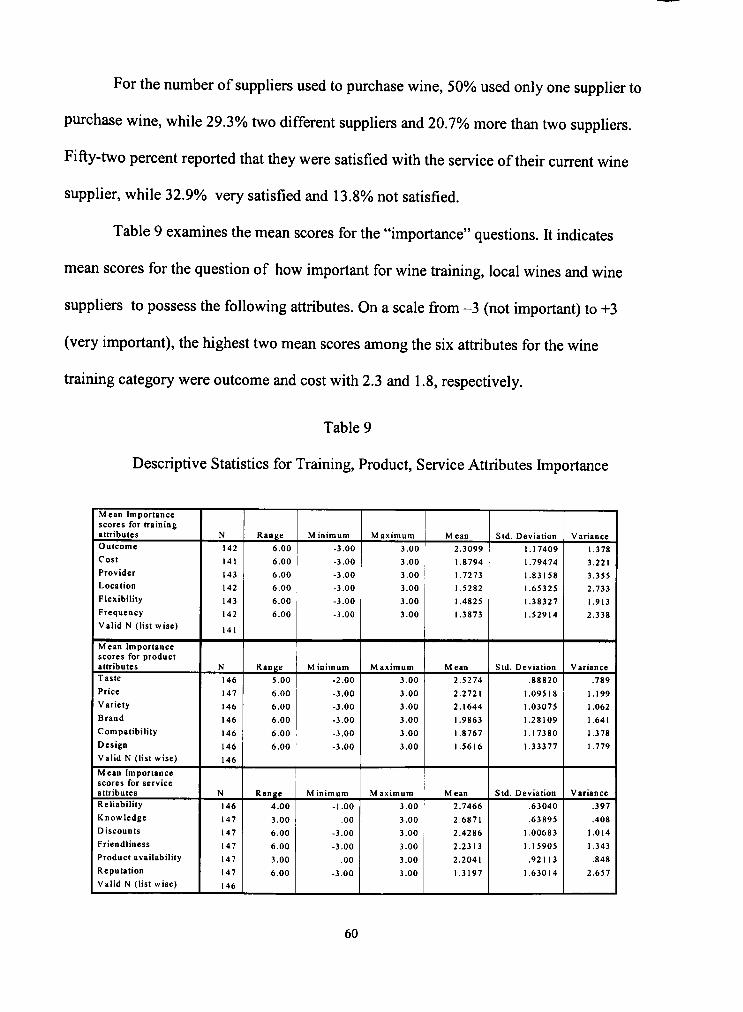
For the number of suppliers used to purchase wine, 50% used only one supplier to
purchase wine, while 29.3% two different suppliers and 20.7% more than two suppliers.
Fifty-two percent reported that tiiey were satisfied with the service of their current wine
supplier, while 32.9% very satisfied and 13.8% not satisfied.
Table 9 examines the mean scores for the "importance" questions. It indicates
mean scores for the question of how important for wine training, local wines and wine
suppliers to possess the following attributes. On a scale from -3 (not important) to +3
(very important), the highest two mean scores among the six attributes for the wine
fraining category were outcome and cost with 2.3 and 1.8, respectively.
Table 9
Descriptive Statistics for Training, Product, Service Attributes Importance
Mean Importance scores for training attributes Outcome
Cost Provider Location Flexibility Frequency Valid N (list wise)
Mean Importance scores for product attributes Taste
Price Variety Brand Compatibility Design Valid N (list wise)
Mean Importance scores for service attributes Reliability Knowledge Discounts Friendliness Product availability
Reputation Valid N (list wise)
N 142 141 143 142 143 142
141
N 146 147 146 146 146 146 146
N 146 147 147 147 147 147 146
Range 6.00 6.00 6.00 6.00 6.00 6.00
Range 5.00 6.00 6.00 6.00 6.00 6.00
Range 4.00 3.00 6.00 6.00 3.00 6.00
M inimum -3.00 -3.00 -3.00 -3.00 -3.00 -3.00
M inimum -2.00 -3.00 -3.00 -3.00 -3.00 -3.00
M inimum -1.00
.00 -3.00 -3.00
.00 -3.00
Maximum 3.00 3.00 3.00 3.00 3.00 3.00
Maximum 3.00 3.00 3.00 3.00 3.00 3.00
M aximum 3.00 3.00 3.00 3.00 3.00 3.00
M ean 2.3099 1.8794 1.7273 1.5282 1.4823 1.3873
M ean 2.5274
2.2721 2.1644 1.9863 1.8767 1.5616
Mean 2.7466 2.6871 2.4286 2.2313 2.2041 1.3197
Std. Deviation 1.17409 1.79474 1.83158 1.65325 1.38327 1.52914
Std. Deviation .88820
1.09518 1.03075 1.28109 1.17380 1.33377
Std. Deviation .63040 .63895
1.00683 1.15905
.92113 1.63014
Variance 1.378 3.221 3.355 2.733 1.913 2.338
Variance .789
1.199 1.062 1.641 1.378 1.779
Variance .397 .408
1.014
1.343 .848
2.657
60

For the local (Texas) wines category, the highest two mean scores were for taste
and price attiibutes with 2.5 and 2.2, respectively, and for the wine supplier category, the
highest two mean scores were reliability and knowledge attributes with 2.7 and 2.6
respectively.
The overall attitude mean scores toward three major areas, wine training, local
wines and wine suppliers, are indicated in Table 10. Attitude toward wine suppliers had
the highest attitude mean score with 16.5 (with a possible range from -54 to +54). This
was followed by the mean score for attitude toward wine training with 12.4 and attitude
toward local wines with 9.3. The attitude scores for all three categories were positive.
Table 10
Attitude Toward Wine Training, Local Wines and Wine Suppliers
Attitude Toward Wine Training Valid N (listwise)
Attitude Toward Local Wines Valid N (listwise)
Attitude Toward Local Wines Valid N (listwise)
N
141
141 N
152
152 N
152
152
Minimum
-51.00
Minimum
-51.00
Minimum
-42.00
Maximum
54.00
Maximum
54.00
Maximum
54.00
Mean
12.4326
Mean
9.3289
Mean
16.5461
Std. Deviation
22.29872
Std. Deviation
19.55897
Std. Deviation
21.43459
The "favorability" determination was made based on the Fishbein and Ajzen's
(1975) multi-attribute model. According to this model, once the overall attitude scores are
obtained, a researcher can make a categorization, usually in the form of a percentile scale,
to report the findings in a more sensible way. Usually, the negative scores are interpreted
as disfavored and positive scores as favored. Further distinction can also be made to
61
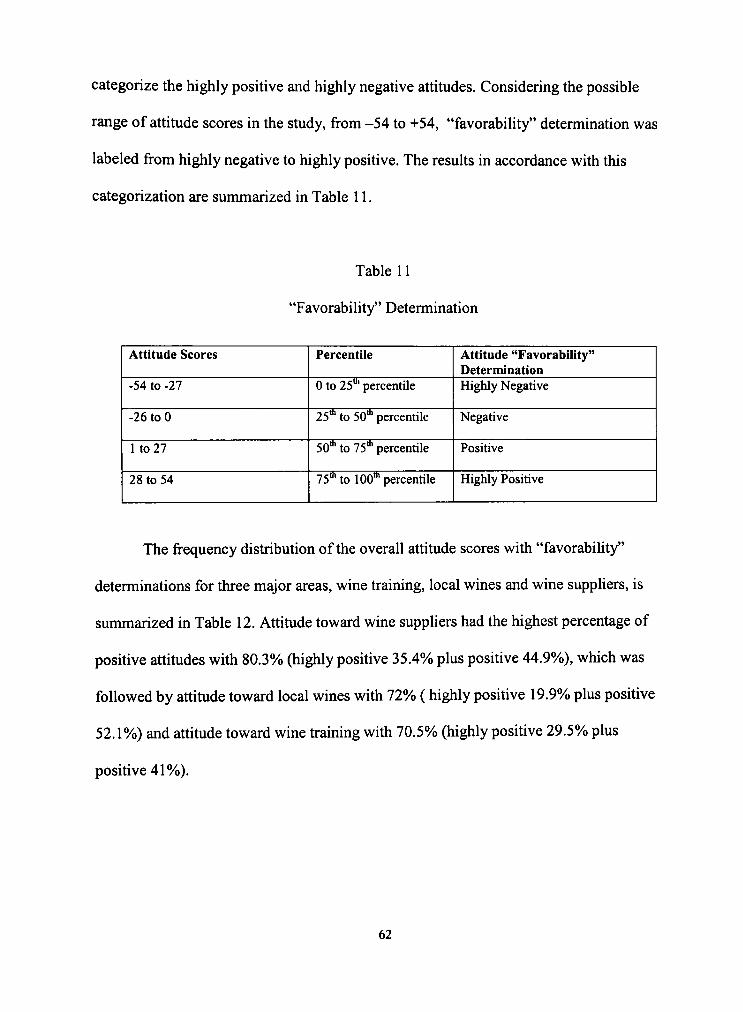
categorize the highly positive and highly negative attitudes. Considering the possible
range of attitude scores in the study, from -54 to +54, "favorability" determination was
labeled from highly negative to highly positive. The results in accordance with this
categorization are summarized in Table 11.
Table 11
"Favorability" Determination
Attitude Scores
-54 to -27
-26 to 0
1 to 27
28 to 54
Percentile
0 to 25"' percentile
25"̂ to 50"̂ percentile
50'" to 75* percentile
75* to lOO*" percentile
Attitude "Favorability" Determination Highly Negative
Negative
Positive
Highly Positive
The frequency distribution of the overall attitude scores with "favorabihty"
determinations for three major areas, wine training, local wines and wine suppliers, is
summarized in Table 12. Attitude toward wine suppliers had the highest percentage of
positive attitiides with 80.3%) (highly positive 35.4% plus positive 44.9%), which was
followed by attitude toward local wines with 72% (highly positive 19.9% plus positive
52.1%)) and attitude toward wine training with 70.5% (highly positive 29.5% plus
positive 41%).
62

Table 12
Frequency Distiibution of the "Favorability" Determination for Attitude Toward Wine Training, Local Wines and Wine Suppliers
Attitude Toward Wine Training Valid Highly negative attitude
Negative attitude
Positive attitude
Highly positive attitude
Total
Missing System
Total
Attitude Toward Local Wines Valid Highly negative attitude
Negative attitude
Positive attitude
Highly positive attitude
Total
Missing System
Total
Attitude Toward Wine Suppliers Valid Highly negative attitude
Negative attitude
Positive attitude
Highly positive attitude
Total
Missing System
Total
Frequency
3
38
57
41
139
16
155
Frequency
4
37
76
29
146
9
155
Frequency
7
22
66
52
147
8
155
Percent
1.9
24.5
36.8
26.5
89.7
10.3
100.0
Percent
2.6
23.9
49.0
18.7
94.2
5.8
100.0
Percent
4.5
14.2
42.6
33.5
94.8
5.2
100.0
Valid Percent
2.2
27.3
41.0
29.5
100.0
Valid Percent
2.7
25.3
52.1
19.9
100.0
Valid Percent
4.8
15.0
44.9
35.4
100.0
Cumulative Percent
2.2
29.5
70.5
100.0
Cumulative Percent
2.7
28.1
80.1
100.0
Cumulative Percent
4.8
19.7
64.6
100.0
Statistical Analysis
Comparison of the Telephone and iVIail Survey Scores
Due to the anticipated low response rate for the study, an additional attempts were
made to follow up on the unretumed mailed surveys by telephoning the respondents and
asking them to complete the survey over the telephone. The responses obtained this way
63
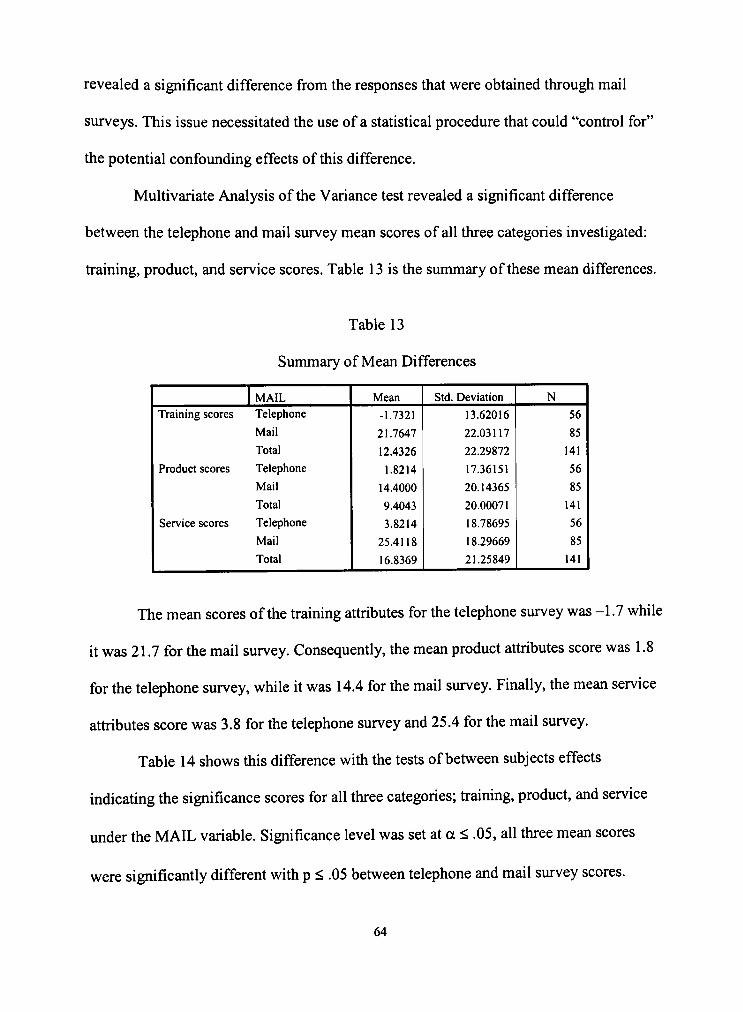
revealed a significant difference from the responses that were obtained through mail
surveys. This issue necessitated the use of a statistical procedure that could "control for"
the potential confounding effects of this difference.
Multivariate Analysis of the Variance test revealed a significant difference
between the telephone and mail survey mean scores of all three categories investigated:
fraining, product, and service scores. Table 13 is the summary of these mean differences.
Table 13
Summary of Mean Differences
1 MAIL Training scores
Product scores
Service scores
Telephone
Total
Telephone
Total
Telephone
Total
Mean
-1.7321
21.7647
12.4326
1.8214
14.4000
9.4043
3.8214
25.4118
16.8369
Std. Deviation
13.62016
22.03117
22.29872
17.36151
20.14365
20.00071
18.78695
18.29669
21.25849
N
56
85
141
56
85
141
56
85
141
The mean scores of the training attributes for the telephone survey was -1.7 while
it was 21.7 for the mail survey. Consequently, the mean product attributes score was 1.8
for the telephone survey, while it was 14.4 for the mail survey. Finally, the mean service
attiibutes score was 3.8 for the telephone survey and 25.4 for the mail survey.
Table 14 shows this difference with the tests of between subjects effects
indicating the significance scores for all three categories; fraining, product, and service
under the MAIL variable. Significance level was set at a < .05, all three mean scores
were significantly different with p < .05 between telephone and mail survey scores.
64
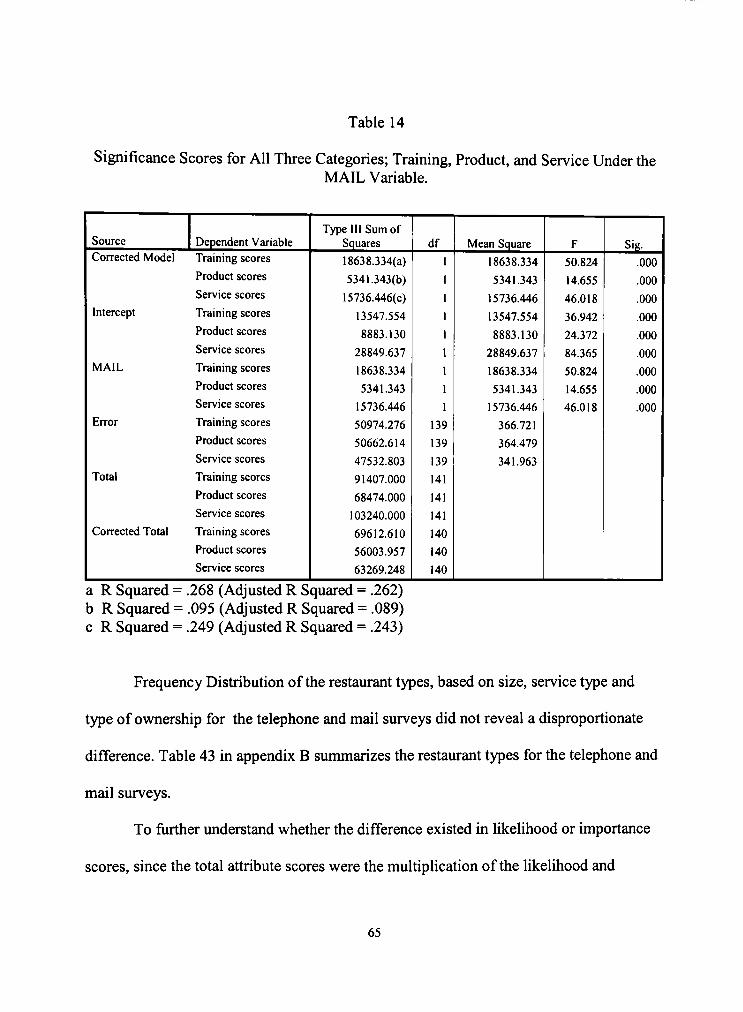
Table 14
Significance Scores for All Three Categories; Training, Product, and Service Under the MAIL Variable.
Source Corrected Model
Intercept
Error
Total
Corrected Total
Dependent Variable Training scores
Product scores
Service scores
Training scores
Product scores
Service scores
Training scores
Product scores
Service scores
Training scores
Product scores
Service scores
Training scores
Product scores
Service scores
Training scores
Product scores
Service scores
Type III Sum of Squares
18638.334(a)
5341.343(b)
15736.446(c)
13547.554
8883.130
28849.637
18638.334
5341.343
15736.446
50974.276
50662.614
47532.803
91407.000
68474.000
103240.000
69612.610
56003.957
63269.248
df
139
139
139
141
141
141
140
140
140
Mean Square
18638.334
5341.343
15736.446
13547.554
8883.130
28849.637
18638.334
5341.343
15736.446
366.721
364.479
341.963
F
50.824
14.655
46.018
36.942
24.372
84.365
50.824
14.655
46.018
Sig.
.000
.000
.000
.000
.000
.000
.000
.000
.000
a R Squared = b R Squared c R Squared =
.268 (Adjusted R
.095 (Adjusted R
.249 (Adjusted R
Squared = .262) Squared = .089) Squared = .243)
Frequency Distribution of the restaurant types, based on size, service type and
type of ownership for the telephone and mail surveys did not reveal a disproportionate
difference. Table 43 in appendix B summarizes the restaurant types for the telephone and
mail surveys.
To fiirther understand whether the difference existed in likelihood or importance
scores, since the total attribute scores were the multiplication of the likelihood and
65
importance scores, MANOVA was used to compare the means between telephone and
mail surveys. The findings indicated that the significant majority of the difference was
found in the likelihood scores for all three categories measured; training, product, and
service. The summary of these scores are indicated in Appendix B with Tables 35
through 41.
Because of this difference, a statistical model that used the difference between the
telephone and mail survey as a covariate variable in all analyses that used mean scores of
the fraining, product, and service attributes. This procedure ensured that the potential
confounding effects of this difference could statistically be confrolled for. Therefore, all
of the following statistical analyses that use mean comparisons and regression are
conducted by taking this confounder into account.
Using Factor Analysis for Research Questions I, II, and III
Factor analysis was used to measure the correlation between the six observed
variables and the overall attitude toward a subject. For example, for the product category,
the six variables were price, variety, design, taste, brand and compatibility, and their
relation to attitude toward local wines was measured. The same procedure was used for
the fraining and service categories with six different variables assigned to each category.
Since the number of attributes investigated for each category was limited to six, a
confirmatory factor analysis was used.
According to the Fishbein and Ajzen's multi-attiibute model (1975), the overall
attitude score is calculated by adding the sums of all six-attribute scores However, the
66
scores obtained this way brought up the issue of "violation of independence" assumption
when measuring the correlation between two variables. Since the six attribute scores were
directly involved in calculating the overall attitude score, there was a potential for the
violation of the assumption of independence that required the use of a statistical model
that would eliminate this possibility.
There were three possible ways to approach this issue. The first approach was to
use the item-total correlations method. The method takes the individual attribute score
and compares it directly to the total overall attitude score. The limitation of this
procedure is that the assumption of independence is violated since the total attitude score
contains the item that contributed to the total score to calculate it. Thus, these two scores
in fact are not independent. This procedure tends to overestimate the magnitude of the
correlation, and the standard errors are inflated.
The second alternative was to the use corrected total correlations method. This
procedure involves correlation between an item and the total score that excludes the item.
For example, when calculating the relationship between price attribute and overall
attitude toward local wines, the total score for the attitude toward local wines excludes
the item score for price. The limitation of this procedure is every time the correlation is
measured, the total score is different.
The third altemative, factor analysis, was used in this study. With this analysis,
the overall attitude is considered an unobserved (latent) variable, and it is estimated from
the correlations among the six items (attributes) used to calculate it. This method did not
67
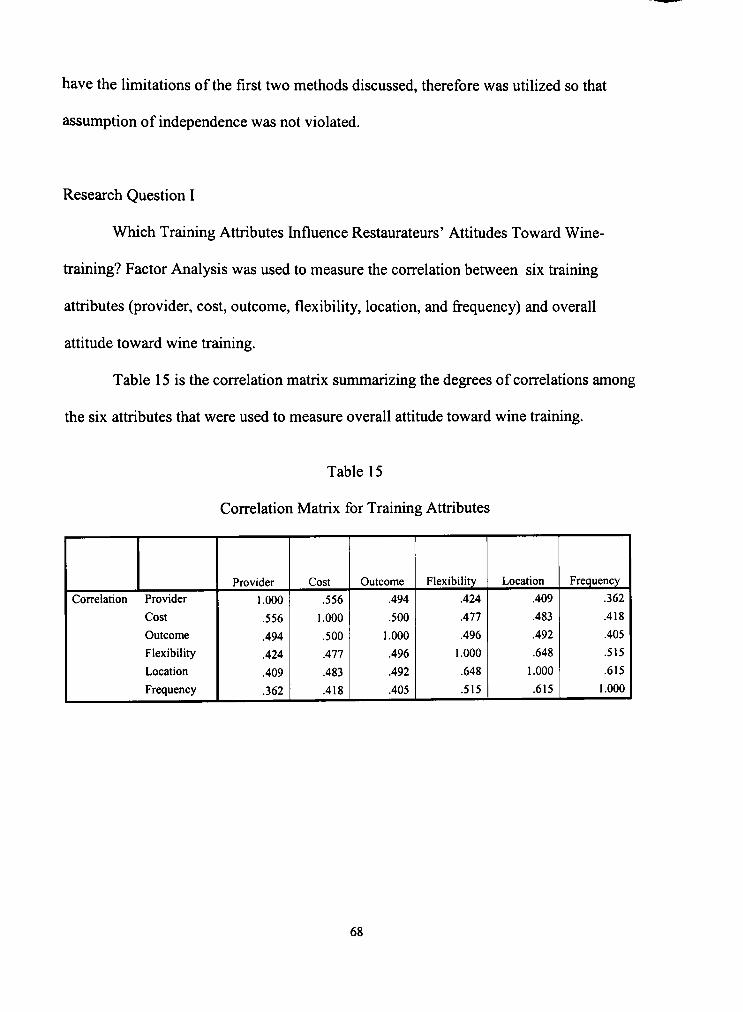
have the limitations of the first two methods discussed, therefore was utilized so that
assumption of independence was not violated.
Research Question I
Which Training Attributes Influence Restaurateurs' Attitudes Toward Wine-
fraining? Factor Analysis was used to measure the correlation between six training
attributes (provider, cost, outcome, flexibility, location, and frequency) and overall
attitude toward wine fraining.
Table 15 is the correlation matrix summarizing the degrees of correlations among
the six attributes that were used to measure overall attitude toward wine fraining.
Table 15
Correlation Matrix for Training Attributes
Correlation Provider
Cost
Outcome
Flexibility
Location
Frequency
Provider
1.000
.556
.494
.424
.409
.362
Cost
.556
1.000
.500
.477
.483
.418
Outcome
.494
.500
1.000
.496
.492
.405
Flexibility
.424
.477
.496
1.000
.648
.515
Location
.409
.483
.492
.648
1.000
.615
Frequency
.362
.418
.405
.515
.615
1.000
68
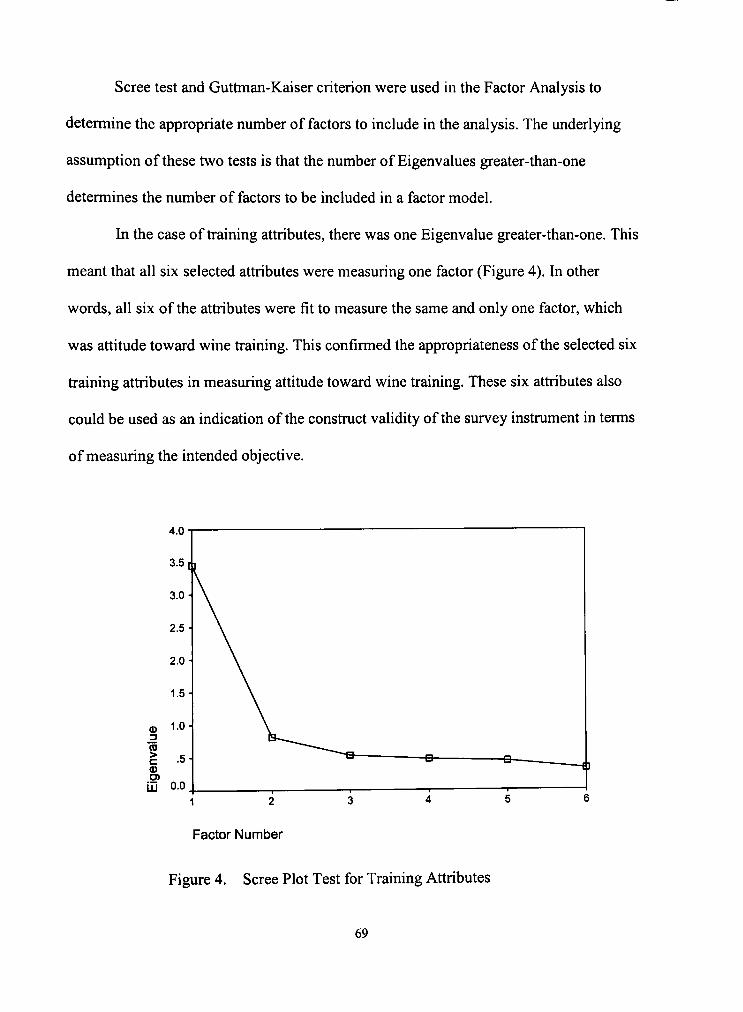
Scree test and Guttman-Kaiser criterion were used in the Factor Analysis to
determine the appropriate number of factors to include in the analysis. The underlying
assumption of these two tests is that the number of Eigenvalues greater-than-one
determines the number of factors to be included in a factor model.
In the case of training attributes, there was one Eigenvalue greater-than-one. This
meant that all six selected attributes were measuring one factor (Figure 4). In other
words, all six of the attributes were fit to measure the same and only one factor, which
was attitude toward wine fraining. This confirmed the appropriateness of the selected six
fraining attributes in measuring attitude toward wine training. These six attributes also
could be used as an indication of the constmct validity of the survey instmment in terms
of measuring the intended objective.
Factor Number
Figure 4. Scree Plot Test for Training Attributes
69
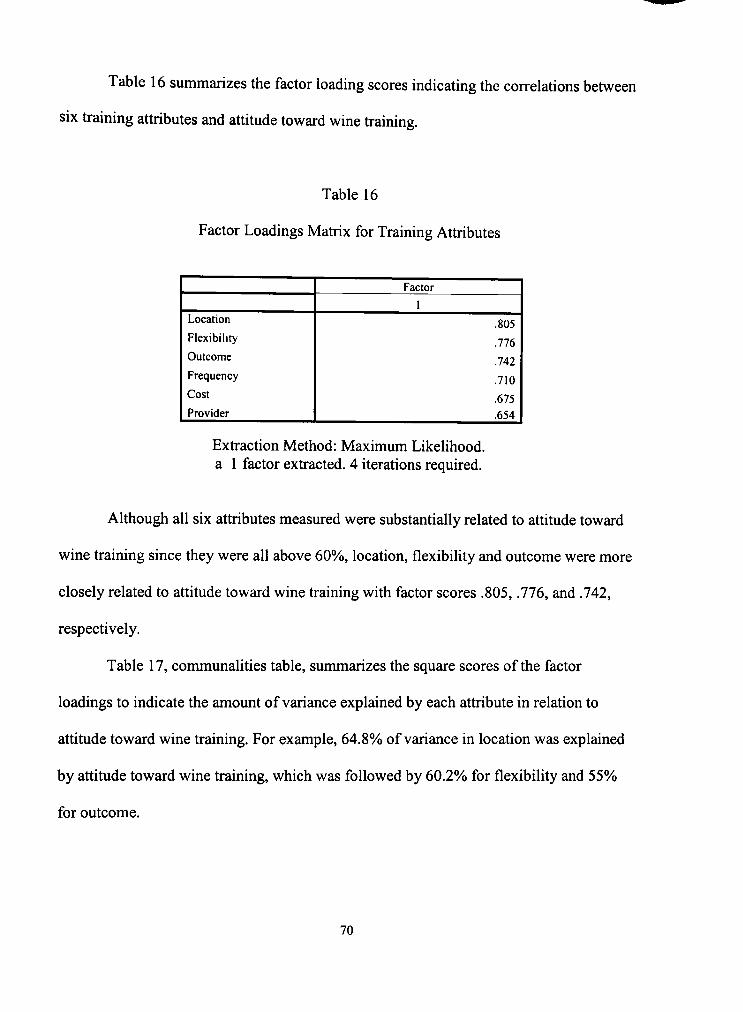
Table 16 summarizes the factor loading scores indicating the correlations between
six fraining attiibutes and attitude toward wine fraining.
Table 16
Factor Loadings Matrix for Training Attributes
Location
Flexibility
Outcome
Frequency
Cost
Provider
Factor
1
.805
.776
.742
.710
.675
.654
Extraction Method: Maximum Likelihood, a 1 factor extracted. 4 iterations required.
Although all six attributes measured were substantially related to attitude toward
wine fraining since they were all above 60%, location, flexibility and outcome were more
closely related to attitude toward wine training with factor scores .805, .776, and .742,
respectively.
Table 17, communalities table, summarizes the square scores of the factor
loadings to indicate the amount of variance explained by each attribute in relation to
attitude toward wine training. For example, 64.8% of variance in location was explained
by attitude toward wine training, which was followed by 60.2% for flexibility and 55%
for outcome.
70

Table 17
Communalities for Wine Training Attributes
Provider
Cost
Outcome
Flexibility
Location
Frequency
Extraction
.427
.456
.550
.602
.648
.504
Extraction Method: Maximum Likelihood.
Table 18 is the summary of how much of the total variance of the data can be
explained by the factor, attitude toward wine training. The attitude toward wine training
explained 53%) of the total variance in the data.
Table 18
Total Variance Explained by Attitude Toward Wine Training
Factor
1
Extraction Sums of Squared Loadings
Total
3.186
% of Variance
53.102
Cumulative %
53.102
Exfraction Method: Maximum Likelihood.
71
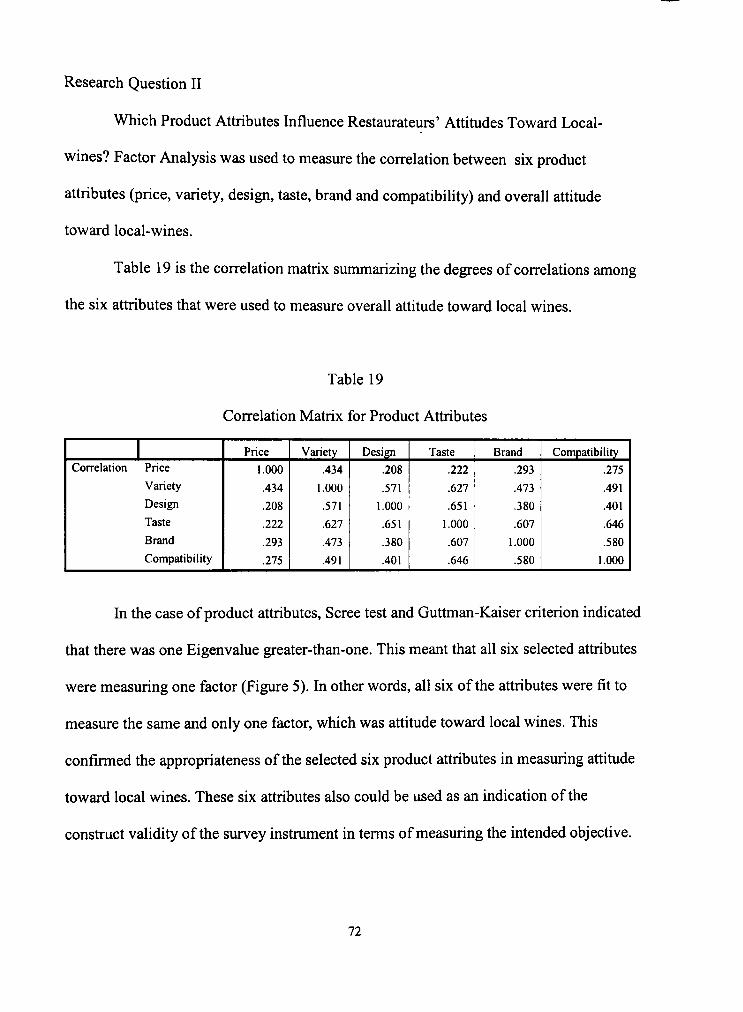
Research Question II
Which Product Attiibutes Influence Restaurateurs' Attitudes Toward Local-
wines? Factor Analysis was used to measure the correlation between six product
attiibutes (price, variety, design, taste, brand and compatibility) and overall attitude
toward local-wines.
Table 19 is the correlation matrix summarizing the degrees of correlations among
the six attributes that were used to measure overall attitude toward local wines.
Table 19
Correlation Matrix for Product Attributes
1 Correlation Price
Variety
Design
Taste
Brand
Compatibility
Price
1.000
.434
.208
.222
.293
.275
Variety
.434
1.000
.571
.627
.473
.491
Design
.208
.571
1.000
.651
.380
.401
Taste
.222
.627
.651
1.000
.607
.646
Brand
.293
.473
.380
.607
1.000
.580
Compatibility
.275
.491
.401
.646
.580
1.000
In the case of product attributes, Scree test and Guttman-Kaiser criterion indicated
that there was one Eigenvalue greater-than-one. This meant that all six selected attributes
were measuring one factor (Figure 5). In other words, all six of the attributes were fit to
measure the same and only one factor, which was attitude toward local wines. This
confirmed the appropriateness of the selected six product attributes in measuring attitude
toward local wines. These six attributes also could be used as an indication of the
constmct validity of the survey instmment in terms of measuring the intended objective.
72

1 2
Factor Number
Figure 5. Scree Plot Test for Product Attributes
Table 20 summarizes the factor loading scores indicating the correlations between
six product attributes and attitude toward local-wines.
Table 20
Factor Loadings Matrix for Product Attributes
Taste
Design
Brand
Compatibility
Variety
Price
Factor
1
.918
.716
.708
.698
.696
.344
Extraction Method: Maximum Likelihood, a 1 factor extracted. 4 iterations required.
73

Although all six attributes measured were substantially related to attitude toward
local-wines since all of them except price were above 60%, taste, design and brand were
most closely related to attitude toward local-wines with factor scores .918, .716, and .708,
respectively.
Table 21, communalities table, summarizes the square scores of the factor
loadings to indicate the amount of variance explained by each attribute in relation to
attitude toward local-wines. For example, 84.3% of variance in taste was explained by
attitude toward local wines, which was followed by 51.2% for design and 50.3% for
brand.
Table 21
Communalities for Product Attributes
Price
Variety
Design
Taste
Brand
Compatibility
Extraction
.119
.484
.512
.843
.501
.487
Extraction Method: Maximum Likelihood.
Table 22 is the summary of how much of the total variance of the data can be
explained by the factor, attitude toward local-wines. The attitude toward local wines
explained 49%) of the total variance in the data.
74
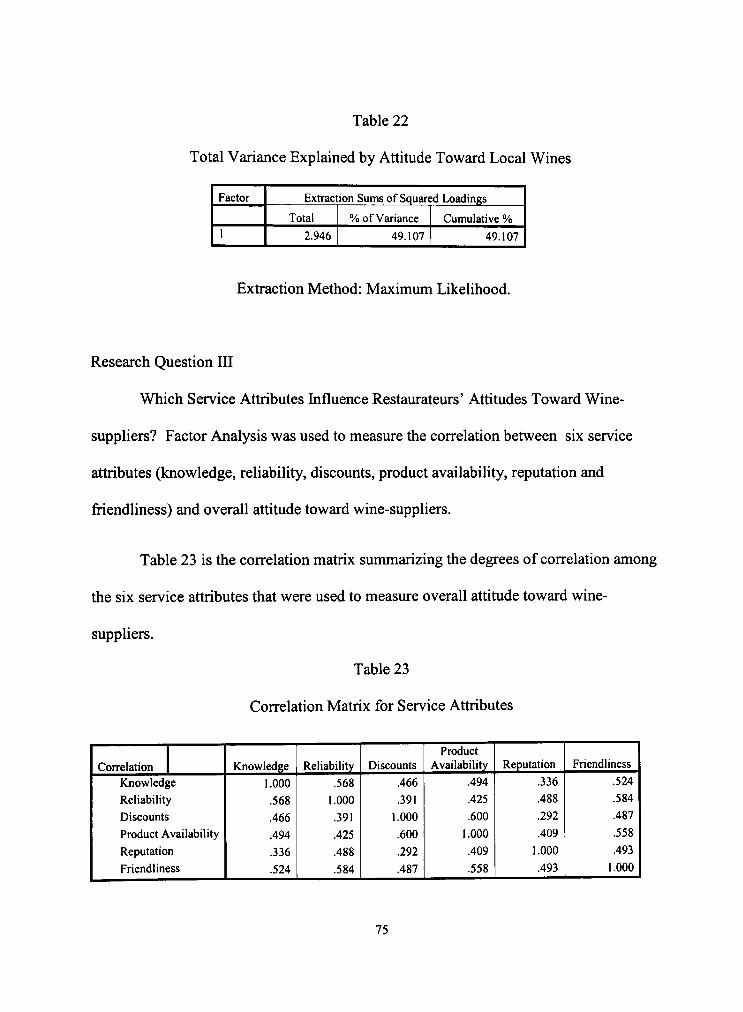
Table 22
Total Variance Explained by Attitude Toward Local Wines
Factor
1
Exttaction Sums of Squared Loadings
Total
2.946
% of Variance
49.107
Cumulative %
49.107
Extraction Method: Maximum Likelihood.
Research Question III
Which Service Attributes Influence Restaurateurs' Attitudes Toward Wine-
suppliers? Factor Analysis was used to measure the correlation between six service
attributes (knowledge, reliability, discounts, product availability, reputation and
fiiendliness) and overall attitude toward wine-suppliers.
Table 23 is the correlation matrix summarizing the degrees of correlation among
the six service attributes that were used to measure overall attitude toward wine-
suppliers.
Table 23
Correlation Matrix for Service Attributes
Correlation Knowledge
Reliability
Discounts
Product Availability
Reputation
Friendliness
Knowledge
1.000
.568
.466
.494
.336
.524
Reliability
.568
1.000
.391
.425
.488
.584
Discounts
.466
.391
1.000
.600
.292
.487
Product Availability
.494
.425
.600
1.000
.409
.558
Reputation
.336
.488
.292
.409
1.000
.493
Friendliness
.524
.584
.487
.558
.493
1.000
75

In the case of service attributes. Scree test and Guttman-Kaiser criterion indicated
that there was one Eigenvalue greater-than-one. This meant that all six selected attributes
were measuring one factor (Figure 6). hi other words, all six of the attributes were fit to
measure the same and only one factor, which was attitude toward wine suppliers. This
confirmed tiie appropriateness of the selected six service attributes in measuring attitude
toward wine suppliers. These six attributes could also be used as an indication of the
constioict validity of the survey instrument in terms of measuring the intended objective.
Figure 6. Scree Plot Test for Service Attributes
Table 24 summarizes the factor loading scores indicating the correlations between
six service attributes and attitude toward wine-suppliers.
76

Table 24
Factor Loadings Matrix for Service Attributes
Friendliness
Product availability
Reliability
Reputation
Knowledge
Discounts
Factor
1
.819
.768
.737
.704
.677
.671
Extraction Method: Maximum Likelihood, a 1 factor extracted. 4 iterations required.
Altiiough all six attributes measured were substantially related to the attitude
toward wine-suppliers since all of them were above 60%, fiiendliness, product
availability and reliability were most closely related to the attitude toward wine-suppliers
with factor scores .819, .768, and .737, respectively.
Table 25, communalities table, summarizes the square scores of the factor scores
to indicate the amount of variance explained by each attribute in relation to attitude
toward wine-suppliers. For example, 67% of variance in fiiendliness was explained by
attitude toward wine suppliers, which was followed by 59.1% for product availability and
54.4% rehability.
77

Table 25
Communalities for Service Attributes
Knowledge
Reputation
Discounts
Reliability
Product availability
Friendliness
Extraction
.459
.496
.450
.544
.591
.670
Exfraction Method: Maximum Likelihood.
Table 26 is the summary of how much of the total variance of the data can be
explained by the factor, attitude toward wine-suppliers. The attitude toward wine-
suppliers explained 53% of the total variance in the data.
Table 26
Total Variance Explained by Attitude Toward Wine Suppliers
Factor
1
Extraction Sums of Squared Loadings
Total
3.209
% of Variance
53.479
Cumulative %
53.479
Extraction Method: Maximum Likelihood.
Research Question FV
Does the attitude toward local wines have any effect on the actual amount of local
wines purchased? To answer this question, a linear regression model was used to predict
the amount of local wines purchased from attitude toward local wines factor scores. For
this analysis, the difference between telephone and mail survey was controlled. Table 27
78

indicates the mean and standard deviation scores for the amount of local wines
purchased, the difference between telephone and mail survey and product attitude scores
(attitude toward local-wines scores).
Table 27
Descriptive Statistics for Amount of Local Wines, Telephone and Mail Survey Difference, and Product Attitude Scores
Local wines
Product attribute scores
Mean
16.8531
.61
25.7622
Std. Deviation
29.05894
.490
50.16774
N
143
143
143
Table 28 is the correlation table summarizing the degrees of correlations among
the three variables that were used to measure the relationship between attitudes toward
local-wines (independent variable) and amount of local wines purchased (dependent
variable).
Table 28
Correlations among the three variables to predict the amount of local wines purchased (dependent variable) from attitudes toward local wines (independent variable)
Pearson Correlation
Sig. (1-tailed)
N
Local wines
Product attribute scores
Local wines
Product attribute scores
Local wines
Product attribute scores
Local wines
1.000
.006
.298
.470
.000
143
143
143
.006
1.000
.322
.470
.000
143
143
143
Product attribute scores
.298
.322
1.000
.000
.000
143
143
143
79
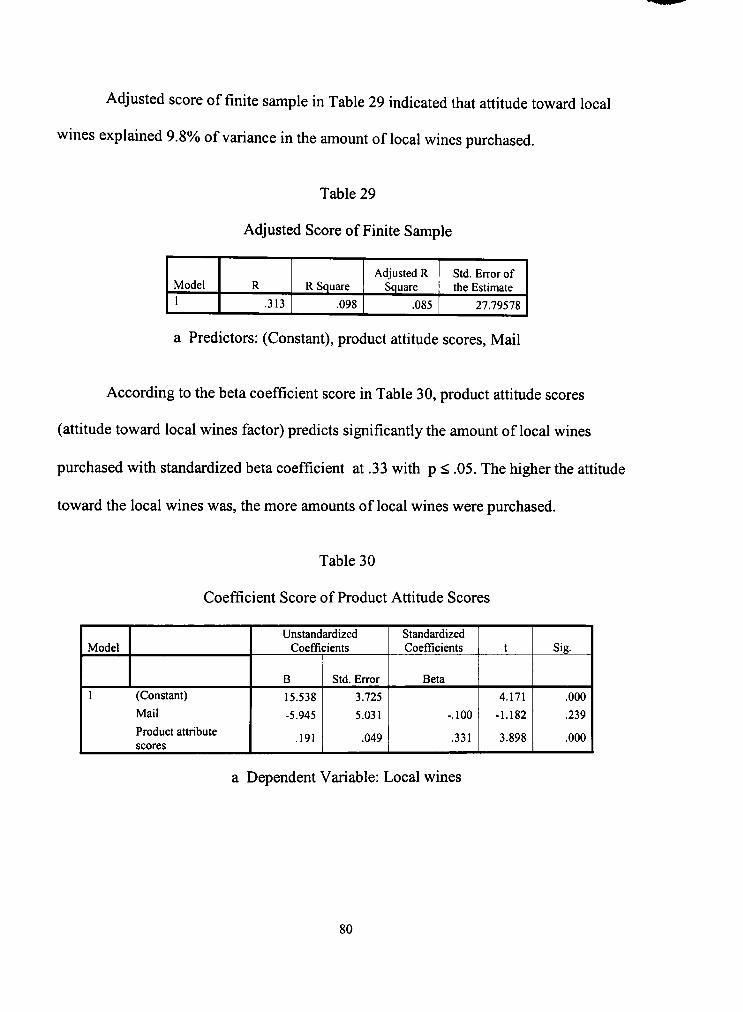
Adjusted score of finite sample in Table 29 indicated that attitude toward local
wines explained 9.8% of variance in the amount of local wines purchased.
Table 29
Adjusted Score of Finite Sample
Model 1 .313
RSqu
.098
Adjusted R Square
.085
Std. Error of the Estimate
27.79578
a Predictors: (Constant), product attitude scores. Mail
According to the beta coefficient score in Table 30, product attitude scores
(attitude toward local wines factor) predicts significantly the amount of local wines
purchased with standardized beta coefficient at .33 with p < .05. The higher the attitude
toward the local wines was, the more amounts of local wines were purchased.
Table 30
Coefficient Score of Product Attitude Scores
Model
1 (Constant)
Product attribute scores
Unstandardized Coefficients
B
15.538
-5.945
.191
Std. Error
3.725
5.031
.049
Standardized Coefficients
Beta
-.100
.331
t
4.171
-1.182
3.898
Sig.
.000
.239
.000
a Dependent Variable: Local wines
80
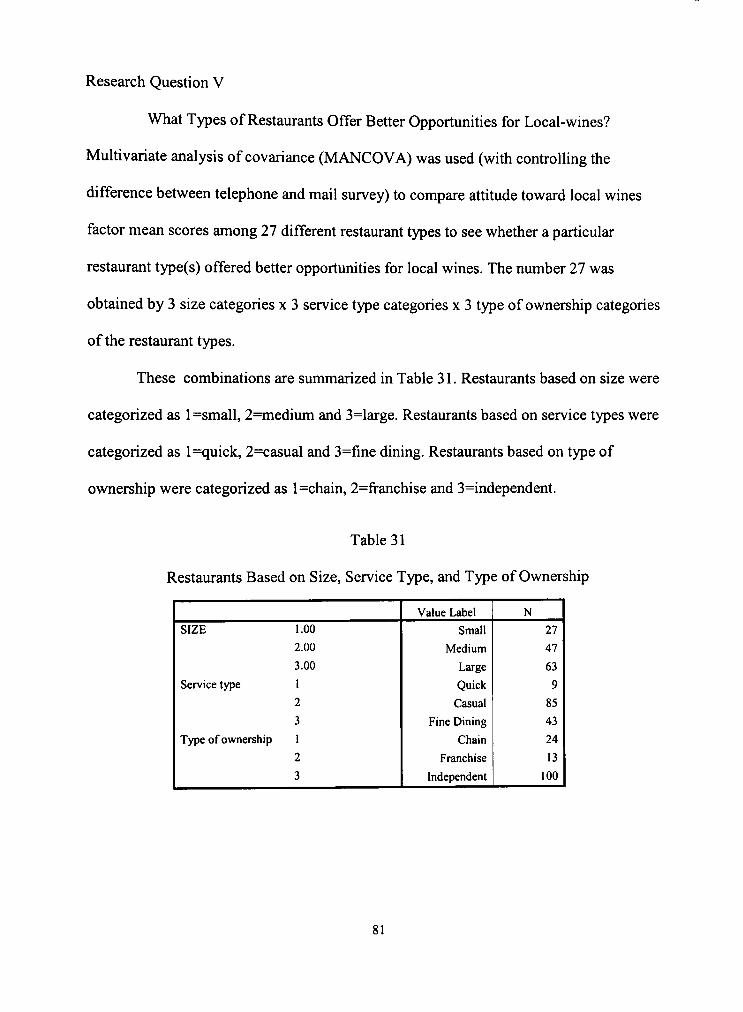
Research Question V
What Types of Restaurants Offer Better Opportunities for Local-wines?
Multivariate analysis of covariance (MANCOVA) was used (with controlling the
difference between telephone and mail survey) to compare attitude toward local wines
factor mean scores among 27 different restaurant types to see whether a particular
restaurant type(s) offered better opportunities for local wines. The number 27 was
obtained by 3 size categories x 3 service type categories x 3 type of ownership categories
of the restaurant types.
These combinations are summarized in Table 31. Restaurants based on size were
categorized as l=small, 2=medium and 3=large. Restaurants based on service types were
categorized as l=quick, 2=casual and 3=fine dining. Restaurants based on type of
ownership were categorized as l=chain, 2=franchise and 3=independent.
Table 31
Restaurants Based on Size, Service Type, and Type of Ownership
SIZE
Service type
Type of ownership
1.00
2.00
3.00
1
2
3
1
2
3
Value Label
Small
Medium
Large
Quick
Casual
Fine Dining
Chain
Franchise
Independent
N
27
47
63
9
85
43
24
13
100
81
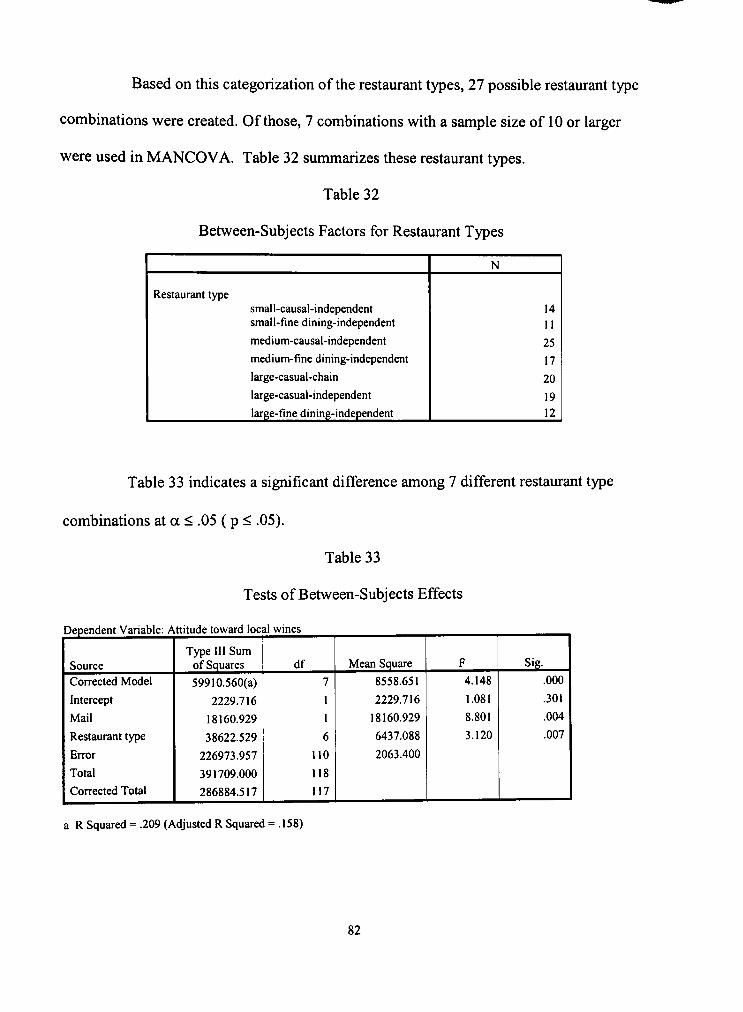
Based on this categorization of the restaurant types, 27 possible restaurant type
combinations were created. Of those, 7 combinations with a sample size of 10 or larger
were used in MANCOVA. Table 32 summarizes these restaurant types.
Table 32
Between-Subjects Factors for Restaurant Types
Restaurant type smal 1-causal-independent small-fine dining-independent
medium-causal-independent
medium-fine dining-independent
large-casual-chain
large-casual-independent
large-fine dining-independent
N
14 11
25
17
20
19 12
Table 33 indicates a significant difference among 7 different restaurant type
combinations at a < .05 (p < .05).
Table 33
Tests of Between-Subjects Effects
Dependent Variable: Attitude toward loc
Source Corrected Model
Intercept
Restaurant type
Error
Total
Corrected Total
Type III Sum of Squares
59910.560(a)
2229.716
18160.929
38622.529
226973.957
391709.000
286884.517
il wines
df
7
1
1
6
110
118
117
Mean Square
8558.651
2229.716
18160.929
6437.088
2063.400
F
4.148
1.081
8.801
3.120
Sig.
.000
.301
.004
.007
a R Squared = .209 (Adjusted R Squared = .158)
82
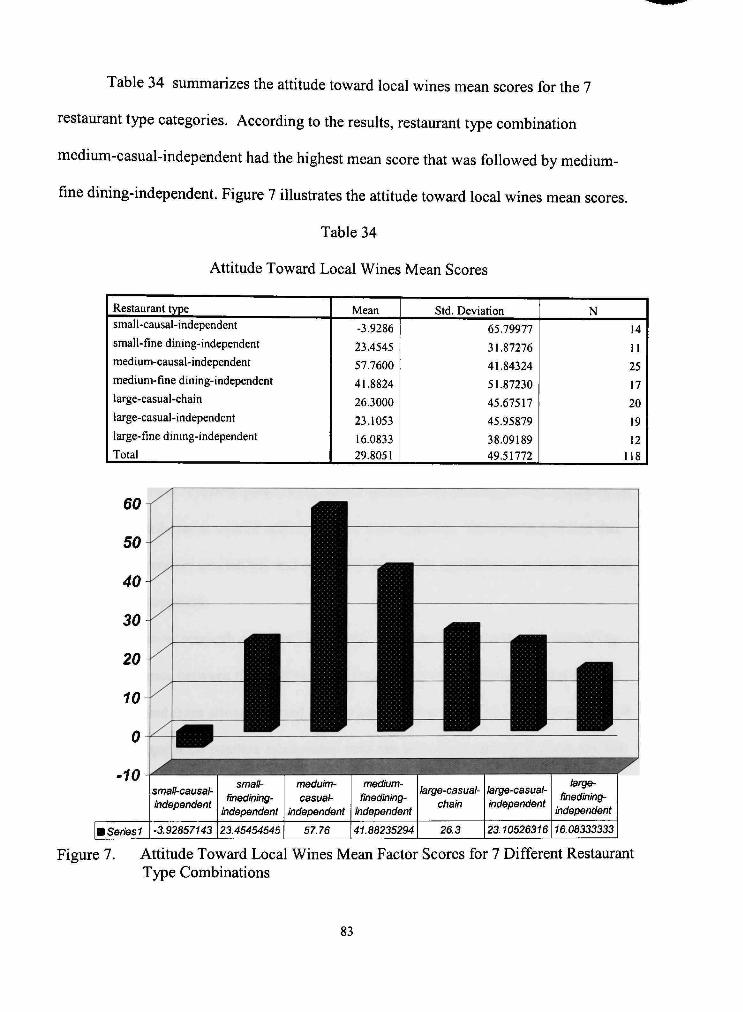
Table 34 summarizes the attitude toward local wines mean scores for the 7
restaurant type categories. According to the results, restaurant type combination
medium-casual-independent had the highest mean score that was followed by medium-
fine dining-independent. Figure 7 illustrates the attitude toward local wines mean scores.
Table 34
Attitude Toward Local Wines Mean Scores
Restaurant type small-causal-independent
small-fine dining-independent
medium-causal-independent
medium-fine dining-independent
large-casual-chain
large-casual-independent
large-fine dining-independent
Total
Mean
-3.9286
23.4545
57.7600
41.8824
26.3000
23.1053
16.0833 29.8051
Std. Deviation
65.79977
31.87276
41.84324
51.87230
45.67517
45.95879
38.09189 49.51772
N
14
11
25
17
20
19
12 118
small-causal-independent
Seriesi -3.92857143 23.45454545
small-finedining-
independent
meduim-casual-
independent
57.76
medium-finedining-
independent
41.88235294
large-casual-chain
26.3
large-casual-independent
finedining-independent
23.10526316 16.08333333
Figure 7. Attitude Toward Local Wines Mean Factor Scores for 7 Different Restaurant Type Combinations
83
Summary of Findings
Multi-attribute analysis of attitudes toward all three categories, wine training,
local wines and wine suppliers were positive. Attitude toward wine suppliers was the
sfrongest positive attitude that was followed by wine training and local wines.
To answer research question I, factor analysis was performed that compared all
six fraining attributes to overall attitude toward wine training. The results indicated that
location, flexibility, and outcome attributes were most significantly related to attitude
toward wine fraining.
To answer research question II, factor analysis was performed that compared all
six product attributes to overall attitude toward local wines. The results revealed that
taste, design and brand were most significantly related to attitude toward local wines.
To answer research question III, factor analysis was performed that compared all
six service attributes to overall attitude toward wine suppliers. The results revealed that
fiiendliness, product availability and reliability were most significantly related to attitude
toward wine suppliers.
To answer research question IV, a linear regression model was used controlling
for the difference between the telephone and mail survey to predict the amount of local
wines purchased from attitude toward local wines factor scores. The results revealed that
there was a significant positive relationship between attitude toward local wines and the
amount of local wines purchased.
To answer research question V, multivariate analysis of covariance was used
controlling for the difference between the telephone and mail survey to compare attitude
84
toward local wine scores among 27 different restaurant types to see whether a particular
restaurant type(s) offered better opportunities for local wines. The results of this analysis
revealed that medium-casual-independent and medium-fine dining-independent
restaurant type categories offered the most significant opportunities for local wineries to
target.
Significant difference was found between the telephone and mail survey scores.
This difference was controlled for in all analyses that utilized mean score comparisons.
However, the reason(s) for this difference was not investigated in the study.
85
CHAPTER V
CONCLUSIONS
Discussion and Implications
The findings of this study need to be interpreted in accordance with the objectives
and the limitations of the study. Considering there was little or no research done that has
investigated restaurateurs attitudes toward local wines, and the issue of a limited response
rate, the study offers a usefiil design for those who wish to conduct similar research in
other newly developing wine growing regions.
The descriptive statistics for the restaurant types indicated that a balanced mix of
restaurants had been surveyed. The only category that seemed underrepresented was the
quick service type restaurants, however this should not be seen as a limitation since quick
service restaurants, as opposed to causal or fine dining restaurants, do not represent a
significant portion of the restaurant types that sell wine. Of all respondents, 75% were
independent restaurateurs in terms of type of ownership. A possible reason for that could
be franchise or chain restaurants are reluctant to give out information about their
purchases if they operate under instmctions from the corporate office. Another reason
could be that the person who makes the wine purchasing decision at a chain or franchise
restaurant may not be the restaurateur. The wine purchasing decision might be made at
the corporate office level, and the questionnaire may not reach to that level. An attempt
was made in the cover letter to encourage people to forward the questionnaire to the
86

person making the wine purchasing decision. However, it is not known how successfiil
this method was.
Another descriptive finding of importance was that majority of the restaurateurs
reported having received some type of wine training, and they also said wine training was
offered once a year or more than once a year at their restaurant. The great majority of the
respondents had some degree of wine service training, and when asked about the
importance of ti-aining for their restaurants, on a scale from 1 to 7, 36.9% responded 7,
very important, with the mean score of 4.75. This finding reinforces the importance of
wine training in restaurants from the restaurateurs' point of view. Food servers can
increase their knowledge of the product, selling skills, and service techniques with wine
instmction that has the support of the management.
Of all the respondents, 52% said less than 25% of their alcohol sales are from
wine sales. The finding indicates a room for improvement in wine sales in restaurants.
The wine marketers need to do a better job in getting local wines in restaurants menus.
Texas wines were not in the majority when it came to wine origins. California
wines were the leading wine category. Texas wines, however, were in the second major
category of wines purchased by restaurants, although percentage wise, it was
significantly lower than Califomia wines. Texas Wine Research Institute (2003) indicated
that only 5% of all wine sold in Texas is Texas wines. Most of the time, restaurateurs are
reluctant to store less known local wines. Although local wine brands are starting to
appear on restaurant menus, more marketing and promotional efforts are needed from
87
local wine growers if they are to increase the share of local wine brands on restaurant
menus.
As for tiie major suppliers of wine to restaurants, wholesalers were the leading
category according to the results of the study, hi fact, for the significant majority of the
restaurants, tiiey were the only ones used. Only 6.8% of restaurants purchased wine
directly from wineries. Some restaurants may have restrictions on which suppliers they
can purchase wine from. Corporate or city mles may stipulate that they need to purchase
from certain wholesalers only. The support systems and distribution capabilities of the
wholesalers make wholesalers an obvious choice of supplier for restaurants. Many
restaurants prefer buying wine directly from wholesalers as opposed to buying from
wineries. When there is a possibility for local wineries to sell wine directly to restaurants,
and if they choose to pursue this option, they need to establish their own distribution and
support systems to become the direct supplier of wine to restaurants. This may present
another challenge for local wineries.
Attitudes toward all three categories, wine training, local wines and wine
suppliers were positive. Attitude toward wine suppliers was the strongest positive attitude
followed by attitude toward wine training and local wines. The highly positive attitude
toward wine suppliers indicated that the restaurateurs were content with the service levels
of the suppliers. Wine suppliers do much more than just sell wine. Services or support
systems can include wine training, help with menu planning, knowledgeable staff and
advise on increasing wine sales. Wine suppliers should continue to provide these support
systems to strengthen mutually beneficial buyer supplier relationships.
88

Attitudes by restaurateurs towards wine training were also positive. The majority
of the restaurateurs acknowledge the importance of wine training in restaurants to more
effectively sell wine. The positive attitude toward wine training can be an interpretation
of restaurateurs' openness to training as long as training is tailored to the needs of their
employees.
Although attitude toward local wines was the least positive among the three
categories measured, 72%) of the respondents surveyed favored local wines. Local wine
growers do a good job in establishing the image and conveying the quahty characteristics
of local wines to the restaurateurs; however, the fact that Califomia wines are still in the
leading category of origin, indicates that there might be other factors to consider to
increase local wine sales in restaurants.
Even if restaurateurs favor local wines, they may be reluctant to purchase them
for their restaurants if they think that local wines will not sell as well as other wines.
There is a need for increasing the local wine marketing efforts to a larger scale to make
more consumers aware of these wines. After all, a restaurateur has to buy the brands that
are demanded by their customers. Once brand awareness and recognition is achieved,
restaurateurs will be more likely to include local wines on their menus. Positive attitude
toward local wines is an indication of openness of the restaurateurs to local wines,
however, more marketing is needed to introduce a greater number of the population to
locally made wines. This could then result in increased demand and awareness would
prompt restaurateurs to include them on their menus.
89
Although it was statistically confrolled for, the reason for the significant
difference between the telephone and mail survey results was not explained in the study.
The respondents of the telephone survey had significantly less favorable attitude toward
all categories, attitude toward wine ti-aining, local wines and wine suppliers. Any
suggestions for this difference may not go beyond speculation. For example, one
assumption could be that since the respondents who were telephoned were the ones who
had not completed the mail survey in the first place, when they were telephoned and
asked to complete the survey over the phone, they might have already formed a negative
attitude toward this activity since it is usually harder to refiise somebody's request over
the phone than it is through the mail survey. So they could have felt somewhat obliged to
respond to something that they chose not to do in the first place, and this might have
affected their responses in a negative way.
Although all six attributes sfrongly influenced attitude toward wine fraining,
location, flexibility, and outcome attributes were the most important attributes. For
location, many restaurateurs thought that the wine training should take place on premise,
in the actual workplace of the service staff Sending employees away for wine training to
seminars or wine courses outside of the workplace cannot only be costly but maybe
irrelevant because of the possibility that they may not consider the individualized needs
of that restaurant operation. Therefore, a wine training program that takes place on the
premise with hands-on experience that is tailored to the characteristics and the needs of a
particular restaurant operation can be important.
90

Flexibility was another important factor in relation to attitude toward wine
training. Flexibility refers to the schedule of wine training. The hours of training is a
significant component of restaurant fraining since operational hours in terms of the
amount of business volume can show significant fluctuations. This inconsistency would
require a flexible approach, meaning a wine training program that would revolve around
a busy schedule of an employee and consider the operational peak hours.
Finally, outcome in terms of how useful can wine training be in terms of
increasing wine sales in a restaurant. Outcome attribute measured whether a wine training
program could increase wine sales in a restaurant as an intended outcome. This is a
significant issue because restaurateurs are less likely to invest in wine training if they feel
that it is not going to create the intended outcome, which is increasing wine sales through
wine fraining. The food service indusfry is notorious for its high employee turnover rates,
and it is especially difficult to properly train individuals that come and go at an
exceptionally rapid rate. It is not uncommon for a service staff position to be filled
several times in a year. So wine training is especially costly for restaurant managers to
implement due to high employee turnover rates, and if the fraining does not generate the
intended outcome, the necessity of the training program can be in question.
Although all six product attributes measured were strongly related to attitude
toward local wines, taste, design, and brand attributes were the most important attributes.
The taste attribute measured the importance of the a local wine brand to have a pleasant
taste. Taste is a significant factor in wine purchasing decisions. Customers are more
inclined to pay more money if a particular wine brand is known to have superior taste. It
91
IS not surprising that in this study, taste was the most significant factor influencing
consumer attitude toward local wines. There is still a need for Texas wine brands to
continue to participate in domestic and intemational wine competitions and festivals to
increase the consumer awareness of taste for Texas wines.
The design attiibute measured the importance of an attractive bottle and label
design for wine. Design was the second most important attribute associated with attitude
toward local wines. It is important for local wines to have an attractive bottle and label
design. There has been significant improvements in this area due to advances in bottling
technology . Consumers nowadays pay extra attention to aesthetic characteristics that
generate eye appeal. It is an important marketing tool. Many local wineries use
professional designers for their wine labels and bottle designs. Many consumers actually
collect atfractive wine bottles as souvenirs. So local wines may have to consider this
aspect of marketing wine to get the restaurateurs to carry local wines on their wine lists.
The third most significant attribute related to attitudes toward local wines was
brand. Achieving brand recognition is a difficult task, especially for local wine brands
that are less known to the restaurant customers. Many local wine brands are unknown to
some consumers even within the same region where the wines are produced. Due to
budget restrictions, many local wineries utilize local or target marketing that may not
reach out to the potential customers on a broader scale. Therefore, restaurateurs may be
reluctant to carry wine brands that are unknown to their customers. There is a need for
local wineries to increase their brand awareness or recognition through effective
marketing strategies.
92

hiterestingly, price was not as significant compare to other attributes in terms of
its influence on attitude toward local wines. Price in fact was the least important attribute
witii a factor score of .34. This could be because restaurateurs do not consider local wines
as high priced items and are willing to pay a reasonable amount as long as local wines are
well received by customers. After all, for restaurateurs, the question is very simple when
it comes to purchasing wine: will it sell or not? Often restaurateurs are concerned with
price because it determines their selling price and profit margin. However with local
wines, it may not be a significant issue since local wines may not seek higher prices as
tiiey stiive to gain market share, and one way of gaining market share could be through a
low price sfrategy.
Although all six service attributes measured in this study were strongly related to
attitude toward wine suppliers, fiiendliness, product availability and reliability were the
most important attributes. The selection of a supplier is a critical decision for a
restaurant. Friendliness of the sales staff can be an important component of this decision.
The literature on buyer supplier relationship indicates a significant shift from adversarial
to partnership approach between the two parties. Achieving this partnership would
depend on the supplier's opetmess and willingness to help the restaurateurs when the
need arises. Understanding the mutual benefits to be gained from a partnership model and
having a fiiendly sales staff can make a difference for a supplier in terms of how it is
perceived by the buyer, restaurateur.
Product availability was the second most significant attribute regarding attitude
toward wine suppliers. Product availability refers to the notion that a supplier carries a
93

broad line of wine selections at appropriate levels so that any product requested at any
time is available to the restaurateur, hi restaurants, product availability is a major concern
since accurate forecasting of business volume is not always possible. Business volume
depends on many outside factors that are beyond the restaurateur's control such as major
events, climate, weekdays or weekends and holidays. These are a few examples of
business volume fluctuations necessitating the availability of products at any given time.
A restaurant cannot afford to wait for products to be delivered at extended intervals.
Delayed or late deliveries as a result of products being unavailable at the time of the
product request can make the difference between a profit and loss. Product availability is
a major concern for restaurants.
The reliability attribute was the third most significant in relation to attitude toward
wine suppliers. Reliability refers to the ability of a supplier to deliver products in a
prompt and accurate manner, therefore it relates to how dependable a supplier is. For the
characteristics of the restaurant business described above, reliability of the deliveries
also can be a significant issue.
Although the literature on buyer supplier research mentions supplier's reputation
as being a significant component of making a supplier selection, reputation did not seem
to matter as much as other attributes in this study. This could be attributed to the fact that
many restaurants in particular cities or regions purchase wine from one source, usually a
large wholesaler. A large wholesaler may in fact be the only supplier in a particular
region. Reputation may already have been built, and restaurateurs may not have many
94

choices to compare among several potential suppliers and, so they simply go with the
most reputable one.
Another interesting finding was the discount attribute. It also did not seem to
matter as much as other attributes whether a supplier offered a discount on bulk
purchases of wine. In fact the discount attribute was the least significant attribute in
relation to attitude toward wine suppliers. Many restaurants do not have the adequate
means to purchase wine in large quantities and store them in storage areas. Wine storage
requires particular conditions, like wine cellar conditions, which may not be feasible to
implement in many restaurants.
Overall attitude toward local wines had a significant influence on the amount of
local wines purchased. The more positive the attitude toward local wines was, the greater
the amount of local wines purchased, indicating a positive relationship between the two
factors. This finding reinforced the underlying assumption of Fishbein and Ajzen (1975)
multi-attribute model, which implied that the more favorable the attitude of a person is
toward a particular object, the more likely that person is to engage in a behavior relating
to that object. This finding also reinforces the importance of marketing attempts to
influence consumers attitudes toward local wines. The more we know about consumers
attitudes toward local wines, the more we can do about influencing or shaping them in
intended directions.
Knowing that attitudes made a difference in the actual amounts of local wines
purchased, another attempt was made to explore which types of restaurants offered better
opportunities for local wines based on the restaurateurs' attitudes toward local wines.
95
Out of 27 possible restaurant type combinations investigated, the operators of medium-
casual-independent types of restaurants had the highest attitude toward local wines
therefore offering the most significant opportunity for local wineries to target. The
second most significant restaurant category was medium-fine dining-independent.
Both restaurant types are medium in size category, between 70 and 140 seating
capacities. The service types were casual and fine dining. Perhaps the clientele for casual
restaurants are more likely to be wine enthusiasts rather than connoisseurs and may be
willing to try new wines. This would explain the high positive attitude toward local
wines. The clientele for fine dining restaurants may include connoisseurs who can have
particular preferences about wine, therefore they are less likely to offer significant sales
opportunities for unknown local wines.
In either case, independent restaurants offered much more significant
opportunities for local wines than franchise or chain restaurants. This may be attributed to
the fact that the majority of the franchise or chain restaurants do not get to make their
own wine purchasing decisions. This decision usually is made at the corporate level, and
in some cases, the restaurateurs are instmcted to stay within the limitations set by the
upper management when it comes to purchasing wine. They may only purchase the types
of wines determined by the upper management, and usually these wines do not include
local wines. They are more likely to be wines from nationally or internationally known
regions, with established brand recognitions. Independent restaurants usually do not have
such restiictions. Which would explain the better opportunities offered by these
restaurants.
96

Summary and Conclusions
Based on the results of the study, it was concluded that restaurateurs had a
positive attitude toward wine training, local wines and wine suppliers. All attribute
categories: training, product and service, had a strong influence on attitude although three
main attributes emerged from each category as being the strongest determinants of
attitude toward wine ti-aining, local wines and wine suppliers.
The effect of attitude toward local wines was significant in its relation to the
amount of local wines purchased. The results indicated that an increase in overall attitude
toward local wines resulted an increase in the amount of local wine purchases. It should
also be noted that the data for this research were collected in late 2002. With the changes
in the recent economic conditions and perceptions towards local products in terms of
consumers' increased acceptance and willingness to purchase products that are made in
the United States, the results of this study could indicate a change in attitudes if the data
were collected in 2003.
Investigation of the restaurant types offering better opportunities for local wines
resulted in medium-casual-independent and medium-fine dining-independent restaurant
type categories with the most significant opportunities for local wines.
Based on the overall results of the study, it was concluded that attitudes had a
significant impact on local wine purchases. The investigation of these attitudes revealed
that some attributes were more important than others, and some restaurant types offered
better opportunities for local wines than others.
97
Recommendations for Further Research
It is recommended that this study be replicated in other new wine growing regions
of the country. Perhaps different regions would reveal different factors that could be
helpful in the investigating the marketing of local wine products to restaurants.
This study investigated the attitudes and the determinants of attitudes. Further
research is needed that will take attitude determination a step fiirther and predict behavior
from attitude so that we can better understand the purchasing behavior of restaurateurs by
linking the two concepts together. This study made no attempt to predict the likelihood of
local wine purchases from attitude.
More attributes may have to be determined and tested to better understand the
attitudes toward wine. There may be other factors than the ones determined in this study
that could have a potential influence on attitude toward local wines.
The response rate and the sample size for the fiiture research need to be increased.
Instead of mail surveys, other means of collecting the data may need to be implemented.
This might include face-to-face and telephone interviews as well as emails. Also,
incentives need to be implemented in fiiture research to increase the response rate.
Although this approach might be costly, it may have a valuable effect on improving the
generahzation of the study.
98
LIST OF REFERENCES
Ashford, S.J. (1996) Productivity during organizational entry: The role of desire for control. Joumal of Applied Psychology 81.199-214.
Baldauf, A., Reisinger, H., & Moncrief, W. C. (1999). Examining motivations to refiise in industiial mail surveys. Joumal of the Market Research Society, 41, 345-353.
Barsky, J.D. (1992). Customer satisfaction in the hotel industry: Meaning and measuremem. Hospitality Research Joumal. 16 (1). 51-73.
Biehal, G., Stephens, D., & Curio, E. (1992). Attitude toward the ad and brand choice. Journal of Advertising, 21. 19-39.
Campbell, A. (1997) Buyer-supplier relationships: flip sides of the same coin? Joumal of Business and Industrial Marketing, 12 (6), 417-434.
Coltinan, M.M. (1990). Hospitality Industry Purchasing. New York: Van Nostrand Reinhold.
Cookson, P.S. (1998) Program planning for the training and continuing education of adults. Malabar, FL: Kriger Publishing Company.
Corell, J. (1992, November). Evaluating distributors and brands. Pizza Today, 10.18.
Dodd, T. H. (1997). Techniques to increase impulse wine purchases in a restaurant setting. Journal of Restaurant & Foodservice Marketing, 2(1). 63-73.
Dodd, T.H., & Gustafson, A.W. (1997). Product, environmental, and service attributes that influence consumer attitudes and purchases at wineries. Joumal of Food Products Marketing. 4(3), 41-59.
Dronkers, D.J. (1995). Dialogue builds profitable partnerships. World's Eye View on Hospitality Trends. 9.16-17.
Fishbein, M., & Ajzen, I. (1975). Belief, attitude, intention, and behavior: an infroduction to theory and research. Reading, MA: Addison-Wesley.
Gatignon, H. & Robertson, T. S. (1985). A prepositional inventory for new diffiision research. Joumal of Consumer Research, 11, 849-867.
Goldenkoff, R. (1996) Rethinking career resihence. Government Executive. 28(10). 72.
99
Granucci, P.R. (1989) A quasi-experimental study in wine instmction. PubUshed Dissertation, Texas Tech University.
Green, Paul E., Donald S. Tull, and Gerald Albaum (1990), Research for Marketing Decisions (5th edition). Englewood Cliffs, NJ: Prentice-Hall.
Greer, T. V., Chuchinprakam, R., & Seshadri, S. (2000). Likelihood of participating in mail survey research: Business respondents' perspectives. Industrial Marketing Management. 29. 97-109.
Griffin, R. W. (1990) Management. Boston, MA: Houghton Mifflin.
Houle, CO. (1972) The Design of Education. San Francisco: Jossey-Bass Publishers.
Kennedy, J. M., & Vargus, B. (2001). Challenges in survey research and their implications for philanthropic studies research. Nonprofit and Voluntary Sector Ouarteriv. 30.483-494.
Keown, C. & Casey, M. (1995) Purchasing behavior in the Northern freland wine market. British Food Joumal. 97. 17-20.
Kolpan, S., Smith, B.H., & Weiss, M.A. (2002). Exploring Wine.. New York: John Wiley & Sons Inc.
Kotschevar, L.H. & Donnelly, R. (1999) Quantity food purchasing. Upper Saddle River, NJ: Prentice Hall.
Kotschevar, L.H. & Tanke, M.L. (1991) Managing bar and beverage operations. East Lansing, MI: The Educational Institute of the American Hotel and Motel Association.
Larson, P.D. (1994) Buyer supplier co-operation, product quality and total costs. Intemational Joumal of Physical Distribution and Logistics Management. 24 (6). 4-10.
Macaulay, S. & Harding, N. (1996) Drawing up a new careers contract. Personnel Management. 2(7). 34-35.
Marr, N. E. (1994) Do managers really know what service their customers require? . Intemational Joumal of Physical Distribution and Logistics Management. 24(4). 24-31.
McCarthy, E. (2002). New wine culture enhanced by exposure to local vineyards may boost consumption. Nation's Restaurant News. 27,(23), 85-90.
100

Quayle, M. (1995, January) Changing a supplier: How do they do that? Purchasing and Supply Management, 26-30.
Reid, R. D., & Riegel, C.R. (1989). Supplier relations and selection in the foodservice industry. Hospitality Education and Research Joumal, 13, 51-62.
Reizenstein, R.C. & Bamaby, D.J. (1980) Assessing consumer and retailer perception of table wine and wine store attributes. Advances in Consumer Research, 7, 95-100.
Salkin, S. (1991) The operator/distributor relationship: Friends or Foes? Restaurant Business, 90(11). 106-113.
Smith, D. C. & Owens, J.P. (1995) Knowledge of customers' customers as a basis for sales force differentiation. Joumal of Personal Selling & Sales Management. 11(3), 15-21.
Sondra, J. D. (2001) Restaurant Service Basics. New York: John Wiley & Sons, Inc.
Sfrauss, K. (1999). Panelists agree: tmst is the key to buyer-supplier relationships. Nation's Restaurant News. 33(24). 94-116
Zaccarelli, H.E., & Hayes, D. (1994, September/October). The bottom line: Increase profits by making your supplier your partner. Cooking for Profit, 468, 17.
Zaichkowsky, J. L. (1988). Involvement and the price cue. Advances in Consumer Research, 15, 323-327
101

APPENDDC A
PERCENTAGE PIE CHARTS
102
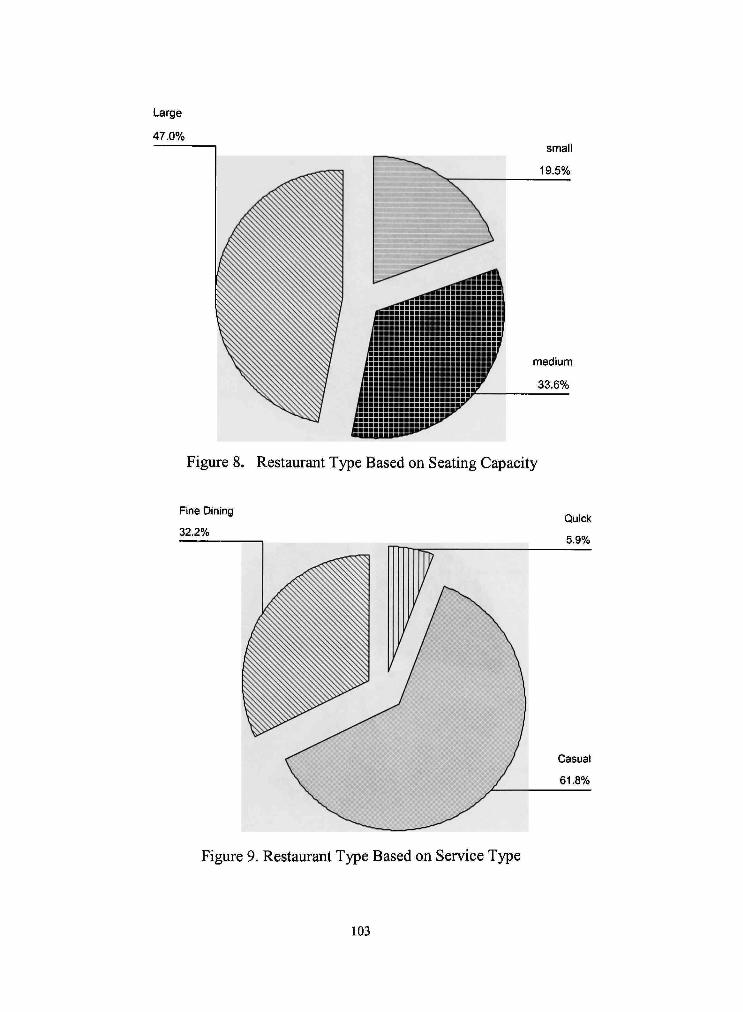
( ^
Figure 8. Restaurant Type Based on Seating Capacity
Fine Dining
32.2%
Figure 9. Restaurant Type Based on Service Type
103

Independent
75.0%
Figure 10. Restaurant Type Based on Type of Ownership
other
24.5% American
27.2%
Figure 11. Restaurant Type Based on Main Menu Concept
104
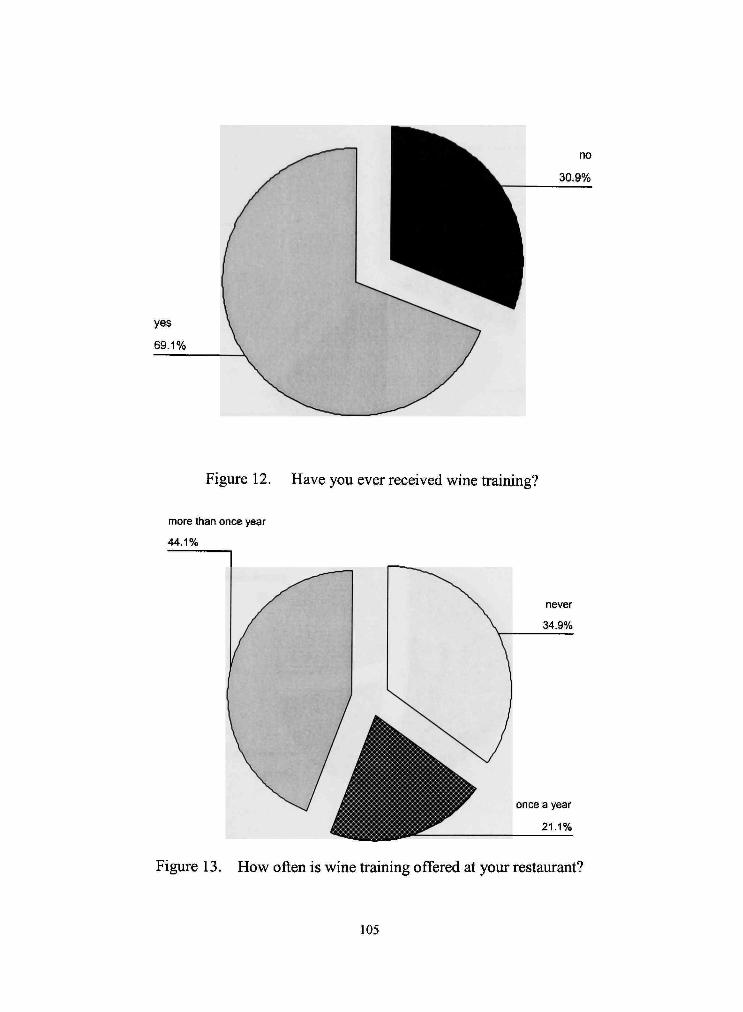
no
30.9%
Figure 12. Have you ever received wine training?
more than once year
44.1%
never
34.9%
Figure 13. How often is wine training offered at your restaurant?
105

Figure 14. How important is wine training for your restaurant? Not important 1 2 3 4 5 6 7 Very important
50 percent or more
27.7%
0 to 25 percent
52.0%
Figure 15. Wine sales percentage in total alcohol sales
106

more than 50 percent
14.5%
25 to 50 percent
7.2%
less than 25 percent
78.3%
Figure 16. Percentage of Texas wines purchased
California
61.5%
France
6.8%
Figure 17. Major origins of wine purchases
107
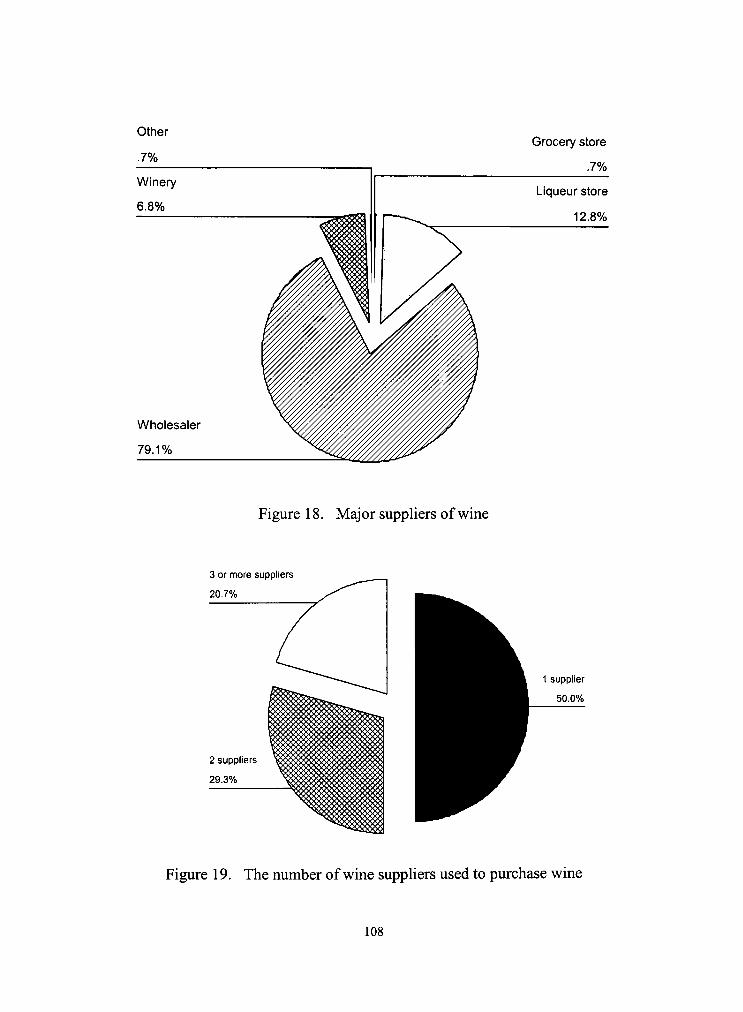
Wholesaler
79.1%
Grocery store
J%
Liqueur store
12.8%
Figure 18. Major suppliers of wine
3 or more suppliers
20.7%
1 supplier
50.0%
Figure 19. The number of wine suppliers used to purchase wine
108

very satisfied
33.3% not satisfied
14,0%
Figure 20. How satisfied are you with current wine supplier?
highly favored
29.5% highly disfavored
2.2%
Figure 21. Attitude Toward Wine Training
109

highly favored
19.9%
highly disfavored
2.7%
Figure 22. Attitude Toward Local Wines
highly favored
35.4%
highly disfavored
4.8%
Figure 23. Attitude Toward Wine Suppliers
110

APPENDDC B
DIFFERENCE BETWEEN TELEPHONE AND MAIL SURVEY TABLES
111

Table 35 Significance Scores for Training Attributes "Likelihood"-MANOVA
Difference Between Telephone and Mail Survey
Source Dependent Variable
Corrected Model LTSUPPLI
LTPAID
LTINCREA
LTFLEXIB
LTPREMIS
LTREGULA
Intercept LTSUPPLI
LTPAID
LTINCREA
LTFLEXIB
LTPREMIS
LTREGULA
MAIL LTSUPPLI
LTPAID
LTINCREA
LTFLEXIB
LTPREMIS
LTREGULA
Error LTSUPPLI
LTPAID
LTINCREA
LTFLEXIB
LTPREMIS
LTREGULA
Total LTSUPPLI
LTPAID
LTINCREA
LTFLEXIB
LTPREMIS
LTREGULA
Corrected Total LTSUPPLI
LTPAID
LTINCREA
LTFLEXIB
LTPREMIS
LTREGULA a R Squared = .082 (Adjusted R Squared = b R Squared = .041 (Adjusted R Squared = c R Squared = . 172 (Adjusted R Squared = d R Squared = .116 (Adjusted R Squared =
Type III Sum of Squares
50.111(a)
31.972(b)
93.071(c)
56.937(d)
60.344(e)
16.332(f)
47.209
9.493
97.127
25.500
88.964
9.008
50.111
31.972
93.071
56.937
60.344
16.332
560.622
757.302
447.866
433.859
454.311
531.112
684.000
793.000
689.000
537.000
643.000
563.000
610.732
789.275
540.937
490.796
514.655 547.444
075) 034) 166)
.110)
df
140
140
140
140
140
140
142
142
142
142
142
142
141
141
141
141
141 141
; R Squared f R Squared =
Mean Square
50.111
31.972
93.071
56.937
60.344
16.332
47.209
9.493
97.127
25.500
88.964
9.008
50.111
31.972
93.071
56.937
60.344
16.332
4.004
5.409
3.199
3.099
3.245
3.794
= .117 (Adjusted = .030 (Adjusted
F
12.514
5.911
29.093
18.373
18.596
4.305
11.789
1.755
30.361
8.229
27.415
2.374
12.514
5.911
29.093
18.373
18.596
4.305
R Squared = R. Squared =
Sig.
.001
.016
.000
.000
.000
.040
.001
.187
.000
.005
.000
.126
.001
.016
.000
.000
.000
.040
.111) 023)
112
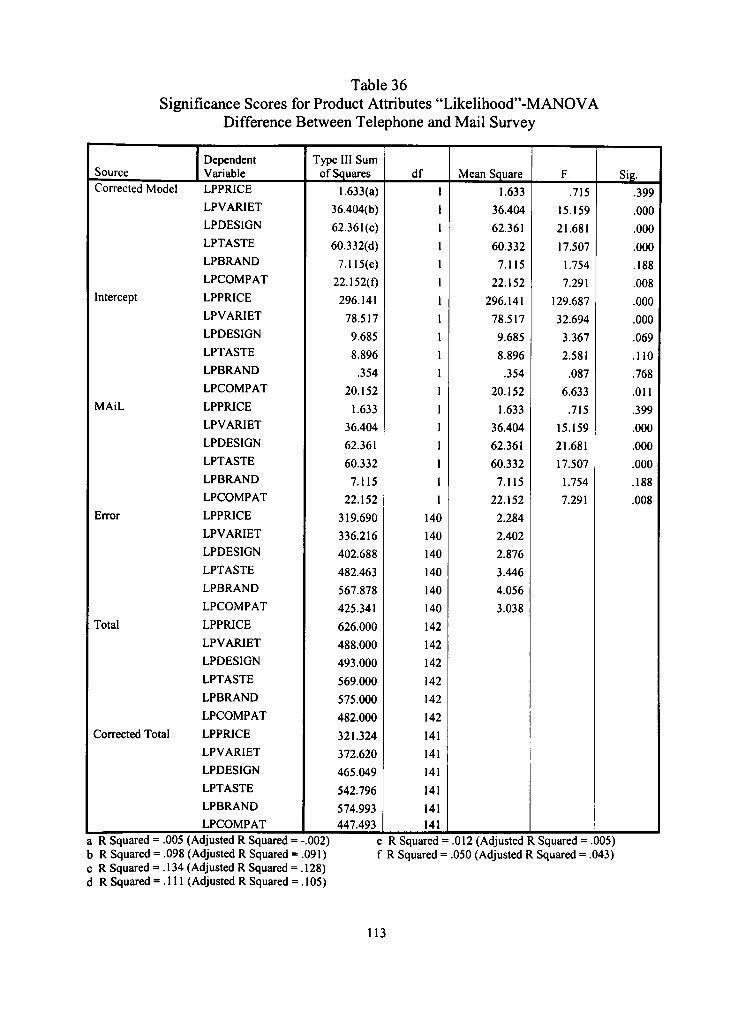
Table 36 Significance Scores for Product Attributes "Likelihood"-MANOVA
Difference Between Telephone and Mail Survey
Source Corrected Model
Intercept
Error
Total
Corrected Total
Dependent Variable LPPRICE
LPVARIET
LPDESIGN
LPTASTE
LPBRAND
LPCOMPAT
LPPRICE
LPVARIET
LPDESIGN
LPTASTE
LPBRAND
LPCOMPAT
LPPRICE
LPVARIET
LPDESIGN
LPTASTE
LPBRAND
LPCOMPAT
LPPRICE
LPVARIET
LPDESIGN
LPTASTE
LPBRAND
LPCOMPAT
LPPRICE
LPVARIET
LPDESIGN
LPTASTE
LPBRAND
LPCOMPAT
LPPRICE
LPVARIET
LPDESIGN
LPTASTE
LPBRAND
LPCOMPAT
Type III Sum of Squares
1.633(a)
36.404(b)
62.361(c)
60.332(d)
7.115(e)
22.152(0
296.141
78.517
9.685
8.896
.354
20.152
1.633
36.404
62.361
60.332
7.115
22.152
319.690
336.216
402.688
482.463
567.878
425.341
626.000
488.000
493.000
569.000
575.000
482.000
321.324
372.620
465.049
542.796
574.993
447.493
df
140
140
140
140
140
140
142
142
142
142
142
142
141
141
141
141
141
141
Mean Square
1.633
36.404
62.361
60.332
7.115
22.152
296.141
78.517
9.685
8.896
.354
20.152
1.633
36.404
62.361
60.332
7.115
22.152
2.284
2.402
2.876
3.446
4.056
3.038
F
.715
15.159
21.681
17.507
1.754
7.291
129.687
32.694
3.367
2.581
.087
6.633
.715
15.159
21.681
17.507
1.754
7.291
Sig.
.399
.000
.000
.000
.188
.008
.000
.000
.069
.110
.768
.011
.399
.000
.000
.000
.188
.008
a R Squared = .005 b R Squared = .098 c R Squared = .134 d R Squared = .111
(Adjusted R Squared = -.002) (Adjusted R Squared = .091) (Adjusted R Squared = .128) (Adjusted R Squared = .105)
e R Squared f R Squared
.012 (Adjusted R Squared = .005) .050 (Adjusted R Squared = .043)
113

Table 37 Significance Scores for Service Attributes "Likelihood" -MANOVA
Source Corrected Model
Intercept
Error
Total
Corrected Total
Difference Between Tele Dependent Variable LSKNOWLE
LSPROMPT
LSDISCOU
LSBROAD
LSKNOWN
LSFRIEND
LSKNOWLE
LSPROMPT
LSDISCOU
LSBROAD
LSKNOWN
LSFRIEND
LSKNOWLE
LSPROMPT
LSDISCOU
LSBROAD
LSKNOWN
LSFRIEND
LSKNOWLE
LSPROMPT
LSDISCOU
LSBROAD
LSKNOWN
LSFRIEND
LSKNOWLE
LSPROMPT
LSDISCOU
LSBROAD
LSKNOWN
LSFRIEND
LSKNOWLE
LSPROMPT
LSDISCOU
LSBROAD
LSKNOWN
LSFRIEND
Type III Sum of Squares
79.002(a)
48.299(b)
37.301(c)
103.535(d)
60.330(e)
59.783(0
129.981
164.161
19.646
130.680
191.530
226.818
79.002
48.299
37.301
103.535
60.330
59.783
382.957
349.191
550.947
359.155
257.780
353.844
652.000
616.000
624.000
662.000
575.000
712.000
461.959
397.490
588.248
462.690
318.110
413.628
phone anc
df
143
143
143
143
143
143
145
145
145
145
145
145
144
144
144
144
144
144
Mail Survey
Mean Scjuare
79.002
48.299
37.301
103.535
60.330
59.783
129.981
164.161
19.646
130.680
191.530
226.818
79.002
48.299
37.301
103.535
60.330
59.783
2.678
2.442
3.853
2.512
1.803
2.474
F
29.500
19.779
9.682
41.223
33.468
24.160
48.536
67.227
5.099
52.031
106.249
91.665
29.500
19.779
9.682
41.223
33.468
24.160
Sig.
.000
.000
.002
.000
.000
.000
.000
.000
.025
.000
.000
.000
.000
.000
.002
.000
.000
.000
a R Squared = .171 b R Squared = .122 c R Squared = .063 d R Squared = .224 e R Squared = .190
(Adjusted R Squared = .165) (Adjusted R Squared = .115) (Adjusted R Squared = .057) (Adjusted R Squared = .218) (Adjusted R Squared = . 184)
f R Squared = .145 (Adjusted R Squared = .139)
114
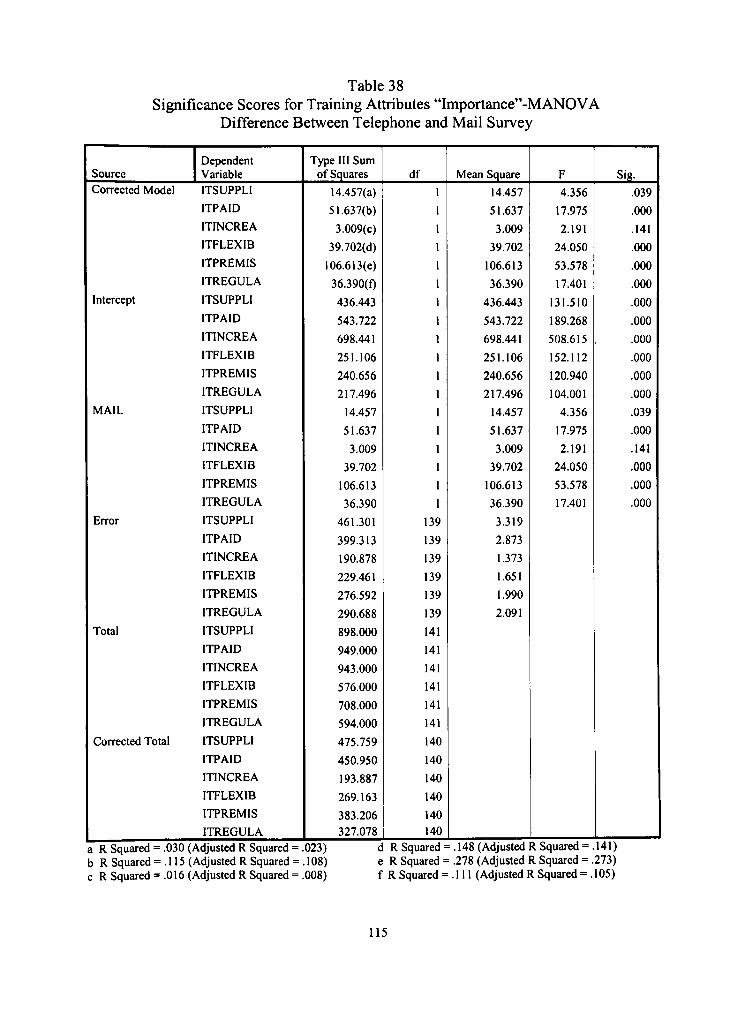
Table 38 Significance Scores for Training Attributes "Importance"-MANOVA
Difference Between Telephone and Mail Survey
Source Corrected Model
Intercept
Error
Total
Corrected Total
Dependent Variable ITSUPPLI
ITPAID
ITINCREA
ITFLEXIB
ITPREMIS
ITREGULA
ITSUPPLI
ITPAID
ITINCREA
ITFLEXIB
ITPREMIS
ITREGULA
ITSUPPLI
ITPAID
ITINCREA
ITFLEXIB
ITPREMIS
ITREGULA
ITSUPPLI
ITPAID
ITINCREA
ITFLEXIB
ITPREMIS
ITREGULA
ITSUPPLI
ITPAID
ITINCREA
ITFLEXIB
ITPREMIS
ITREGULA
ITSUPPLI
ITPAID
ITINCREA
ITFLEXIB
ITPREMIS
ITREGULA a R Squared = .030 (Adjusted R Squared = b R Squared = .115 (Adjusted R Squared = c R Squared = .016 (Adjusted R Squared =
Type III Sum of Squares
14.457(a)
51.637(b)
3.009(c)
39.702(d)
106.613(e)
36.390(0
436.443
543.722
698.441
251.106
240.656
217.496
14.457
51.637
3.009
39.702
106.613
36.390
461.301
399.313
190.878
229.461
276.592
290.688
898.000
949.000
943.000
576.000
708.000
594.000
475.759
450.950
193.887
269.163
383.206
327.078 023) d 108) e 008) f
df
139
139
139
139
139
139
141
141
141
141
141
141
140
140
140
140
140
140 R Squared = R Squared = R Squared =
Mean Square
14.457
51.637
3.009
39.702
106.613
36.390
436.443
543.722
698.441
251.106
240.656
217.496
14.457
51.637
3.009
39.702
106.613
36.390
3.319
2.873
1.373
1.651
1.990
2.091
= .148 (Adjusted .278 (Adjusted .111 (Adjusted I
F
4.356
17.975
2.191
24.050
53.578
17.401
131.510
189.268
508.615
152.112
120.940
104.001
4.356
17.975
2.191
24.050
53.578
17.401
R Squared = . R. Squared = . I Squared = .
Sig.
.039
.000
.141
.000
.000
.000
.000
.000
.000
.000
.000
.000
.039
.000
.141
.000
.000
.000
141) 273) 105)
115

Table 39 Significance Scores for Product Attributes "Importance"-MANOVA
Difference Between Telephone and Mail Survey
Source Corrected Model
Intercept
Error
Total
Corrected Total
Dependent Variable IPPRICE
IPVARIET
IPDESIGN
IPTASTE
IPBRAND
IPCOMPAT
IPPRICE
IPVARIET
IPDESIGN
IPTASTE
IPBRAND
IPCOMPAT
IPPRICE
IPVARIET
IPDESIGN
IPTASTE
IPBRAND
IPCOMPAT
IPPRICE
IPVARIET
IPDESIGN
IPTASTE
IPBRAND
IPCOMPAT
IPPRICE
IPVARIET
IPDESIGN
IPTASTE
IPBRAND
IPCOMPAT
IPPRICE
IPVARIET
IPDESIGN
IPTASTE
IPBRAND
IPCOMPAT
a R Squared = .036 (Adjusted R Squared = . b R Squared = .000 (Adjusted R Squared = c R Squared = .023 (Adjusted R Squared = .
Type III Sum of Squares
6.224(a)
.001(b)
6.050(c)
.068(d)
12.493(e)
19.727(0
745.402
646.440
316.050
878.424
583.890
441.782
6.224
.001
6.050
.068
12.493
19.727
168.817
154.054
251.895
114.322
225.479
180.054
930.000
838.000
614.000
1047.000
814.000
714.000
175.041
154.055
257.945
114.390
237.973
199.781
029) d .007) e 017) f
df
144
144
144
144
144
144
146
146
146
146
146
146
145
145
145
145
145
145
R Squared = R Squared = R Squared =
Mean Square
6.224
.001
6.050
.068
12.493
19.727
745.402
646.440
316.050
878.424
583.890
441.782
6.224
.001
6.050
.068
12.493
19.727
1.172
1.070
1.749
.794
1.566
1.250
.001 (Adjusted 1
.052 (Adjusted I .099 (Adjusted F
F
5.309
.001
3.459
.086
7.979
15.777
635.822
604.253
180.676
1106.461
372.895
353.320
5.309
.001
3.459
.086
7.979
15.777
R. Squared = -I Squared = . I Squared =.(
Sig.
.023
.973
.065
.770
.005
.000
.000
.000
.000
.000
.000
.000
.023
.973
.065
.770
.005
.000
.006) 046) 392)
116

Table 40 Significance Scores for Service Attributes "Importance"-MANOVA
Difference Between Telephone and Mail Survey
Source Corrected Model
Intercept
Error
Total
Corrected Total
Dependent Variable ISKNOWLE
ISPROMPT
ISDISCOU
ISBROAD
ISKNOWN
ISFRIEND
ISKNOWLE
ISPROMPT
ISDISCOU
ISBROAD
ISKNOWN
ISFRIEND
ISKNOWLE
ISPROMPT
ISDISCOU
ISBROAD
ISKNOWN
ISFRIEND
ISKNOWLE
ISPROMPT
ISDISCOU
ISBROAD
ISKNOWN
ISFRIEND
ISKNOWLE
ISPROMPT
ISDISCOU
ISBROAD
ISKNOWN
ISFRIEND
ISKNOWLE
ISPROMPT
ISDISCOU
ISBROAD
ISKNOWN
ISFRIEND a R Squared = .006 (Adjusted R Squared = b R Squared = .005 (Adjusted R Squared = c R Squared = .023 (Adjusted R Squared =
Type 111 Sum of Squares
.385(a)
.295(b)
3.401(c)
33.731(d)
17.593(e)
30.895(0
1004.549
1049.829
841.100
599.429
209.566
618.183
.385
.295
3.401
33.731
17.593
30.895
59.122
57.328
144.414
89.509
369.914
164.646
1112.000
1159.000
1011.000
829.000
640.000
919.000
59.507
57.623
147.815
123.240
387.507
195.541 000) c -.002) e 016) f
df
144
144
144
144
144
144
146
146
146
146
146
146
145
145
145
145
145
145 R Squared = R Squared = R Squared =
Mean Square
.385
.295
3.401
33.731
17.593
30.895
1004.549
1049.829
841.100
599.429
209.566
618.183
.385
.295
3.401
33.731
17.593
30.895
.411
.398
1.003
.622
2.569
1.143
= .274 (Adjusted = .045 (Adjusted = .158 (Adjusted I
F
.937
.741
3.391
54.265
6.849
27.021
2446.712
2637.018
838.689
964.346
81.580
540.665
.937
.741
3.391
54.265
6.849
27.021
R Squared = R Squared = . I Squared = .
Sig.
.335
.391
.068
.000
.010
.000
.000
.000
.000
.000
.000
.000
.335
.391
.068
.000
.010
.000
269) 039) 152)
117

Table 41
Frequency Distribution for the Restaurant Types Difference Between Telephone and Mail Survey
Mail Survey Restaurant size Valid small
medium
large
Total
Missing System
Total
Telep. Survey Restaurant Size Valid small
medium
large
Total
Mail Survey Service type Valid Quick
Casual
Fine
Total
Telep. Survey Service Type Valid Quick
Casual
Fine
Total
Mail Survey Type of Owner. Valid Chain
Franchise
Independt.
Total
Telep. Survey Type of Owner. Valid Chain
Franchise
Independt.
Total
Frequency
26
36
31
93
3
96
Frequency
3
14
39
56
Frequency
5
62
29
96
Frequency
4
32
20
56
Frequency
7
8
81
96
Frequency
17
6
33
56
Percent
27.1
37.5
32.3
96.9
3.1
100.0
Percent
5.4
25.0
69.6
100.0
Percent
5.2
64.6
30.2
100.0
Percent
7.1
57.1
35.7
100.0
Percent
7.3
8.3
84.4
100.0
Percent
30.4
10.7
58.9
100.0
Valid Percent
28.0
38.7
33.3
100.0
Valid Percent
5.4
25.0
69.6
100.0
Valid Percent
5.2
64.6
30.2
100.0
Valid Percent
7.1
57.1
35.7
100.0
Valid Percent
7.3
8.3
84.4
100.0
Valid Percent
30.4
10.7
58.9
100.0
Cumulative Percent
28.0
66.7
100.0
Cumulative Percent
5.4
30.4
100.0
Cumulative Percent
5.2
69.8
100.0
Cumulative Percent
7.1
64.3
100.0
Cumulative Percent
7.3
15.6
100.0
Cumulative Percent
30.4
41.1
100.0
118
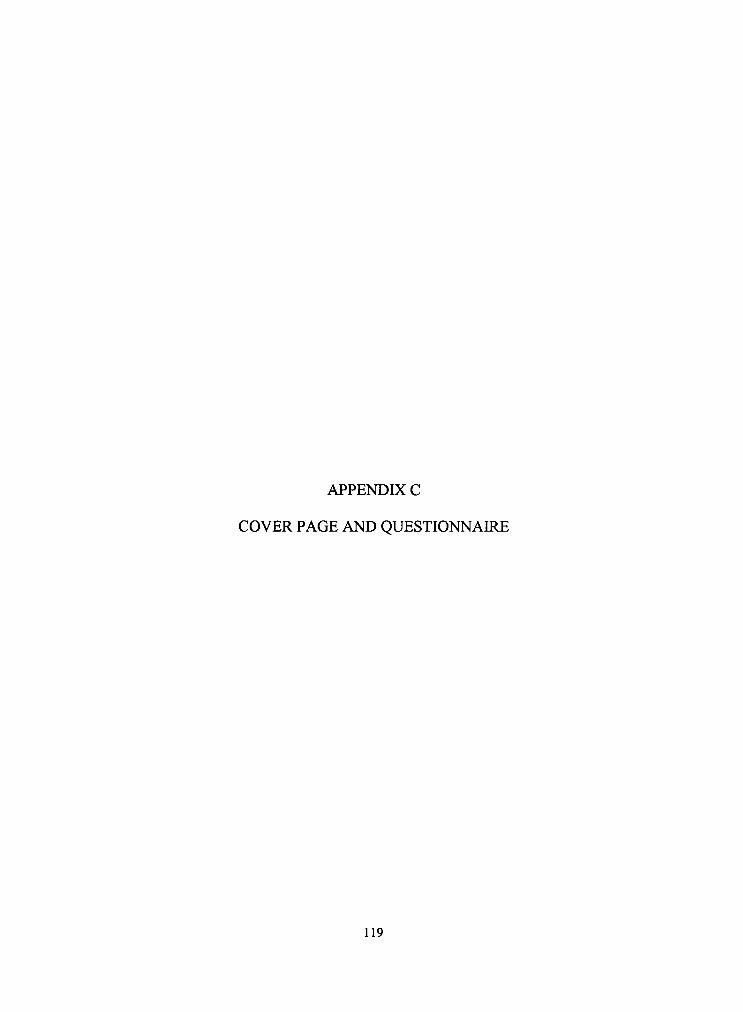
APPENDIX C
COVER PAGE AND QUESTIONNAIRE
119
l O l U - 0 2 1 ( 1 : 2 2 F.A.X 8 0 6 7 4 2 0 1 2 5 TX WINE MRKTG RS © 0 0 2
;;;!:; Texas Wine Marketing Research Institute College of Human Sciences • Texas Tech University
September 25, 2002
Deai Manager
You have been selected lo participate in a survey administered by the Texns Wine Marketing Reseaich Insliluie because we wish to know your opinions about wine purchases. The purpose of the study is to detemune the reasons why restaurateurs purchase wine,
Please take a few niimiles to complete the questionnaire and retiirn it in the enclosed postage-paid envelope if you wish to review the results of the study, please check the appropriate box at the end of the survey. Your responses to the questions will remain confidential
Thank you ver\' much for your cooperation and participation If you are not responsible for purchasing wine at your restaurant, please forward tliisi questionnaire to the appropriate person
Sincerely,
H M. Gullek Ph.D Student, Texas lech University Restaurant/Hotel and Institutional Management Progrsm
HMG/dah
Enclosure
P.O. Box 41162 •Lubbonk Toxas 79409-116? • U.e; A. • Phon« mnfil 74P-.'H077 • Fay fftfim 74?.ni?.>;
120

RESTAURATEUR WINE PURCHASING SURVEY
Section I - General questions:
1. The name of the restaurant:
2. The seating capacity:
3. The service type: Quick service Casual dining Fine dining
4. The type of ownership: Chain Franchise Independent
5. The main menu concept: American Chinese Italian
Mexican Steakhouse Seafood Other (please specify)
6. Have you ever received any wine- training? Yes No
7. How often is wine training offered in your restaurant? more than once a year once a year never
8. How important is wine-training for your restaurant? Not Very Important 1 2 3 4 5 6 7 Important
9. Approximately what percentage of your alcohol sales ($) is from wine sales?
%
10. Please indicate the percentage of wine purchased from the following origins (should total 100%)
% Califomia % France % Italy % Texas % Other (please specify)
11. How many different suppliers do you use to purchase wine?
12. When you purchase wine, indicate the percentage purchased from: (should total 100%)
% Grocery store % Liqueur store % Wholesaler % Winery % Other (please specify)
13. How satisfied are you with your current wine supplier?
Very satisfied Satisfied Not satisfied
Section II - Wine Training Attributes:
14. How LIKELY is a wine-training program to possess the following attributes?
Offered bv a wine supplier: Very Very unlikely - 3 - 2 - 1 0 1 2 3 likely
Paid bv a wine supplier: Very Very unlikely - 3 - 2 - 1 0 1 2 3 likely
Geared toward increasing wine sales: Very Very unlikely - 3 - 2 - 1 0 1 2 3 likely
Has a flexible schedule: Very Very unlikely - 3 - 2 - 1 0 1 2 3 likely
Offered on premise, in vour restaurant: Very Very unlikely - 3 - 2 - 1 0 1 2 3 likely
Offered regularlv: Very Very unlikely - 3 - 2 - 1 0 1 2 3 likely
15. How IMPORTANT are the following when implementing a wine-training program?
Offered bv a wine supplier: Not Very Important - 3 - 2 - 1 0 1 2 3 Important
Paid bv a wine supplier: Not Very Important - 3 - 2 - 1 0 1 2 3 Important
Geared toward increasing wine sales: Not Very Important - 3 - 2 - 1 0 1 2 3 Important
Has a flexible schedule: Not Very Important - 3 - 2 - 1 0 1 2 3 Important
Offered on premise, in vour restaurant: Not Very Important - 3 - 2 - 1 0 1 2 3 Important
Offered reeulariv: Not Very Important - 3 - 2 - 1 0 1 2 3 Important
121 Continued on the back

Section III - Product attrihntps-
16. How LIKELY is a Texas-wine brand to possess the following attributes?
Has a reasonable price: Very Very unlikely - 3 - 2 - 1 0 1 2 3 likely
Available in various wine varieties: Very Very unlikely - 3 - 2 - 1 0 1 2 3 likely
Has an attractive bottle design: Very Very unlikely - 3 - 2 - 1 0 1 2 3 likely
Has a pleasant taste: Very Very unlikely - 3 - 2 - 1 0 1 2 3 likely
Is a preferred brand -name recognized bv customers: Very Very unlikely - 3 - 2 - 1 0 1 2 3 likely
Is compatible with our menu items: Very Very unlikely - 3 - 2 - 1 0 1 2 3 likely
17. How IMPORTANT is it for a Texas-wine brand to possess the following attributes?
Has a reasonable price: Not Very Important - 3 - 2 - 1 0 1 2 3 Important
Available in various wine varieties: Not Very Important - 3 - 2 - 1 0 1 2 3 Important
Has an attractive bottle design: Not Very Important - 3 - 2 - 1 0 1 2 3 Important
Has a pleasant taste: Not Very Important - 3 - 2 - 1 0 1 2 3 Important
Is a preferred brand -name recognized bv customers: Not Very Important - 3 - 2 - 1 0 1 2 3 Important
Is compatible with our menu items: Not Very Important - 3 - 2 - 1 0 1 2 3 Important
Section IV - Service attributes:
18. How LIKELY is a wine-supplier to possess the following attributes?
Has a knowledgeable sales staff about wine: Very Very unlikely - 3 - 2 - 1 0 1 2 3 likely
Offers prompt delivery: Very Very unlikely - 3 - 2 - 1 0 1 2 3 likely
Offers discounts: Very Very unlikely - 3 - 2 - 1 0 1 2 3 likely
Carries a broad line of wine selections : Very Very unlikely - 3 - 2 - 1 0 1 2 3 likely
Is a well-knovyn supplier: Very Very unlikely - 3 - 2 - 1 0 1 2 3 likely
Has a friendlv sales staff: Very Very unlikely - 3 - 2 - 1 0 1 2 3 likely
19. How IMPORTANT is it for a wine-supplier to possess the following attributes?
Has a knowledgeable sales staff about wine: Not Very Important - 3 - 2 - 1 0 1 2 3 Important
Offers prompt deliverv: Not Very Important - 3 - 2 - 1 0 1 2 3 Important
Offers discounts: Not Very Important - 3 - 2 - 1 0 1 2 3 Important
Carries a broad line of wine selections: Not Very Important - 3 - 2 - 1 0 1 2 3 Important
Is a well-knovyn supplier: Not Very Important - 3 - 2 - 1 0 1 2 3 Important
Has a friendlv sales staff: Not Very Important - 3 - 2 - 1 0 1 2 3 Important
122

Section III - Product attributes:
16. How LIKELY is a Texas-wine brand to possess the following attributes?
Has a reasonable price: Very Very unlikely - 3 - 2 - 1 0 1 2 3 likely
Available in various wine varieties: Very Very unlikely - 3 - 2 - 1 0 1 2 3 likely
Has an attractive bottle design: Very Very unlikely - 3 - 2 - 1 0 1 2 3 likely
Has a pleasant taste: Very Very unlikely - 3 - 2 - 1 0 1 2 3 likely
Is a preferred brand -name recognized bv customers: Very Very unlikely - 3 - 2 - 1 0 1 2 3 likely
Is compatible with our menu items: Very Very unlikely - 3 - 2 - 1 0 1 2 3 likely
17. How IMPORTANT is it for a Texas-wine brand to possess the following attributes?
Has a reasonable price: Not Very Important - 3 - 2 - 1 0 1 2 3 Important
Available in various wine varieties: Not Very Important - 3 - 2 - 1 0 1 2 3 Important
Has an attractive bottle design: Not Very Important - 3 - 2 - 1 0 1 2 3 Important
Has a pleasant taste: Not Very Important - 3 - 2 - 1 0 1 2 3 Important
Is a preferred brand -name recognized bv customers: Not Very Important - 3 - 2 - 1 0 1 2 3 Important
Is compatible with our menu items: Not Very Important - 3 - 2 - 1 0 1 2 3 Important
Section IV - Service attributes:
18. How LIKELY is a wine-supplier to possess the following attributes?
Has a knowledgeable sales staff about wine: Very Very unlikely - 3 - 2 - 1 0 1 2 3 likely
Offers prompt deliverv: Very Very unlikely - 3 - 2 - 1 0 1 2 3 likely
Offers discounts: Very Very unlikely - 3 - 2 - 1 0 1 2 3 likely
Carries a broad line of wine selections : Very Very unlikely - 3 - 2 - 1 0 1 2 3 likely
Is a well-knovyn supplier: Very Very unlikely - 3 - 2 - 1 0 1 2 3 likely
Has a friendlv sales staff: Very Very unlikely - 3 - 2 - 1 0 1 2 3 likely
19. How IMPORTANT is it for a wine-supplier to possess the following attributes?
Has a knowledgeable sales staff about wine: Not Very Important - 3 - 2 - 1 0 1 2 3 Important
Offers prompt deliverv: Not Very Important - 3 - 2 - 1 0 1 2 3 Important
Offers discounts: Not Very Important - 3 - 2 - 1 0 1 2 3 Important
Carries a broad line of wine selections: Not Very Important - 3 - 2 - 1 0 1 2 3 Important
Is a well-known supplier: Not Very Important - 3 - 2 - 1 0 1 2 3 Important
Has a friendlv sales staff: Not Very Important - 3 - 2 - 1 0 1 2 3 Important
122