Validation of a more sensitive method for using spotted oligonucleotide DNA microarrays for...
11
Environmental Microbiology (2003) 5 (10), 933–943 10.1046/j.1462-2920.2003.00490.x © 2003 Society for Applied Microbiology and Blackwell Publishing Ltd Blackwell Science, LtdOxford, UKEMIEnvironmental Microbiology 1462-2920Blackwell Publishing Ltd, 20035 10933943 Original Article Improved sensitivity for functional oligo arraysV. J. Denef et al. Received 31 January, 2003; revised 19 May, 2003; accepted 21 May, 2003. *For correspondence. E-mail [email protected]; Tel. ( + 1) 517 353 9021; Fax ( + 1) 517 353 2917. Validation of a more sensitive method for using spotted oligonucleotide DNA microarrays for functional genomics studies on bacterial communities Vincent J. Denef, 1,2 Joonhong Park, 2 Jorge L. M. Rodrigues, 2 Tamara V. Tsoi, 2 Syed A. Hashsham 2,3 and James M. Tiedje 2 * 1 Laboratory of Microbial Ecology and Technology, Ghent, Belgium. 2 Center for Microbial Ecology, 540 Plant and Soil Sciences Building, East Lansing, MI, 48824, USA. 3 Department of Civil and Environmental Engineering, Michigan State University, East Lansing, MI, 48824, USA. Summary Spotted oligonucleotide microarrays potentially offer a wide scope of applications for microbial ecology, especially as they improve the flexibility of design and the specificity of detection compared to PCR product based microarrays. Sensitivity, however, was expected to be problematic, as studies with the more sensitive PCR-based cDNA microarrays indicate that only genes from populations contributing to more than 5% of the community DNA can be detected. We evaluated several parameters to increase sensitivity and then tested applicability for bacterial functional genomics. The optimal parameters were the use of 5 ¢ - C6-amino-modified 70-mers printed on CMT-GAPS II substrates at a 40 m M concentration combined with the use of Tyramide Signal Amplification labelling. This protocol allowed detection of single copy genes belonging to an organism contributing to 1% or more of the total community. To demonstrate its applica- tion, we detected the specific aromatic oxygenase genes in a soil community degrading polychlorinated biphenyls (PCBs). This increase in sensitivity is important if oligonucleotide microarrays are to be used for simultaneous monitoring of a range of func- tions performed by different microorganisms in the environment. Introduction Many of nature’s metabolic processes are sustained by mixed communities rather than by populations of a single microorganism. This applies to a wide range of environ- ments, e.g. natural soils and sediments, pristine (Bowman et al ., 2000) or subject to human interference (Nogales et al ., 1999), water treatment reactors (Lee et al ., 1999; Pelz et al ., 1999) and animal oral (Whittaker et al ., 1996) and intestinal ecosystems (Santo Domingo et al ., 1998). Microbial ecologists have focused mostly on unravelling the composition and structure of microbial communities (Amann et al ., 1995; Liu et al ., 1997; Zhou et al ., 2002). However, because of limitations of the experimental tools to mine the community’s diverse metabolic capacity, little is known about mechanisms of community functioning, dynamics or inter- and intracommunity interactions. Because of the challenges posed by the vast genetic diversity in the microbial world, the use of microarray technology in microbial ecology has been proposed (Cho and Tiedje, 2001; Liu et al ., 2001; Murray et al ., 2001; Wu et al ., 2002) with the prospect to eventually enable simul- taneous monitoring of multiple members of a community (‘community-on-a-chip’). To determine the community composition, microarrays composed of phylogenetic markers (e.g. 16S rRNA) have been developed (Liu et al ., 2001; Koizumi et al ., 2002; Wilson et al ., 2002). Array techniques using random DNA fragments or specific PCR- amplified genes have been developed as an alternative approach for species identification and community struc- ture analysis (Cho and Tiedje, 2001; Jaccoud et al ., 2001; Murray et al ., 2001). Also, PCR-based cDNA microarrays have been reported to detect selected genes in the envi- ronment (Wu et al ., 2002). Compared to the PCR-based platform, spotted oligonu- cleotide microarrays, using synthesized oligonucleotides as probes, provide an enhanced flexibility in design, inde- pendent of the culturability of the targeted organisms, enabling the design of probes for specific regions of a gene while avoiding the more conserved domains. Con- sequently, they can offer a higher level of hybridization specificity (Hughes et al ., 2001; Ye et al ., 2001). The use of one 50–70 nucleotides long probe per gene has been successfully implemented for comparative expression pro- filing (Stingley et al ., 2000; Talaat et al ., 2002). When interested in complex communities of bacteria, a crucial factor concerning microarrays is their limited sensitivity. Microarrays with 700 bp PCR products as probes were
-
Upload
independent -
Category
Documents
-
view
0 -
download
0
Transcript of Validation of a more sensitive method for using spotted oligonucleotide DNA microarrays for...

Environmental Microbiology (2003)
5
(10), 933–943 10.1046/j.1462-2920.2003.00490.x
© 2003 Society for Applied Microbiology and Blackwell Publishing Ltd
Blackwell Science, LtdOxford, UKEMIEnvironmental Microbiology 1462-2920Blackwell Publishing Ltd, 20035
10933943
Original Article
Improved sensitivity for functional oligo arraysV. J. Denef
et al.
Received 31 January, 2003; revised 19 May, 2003; accepted 21 May,2003. *For correspondence. E-mail [email protected]; Tel.(
+
1) 517 353 9021; Fax (
+
1) 517 353 2917.
Validation of a more sensitive method for using spotted oligonucleotide DNA microarrays for functional genomics studies on bacterial communities
Vincent J. Denef,
1,2
Joonhong Park,
2
Jorge L. M. Rodrigues,
2
Tamara V. Tsoi,
2
Syed A. Hashsham
2,3
and James M. Tiedje
2
*
1
Laboratory of Microbial Ecology and Technology, Ghent, Belgium.
2
Center for Microbial Ecology, 540 Plant and Soil Sciences Building, East Lansing, MI, 48824, USA.
3
Department of Civil and Environmental Engineering, Michigan State University, East Lansing, MI, 48824, USA.
Summary
Spotted oligonucleotide microarrays potentially offera wide scope of applications for microbial ecology,especially as they improve the flexibility of designand the specificity of detection compared to PCRproduct based microarrays. Sensitivity, however, wasexpected to be problematic, as studies with the moresensitive PCR-based cDNA microarrays indicate thatonly genes from populations contributing to morethan 5% of the community DNA can be detected. Weevaluated several parameters to increase sensitivityand then tested applicability for bacterial functionalgenomics. The optimal parameters were the use of 5
¢¢¢¢
-C6-amino-modified 70-mers printed on CMT-GAPS IIsubstrates at a 40
mmmm
M concentration combined withthe use of Tyramide Signal Amplification labelling.This protocol allowed detection of single copy genesbelonging to an organism contributing to 1% or moreof the total community. To demonstrate its applica-tion, we detected the specific aromatic oxygenasegenes in a soil community degrading polychlorinatedbiphenyls (PCBs). This increase in sensitivity isimportant if oligonucleotide microarrays are to beused for simultaneous monitoring of a range of func-tions performed by different microorganisms in theenvironment.
Introduction
Many of nature’s metabolic processes are sustained by
mixed communities rather than by populations of a singlemicroorganism. This applies to a wide range of environ-ments, e.g. natural soils and sediments, pristine (Bowman
et al
., 2000) or subject to human interference (Nogales
et al
., 1999), water treatment reactors (Lee
et al
., 1999;Pelz
et al
., 1999) and animal oral (Whittaker
et al
., 1996)and intestinal ecosystems (Santo Domingo
et al
., 1998).Microbial ecologists have focused mostly on unravellingthe composition and structure of microbial communities(Amann
et al
., 1995; Liu
et al
., 1997; Zhou
et al
., 2002).However, because of limitations of the experimental toolsto mine the community’s diverse metabolic capacity, littleis known about mechanisms of community functioning,dynamics or inter- and intracommunity interactions.
Because of the challenges posed by the vast geneticdiversity in the microbial world, the use of microarraytechnology in microbial ecology has been proposed (Choand Tiedje, 2001; Liu
et al
., 2001; Murray
et al
., 2001; Wu
et al
., 2002) with the prospect to eventually enable simul-taneous monitoring of multiple members of a community(‘community-on-a-chip’). To determine the communitycomposition, microarrays composed of phylogeneticmarkers (e.g. 16S rRNA) have been developed (Liu
et al
.,2001; Koizumi
et al
., 2002; Wilson
et al
., 2002). Arraytechniques using random DNA fragments or specific PCR-amplified genes have been developed as an alternativeapproach for species identification and community struc-ture analysis (Cho and Tiedje, 2001; Jaccoud
et al
., 2001;Murray
et al
., 2001). Also, PCR-based cDNA microarrayshave been reported to detect selected genes in the envi-ronment (Wu
et al
., 2002).Compared to the PCR-based platform, spotted oligonu-
cleotide microarrays, using synthesized oligonucleotidesas probes, provide an enhanced flexibility in design, inde-pendent of the culturability of the targeted organisms,enabling the design of probes for specific regions of agene while avoiding the more conserved domains. Con-sequently, they can offer a higher level of hybridizationspecificity (Hughes
et al
., 2001; Ye
et al
., 2001). The useof one 50–70 nucleotides long probe per gene has beensuccessfully implemented for comparative expression pro-filing (Stingley
et al
., 2000; Talaat
et al
., 2002). Wheninterested in complex communities of bacteria, a crucialfactor concerning microarrays is their limited sensitivity.Microarrays with 700 bp PCR products as probes were

934
V. J. Denef
et al.
© 2003 Society for Applied Microbiology and Blackwell Publishing Ltd,
Environmental Microbiology
,
5
, 933–943
unable to detect populations contributing to less than 5%of the total community DNA (Cho and Tiedje, 2002). Thereduced probe length of oligonucleotides results in a lossin sensitivity when all other parameters are the same(Denef, 2001; Ye
et al
., 2001). Although the methodolog-ical optimization, specifically regarding sensitivity issues,when using spotted oligonucleotide arrays has been per-formed for expression profiling, SNP genotyping andminisequencing (Kane
et al
., 2000; Lindroos
et al
., 2001;Relógio
et al
., 2002), no attempt has been made to exam-ine this technology’s capabilities to detect or quantify com-munity gene composition.
We evaluated the applicability of spotted oligonucle-otide microarrays to detect specific aromatic oxygenasesthat catalyse key steps in the biodegradation of polychlo-rinated biphenyls (Robertson and Hansen, 2001). We sys-tematically optimized spotted oligonucleotide microarrayswhen using genomic DNA as the sample by comparingseveral microarray fabrication parameters (substratechemistry and modification, length, and concentration ofspotting of the oligonucleotide probes) and labelling strat-egies (direct Cy-dNTP incorporation, amino-allyl labellingand post-hybridization signal amplification). Using theoptimized protocol, we determined the detection limit andexamined if our method could be applied to detectselected genes in sediment microcosms (J.L.M.Rodrigues, C.A. Kachel, M.R. Aiello, J.F. Quensen, O.V.Maltseva, T.V. Tsoi and J.M. Tiedje, in prep.).
Results
Microarray fabrication optimization
To determine which microarray substrate delivers themost sensitive and consistent results, hybridization sig-nals and the background levels on six commerciallyavailable microarray substrates were compared (Fig. 1).Superaldehyde substrates produced the highest signal-to-noise ratio with the greatest reproducibility between thereplicates (Fig. 1A). When comparing the mean localbackground of all probes on the different substrates, thelowest and most consistent background levels wereobserved when using CMT-GAPS II substrates (Fig. 1B).Based on the results of signal intensity and backgroundnoise, we selected Superaldehyde and CMT-GAPS II sub-strates for subsequent investigation. Although higher sig-nal intensities were observed when using one of the othertested substrates (substrate X3), preference was given tothe substrates that gave most consistent results.
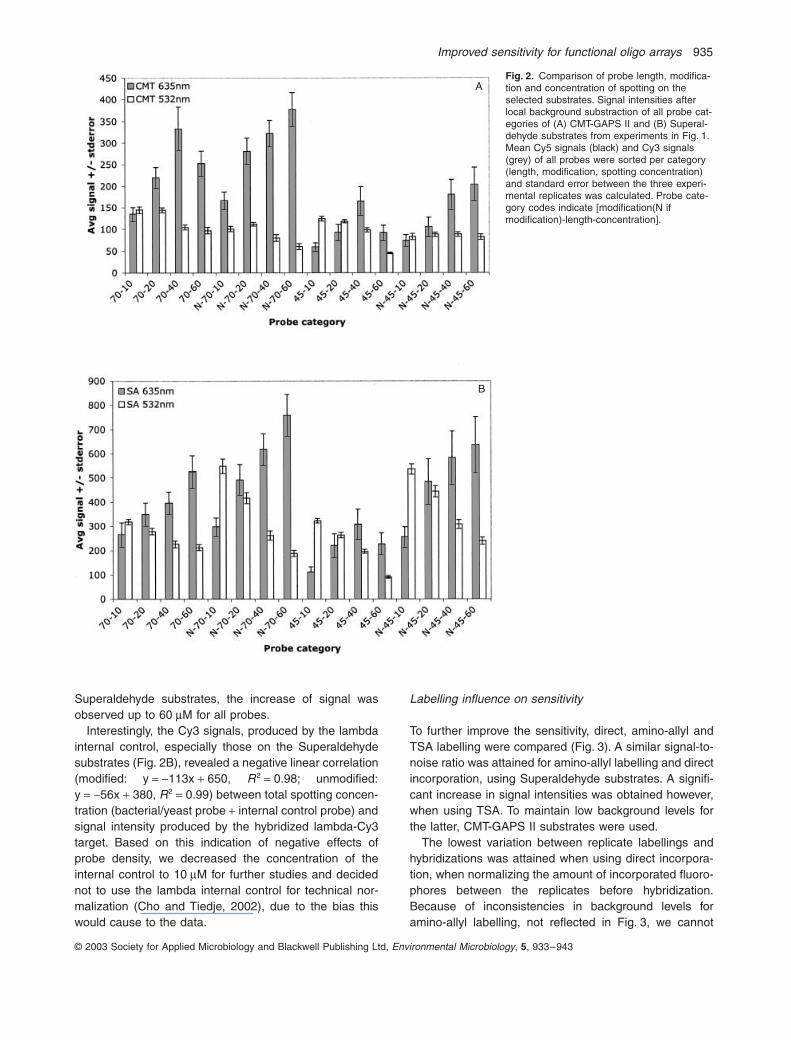
Variation in (i) length (ii) modification and (iii) concen-tration of spotting of the probes for each gene, enabledus to investigate the influence of these factors on thesensitivity of microarray hybridizations. A more detailedlook at the Cy5 signals per probe category on CMT-GAPS
II (Fig. 2A) and Superaldehyde substrates (Fig. 2B), indi-cated that on both substrates 70-mers produced up to twotimes higher signals than did 45-mers, indicating thatlonger oligonucleotide probes resulted in improved sensi-tivity. The use of amino-modification increased Superalde-hyde signals by an average of 1.7-fold, whereas the onlysignificant effect on CMT-GAPS II signals was the disap-pearance of negative density effects (signal saturation/reduction) at higher concentrations of spotting. For CMT-GAPS II substrates, signals increased up to a 40
m
Mconcentration for unmodified probes whereas the increasewas maintained up to 60
m
M for modified probes. For
Fig. 1.
Comparison of microarray substrates. Labelling reactions and hybridizations were performed in triplicate using direct Cy5-labelling of the PCR product mixture.A. For each of the tested substrates, the mean 635 nm signals (Cy5) of all probes of the probe category with the highest signal to noise ratio (
=
optimal probe category) for each of the replicates were com-pared. Error bars indicate the standard error between the probe signals for the different genes in one replicate.B. The average of the local background of all probes for each of the replicates. Error bars indicate the standard error between local back-ground of all probes on each of the replicate arrays. X1
=
poly
L
-lysine (CelAssociates), X2
=
epoxysilane (CelAssociates), X3
=
EZ-Rays (Apogent Discoveries), X4
=
3D-Link (Motorola).
A
B
Improved sensitivity for functional oligo arrays
935
© 2003 Society for Applied Microbiology and Blackwell Publishing Ltd,
Environmental Microbiology
,
5
, 933–943
Superaldehyde substrates, the increase of signal wasobserved up to 60
m
M for all probes.Interestingly, the Cy3 signals, produced by the lambda
internal control, especially those on the Superaldehydesubstrates (Fig. 2B), revealed a negative linear correlation(modified: y
=
-
113x
+
650,
R
2
=
0.98; unmodified:y
=
-
56x
+
380,
R
2
=
0.99) between total spotting concen-tration (bacterial/yeast probe
+
internal control probe) andsignal intensity produced by the hybridized lambda-Cy3target. Based on this indication of negative effects ofprobe density, we decreased the concentration of theinternal control to 10
m
M for further studies and decidednot to use the lambda internal control for technical nor-malization (Cho and Tiedje, 2002), due to the bias thiswould cause to the data.
Labelling influence on sensitivity
To further improve the sensitivity, direct, amino-allyl andTSA labelling were compared (Fig. 3). A similar signal-to-noise ratio was attained for amino-allyl labelling and directincorporation, using Superaldehyde substrates. A signifi-cant increase in signal intensities was obtained however,when using TSA. To maintain low background levels forthe latter, CMT-GAPS II substrates were used.
The lowest variation between replicate labellings andhybridizations was attained when using direct incorpora-tion, when normalizing the amount of incorporated fluoro-phores between the replicates before hybridization.Because of inconsistencies in background levels foramino-allyl labelling, not reflected in Fig. 3, we cannot
A
B
Fig. 2.
Comparison of probe length, modifica-tion and concentration of spotting on the selected substrates. Signal intensities after local background substraction of all probe cat-egories of (A) CMT-GAPS II and (B) Superal-dehyde substrates from experiments in Fig. 1. Mean Cy5 signals (black) and Cy3 signals (grey) of all probes were sorted per category (length, modification, spotting concentration) and standard error between the three experi-mental replicates was calculated. Probe cate-gory codes indicate [modification(N if modification)-length-concentration].

936
V. J. Denef
et al.
© 2003 Society for Applied Microbiology and Blackwell Publishing Ltd,
Environmental Microbiology
,
5
, 933–943
conclude that the same reproducibility was attained as fordirect incorporation. Relative to the increased signal inten-sity, the TSA system produced a low slide-to-slide variabil-ity. The variation for the TSA system originated only fromthe hybridization and the signal amplification steps as
hybridization mixtures for both replicate slides were splitfrom the same biotin-dCTP labelling. The influence oflength and concentration differences on TSA signals wassimilar as observed for direct incorporation, whereas littleinfluence of modification was observed (Fig. 4).
Verification of improved detection limits
To measure the sensitivity and assess the applicability ofthe optimized protocol to track the targeted genes in amixed community, we prepared artificial community DNAsamples by mixing bacterial gDNAs with mouse DNA ina range of ratios, simulating a community where the bac-teria of interest would contribute 1–10% of a total of 10
8
cells (Table 2). To allow slide-to-slide comparison, we nor-malized signals on each microarray slide using the signalsof the Ste3 control probe, for which a PCR product wasspiked in equal amounts into every labelling reaction. Foreach of the studied genes, a linear relationship existedbetween the signal intensities produced and the amountof starting material used (Fig. 5). The slopes varied insteepness depending on the gene. The multicopy (10copies/cell) genes
ohbB
and
fcbB
presented steeperslopes (average
=
1.535) than those for the single-copy
bph
genes (average
=
0.616). The intercept with the
X
-axis, i.e. the detection limit, of the average trend line forthe single-copy genes was 0.96% of the total community,while it was 0.54% for the multicopy genes. Therefore, toenable detection of all targeted genes, the population ofthe organism containing these genes has to comprise 1%or more of the community.
Detection of biodegradative genes in soil
To determine whether our optimized method for spottedoligonucleotide microarrays was sensitive enough to spe-
Fig. 3.
Comparison of labelling methods. Average 635 nm (Cy5) sig-nals after local background subtraction of the optimal probe category, i.e. the modified 70-mers spotted at 40
m
M for CMT-GAPS II and 60
m
M for Superaldehyde substrates, when labelling and hybridizing a genomic DNA mixture using three different labelling methods. Two replicates per labelling method were carried out. Direct incorporation and amino-allyl labelling hybridizations used Superaldehyde sub-strates and were scanned at a PMT of 600, whereas TSA was carried out on CMT-GAPS II substrates and scanned at a PMT of 450 [sat-uration (signals
>
65000) at PMT of 600]. Error bars indicate the standard error between all probes of the optimal probe category of the respective replicate, thus representing the variation between the signals of the different probes (genes) on one microarray slide. Labelled target concentrations were 14.4
±
0.2 ng DNA
m
l
-
1
(0.57
±
0.02 pmoles Cy5
m
l
-
1
) for direct, 55.1
±
5.5 ng DNA
m
l
-
1
(3.33
±
0.0 pmoles Cy5
m
l
-
1
) for amino-allyl and 81
±
0.0 ng DNA
m
l
-
1
for TSA labelling hybridizations.
Fig. 4.
Signal intensities of all probe categories of the TSA hybridizations. Mean 635 nm (Cy5) signals of all probes, summarized in Fig. 3, sorted per category (length, modification, spot-ting concentration) with standard error between the two experimental replicates are shown. Probe category codes indicate [modification(N if modified)-length-concentration].

Improved sensitivity for functional oligo arrays
937
© 2003 Society for Applied Microbiology and Blackwell Publishing Ltd,
Environmental Microbiology
,
5
, 933–943
cifically detect genes in environmental samples, we usedcommunity DNA from our sediment microcosm studiescontaining the native population (4.82
¥
10
8
cells g
-
1
bydirect count) and inoculated with 10
4
cells g
-
1
of the PCB-growing recombinant organisms LB400(pRO41) andRHA1(pRHD34) (J.L.M. Rodrigues, C.A. Kachel, M.R.Aiello, J.F. Quensen, O.V. Maltseva, T.V. Tsoi and J.M.Tiedje, in prep.). The PCBs in the sediment weredegraded during the incubation period and the popula-tions of LB400 grew to 2.00 (
±
0.02)
¥
10
7
cells g
-
1
andRHA1 to 4.95 (
±
0.52)
¥
10
5 cells g-1, as measured by real-time PCR, at their respective sample times of 10 and5 days. These quantitative data were further supported byplate counts on selective media for the two recombinantstrains, 1.42 (±0.33) ¥ 107 cells g-1 and 9.60 (±0.96) ¥ 105
cells g-1 respectively. Duplicate labellings and hybridiza-tions were performed for each of the DNA samples usingthe optimized protocol (i.e. Tyramid Signal Amplificationusing CMT-GAPS II substrates, with 70-mers printed at40 mM, modified or unmodified). This allowed us to detectthe plasmid-located multicopy genes for both organisms(ohbB and fcbB) and the single-copy genes of LB400(bphA and bphC). No signal was detected for the single-copy genes of RHA1 (Fig. 6). No signal was detected forany of the probes targeting genes not present in thecommunity DNA sample (yeast genes, RHA1(pRHD34)genes in LB400(pRO41) sample and vice versa) indicat-ing that the signals were specific.
Discussion
Because specificity, quantification and especially sensitiv-ity are critical issues to how applicable DNA microarrayscan be to microbial ecology studies, we systematicallyoptimized spotted oligonucleotide microarray methodol-ogy to maximize sensitivity for this application. Given thecurrent spotted microarray technology and labelling tech-niques, we have arguably reached the highest sensitivity,while preserving consistency of the detected hybridizationsignals. The most significant improvements were due toTSA labelling, which is based on post-hybridization signalamplification. The optimal method used TSA in combina-tion with CMT-GAPS II substrates printed on with 70-meroligonucleotides at a concentration of 40 mM. 5¢-C6-Amino-modification of the oligonucleotides had minorinfluence on the sensitivity.
This protocol not only compensated the loss in sensi-tivity due to shorter probes, but improved it approximatelyfive times beyond the detection limit for conventionalcDNA microarrays (Cho et al., 2002). The latter studyused dilutions of PCR products of the targeted genes ina non-specific carrier (mouse genomic DNA) and calcu-lated that the organism containing the targeted gene hasto contribute to at least 5% of the community DNA for thegene to be detectable. In another report, which includedsensitivity studies of cDNA microarrays, Wu et al. (2002)reported detection of nirS genes in 1 ng of pure genomicDNA and in 25 ng of soil community DNA. However, no
Fig. 5. Sensitivity analysis. We used the optimized method to label and hybridize a range of artificial community DNA samples, com-posed of bacterial gDNAs mixed with mouse DNA, simulating DNA extracted from 106 to 107 targeted cells of a total of 108 cells. The mean signal intensities (635 nm) with standard error between repli-cates (on the same slide and between slides) of all probes of the modified and unmodified 70-mers at 40 mM concentration, scanned at a PMT voltage of 480. Two replicate experiments were performed with 1% and 10% targeted cells, while only one for was carried out for the intermediate data points. Each data point on figures A and B included data of two replicate spots per array, per gene, per probe category. The data presented as percentage signal relative to the corresponding Ste3 control (modified or unmodified, and per repli-cate array on the same slide). Data sorted per organism and gene.
Fig. 6. Detection of genes in sediment DNA. The optimized protocol was used to label 200 ng community DNA extracted from sediment microcosms. Average of the absolute 635 nm (Cy5) signals (after background subtraction) of the optimal probe categories after hybridization of labelled soil microcosm community DNA, using the TSA system, scanned at a PMT voltage of 600. Communities con-sisted of both indigenous populations and inoculated LB400(pRO41) (black) or RHA1(pRHD34) (grey). Error bars indicate standard error between the signals of the replicates. Labeled target concentrations were 24.0 ± 0.3 ng DNA ml-1 for LB400(pRO41) microcosm hybridiza-tions and 29.9 ± 2.3 ng DNA ml-1 for RHA1(pRHD34) microcosm hybridizations.

938 V. J. Denef et al.
© 2003 Society for Applied Microbiology and Blackwell Publishing Ltd, Environmental Microbiology, 5, 933–943
dilution into carrier DNA was carried out nor was it knownhow much of the community DNA was contributed byorganisms containing the targeted nirS gene. Competitionduring labelling and subsequent hybridization is a factorof major importance when assessing sensitivity. Whenusing PCR-amplified copies of the targeted genes, a sig-nificant decrease in signal was observed when dilutingthese products in mouse gDNA as compared to using thesame amounts of PCR products without dilution (data notshown). Besides other sensitivity-determining factors,such as target secondary structure and steric hindrance,the detection limit is thus dependent on the ratio of thetargeted sequence over the total DNA in the sample,rather than on absolute amounts of the targetedsequence, which in large part is due to the characteristicsof the enzymatic labelling. Higher amounts of startingmaterial result in a lower amplification rate by the enzymeduring labelling (Bioprime Labeling Kit documentation,Invitrogen), leading to a lower number of labelled frag-ments containing the specific sequence targeted by theoligonucleotide probe. This characteristic was supportedby results by Talaat et al. (2002) who showed that higheramounts of gDNA starting material led to a lower numberof probes producing signal.
We also determined the sensitivity limit of our opti-mized method for detecting functional genes in an artifi-cial community, composed of a mixture of genomic DNAfrom different organisms. We found, as did Cho et al.(2002) and Wu et al. (2002), a linear correlationbetween the amounts of the genes present in the sam-ple and the detected signal, affirming that a quantitativeassessment of functional genes in microbial communi-ties is possible. However, the characteristics of thislinear relationship, i.e. slope and intercept, weredependent on the target gene (Fig. 5). The higher thanexpected signals for the ohbB gene can be explained byour recent discovery of a highly similar gene (>95%) inthe LB400 genome, the labelled target of which alsohybridized to the ohbB probe. We did note a positivecorrelation between the guanidine percentage of theprobe and the slope of the sensitivity trend lines.Although our probe set is too small to be conclusive, itcould indicate that sequence dependency of hybridiza-tion signals originates during hybridization. We cannotexclude, though, that bias is introduced during targetpreparation, i.e. during labelling. In either case,sequence composition influences on hybridization sig-nals are important when attempting to make quantitativeconclusions based on microarray hybridization data.Based on our results, current probe design software isincapable of avoiding this drawback. This puts a limit onthe use of this method for high-throughput quantitativedetection, unless standard curves are determined for arepresentative subset of the probes. Alternatively, the
use of multiple probes per gene, averaging the influenceof probe sequence on the hybridization signal, or amicroarray platform that allows flexible probe designadjustments could resolve this dependency issue. Pre-liminary data showed that genomic DNA fragmentationmay reduce the bias in labelling (data not shown).
This study differs from previous microarray methoddevelopments for studying microbial communities (Choand Tiedje, 2002; Wu et al., 2002) in the use of oligonu-cleotide probes as compared to long PCR products(cDNA microarrays). Spotted oligonucleotide microarraysoffer a significant increase in probe sequence fidelity andonly sequence information is needed for their synthesis,avoiding problems with culturability of the species of inter-est and allowing synthesis of probes with consensussequences, targeting a group of closely related genes.Additionally, the use of the relatively short and single-strand oligonucleotide probes results in a reduction ofcomplexity at the probe level, which improves hybridiza-tion performance and consistency. There are limitations tothe use of oligonucleotide probes for microbial ecologysuch as the reduced sensitivity due to probe length, andthe fact that the existing gene sequence database is prob-ably only a very small fraction of the extant sequences innature.
Although the hybridization signal generally increasedwith increasing concentrations, negative effects of densitytook over at higher probe densities as clearly seen in theCy3 signals, produced by the lambda internal control(Fig. 2B). While the lambda probe concentration was unal-tered (20 mM in each spot), the Cy3 signals unexpectedlydecreased with increasing total probe concentration (bac-terial or yeast probes + lambda internal control probe), Wesuggest that this negative effect originated from steric orelectrostatic hindrance limiting the availability for hybrid-ization or causing increased competition on the probelevel.
In our initial studies, we were unable to detect anyhybridization signals using PCR-based microarrays, whenlabelling 100–500 ng microbial community DNA extractedfrom the same sediment microcosms by direct incorpora-tion of Cy-dCTP (Denef, 2001). Our optimized methodwas now able to specifically detect the targeted genes inthe same community DNA samples. Based on total cellcounts and selective plate counts, these samples con-tained 3.0 ± 0.7% LB400(pRO41) and 0.2 ± 0.02%RHA1(pRHD34), whereas the real-time PCR data indi-cated a presence of 4.15 ± 0.05% LB400(pRO41) and0.1 ± 0.01% RHA1(pRHD34). The results confirmed theexpected detection of all targeted LB400(pRO41) genes,while the positive results for the RHA1(pRHD34) samplewere slightly better than expected based on the resultsfrom the sensitivity study on the artificial community DNAsamples (Fig. 6). These specific signals, observed at the

Improved sensitivity for functional oligo arrays 939
© 2003 Society for Applied Microbiology and Blackwell Publishing Ltd, Environmental Microbiology, 5, 933–943
fcbB probes, could be explained by a higher plasmid copynumber than assumed, both in the artificial communityconstruction and the RTm-PCR data. The array resultsshowed that our strategy provides a significant improve-ment in the applicability of microarrays over currently usedmethods for environmental bacterial genomics studies.
Experimental procedures
Bacterial strains, plasmids, media and DNA preparation
Bacterial strains and plasmids used in this study are listed inTable 1. The PCB-degrading organisms were Burkholderiasp. LB400 (Bopp, 1986) and Rhodococcus sp. RHA1 (Setoet al., 1995) and their genetically modified derivativesRHA1(pRHD34) containing the fcbABC operon for 4-chlorobenzoate (4-CBA) dechlorination (Rodrigues et al.,2001) and LB400(pRO41) containing the ohbRABC operonfor ortho-CBA dechlorination (Tsoi et al., 1999). Wild-typestrains were routinely grown at 30∞C in mineral medium K1(Zaitsev and Karasevich, 1985), supplemented with biphenyl(1 g l-1). The recombinant strains RHA1(pRHD34) andLB400(pRO41) were grown at 30∞C in mineral medium K1supplemented with 4-CBA (2 mM) and 2-CBA (2 mM),respectively. Genomic DNA was isolated as described earlier(Sambrook and Russell, 2001). Plasmid DNA was isolatedusing the Wizard® SV96 Plasmid Purification System(Promega).
Oligonucleotide probes
We constructed a microarray containing modified (5¢-acryditeTM (EZ-Rays), 5¢-C6-amino (other substrates) andunmodified 45-mer and 70-mer probes (IDT, Coralville, IA) forthe PCB-degradative genes bphA1 and bphC of LB400 andbphA and bphC of RHA1 and the chlorobenzoate-degrada-tive genes ohbB and fcbB (Table 1). Positive and negativecontrolprobes for Saccharomyces cerevisiae genes (Act1,Mfa2, Ste3, Ras1) and a 50-mer phage lambda probe (DNApackaging, gi|215104 : 7202–7600) spot internal control(Cho et al., 2002) were added. All probes were designedusing Array Designer 2 (Premier Biosoft International, PaloAlto, CA) using a Tm of 80 ± 5∞C, a hairpin DG of -6 kcal/mol,a self-dimer DG of -12 kcal/mol and a maximum run lengthof 4. Probes were redesigned if a BLAST match >16 consec-utive nucleotides occurred(Kane et al., 2000) with entries inthe non-redundant database (NCBI)or the Burkholderia sp.LB400 genome draft (http://www.jgi-psf.org/draft_microbes/burfu). For hybridization to the spot internal control,a 5¢-Cy3modified complementary lambda probe was designed.
Substrates and array-printing
To select an optimal substrate for spotting the oligonucleotideprobes, six types of substrates were used: Superaldehyde(Telechem), poly L-Lysine and epoxysilane (Cel Associates),aminosilane-coated CMT-GAPS II substrates (Corning), 3D-Link activated substrates (Motorola Life Sciences) and thiol-coated EZ-Rays (Apogent Discoversies).
3¥ SSC (Gibco Ultrapure Reagent) with 0.50 M Betaine(Sigma) (Diehl et al., 2001) was used as printing buffer forSuperaldehyde, poly L-Lysine, CMT-GAPS II and epoxysilanesubstrates. Manufacturer’s recommended printing bufferswere used for 3D-Link and EZ-Ray substrates. Each probewas mixed with the printing buffer in four different concentra-tions (10, 20, 40 and 60 mM), resulting in the presence of 16probes per gene, each with a unique combination (= ‘probecategory’) of the three investigated parameters (length, mod-ification and concentration). The internal control lambdaprobe was added to each spot at a concentration of 10 mM(for artificial community and sensitivity study microarrays) or20 mM (for all other experiments), modified or unmodified incorrespondence to the LB400/RHA1/yeast probe.
Probes were printed in duplicate on each microarray slide(65% relative humidity, 25∞C) with an Omnigrid DNA Spotter(Genemachines) at the Genomics Technology Support Facil-ity (Michigan State University). EZ-Rays were activatedbefore printing by reduction of the disulphide bridges to freethiol groups. 3D Link and EZ-Rays were post-processed asdescribed by the manufacturer’s protocols, CMT-GAPS II andPoly L-Lysine substrates (Diehl et al., 2001) and epoxysilanesubstrates (Call et al., 2001) according to published protocols.
DNA sample preparation
For microarray fabrication optimization, 10 ml samples of apolymerase chain reaction (PCR) product mixture, containing20 pg ml-1 whole length PCR product of each gene (Table 1),except for Ras1 (negative control), were diluted in 1 mg ofmouse DNA (Promega).
For labelling optimization, 19 ml of a genomic DNA (gDNA)mixture, containing 10-6 pmol ml-1 LB400 gDNA (~9 Mbp) andRHA1 gDNA (~6 Mbp) and 10-5 pmol ml-1 ohb, fcb plasmidDNA (~12 kbp),was used to which we added 10 pg Act1,200 pg Ras1 and 600 pg Ste3, 0 pg Mfa2 (negative control).
Labelling for sensitivity analysis hybridizations used vary-ing amounts of the gDNA mixture to which 200 pg Ste3 wasadded, diluted in mouse gDNA (Promega). The other yeastgenes were negative controls (Table 2). This DNA mixturerepresented an artificial community DNA sample, where500 ng gDNA corresponds to approximately 108 cells of abacterium with an average genome size (4.6 Mbp). Calcula-tions were made to determine how much gDNA corre-sponded to 106-107 cells or 1–10% of the community.Plasmid DNA was added based on the assumption that 10plasmid copies were present for each copy of the gDNA.
Sediment microcosm study
A sequential anaerobic then aerobic PCB bioremediationstrategy was tested in bench scale microcosms. Sedimentsamples were obtained from the Red Cedar River (MI) andcontaminated with 70 mg g-1 sediment of Aroclor 1242. Thesediment, classified as sand (91.1% sand, 8.1% silt and clay),6.7% organic matter, 0.71% total nitrogen, pH 7.2, waspassed through a 4-mm mesh sieve and stored at 4∞C untilused. The sediment was inoculated with a PCB-dechlorinatingmicrobial community eluted from the River Raisin sedimentand incubated under anaerobic conditions for one year to

940 V. J. Denef et al.
© 2003 Society for Applied Microbiology and Blackwell Publishing Ltd, Environmental Microbiology, 5, 933–943
Tab
le 1
.D
escr
iptio
n of
pla
smid
s, b
acte
rial s
trai
ns a
nd p
robe
s us
ed.

Improved sensitivity for functional oligo arrays 941
© 2003 Society for Applied Microbiology and Blackwell Publishing Ltd, Environmental Microbiology, 5, 933–943
achieve substantial PCB dechlorination before being subjectto the aerobic stage used here. Total sediment bacterialcounts before inoculation with the aerobic cultures were per-formed by staining with 5-(4,6-dichlorotriazine-2-yl) aminoflu-oroscein (DTAF) followed by epifluorescence microscopy.Rifampicin-resistant recombinants RHA1(pRHD34) andLB400(pRO41), were grown on 3 mM (nominal concentration)biphenyl-containing medium. Cells were washed once withK1 medium, resuspended, and diluted in the same medium,and 1 ml was added to 1 g of contaminated sediment to givea density of 104 cells g-1 of sediment for each recombinantstrain (separate microcosms for each of the two strains).Samples were taken periodically, and immediately diluted.Appropriate dilutions were spread on Luria–Bertani agarplates containing rifampicin (50 mg ml-1). Numbers of colonyforming unit (CFUs) for both strains were determined afterone week of incubation. Community DNA was extracted usingsoil DNA extraction kits (MoBio) and real-time PCR (RT-PCR)counts were performed using Taqman probes targeting fcbBor ohbB (Rodrigues et al., 2002). Hybridizations performedin this study used 200 ng total DNA from the 5 day and 10 dayincubation samples for RHA1(pRHD34) and LB400(pRO41)respectively.
DNA sample labelling
To further improve sensitivity, three labelling methodswere evaluated. For direct incorporation (enzymatic incor-poration of Cy-labeled nucleotides), the Brown protocol forgDNA labelling (http://cmgm.stanford.edu/pbrown/protocols/4_genomic.html) was used. We purified the resulting labeledDNA using ProbeQuant G-50 purification columns (Amer-sham), according to the manufacturer’s instructions.
For amino-allyl labelling (enzymatic incorporation of amino-allyl modified nucleotides, followed by chemical coupling ofreactive Cy-dyes) we used a combination of the ARESamino-allyl labelling kit protocol (http://www.probes.com/handbook) and the Brown protocol mentioned above. Weused a 1 : 1 ratio between 2-amino-allyl-dUTP (2 mM, Molec-ular Probes) and dTTP. Microspin G-50 purification columns(Amersham) were used for incorporation reaction cleanupand Qiaquick PCR purification columns (Qiagen) were usedfor the coupling reaction cleanup, according to the manufac-turer’s protocol.
TSA labelling (enzymatic incorporation of biotin (or fluores-cein)-labelled nucleotides, followed by post-hybridizationcoupling with a streptavidin (or anti-fluorescein)-horse radishperoxidase complex which enzymatically deposits tyramide-cy (dye) used the protocol for direct incorporation withbiotin-modified dCTP (1 mM, Perkin Elmer). Purification wasperformed using ProbeQuant G-50 purification columns(Amersham), except the TSA labelling reactions for theenvironmental community DNA study that used QIAquickPCR purification columns, after addition of 5 ml 3M NaOAc(pH 5.2–5.5) and the use of 1:10 diluted elution buffer.
Hybridization
CMT-GAPS II and poly L-lysine substrates were washed at50∞C for 15 min in a prehybridization solution (3.5¥ SSC,0.1% SDS, 10 mg ml-1 BSA), while epoxysilane substrateswere prehybridized (5¥ Denhardt’s reagent, 10¥ SSC) for30 min at 25∞C. Pre-hybridization was concluded with a washin ddH2O and isopropanol and spinning dry for 2 min(<3000 g).
For the microarray fabrication optimization, the hybridiza-tion mixture contained 15 pg of Cy3-labelled lambda oligonu-cleotide and 1/6 of the same Cy5 labelled PCR productmixture, avoiding influence of labelling efficiency on thehybridization. The hybridization buffer consisted of 0.32%SDS (Gibco), 3.36¥ SSC (Gibco) and 0.8 mg ml-1 yeasttRNA (Sigma). For all other hybridizations, 10 pg Cy3-lambdawas added to the labelled target in combination with 20 ml in-situ hybridization buffer (Agilent). In all cases, the hybridiza-tion mixture was denatured for 2 min at 95∞C and then chilledon ice. Before applying the mixture (total volume of 40 ml)under the Lifterslip (Erie Scientific), the mixture was pre-heated at 45∞C. Hybridizations were carried out in hybridiza-tion cassettes (Telechem), humidified with 30 ml 3¥ SSC, for16 h at 65∞C.
Post hybridization
EZ-Rays were washed as recommended by the manufac-turer. After removing the Lifterslip in 1¥ SSC, 0.2% SDS at65∞C, all other substrates were washed 5 min in 1¥ SSC,0.2% SDS at 65∞C, 5 min in 0.1¥ SSC, 0.2% SDS at 65∞Cand 1 min in 0.1¥ SSC at room temperature.
Table 2. Experimental design of the sensitivity study. Amounts used to make up the artificial community samples for labelling and the amount ofcells or percentage of the community (when assuming 108 cells g-1 soil) in 1 g soil.
Cells 1.00E+07 5.00E+06 2.50E+06 1.00E+06 Unit
% Community 10.00 5.00 2.50 1.00 %Chromosome (1 copy/cell) 1.67E-05 8.35E-06 4.18E-06 1.67E-06 pmol
LB400 (~9 Mbp) 89.30 44.65 22.33 8.93 ngRHA1 (~6 Mbp) 66.10 33.05 16.53 6.61 ng
Plasmid (10 copies/cell) 1.67E-04 8.35E-05 4.18E-05 1.67E-05 pmolohb plasmid (~12 kbp) 0.893 0.447 0.223 0.089 ngfcb plasmid (~12 kbp) 0.893 0.447 0.223 0.089 ng
Postive control Ste3 0.2 0.2 0.2 0.2 ngCarrier DNA (mouse gDNA) 342 421 461 484 ngTotal 500 500 500 500 ng

942 V. J. Denef et al.
© 2003 Society for Applied Microbiology and Blackwell Publishing Ltd, Environmental Microbiology, 5, 933–943
The TSA post-hybridization signal amplification steps usedmaterials provided as part of the Micromax TSA labellingsystem (Perkin Elmer). Immediately after the washing steps,without spinning the slides dry, the microarray was incubatedwith 400 ml of TNB-G buffer [mixture of 4.5 ml TN blockingbuffer (0.5 g blocking reagent in 100 ml 0.1 M Tris-HCl,pH 7.5, 0.15 M NaCl, 0.22 mm filtered) and 0.5 ml goat serum(Sigma)] for 10 min to prevent non-specific binding. The slidewas washed in TNT buffer [0.1 M Tris-HCl, pH 7.5, 0.15 MNaCl, 0.05% Tween-20 (Sigma), 0.22 mm filtered] for1 minute with agitation after which 200 ml streptavidin-HRPconjugate solution [1:100 dilution of streptavidin-HRP conju-gate in TNB-G buffer] was applied on the slide and incubatedfor 10 min. Three rinses for 1 minute with 30 ml TNT bufferwere carried out, followed by incubating the slide with 250 mlCy5 tyramide solution [1:500 Cy5 tyramide (in DMSO) in 1¥amplification diluent] for 10 min. Then, the slide was rinsedthree times for 5 min in 30 ml of TNT buffer with agitation.After rinsing 1 minute in 30 ml of 0.06¥ SSC the slide wasspun dry (<3000 g).
Scanning and data analysis
The slides were scanned with an Axon Genepix 4000a laserscanner with photomultiplier tube (PMT) voltages for microar-ray fabrication optimization at 600 V for Cy5 (635 nm laser)and 400 V for Cy3 (532 nm laser), for labelling comparisons600 V (Cy5) and 500 V (Cy3), except for TSA where the Cy5PMT was lowered to 450. The sensitivity study used a PMTof 480 (Cy5) and 500 (Cy3), while the environmental com-munity DNA study used 600 (Cy5). In all cases, Cy3 signals(lambda internal control), were used to verify the quality ofprinting and hybridization.
For the microarray fabrication optimization and labellingcomparison, data analysis was performed using Excel(Microsoft) and Statview (SAS Company). Each probe spoton the microarray consists of multiple pixels. All data witha [% pixels > background (B) 532 channel + 2 standarddeviations (SD)] value smaller than 85% were discarded,as this indicated lower quality of the spot due to failedprinting or artifacts resulting from hybridization. The filtereddata was ordered in 16 groups or probe categories (perunique combination of microarray fabrication parameters)and Cy5 and Cy3 signals, corrected with the local back-ground, were imported in Statview. Descriptive statisticswere calculated and the data were further summarized inExcel.
Data from the sensitivity analysis experiments was elimi-nated when neither [% pixels > B532 + 2 SD] or [% pixels >B635 + 2 SD] was higher than 70%. To compare resultsbetween the different hybridizations of the sensitivity study,the signal of each of the bacterial probes was normalized bydivision with the nearest Ste3 control signal (local normaliza-tion), modified or unmodified and with a spotting concentra-tion, corresponding to the bacterial probe’s character. Wesubtracted this relative signal with the relative signals of thenegative controls to correct for non-specific hybridization.Data of the replications on the same slide (duplicate array)and from the replicate hybridization (experimental replicate)were combined and a mean and standard error was calcu-lated for the optimal probe classes.
For the environmental community DNA study, a mean anda standard error of the absolute signals from the duplicatearray and the experimental replicate was calculated.
Acknowledgements
This work was supported by the Superfund Basic ResearchProgram grant P42 ES 04911–12 from the U.S. NationalInstitute of Environmental Health Sciences and the U.S.Department of Energy Biotechnology Investigations – OceanMargins program. Vincent Denef is an aspirant of the Fundfor Scientific Research – Flanders, Belgium. We thank DrJae-Chang Cho (CME, MSU) for valuable discussions andhis advice, Dr Jeff Landgraf at the Genomics TechnologySupport Facility, MSU for printing the arrays and Perkin Elmerfor providing reagents for the TSA system.
References
Amann, R.I., Ludwig, W., and Schleifer, K.H. (1995) Phylo-gentic identification and in situ detection of individualmicrobial cells without cultivation. Microbiol Rev 59: 143–169.
Bopp, L.H. (1986) Degradation of highly chlorinated PCBs byPseudomonas strain LB400. J Ind Microbiol 1: 23–29.
Bowman, J.P., Rea, S.M., McCammon, S.A., and McMeekin,T.A. (2000) Diversity and community structure withinanoxic sediment from marine salinity meromictic lakes anda coastal meromictic marine basin, Vestfold Hills, EasternAntarctica. Environ Microbiol 2: 227–237.
Call, D.R., Chandler, D.P., and Brockman, F. (2001) Fabri-cation of DNA microarrays using unmodified oligonucle-otide probes. Biotechniques 30: 368–379.
Cho, J., and Tiedje, J.M. (2001) Bacterial species determi-nation from DNA-DNA hybridization by using genome frag-ments and DNA microarrays. Appl Envir Microbiol 67:3677–3682.
Cho, J., and Tiedje, J.M. (2002) Quantitative detection ofmicrobial genes by using DNA microarrays. Appl EnvirMicrobiol 68: 1425–1430.
Denef, V.J. (2001) Design of a microarray for monitoringpresence and activity of PCB-degrading microorganisms.Dissertation ( Environmental Technology). Katholieke Uni-versiteit Leuven, Leuven, Belgium.
Diehl, F., Grahlmann, S., Beier, M., and Hoheisel, J.D. (2001)Manufacturing DNA microarrays of high spot homogeneityand reduced background signal. Nucleic Acids Res 29:e38.
Hughes, T.R., Mao, M., Jones, A.R., Burchard, J., Marton,M.J., Shannon, K., et al. (2001) Expression profiling usingmicroarrays fabricated by an ink-jet oligonucleotide synthe-sizer. Nat Biotechnol 19: 342–347.
Jaccoud, D., Peng, K., Feinstein, D., and Kilian, A. (2001)Diversity Arrays: a solid state technology for sequenceinformation independent genotyping. Nucleic Acids Res29: e25.
Kane, M., Jatkoe, T., Stumpf, C., Lu, J., Thomas, J., andMadore, S. (2000) Assessment of the sensitivity and spec-ificity of oligonucleotide microarrays. Nucleic Acids Res 28:4552–4557.

Improved sensitivity for functional oligo arrays 943
© 2003 Society for Applied Microbiology and Blackwell Publishing Ltd, Environmental Microbiology, 5, 933–943
Koizumi, Y., Kelly, J., Nakagawa, T., Urakawa, H., El-Fantroussi, S., Al-Muzaini, S., et al. (2002) Parallelcharacterization of anaerobic toluene- and ethylbenzene-degrading microbial consortia by PCR-denaturing gradientgel electrophoresis, RNA-DNA membrane hybridization,and DNA microarray technology. Appl Envir Microbiol 68:3215–3225.
Lee, N., Nielsen, P.H., Andreasen, K.H., Juretschko, S.,Nielsen, J.L., Schleifer, K.H., and Wagner, M. (1999) Com-bination of fluorescent in situ hybridization and microauto-radiography – a new tool for structure-function analyses inmicrobial ecology. Appl Environ Microbiol 65: 1289–1297.
Lindroos, K., Liljedahl, U., Raitio, M., and Syvänen, A. (2001)Minisequencing on oligonucleotide microarrays: compari-son of immobilisation chemistries. Nucleic Acids Res 29:e69.
Liu, W.T., Marsh, T.L., Cheng, H., and Forney, L.J. (1997)Characterization of microbial diversity by determining ter-minal restriction fragment length polymorphisms of genesencoding 16S rRNA. Appl Envir Microbiol 63: 4516–4522.
Liu, W.T., Mirzabekov, A., and Stahl, D. (2001) Optimizationof an oligonucleotide microchip for microbial identificationstudies: a non-equilibrium dissociation approach. EnvironMicrobiol 3: 619–629.
Murray, A.E., Lies, D., Li, G., Nealson, K., Zhou, J., andTiedje, J.M. (2001) DNA/DNA hybridization to microarraysreveals gene-specific differences between closely relatedmicrobial genomes. Proc Natl Acad Sci USA 98: 9853–9858.
Nogales, B., Moore, E.R.B., Abraham, W.R., and Timmis,K.N. (1999) Identification of the metabolically activemembers of a bacterial community in a polychlorinatedbiphenyl-polluted moorland soil. Environ Microbiol 1:199–212.
Pelz, O., Tesar, M., Wittich, R.-M., Moore, E.R.B., Timmis,K.N., and Abraham, W.-R. (1999) Towards elucidation ofmicrobial community metabolic pathways: unraveling thenetwork of carbon sharing in a pollutant-degrading bacte-rial consortium by immunocapture and isotopic ratio massspectrometry. Environ Microbiol 1: 167–174.
Relógio, A., Schwager, C., Richter, A., Ansorge, W., andValcárcel, J. (2002) Optimization of oligonucleotide-basedDNA microarrays. Nucleic Acids Res 30: e51.
Robertson, L.W., and Hansen, L.G. (eds) (2001). PCBs.Recent Advances in Environmental Toxicology and HealthEffects. Lexington, Kentucky: The University Press ofKentucky.
Rodrigues, J.L.M., Maltseva, O.V., Tsoi, T.V., Helton, R.R.,Quensen, J.F., III, Fukuda, M., and Tiedje, J.M. (2001)Development of a Rhodococcus recombinant strain fordegradation of products from anaerobic dechlorination ofPCBs. Environ Sci Technol 35: 663–668.
Rodrigues, J.L.M., Aiello, M.R., Urbance, J.W., Tsoi, T.V.,and Tiedje, J.M. (2002) Use of both 16S rRNA and engi-neered functional genes with real-time PCR to quantify anengineered, PCB-degrading Rhodococcus in soil. J MicrobMeth 51: 181–189.
Sambrook, J., and Russell, D.W. (2001) Molecular Cloning:a Laboratory Manual. Cold Spring Harbor LaboratoryPress, Cold Spring Harbor, NY.
Santo Domingo, J.W., Kaufman, M.G., Klug, M.J., Holben,W.E., Harris, D., and Tiedje, J.M. (1998) Influence of dieton the structure and function of the bacterial hindgut com-munity of crickets. Mol Ecol 7: 761–767.
Seto, M., Kimbara, K., Shimura, M., Hatta, T., Fukuda, M.,and Yano, K. (1995) A novel transformation of polychlori-nated biphenyls by by Rhodococcus sp. strain RHA1. ApplEnviron Microbiol 61: 3353–3358.
Stingley, S.W., Garcia Ramirez, J.J., Aguilar, S.A., Simmen,K., Sandri-Goldin, R.M., Ghazal, P., and Wagner, E.K.(2000) Global analysis of herpes simplex virus type 1 tran-scription using an oligonucleotide-based DNA microarray.J Virol 74: 9916–9927.
Talaat, A., Howard, S., Hale, I.V.W., Lyons, R., Garner, H.,and Johnston, S. (2002) Genomic standards for geneexpression profiling in Mycobacterium tuberculosis.Nucleic Acids Res 30: e104.
Tsoi, T.V., Plotnikova, E.G., Cole, J.R., Guerin, W.F., Bag-dasarian, M., and Tiedje, J.M. (1999) Cloning, expression,and nucleotide sequence of the Pseudomonas aeruginosa142 ohb genes coding for oxygenolytic ortho dehalogena-tion of halobenzoates. Appl Environ Microbiol 65: 2151–2162.
Ye, R.W., Wang, T., Bedzyk, L., and Croker, K.M. (2001)Applications of DNA microarrays in microbial systems. JMicrobiol Meth 47: 257–272.
Whittaker, C.J., Klier, C.M., and Kolenbrander, P.E. (1996)Mechanisms of adhesion by oral bacteria. Annu Rev Micro-biol 50: 513–552.
Wilson, K.H., Wilson, W.J., Radosevich, J.L., DeSantis, T.Z.,Viswanathan, V.S., Kuczmarski, T.A., and Andersen, G.L.(2002) High-density microarray of small-subunit ribosomalDNA probes. Appl Envir Microbiol 68: 2535–2541.
Wu, L., Thompson, D., Li, G., Hurt, R., Tiedje, J.M., andZhou, J. (2002) Development and evaluation of functionalgene arrays for detection of selected genes in the environ-ment. Appl Envir Microbiol 67: 5780–5790.
Zaitsev, G.M., and Karasevich, Y.N. (1985) Primary steps inmetabolism of 4-chlorobenzoate in Arthrobacter globifor-mis. Mikrobiologiya 50: 423–428 (in Russian).
Zhou, J., Xia, B., Treves, D.S., Wu, L.-Y., Marsh, T.L., O’Neill,R.V., Palumbo, A.V., and Tiedje, J.M. (2002) Spatial andresource factors influencing high microbial diversity in soil.Appl Envir Microbiol 68: 326–334.
All in-text references underlined in blue are linked to publications on ResearchGate, letting you access and read them immediately.