Reproducibility of Fluorescent Expression from Engineered ...
Upload
delegacinprovincialdeeducacincienciayculturadecuencaCategory
view
0download
0
BioMed CentralBMC Genomics
ss
Open AcceResearch articleCross-species analysis of gene expression in non-model mammals: reproducibility of hybridization on high density oligonucleotide microarraysManuel Nieto-Díaz*1,2, Wolfgang Pita-Thomas1 and Manuel Nieto-Sampedro1,2Address: 1Neural Plasticity Department, Instituto de Neurobiología Ramón y Cajal (CSIC), Avda. Doctor Arce 37, 28002 Madrid, Spain and 2Experimental Neurology Unit, Hospital Nacional de Parapléjicos (SESCAM), Ctra. La Peraleda s/n, 45071 Toledo, Spain
Email: Manuel Nieto-Díaz* - [email protected]; Wolfgang Pita-Thomas - [email protected]; Manuel Nieto-Sampedro - [email protected]
* Corresponding author
AbstractBackground: Gene expression profiles of non-model mammals may provide valuable data for biomedicaland evolutionary studies. However, due to lack of sequence information of other species, DNAmicroarrays are currently restricted to humans and a few model species. This limitation may be overcomeby using arrays developed for a given species to analyse gene expression in a related one, an approachknown as "cross-species analysis". In spite of its potential usefulness, the accuracy and reproducibility ofthe gene expression measures obtained in this way are still open to doubt. The present study examineswhether or not hybridization values from cross-species analyses are as reproducible as those from same-species analyses when using Affymetrix oligonucleotide microarrays.
Results: The reproducibility of the probe data obtained hybridizing deer, Old-World primates, and humanRNA samples to Affymetrix human GeneChip® U133 Plus 2.0 was compared. The results show that cross-species hybridization affected neither the distribution of the hybridization reproducibility among differentcategories, nor the reproducibility values of the individual probes. Our analyses also show that a 0.5% ofthe probes analysed in the U133 plus 2.0 GeneChip are significantly associated to un-reproduciblehybridizations. Such probes-called in the text un-reproducible probe sequences- do not increase innumber in cross-species analyses.
Conclusion: Our study demonstrates that cross-species analyses do not significantly affect hybridizationreproducibility of GeneChips, at least within the range of the mammal species analysed here. Thedifferences in reproducibility between same-species and cross-species analyses observed in previousstudies were probably caused by the analytical methods used to calculate the gene expression measures.Together with previous observations on the accuracy of GeneChips for cross-species analysis, ouranalyses demonstrate that cross-species hybridizations may provide useful gene expression data.However, the reproducibility and accuracy of these measures largely depends on the use of appropriatedalgorithms to derive the gene expression data from the probe data. Also, the identification of probesassociated to un-reproducible hybridizations-useless for gene expression analyses- in the studiedGeneChip, stress the need of a re-evaluation of the probes' performance.
Published: 3 April 2007
BMC Genomics 2007, 8:89 doi:10.1186/1471-2164-8-89
Received: 5 September 2006Accepted: 3 April 2007
This article is available from: http://www.biomedcentral.com/1471-2164/8/89
© 2007 Nieto-Díaz et al; licensee BioMed Central Ltd. This is an Open Access article distributed under the terms of the Creative Commons Attribution License (http://creativecommons.org/licenses/by/2.0), which permits unrestricted use, distribution, and reproduction in any medium, provided the original work is properly cited.
Page 1 of 18(page number not for citation purposes)
BMC Genomics 2007, 8:89 http://www.biomedcentral.com/1471-2164/8/89
BackgroundDNA microarray technology is a basic tool to measuregenomewide changes in gene expression. Microarray anal-ysis of gene expression in non-model mammals may pro-vide very valuable data for biomedical [1-3] orevolutionary [4-7] studies. However, DNA microarrays arecurrently restricted to humans and a few model species,due to lack of sequence information for other species. Thislimitation could be overcome by using arrays developedfor a given species to analyse gene expression in a relatedone [4,8-12]. This approach, known as "cross-speciesanalysis", assumes that the RNA transcripts for one specieswill hybridize efficiently with the arrayed sequences ofanother species, provided that both species share enoughsequence similarity (over 95% in orthologous 3'-UTRsequences according to Nagpal et al. [10]). The cross-spe-cies approach has been employed in several studies inmammals, using human microarrays to analyse closelyrelated species, such as chimpanzees, orangutans andother primates [4], as well as more distantly related spe-cies, such as pigs, cows or dogs [8,9]. These studies assumethat the short time of divergence between mammals (lessthat 100 million years) and the preservation of their pro-tein function assures enough nucleotide-sequence conser-vation among species [9].
Among the existing DNA array platforms, Affymetrixhigh-density oligonucleotide GeneChips® (Affymetrix,Santa Clara, CA, USA) have been repeatedly employed forcross-species analyses. GeneChips estimate gene expres-sion measures-like the presence and abundance of a tran-script- by applying analytical methods to thehybridization values of sets of 11 to 20 pairs of probes(probesets) for each transcript [13]. Each probe pair con-sists of a 25 bases long perfect match probe (PM), fullycomplementary to the target, and a 25 bases long mis-match probe (MM), that shares only 24 bases with the tar-get sequence. The large number of probes per target usedby Affymetrix microarrays represents an advantage forcross species analyses with respect to other microarrayplatforms, such as those based on cDNA probes. The pres-ence of 11 to 20 probes per target increases the probabilityof having probes with enough sequence similarity withthe target transcript to obtain a feasible measure of itsexpression [9]. In contrast, the long sequence probes incDNA microarrays may favour the hybridization withorthologous genes from other species compared to the 25bases long Affymetrix probes. Genechips also have theadvantage of allowing worldwide researchers to access thesame standardized arrays, the same sample processingmethods, and the same image acquisition instruments toquantify gene expression.
Despite the potential usefulness of cross-species analyses,the quality of the gene expression measures obtained in
this way is open to doubt. Two aspects of measurementquality appear as most important i) the accuracy of themeasurement-the agreement between the observed andthe true value of a measure; termed validity in statisticalterminology-, and ii) the reproducibility (or precision;also called reliability in statistical jargon) of the measure-ment, i.e. whether repeated measurements will give simi-lar values [14]. Different authors have examined bothaspects of cross-species analyses using Affymetrix Gene-Chips, reaching diverse conclusions [9,10,15-17]. There isa general agreement in that the array sensitivity and, thus,the accuracy of the analysis, decreases with increasingsequence differences between the species being analyzedand the array species [9,15,16]. In a practical sense, thisimplies that cross-species analyses yield significantly morefalse negatives-genes that appear not to be expressedalthough they are really being expressed- than same-spe-cies analyses. This point was clearly illustrated by Chismarand co-workers [15] showing that the number of detectedtranscripts by a human GeneChip were a 50% lower whenanalysing Macaca samples than when analysing humansamples. Accordingly, various authors have developedspecific methods to correct the sensitivity reduction ofcross-species analysis [9,10,16].
Data reproducibility has received less attention despitethe fact that it is not possible to achieve accuracy in indi-vidual measurements if these measurements are associ-ated to high variability. The percentage of transcripts thatcan be consistently detected as present (according to anAffymetrix algorithm [13]) across replicates is signifi-cantly reduced when Macaca RNA samples were hybrid-ized to the Affymetrix Hu95Av5 human GeneChip, thanwhen human RNA samples were hybridized to this chip[15]. A similar reduction in reproducibility of the presentcalls was observed by Wang et al. [17] when analysingMacaca and Pan samples with human GeneChips. In con-trast, Dillman and Phillips [18] observed no reproducibil-ity differences when the gene expression data generated byhybridizing human, Chlorocebus and Macaca RNA samplesto the Affymetrix U133 plus 2.0 human GeneChip werecompared, in agreement with previous observations fromcross-species analyses using cDNA microarrays [8,19].What is the real effect of cross-species analyses on thereproducibility of Affymetrix hybridization data? Toexplain these apparently contradictory results, we hypoth-esized that hybridization values were equally reproduci-ble in cross-species and same-species analyses at leastwhen restricted to mammals, and that contradictionsarose from differences in the way gene expression meas-ures were derived from the hybridization data of theAffymetrix probes.
To test these hypotheses, we have compared the reproduc-ibility of hybridization data from different mammal sam-
Page 2 of 18(page number not for citation purposes)
BMC Genomics 2007, 8:89 http://www.biomedcentral.com/1471-2164/8/89
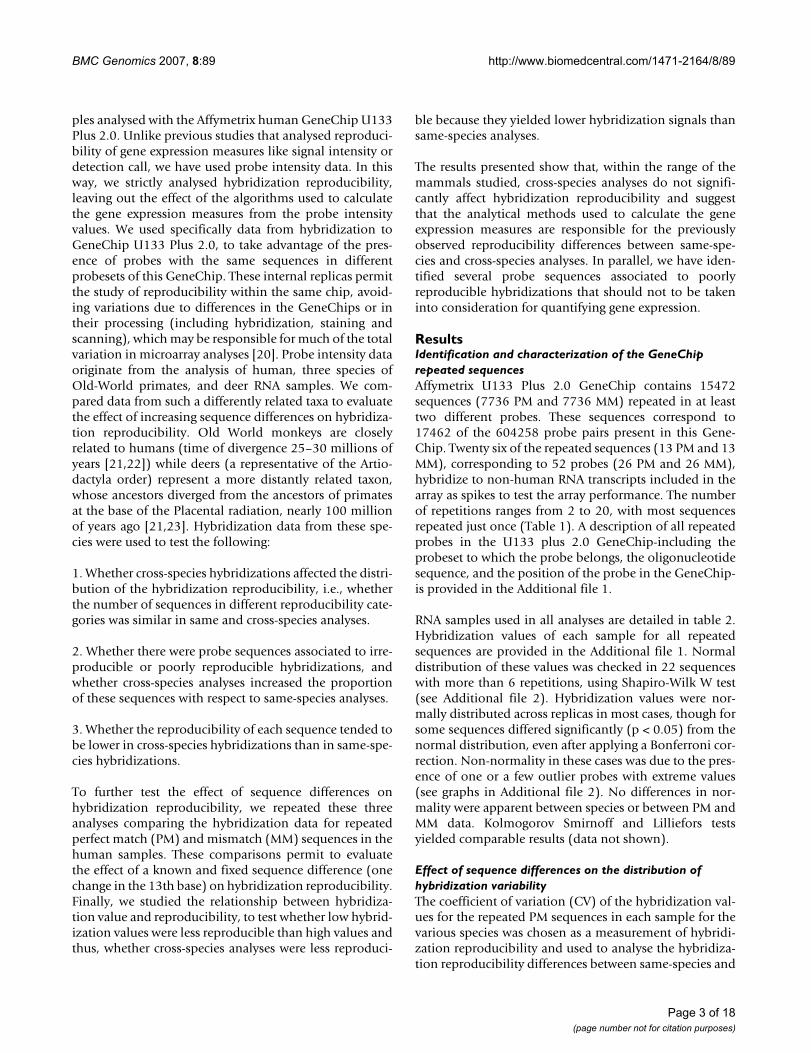
ples analysed with the Affymetrix human GeneChip U133Plus 2.0. Unlike previous studies that analysed reproduci-bility of gene expression measures like signal intensity ordetection call, we have used probe intensity data. In thisway, we strictly analysed hybridization reproducibility,leaving out the effect of the algorithms used to calculatethe gene expression measures from the probe intensityvalues. We used specifically data from hybridization toGeneChip U133 Plus 2.0, to take advantage of the pres-ence of probes with the same sequences in differentprobesets of this GeneChip. These internal replicas permitthe study of reproducibility within the same chip, avoid-ing variations due to differences in the GeneChips or intheir processing (including hybridization, staining andscanning), which may be responsible for much of the totalvariation in microarray analyses [20]. Probe intensity dataoriginate from the analysis of human, three species ofOld-World primates, and deer RNA samples. We com-pared data from such a differently related taxa to evaluatethe effect of increasing sequence differences on hybridiza-tion reproducibility. Old World monkeys are closelyrelated to humans (time of divergence 25–30 millions ofyears [21,22]) while deers (a representative of the Artio-dactyla order) represent a more distantly related taxon,whose ancestors diverged from the ancestors of primatesat the base of the Placental radiation, nearly 100 millionof years ago [21,23]. Hybridization data from these spe-cies were used to test the following:
1. Whether cross-species hybridizations affected the distri-bution of the hybridization reproducibility, i.e., whetherthe number of sequences in different reproducibility cate-gories was similar in same and cross-species analyses.
2. Whether there were probe sequences associated to irre-producible or poorly reproducible hybridizations, andwhether cross-species analyses increased the proportionof these sequences with respect to same-species analyses.
3. Whether the reproducibility of each sequence tended tobe lower in cross-species hybridizations than in same-spe-cies hybridizations.
To further test the effect of sequence differences onhybridization reproducibility, we repeated these threeanalyses comparing the hybridization data for repeatedperfect match (PM) and mismatch (MM) sequences in thehuman samples. These comparisons permit to evaluatethe effect of a known and fixed sequence difference (onechange in the 13th base) on hybridization reproducibility.Finally, we studied the relationship between hybridiza-tion value and reproducibility, to test whether low hybrid-ization values were less reproducible than high values andthus, whether cross-species analyses were less reproduci-
ble because they yielded lower hybridization signals thansame-species analyses.
The results presented show that, within the range of themammals studied, cross-species analyses do not signifi-cantly affect hybridization reproducibility and suggestthat the analytical methods used to calculate the geneexpression measures are responsible for the previouslyobserved reproducibility differences between same-spe-cies and cross-species analyses. In parallel, we have iden-tified several probe sequences associated to poorlyreproducible hybridizations that should not to be takeninto consideration for quantifying gene expression.
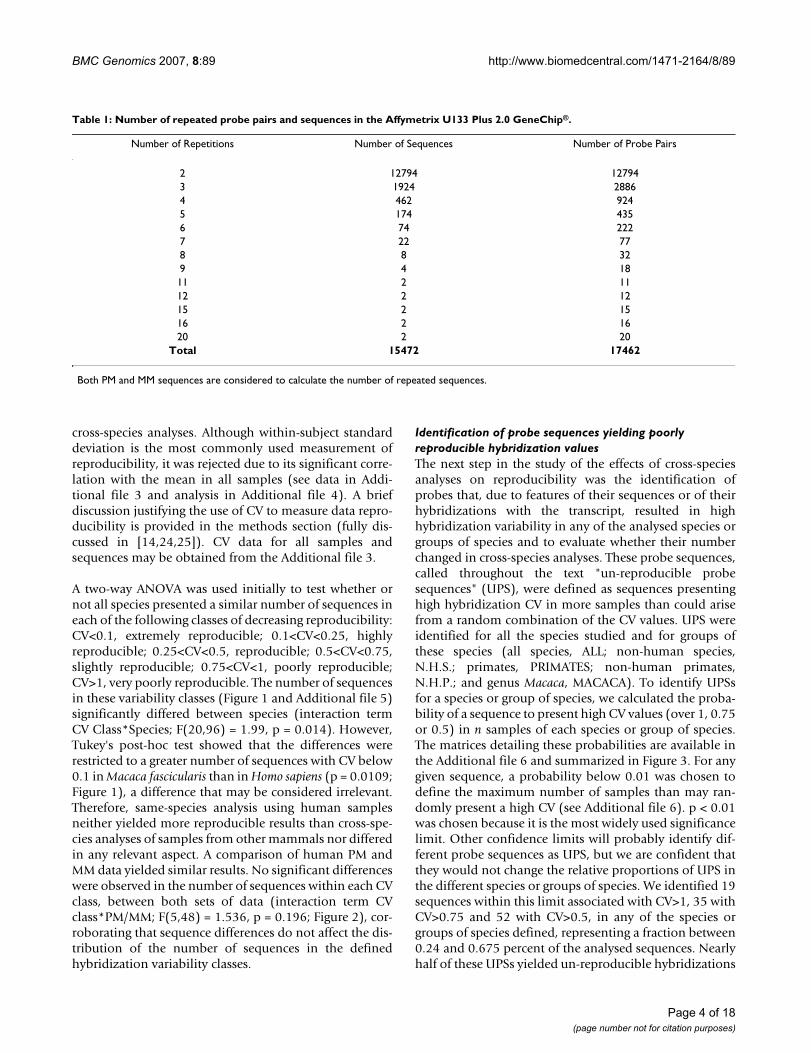
ResultsIdentification and characterization of the GeneChip repeated sequencesAffymetrix U133 Plus 2.0 GeneChip contains 15472sequences (7736 PM and 7736 MM) repeated in at leasttwo different probes. These sequences correspond to17462 of the 604258 probe pairs present in this Gene-Chip. Twenty six of the repeated sequences (13 PM and 13MM), corresponding to 52 probes (26 PM and 26 MM),hybridize to non-human RNA transcripts included in thearray as spikes to test the array performance. The numberof repetitions ranges from 2 to 20, with most sequencesrepeated just once (Table 1). A description of all repeatedprobes in the U133 plus 2.0 GeneChip-including theprobeset to which the probe belongs, the oligonucleotidesequence, and the position of the probe in the GeneChip-is provided in the Additional file 1.
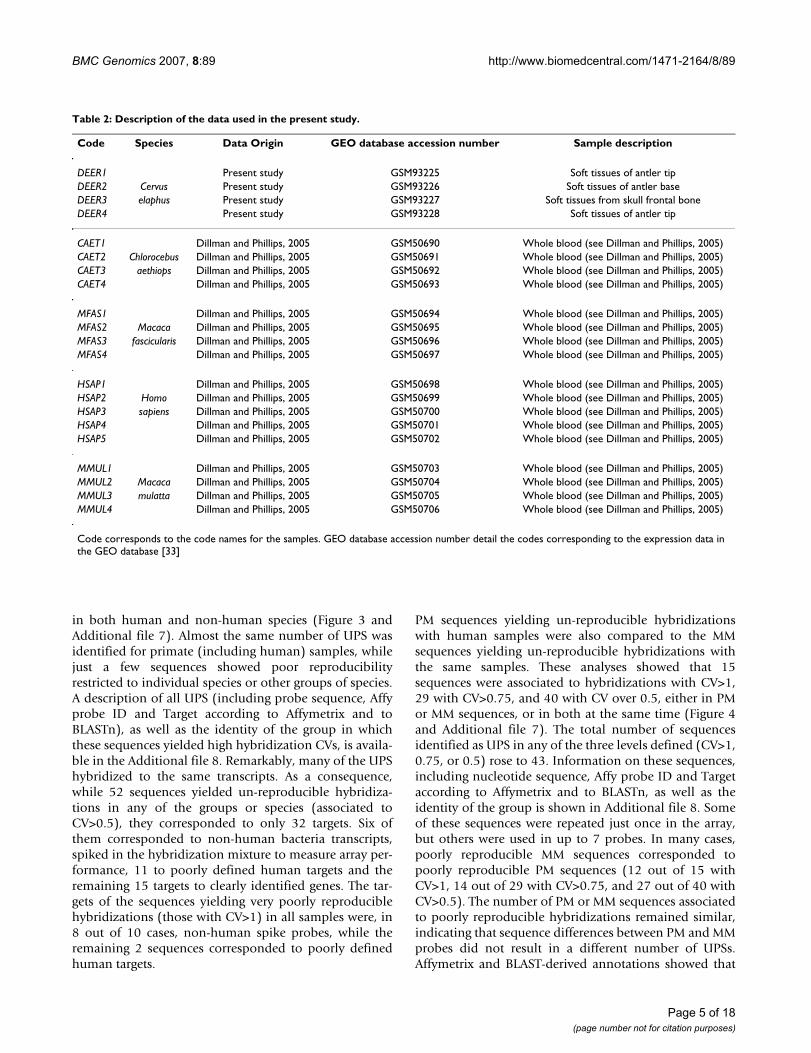
RNA samples used in all analyses are detailed in table 2.Hybridization values of each sample for all repeatedsequences are provided in the Additional file 1. Normaldistribution of these values was checked in 22 sequenceswith more than 6 repetitions, using Shapiro-Wilk W test(see Additional file 2). Hybridization values were nor-mally distributed across replicas in most cases, though forsome sequences differed significantly (p < 0.05) from thenormal distribution, even after applying a Bonferroni cor-rection. Non-normality in these cases was due to the pres-ence of one or a few outlier probes with extreme values(see graphs in Additional file 2). No differences in nor-mality were apparent between species or between PM andMM data. Kolmogorov Smirnoff and Lilliefors testsyielded comparable results (data not shown).
Effect of sequence differences on the distribution of hybridization variabilityThe coefficient of variation (CV) of the hybridization val-ues for the repeated PM sequences in each sample for thevarious species was chosen as a measurement of hybridi-zation reproducibility and used to analyse the hybridiza-tion reproducibility differences between same-species and
Page 3 of 18(page number not for citation purposes)
BMC Genomics 2007, 8:89 http://www.biomedcentral.com/1471-2164/8/89
cross-species analyses. Although within-subject standarddeviation is the most commonly used measurement ofreproducibility, it was rejected due to its significant corre-lation with the mean in all samples (see data in Addi-tional file 3 and analysis in Additional file 4). A briefdiscussion justifying the use of CV to measure data repro-ducibility is provided in the methods section (fully dis-cussed in [14,24,25]). CV data for all samples andsequences may be obtained from the Additional file 3.
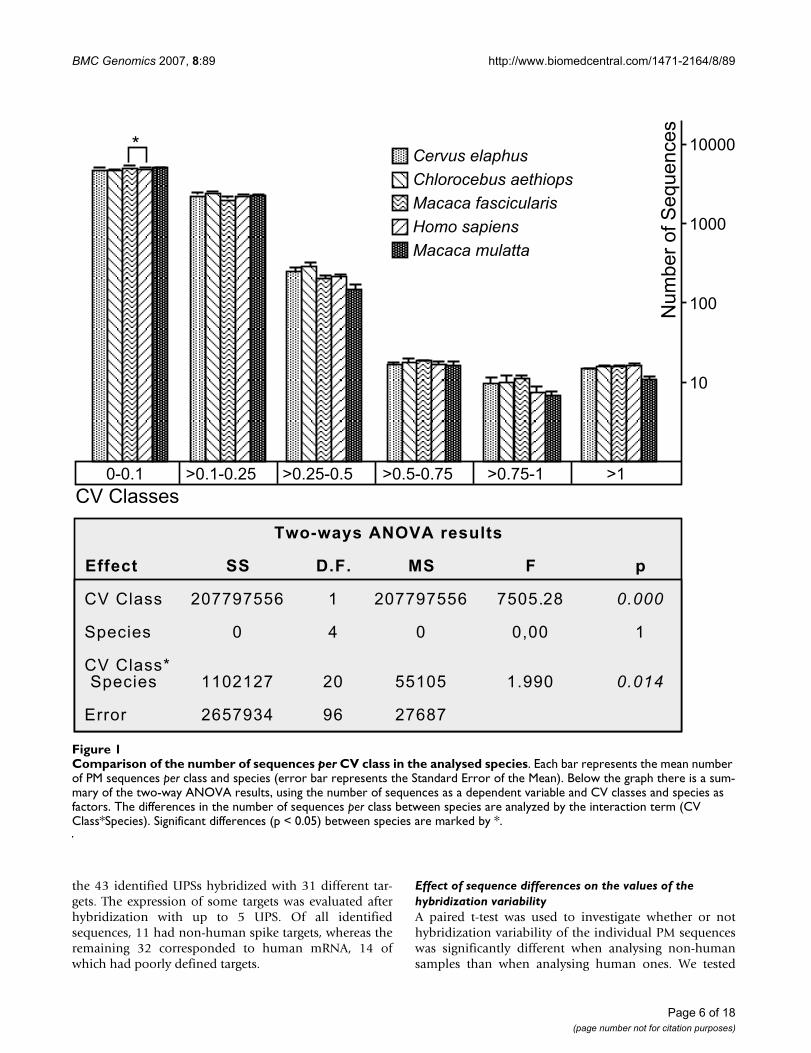
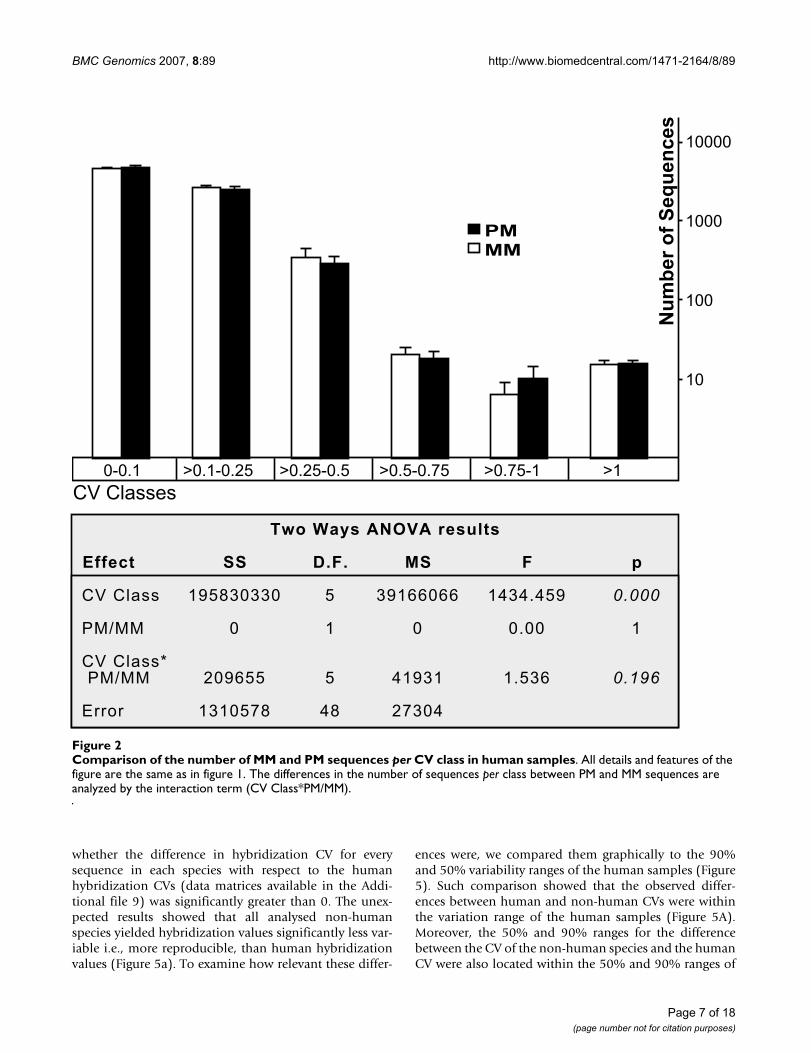
A two-way ANOVA was used initially to test whether ornot all species presented a similar number of sequences ineach of the following classes of decreasing reproducibility:CV<0.1, extremely reproducible; 0.1<CV<0.25, highlyreproducible; 0.25<CV<0.5, reproducible; 0.5<CV<0.75,slightly reproducible; 0.75<CV<1, poorly reproducible;CV>1, very poorly reproducible. The number of sequencesin these variability classes (Figure 1 and Additional file 5)significantly differed between species (interaction termCV Class*Species; F(20,96) = 1.99, p = 0.014). However,Tukey's post-hoc test showed that the differences wererestricted to a greater number of sequences with CV below0.1 in Macaca fascicularis than in Homo sapiens (p = 0.0109;Figure 1), a difference that may be considered irrelevant.Therefore, same-species analysis using human samplesneither yielded more reproducible results than cross-spe-cies analyses of samples from other mammals nor differedin any relevant aspect. A comparison of human PM andMM data yielded similar results. No significant differenceswere observed in the number of sequences within each CVclass, between both sets of data (interaction term CVclass*PM/MM; F(5,48) = 1.536, p = 0.196; Figure 2), cor-roborating that sequence differences do not affect the dis-tribution of the number of sequences in the definedhybridization variability classes.
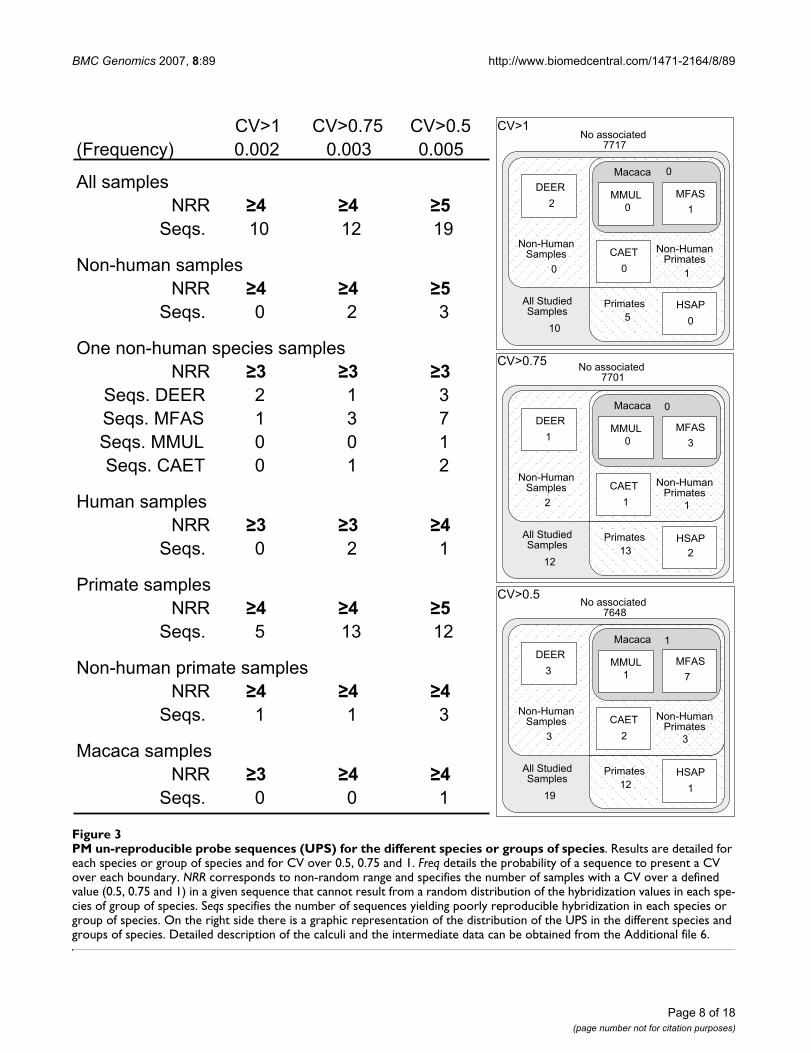
Identification of probe sequences yielding poorly reproducible hybridization valuesThe next step in the study of the effects of cross-speciesanalyses on reproducibility was the identification ofprobes that, due to features of their sequences or of theirhybridizations with the transcript, resulted in highhybridization variability in any of the analysed species orgroups of species and to evaluate whether their numberchanged in cross-species analyses. These probe sequences,called throughout the text "un-reproducible probesequences" (UPS), were defined as sequences presentinghigh hybridization CV in more samples than could arisefrom a random combination of the CV values. UPS wereidentified for all the species studied and for groups ofthese species (all species, ALL; non-human species,N.H.S.; primates, PRIMATES; non-human primates,N.H.P.; and genus Macaca, MACACA). To identify UPSsfor a species or group of species, we calculated the proba-bility of a sequence to present high CV values (over 1, 0.75or 0.5) in n samples of each species or group of species.The matrices detailing these probabilities are available inthe Additional file 6 and summarized in Figure 3. For anygiven sequence, a probability below 0.01 was chosen todefine the maximum number of samples than may ran-domly present a high CV (see Additional file 6). p < 0.01was chosen because it is the most widely used significancelimit. Other confidence limits will probably identify dif-ferent probe sequences as UPS, but we are confident thatthey would not change the relative proportions of UPS inthe different species or groups of species. We identified 19sequences within this limit associated with CV>1, 35 withCV>0.75 and 52 with CV>0.5, in any of the species orgroups of species defined, representing a fraction between0.24 and 0.675 percent of the analysed sequences. Nearlyhalf of these UPSs yielded un-reproducible hybridizations
Table 1: Number of repeated probe pairs and sequences in the Affymetrix U133 Plus 2.0 GeneChip®.
Number of Repetitions Number of Sequences Number of Probe Pairs
2 12794 127943 1924 28864 462 9245 174 4356 74 2227 22 778 8 329 4 1811 2 1112 2 1215 2 1516 2 1620 2 20
Total 15472 17462
Both PM and MM sequences are considered to calculate the number of repeated sequences.
Page 4 of 18(page number not for citation purposes)
BMC Genomics 2007, 8:89 http://www.biomedcentral.com/1471-2164/8/89
in both human and non-human species (Figure 3 andAdditional file 7). Almost the same number of UPS wasidentified for primate (including human) samples, whilejust a few sequences showed poor reproducibilityrestricted to individual species or other groups of species.A description of all UPS (including probe sequence, Affyprobe ID and Target according to Affymetrix and toBLASTn), as well as the identity of the group in whichthese sequences yielded high hybridization CVs, is availa-ble in the Additional file 8. Remarkably, many of the UPShybridized to the same transcripts. As a consequence,while 52 sequences yielded un-reproducible hybridiza-tions in any of the groups or species (associated toCV>0.5), they corresponded to only 32 targets. Six ofthem corresponded to non-human bacteria transcripts,spiked in the hybridization mixture to measure array per-formance, 11 to poorly defined human targets and theremaining 15 targets to clearly identified genes. The tar-gets of the sequences yielding very poorly reproduciblehybridizations (those with CV>1) in all samples were, in8 out of 10 cases, non-human spike probes, while theremaining 2 sequences corresponded to poorly definedhuman targets.
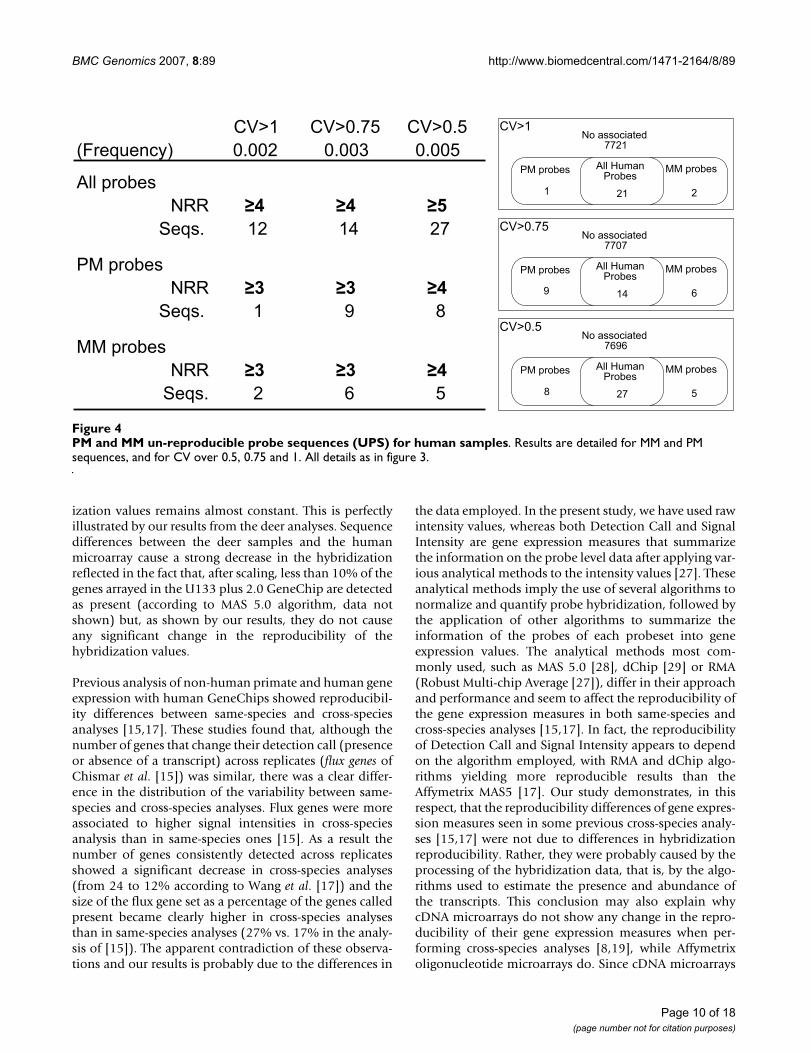
PM sequences yielding un-reproducible hybridizationswith human samples were also compared to the MMsequences yielding un-reproducible hybridizations withthe same samples. These analyses showed that 15sequences were associated to hybridizations with CV>1,29 with CV>0.75, and 40 with CV over 0.5, either in PMor MM sequences, or in both at the same time (Figure 4and Additional file 7). The total number of sequencesidentified as UPS in any of the three levels defined (CV>1,0.75, or 0.5) rose to 43. Information on these sequences,including nucleotide sequence, Affy probe ID and Targetaccording to Affymetrix and to BLASTn, as well as theidentity of the group is shown in Additional file 8. Someof these sequences were repeated just once in the array,but others were used in up to 7 probes. In many cases,poorly reproducible MM sequences corresponded topoorly reproducible PM sequences (12 out of 15 withCV>1, 14 out of 29 with CV>0.75, and 27 out of 40 withCV>0.5). The number of PM or MM sequences associatedto poorly reproducible hybridizations remained similar,indicating that sequence differences between PM and MMprobes did not result in a different number of UPSs.Affymetrix and BLAST-derived annotations showed that
Table 2: Description of the data used in the present study.
Code Species Data Origin GEO database accession number Sample description
DEER1 Present study GSM93225 Soft tissues of antler tipDEER2 Cervus Present study GSM93226 Soft tissues of antler baseDEER3 elaphus Present study GSM93227 Soft tissues from skull frontal boneDEER4 Present study GSM93228 Soft tissues of antler tip
CAET1 Dillman and Phillips, 2005 GSM50690 Whole blood (see Dillman and Phillips, 2005)CAET2 Chlorocebus Dillman and Phillips, 2005 GSM50691 Whole blood (see Dillman and Phillips, 2005)CAET3 aethiops Dillman and Phillips, 2005 GSM50692 Whole blood (see Dillman and Phillips, 2005)CAET4 Dillman and Phillips, 2005 GSM50693 Whole blood (see Dillman and Phillips, 2005)
MFAS1 Dillman and Phillips, 2005 GSM50694 Whole blood (see Dillman and Phillips, 2005)MFAS2 Macaca Dillman and Phillips, 2005 GSM50695 Whole blood (see Dillman and Phillips, 2005)MFAS3 fascicularis Dillman and Phillips, 2005 GSM50696 Whole blood (see Dillman and Phillips, 2005)MFAS4 Dillman and Phillips, 2005 GSM50697 Whole blood (see Dillman and Phillips, 2005)
HSAP1 Dillman and Phillips, 2005 GSM50698 Whole blood (see Dillman and Phillips, 2005)HSAP2 Homo Dillman and Phillips, 2005 GSM50699 Whole blood (see Dillman and Phillips, 2005)HSAP3 sapiens Dillman and Phillips, 2005 GSM50700 Whole blood (see Dillman and Phillips, 2005)HSAP4 Dillman and Phillips, 2005 GSM50701 Whole blood (see Dillman and Phillips, 2005)HSAP5 Dillman and Phillips, 2005 GSM50702 Whole blood (see Dillman and Phillips, 2005)
MMUL1 Dillman and Phillips, 2005 GSM50703 Whole blood (see Dillman and Phillips, 2005)MMUL2 Macaca Dillman and Phillips, 2005 GSM50704 Whole blood (see Dillman and Phillips, 2005)MMUL3 mulatta Dillman and Phillips, 2005 GSM50705 Whole blood (see Dillman and Phillips, 2005)MMUL4 Dillman and Phillips, 2005 GSM50706 Whole blood (see Dillman and Phillips, 2005)
Code corresponds to the code names for the samples. GEO database accession number detail the codes corresponding to the expression data in the GEO database [33]
Page 5 of 18(page number not for citation purposes)
BMC Genomics 2007, 8:89 http://www.biomedcentral.com/1471-2164/8/89
the 43 identified UPSs hybridized with 31 different tar-gets. The expression of some targets was evaluated afterhybridization with up to 5 UPS. Of all identifiedsequences, 11 had non-human spike targets, whereas theremaining 32 corresponded to human mRNA, 14 ofwhich had poorly defined targets.
Effect of sequence differences on the values of the hybridization variabilityA paired t-test was used to investigate whether or nothybridization variability of the individual PM sequenceswas significantly different when analysing non-humansamples than when analysing human ones. We tested
Comparison of the number of sequences per CV class in the analysed speciesFigure 1Comparison of the number of sequences per CV class in the analysed species. Each bar represents the mean number of PM sequences per class and species (error bar represents the Standard Error of the Mean). Below the graph there is a sum-mary of the two-way ANOVA results, using the number of sequences as a dependent variable and CV classes and species as factors. The differences in the number of sequences per class between species are analyzed by the interaction term (CV Class*Species). Significant differences (p < 0.05) between species are marked by *.
>0.1-0.250-0.1 >0.25-0.5 >0.5-0.75 >0.75-1 >1CV Classes
10
100
1000
10000
Num
ber o
f Seq
uenc
es
Chlorocebus aethiopsMacaca fascicularis
Cervus elaphus
Homo sapiensMacaca mulatta
*
Two-ways ANOVA results
Effect SS D.F. MS F p
CV Class 207797556 1 207797556 7505.28 0.000
Species 0 4 0 0,00 1
CV Class* Species 1102127 20 55105 1.990 0.014
Error 2657934 96 27687
Page 6 of 18(page number not for citation purposes)
BMC Genomics 2007, 8:89 http://www.biomedcentral.com/1471-2164/8/89
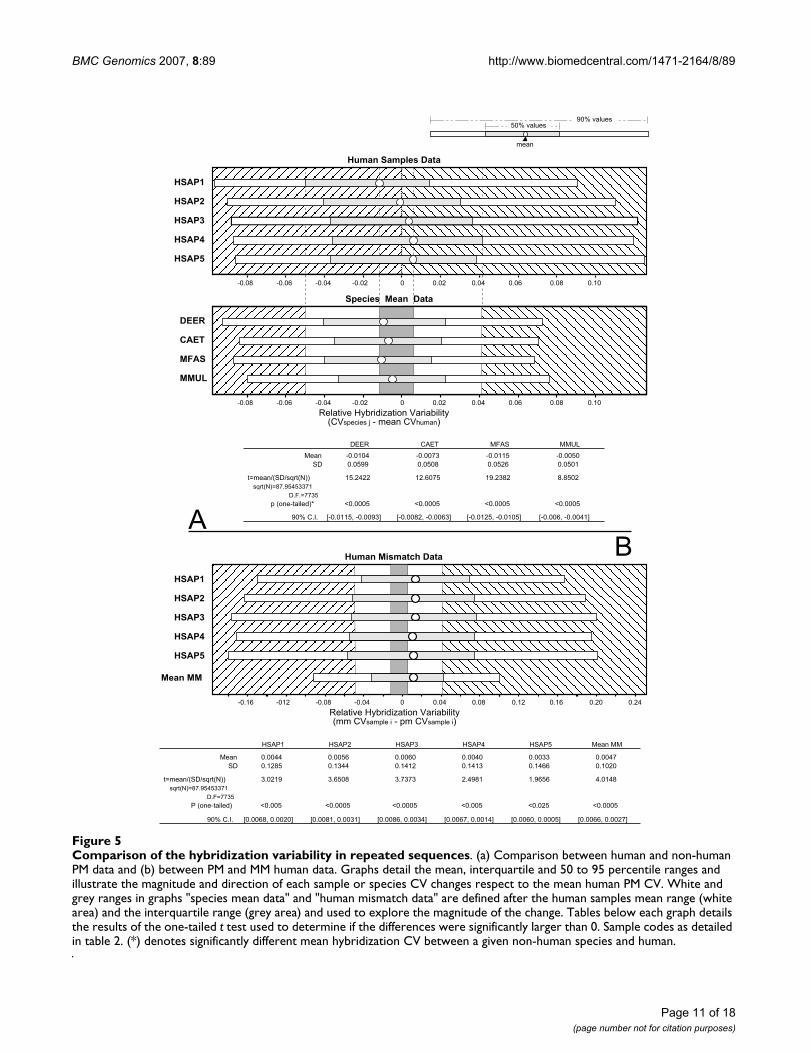
whether the difference in hybridization CV for everysequence in each species with respect to the humanhybridization CVs (data matrices available in the Addi-tional file 9) was significantly greater than 0. The unex-pected results showed that all analysed non-humanspecies yielded hybridization values significantly less var-iable i.e., more reproducible, than human hybridizationvalues (Figure 5a). To examine how relevant these differ-
ences were, we compared them graphically to the 90%and 50% variability ranges of the human samples (Figure5). Such comparison showed that the observed differ-ences between human and non-human CVs were withinthe variation range of the human samples (Figure 5A).Moreover, the 50% and 90% ranges for the differencebetween the CV of the non-human species and the humanCV were also located within the 50% and 90% ranges of
Comparison of the number of MM and PM sequences per CV class in human samplesFigure 2Comparison of the number of MM and PM sequences per CV class in human samples. All details and features of the figure are the same as in figure 1. The differences in the number of sequences per class between PM and MM sequences are analyzed by the interaction term (CV Class*PM/MM).
>0.1-0.250-0.1 >0.25-0.5 >0.5-0.75 >0.75-1 >1CV Classes
10
100
1000
10000
Num
ber o
f Seq
uenc
es
Two Ways ANOVA results
Effect SS D.F. MS F p
CV Class 195830330 5 39166066 1434.459 0.000
PM/MM 0 1 0 0.00 1
CV Class* PM/MM 209655 5 41931 1.536 0.196
Error 1310578 48 27304
PMMM
Page 7 of 18(page number not for citation purposes)
BMC Genomics 2007, 8:89 http://www.biomedcentral.com/1471-2164/8/89
Page 8 of 18(page number not for citation purposes)
PM un-reproducible probe sequences (UPS) for the different species or groups of speciesFigure 3PM un-reproducible probe sequences (UPS) for the different species or groups of species. Results are detailed for each species or group of species and for CV over 0.5, 0.75 and 1. Freq details the probability of a sequence to present a CV over each boundary. NRR corresponds to non-random range and specifies the number of samples with a CV over a defined value (0.5, 0.75 and 1) in a given sequence that cannot result from a random distribution of the hybridization values in each spe-cies of group of species. Seqs specifies the number of sequences yielding poorly reproducible hybridization in each species or group of species. On the right side there is a graphic representation of the distribution of the UPS in the different species and groups of species. Detailed description of the calculi and the intermediate data can be obtained from the Additional file 6.
CV>1 CV>0.75 CV>0.5(Frequency) 0.002 0.003 0.005
All samplesNRR
Seqs. 10 12 19
Non-human samplesNRR
Seqs. 0 2 3
One non-human species samplesNRR
Seqs. DEER 2 1 3Seqs. MFAS 1 3 7Seqs. MMUL 0 0 1Seqs. CAET 0 1 2
Human samplesNRR
Seqs. 0 2 1
Primate samplesNRR
Seqs. 5 13 12
Non-human primate samplesNRR
Seqs. 1 1 3
Macaca samplesNRR
Seqs. 0 0 1
PrimatesAll StudiedSamples
Non-HumanSamples Non-Human
Primates
CV>1
0 1
510
No associated7717
Macaca 0
MFAS1
MMUL0
CAET0
HSAP0
DEER2
PrimatesAll StudiedSamples
Non-HumanSamples Non-Human
Primates2 1
1312
Macaca 0
MFAS3
MMUL0
CAET1
HSAP2
DEER1
PrimatesAll StudiedSamples
Non-HumanSamples Non-Human
Primates3 3
1219
Macaca 1
MFAS7
MMUL1
CAET2
HSAP1
DEER3
CV>0.75 No associated7701
CV>0.5No associated
7648
BMC Genomics 2007, 8:89 http://www.biomedcentral.com/1471-2164/8/89
the human samples. Taken together, these results indicatethat hybridization of non-human samples to the humanprobes was not less reproducible than hybridization ofhuman samples. The observed differences in reproducibil-ity may be considered trivial when compared to the inter-nal variation of the human hybridizations. However, acomparison of the human PM and MM hybridization var-iability yielded a totally different result. All MM and PMcomparisons-either mean or individual sample data-showthat MM hybridizations were significantly more variable(less reproducible) than PM ones (see Figure 5b). Moreo-ver, a graphic comparison of MM mean values and rangeswith the corresponding PM values shows that MM hybrid-ization variability was in all cases undoubtedly greaterthan PM hybridization variability and well beyond theranges defined by the human PM samples. Thus, it seemsthat the sequence differences of MM probes cause a signif-icant and appreciable decrease in hybridization reproduc-ibility with respect to the PM probes.
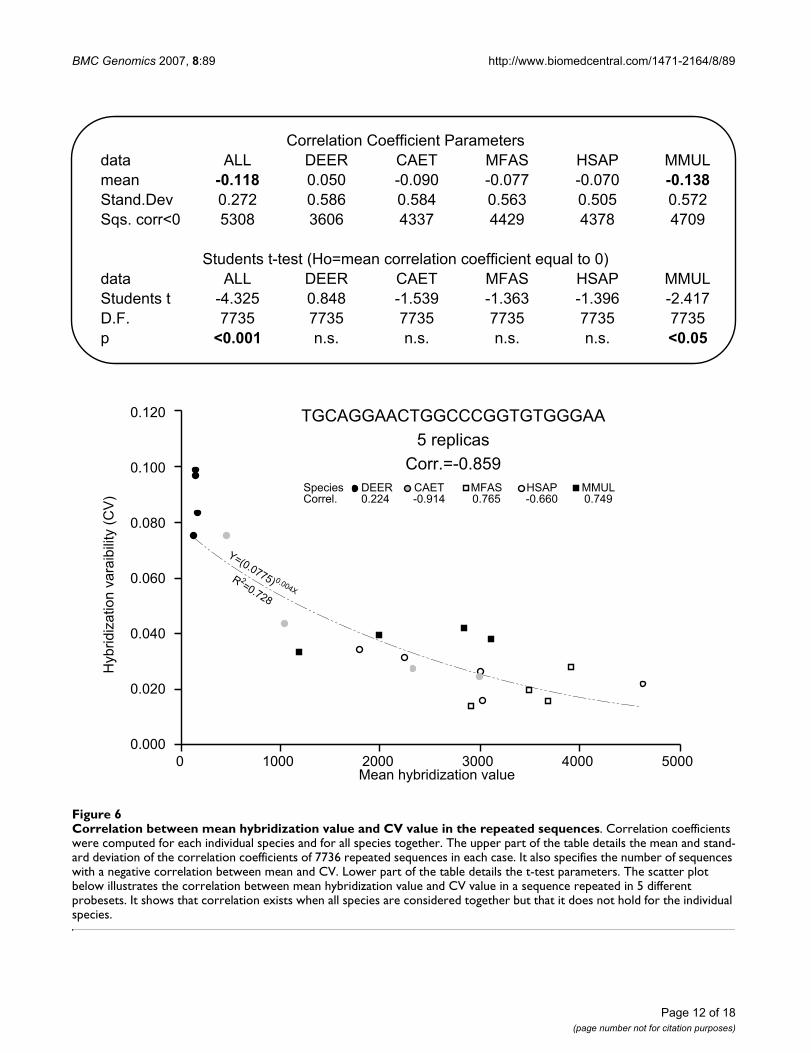
Effect of hybridization level on reproducibilityAccording to previous authors [9,10,15,16], the mostimportant negative effect of cross-species analyses is thereduction of microarray sensitivity, which, in turn, maychange its reproducibility [15]. To determine whether ornot hybridization signal and hybridization reproducibil-ity are related, the correlation coefficient of mean hybrid-ization values on hybridization CVs was calculatedindependently for the samples of each species and for allsamples together. When all species samples were consid-ered together, 5308 out of the 7736 repeated sequences(68.6%) presented a negative correlation between meanhybridization and hybridization CV, with mean correla-tion significantly below zero (p < 0.01, Student's t-test; seeFigure 6). This relationship stands still even when deerdata is excluded to avoid the effect that may result from itslarge leverage (t = -4,209, D.F.= 7735; p < 0.01). This indi-cates that if the samples for all species are consideredtogether, the sequences present less reproducible hybridi-zations when their hybridization values are low. In con-trast, analysis of individual species data yielded morevariable results. Only one species, Macaca mulatta, agreedwith the overall pattern, presenting a negative correlationin 4709 sequences (60.9%) and a mean correlation belowzero, while the other primate species presented a moreeven distribution of the correlation values, with approxi-mately 57% of the sequences showing negative correla-tions (4337, 56.1%; 4429, 57.3%; 4378, 56.6%) and amean correlation that did not differ significantly fromzero. Cervus elaphus samples presented a mean positivecorrelation, although not significantly different from zero(see Figure 6), with just 3606 sequences (46.6%) present-ing negative correlation between hybridization mean andCV. Taken together, these data indicate that low hybridi-zation values correlate with some decrease of reproduci-
bility, although such relationship stood only forinterspecies comparisons, not when comparisons wererestricted to individual species.
DiscussionWe showed here that over 95% of the 7736 PM sequencesrepeated in different probe sets of the human U133 plus2.0 GeneChip, yielded reproducible hybridizations in allthe mammalian species analysed. Human and non-human samples presented a similar number of sequencesin different reproducibility categories, except for a minorand irrelevant difference in the number of highly repro-ducible sequences between human and Macaca fascicularissamples. Moreover, hybridization of non-human RNA onhuman microarrays did not cause more sequences to beassociated to un-reproducible hybridizations than didhuman RNA. Hybridization reproducibility was also sim-ilar across sequences, without relevant changes associatedto cross-species analyses being observed. These resultsdemonstrate that cross-species hybridizations of non-human mammalian samples to human U133 plus 2.0GeneChip result in hybridization values that do not differin reproducibility from the hybridization values of thehuman samples, even when analysing samples of speciesas phylogenetically distant to Homo sapiens as Cervus elap-hus.
Lack of effects of cross-species on hybridization reproduc-ibility points that sequence differences between the tran-scripts of the sample and the probes of the array do notresult in changes in the reproducibility of the hybridiza-tion values with respect to fully complementary tran-scripts and probes. The reason underlying this result couldbe related, in our opinion, to the behaviour of the tran-script-probe duplexes. It is well established that the stabil-ity of a transcript-probe duplex depends on the basesequence [26]. Under given physical and chemical hybrid-ization conditions, any transcript-probe duplex willpresent a specific stability that may be estimated fromknowledge of the number and identity of their comple-mentary bases. Duplex stability determines the number oftranscripts that will be hybridized to the probes forming aduplex. That is, for any given number and identity of thecomplementary bases between transcript and probe, thereis a fixed probability for a transcript to be hybridized withthe probe forming a duplex. Thus, a smaller number ofcomplementary bases will result in a lower probability oftranscript-probe hybridization reducing the hybridizationsignal, but not making it more variable. It is reasonable tothink that even cross-hybridization of the probes withunspecific transcripts will follow this scheme. Thus, cross-hybridization will increase the noise of the hybridizationvalue, but will not change the reproducibility of the data.All these reasoning explains why regardless of the mam-mal species being analyzed, reproducibility of the hybrid-
Page 9 of 18(page number not for citation purposes)
BMC Genomics 2007, 8:89 http://www.biomedcentral.com/1471-2164/8/89
ization values remains almost constant. This is perfectlyillustrated by our results from the deer analyses. Sequencedifferences between the deer samples and the humanmicroarray cause a strong decrease in the hybridizationreflected in the fact that, after scaling, less than 10% of thegenes arrayed in the U133 plus 2.0 GeneChip are detectedas present (according to MAS 5.0 algorithm, data notshown) but, as shown by our results, they do not causeany significant change in the reproducibility of thehybridization values.
Previous analysis of non-human primate and human geneexpression with human GeneChips showed reproducibil-ity differences between same-species and cross-speciesanalyses [15,17]. These studies found that, although thenumber of genes that change their detection call (presenceor absence of a transcript) across replicates (flux genes ofChismar et al. [15]) was similar, there was a clear differ-ence in the distribution of the variability between same-species and cross-species analyses. Flux genes were moreassociated to higher signal intensities in cross-speciesanalysis than in same-species ones [15]. As a result thenumber of genes consistently detected across replicatesshowed a significant decrease in cross-species analyses(from 24 to 12% according to Wang et al. [17]) and thesize of the flux gene set as a percentage of the genes calledpresent became clearly higher in cross-species analysesthan in same-species analyses (27% vs. 17% in the analy-sis of [15]). The apparent contradiction of these observa-tions and our results is probably due to the differences in
the data employed. In the present study, we have used rawintensity values, whereas both Detection Call and SignalIntensity are gene expression measures that summarizethe information on the probe level data after applying var-ious analytical methods to the intensity values [27]. Theseanalytical methods imply the use of several algorithms tonormalize and quantify probe hybridization, followed bythe application of other algorithms to summarize theinformation of the probes of each probeset into geneexpression values. The analytical methods most com-monly used, such as MAS 5.0 [28], dChip [29] or RMA(Robust Multi-chip Average [27]), differ in their approachand performance and seem to affect the reproducibility ofthe gene expression measures in both same-species andcross-species analyses [15,17]. In fact, the reproducibilityof Detection Call and Signal Intensity appears to dependon the algorithm employed, with RMA and dChip algo-rithms yielding more reproducible results than theAffymetrix MAS5 [17]. Our study demonstrates, in thisrespect, that the reproducibility differences of gene expres-sion measures seen in some previous cross-species analy-ses [15,17] were not due to differences in hybridizationreproducibility. Rather, they were probably caused by theprocessing of the hybridization data, that is, by the algo-rithms used to estimate the presence and abundance ofthe transcripts. This conclusion may also explain whycDNA microarrays do not show any change in the repro-ducibility of their gene expression measures when per-forming cross-species analyses [8,19], while Affymetrixoligonucleotide microarrays do. Since cDNA microarrays
PM and MM un-reproducible probe sequences (UPS) for human samplesFigure 4PM and MM un-reproducible probe sequences (UPS) for human samples. Results are detailed for MM and PM sequences, and for CV over 0.5, 0.75 and 1. All details as in figure 3.
CV>1 CV>0.75 CV>0.5(Frequency) 0.002 0.003 0.005
All probesNRR
Seqs. 12 14 27
PM probesNRR
Seqs. 1 9 8
MM probesNRR
Seqs. 2 6 5
MM probesPM probes All HumanProbes
CV>1
1 21 2
No associated7721
MM probesPM probes All HumanProbes
CV>0.75
9 14 6
No associated7707
MM probesPM probes All HumanProbes
CV>0.5
8 27 5
No associated7696
Page 10 of 18(page number not for citation purposes)
BMC Genomics 2007, 8:89 http://www.biomedcentral.com/1471-2164/8/89
Page 11 of 18(page number not for citation purposes)
Comparison of the hybridization variability in repeated sequencesFigure 5Comparison of the hybridization variability in repeated sequences. (a) Comparison between human and non-human PM data and (b) between PM and MM human data. Graphs detail the mean, interquartile and 50 to 95 percentile ranges and illustrate the magnitude and direction of each sample or species CV changes respect to the mean human PM CV. White and grey ranges in graphs "species mean data" and "human mismatch data" are defined after the human samples mean range (white area) and the interquartile range (grey area) and used to explore the magnitude of the change. Tables below each graph details the results of the one-tailed t test used to determine if the differences were significantly larger than 0. Sample codes as detailed in table 2. (*) denotes significantly different mean hybridization CV between a given non-human species and human.
Human Samples Data
HSAP1
HSAP2
HSAP3
HSAP4
HSAP5
mean
90% values50% values
0 0.02 0.04 0.06 0.08 0.10-0.02-0.04-0.06-0.08
DEER
CAET
MFAS
MMUL
Relative Hybridization Variability(CVspecies j - mean CVhuman)
0 0.02 0.04 0.06 0.08 0.10-0.02-0.04-0.06-0.08
Species Mean Data
DEER CAET MFAS MMUL
Mean -0.0104 -0.0073 -0.0115 -0.0050SD 0.0599 0.0508 0.0526 0.0501
t=mean/(SD/sqrt(N)) 15.2422 12.6075 19.2382 8.8502sqrt(N)=87.95453371
D.F.=7735p (one-tailed)* <0.0005 <0.0005 <0.0005 <0.0005
90% C.I. [-0.0115, -0.0093] [-0.0082, -0.0063] [-0.0125, -0.0105] [-0.006, -0.0041]A BHuman Mismatch Data
Relative Hybridization Variability(mm CVsample i - pm CVsample i)
HSAP1
HSAP2
HSAP3
HSAP4
HSAP5
0 0.04 0.08-0.04-0.08-012-0.16 0.12 0.16 0.20 0.24
Mean MM
HSAP1 HSAP2 HSAP3 HSAP4 HSAP5 Mean MM
Mean 0.0044 0.0056 0.0060 0.0040 0.0033 0.0047SD 0.1285 0.1344 0.1412 0.1413 0.1466 0.1020
t=mean/(SD/sqrt(N)) 3.0219 3.6508 3.7373 2.4981 1.9656 4.0148sqrt(N)=87.95453371
D.F=7735P (one-tailed) <0.005 <0.0005 <0.0005 <0.005 <0.025 <0.0005
90% C.I. [0.0068, 0.0020] [0.0081, 0.0031] [0.0086, 0.0034] [0.0067, 0.0014] [0.0060, 0.0005] [0.0066, 0.0027]
BMC Genomics 2007, 8:89 http://www.biomedcentral.com/1471-2164/8/89
Page 12 of 18(page number not for citation purposes)
Correlation between mean hybridization value and CV value in the repeated sequencesFigure 6Correlation between mean hybridization value and CV value in the repeated sequences. Correlation coefficients were computed for each individual species and for all species together. The upper part of the table details the mean and stand-ard deviation of the correlation coefficients of 7736 repeated sequences in each case. It also specifies the number of sequences with a negative correlation between mean and CV. Lower part of the table details the t-test parameters. The scatter plot below illustrates the correlation between mean hybridization value and CV value in a sequence repeated in 5 different probesets. It shows that correlation exists when all species are considered together but that it does not hold for the individual species.
Correlation Coefficient Parametersdata ALL DEER CAET MFAS HSAP MMULmean -0.118 0.050 -0.090 -0.077 -0.070 -0.138Stand.Dev 0.272 0.586 0.584 0.563 0.505 0.572Sqs. corr<0 5308 3606 4337 4429 4378 4709
Students t-test (Ho=mean correlation coefficient equal to 0)data ALL DEER CAET MFAS HSAP MMULStudents t -4.325 0.848 -1.539 -1.363 -1.396 -2.417D.F. 7735 7735 7735 7735 7735 7735p <0.001 n.s. n.s. n.s. n.s. <0.05
Mean hybridization value0
0.120
0.100
0.080
0.040
0.020
0.0001000 2000 3000 4000 5000
Y=(0.0775) 0.004XR 2=0.728
TGCAGGAACTGGCCCGGTGTGGGAA5 replicas
Corr.=-0.859SpeciesCorrel.
DEER CAET MFAS HSAP MMUL0.224 -0.914 0.765 -0.660 0.749
0.060
Hyb
ridiz
atio
n va
raib
ility
(CV
)
BMC Genomics 2007, 8:89 http://www.biomedcentral.com/1471-2164/8/89
use just one probe per target, gene expression measuresare directly calculated from the intensity values of theprobe, without using any algorithm that may affect thereproducibility of the estimates. It also could be thatcDNA microarrays yield reproducible gene expressionmeasures in cross-species analyses due to the use of longstretches of nucleotide sequence (up to a complete openreading frame), which would favour their specific hybrid-ization with orthologous genes. However, as we havedemonstrated, short oligonucleotide probes also result inreproducible hybridizations in cross-species analyses, inagreement with some authors that have proposed thatresults from individual oligonucleotide probes are asreproducible as those from long cDNA probes [8]. In fact,Agilent has been manufacturing oligonucleotide arrays foryears with either three 25 bases long oligonucleotides pergene or one 60 bases long oligonucleotide per gene,resulting in hundreds of published papers [9].
The analysis of the relationship between hybridizationvalue and coefficient of variation showed a negative corre-lation between both variables, i.e. high hybridization val-ues were more reproducible than low hybridizationvalues. This correlation was found significant only whenthe data from all species were analysed together, but notwhen the analyses were restricted to individual species.Thus, the correlation arises from the combination ofhybridization values and reproducibilities for differentspecies (Figure 6) because, for a given sequence, some spe-cies yield low and poorly reproducible hybridization val-ues, while others yield high and very reproduciblehybridizations. A similar relationship between hybridiza-tion level and reproducibility of gene expression measureswas proposed by Chismar et al. [15] to explain the differ-ences in reproducibility between same-species and cross-species analyses. However, we have shown that humansame-species hybridizations do not differ in reproducibil-ity from cross-species hybridizations. Moreover, all spe-cies yield similarly reproducible hybridizations despitethe presence of large differences in the hybridization val-ues of the different species (mean hybridization value inHSAP = 494.7, DEER = 264.6, CAET = 564.8, MFAS =969.8, MMUL = 655.2). This raises the question of whyspecies give similarly reproducible hybridizations in spiteof their differences in hybridization values. Probably, thedifferences in hybridization values are not high enough toaffect the reproducibility in a way that may be detected byour analyses. The effects of hybridization level on repro-ducibility would be appreciable only if hybridization val-ues from the different samples were very different. Thatcould be the case for individual probes, but it will nevercause the reproducibility of cross-species data to differfrom same-species data. Indeed, any comparison of theexpression profiles between two or more samples shouldalways pass through a process of scaling and normaliza-
tion that would make the overall hybridization valuescomparable [13].
The comparisons of the human PM and MM hybridiza-tion data show that they differ neither in reproducibilitycategory distribution nor in the number of sequencesassociated to poorly reproducible hybridization values.However, the hybridization values of MM sequences tendto be less reproducible than the hybridization values oftheir corresponding PM sequences. This result is probablyrelated to the negative relationship between the hybridi-zation value and the coefficient of variation previouslydiscussed. Since, for each probe pair, MM values tend tobe smaller than PM values (at least, in same-specieshybridizations), their CV will tend to be slightly but sys-tematically higher. However, MM data are difficult tointerpret. Affymetrix GeneChips include MM sequences toquantify non-specific binding (i.e. hybridization withRNAs different from the target), a value that is directly orindirectly subtracted from the PM value in order to obtainthe specific probe hybridization measure [13,28,30].However, MM hybridization values, besides measuringnon-specific binding, also measure hybridization with thetarget [27], though diminished because of the nucleotidesequence difference. Furthermore, the MM hybridizationvalue may under or overestimate non-specific bindingrespect to the non-specific binding with the PM sequence.Whatever the causes for MM reproducibility reduction, itis clear that the uncertainties associated to MM hybridiza-tion affect the reproducibility of the derived gene expres-sion measures. As a consequence, the analytical methodsthat use PM and MM hybridization values to quantify spe-cific hybridization with the target, also combine the vari-ability of PM and MM hybridization measures, probablyreducing the reproducibility of the gene expression valuesobtained. Thus, algorithms like RMA that use only PMdata will produce more reproducible expression measuresin cross-species analyses than dCHip and MAS 5.0, thatuse both PM and MM data to measure gene expression, asshown by Wang et al. [17]. Quantification of probehybridization from PM and MM intensity values seems tobe the critical step in the calculation of the expressionmeasures from raw intensity data, as concluded also byFan et al. [31].
Our analyses the effect of cross-species hybridization onthe number of un-reproducible probe sequences haveallow us to identify various probes yielding un-reproduc-ible hybridizations in all samples, regardless of the speciesof origin. Such probes produce hybridizations so variablethat should be considered useless for gene expressionanalyses according to the criteria proposed by [19], andtherefore, their data are best eliminated from further cal-culations. The presence of probes yielding un-reproduci-ble hybridizations highlights the need for a deeper
Page 13 of 18(page number not for citation purposes)
BMC Genomics 2007, 8:89 http://www.biomedcentral.com/1471-2164/8/89
analysis of the probe features in order to improve the geneexpression data obtained from the GeneChip analyses.Harbig et al. [32] reached a similar conclusion analysingthe targets of individual probes of GeneChip U133 plus2.0. They demonstrated that about 37% of the probe tar-gets of the U133 plus 2.0 array needed to be redefined. Allthese results point that research in Affymetrix GeneChipsshould not only concentrate on the mathematics of inten-sity data processing by developing new algorithms, butalso on the evaluation of the performance of the probesthemselves.
ConclusionThe results of the present study demonstrate that cross-species analyses do not significantly affect the reproduci-bility of the hybridization data from Affymetrix Gene-Chips, at least analysing RNA from a mammal specieswith another mammal species microarray. Differences inthe reproducibility of gene expression measurementsbetween same-species and cross-species analyses usingAffymetrix microarrays are more likely caused by the ana-lytical methods used to calculate the gene expressionmeasurements from the hybridization data than by areduction on the reproducibility of the hybridization dataitself. These results, together with those from previousauthors [9,15,17,18], indicate that Affymetrix GeneChipspermit to obtain feasible hybridization data in cross-spe-cies analysis. However, they also make evident that choos-ing the appropriate algorithm to convert suchhybridization data into gene expression measures is a keystep in these analyses if we wish to preserve the quality ofthe obtained hybridization data. In this respect, the varia-bility of the MM hybridization values observed in thisstudy indicates that algorithms or analytical methodscombining PM and MM hybridization values to quantifygene expression do result in a loss of reproducibility of theobtained gene expression measures. MM probes can beuseful to identify and choose the most conserved probesequences in cross-species analyses but they become asource of noise when quantifying gene expression. In thecourse of our analyses, we have also identified severalprobes yielding un-reproducible hybridizations. Hybridi-zation data from these probes is so variable that should beconsidered useless for gene expression analyses and there-fore eliminated from further calculations or even from theGeneChip. The presence of such un-reproducible probesstresses the need of a re-evaluation of the probes perform-ance in Affymetrix GeneChips.
MethodsData for primatesHuman and non-human primate gene expression datacomes from Dillman and Phillips study [18] and weredownloaded from GEO database of the NCBI ([33], acces-sion number GSE2634; last accessed in November, 2005).
Available files include Affymetrix raw data (.DAT, .CEL,.EXP files) obtained after analysing with the AffymetrixU133 Plus 2.0 GeneChip®, RNA samples of whole bloodfrom Macaca fascicularis (4 samples, named here MFAS1to 4, Table 2), Chlorocebus aethiops (4 samples, CAET1 to4), Macaca mulatta (4 samples, MMUL1 to 4) and Homosapiens (5 samples, HSAP1 to 5).
Acquisition of data for deerDeer tissue samples come from biopsies of an 8 year-oldmale, kept at the Experimental Farm of the University ofCastilla-La Mancha (Albacete, Spain). Samples corre-spond to the soft tissues overlying bone (epidermis, der-mis, periostium and derivatives) at different positions:samples DEER1 and DEER4 are from the antler tip; sam-ple DEER2 from the antler base or pedicle; and sampleDEER3 from over the frontal bone of the skull. DEER1,DEER2 and DEER3 samples were harvested during theperiod of maximal antler growth (60 days after casting theprevious antlers) while DEER4 was harvested at the end ofthe antlers' growing period (120 days after casting). Toobtain the samples, the individual was kept in a hydraulicrestrainer and anesthetized with a low-dose combinationof xylazine (0.5 mg/kg of body weight; Calier, Barcelona,Spain) and ketamine (1 mg/kg BW; Imalgene 100,Menial, Lyon, France). After taking the samples, anaesthe-sia was reversed with yohimbine (0.25 mg/kg BW; Sigma-Aldrich, St. Louis, MO, USA). Samples of the antler tip(DEER1 and DEER4) were dissected using a sterile sawblade while DEER2 and DEER3 samples were taken using4 mm. diameter biopsy punches (Stiefel, Madrid, Spain).All procedures were carried out by veterinaries andapproved by the ethic committees of the Spanish ScienceResearch Council and the Ministry of Environment. Sam-ples were frozen in liquid nitrogen and kept at -80°C untiltheir processing. Frozen tissues were crushed in a mortarcooled in liquid nitrogen. Total RNA was extracted usingTRIzol reagent (Invitrogen Life Technologies, Carlsbad,CA, USA) and purified using the RNeasy kit (Qiagen,Valen, CA, USA). RNA quality was assessed by electro-phoresis in 2% agarose gels (Invitrogen Life Technologies,Carlsbad, CA, USA), containing 0.5 μg/ml ethidium bro-mide (EtBr, Sigma-Aldrich, St. Louis, MO, USA). RNApreparation, hybridization, staining, and scanning of theGeneChip® U133 Plus 2.0 was carried out by the Pro-genika Biopharma laboratories (Derio, Spain)[34], fol-lowing Affymetrix protocols. According to theseprotocols, spike controls were added to the hybridizationmixtures to ensure the correct hybridization, washing,developing and scanning of the GeneChips. CEL, .DAT,and .EXP files of all 4 samples were obtained andemployed in the analyses. .CEL and .EXP files may bedownloaded from the GEO database [33] under the acces-sion number GSE4064.
Page 14 of 18(page number not for citation purposes)
BMC Genomics 2007, 8:89 http://www.biomedcentral.com/1471-2164/8/89
Hybridization dataHybridization values for all PM and MM probes wereobtained from the .CEL files using the PM and MM rou-tines of Bioconductor's "Affy" package [27,35].
ProbesInformation on Affymetrix U133 Plus 2.0 GeneChip®
probes was downloaded from the Affymetrix website([36] last accessed in November, 2005). The tab-delimitedtext file thus obtained, details the sequence, position,number, and probeset of all probes in the GeneChip®.Additional information about the targets of the probeswas obtained from the Affymetrix database at NetAffx webpage ([37] last accessed in March, 2006) and from theNCBI databases searched using the nucleotide-nucleotideBLAST (BLASTn [38]) program of the NCBI ([39] lastaccessed in March, 2006).
Statistical analysesAll above information about each probe and their hybrid-ization values with the different samples were exported toa FileMaker Pro 5.5 database (FileMaker Inc., Santa Clara,CA, USA). The search tool of FileMaker was employed toidentify all the sequences repeated in more than 1 probe(caution recommended, because FileMaker Pro 5.5employs only the first 21 characters to carry out the searchand thus it may recognize as repeated, sequences that dif-fer in their last 4 bases). Probe information and hybridi-zation values of all repeated sequences were exported toan Excel spreadsheet (Microsoft, Redmond, WA, USA) tobe formatted before its analysis with the Statistica 6.0package (Statsoft Inc., Tulsa, OK, USA) (see Additional file1). Normality of repeated hybridization values wasassessed in the sequences repeated more than 6 times,using Shapiro-Wilk W, Kolmogorov Smirnoff and Lillie-fors tests (Additional file 2; for comparison of the differ-ent methods; see [40] and Statistica help). For eachrepeated sequence in the GeneChip, Statistica was used tocalculate the number of replicas and the mean, standarddeviation and coefficient of variation (CV) of the hybridi-zation values for each RNA sample (see Additional file 3).PM and MM data were treated as independent samples.
The variability of the repeated hybridization measures wasused to estimate hybridization reproducibility. Differentmeasurements may be used to describe the variability ofsingle values on repeated trials [14,24,25], but accordingto Hopkins [14], within-subject standard deviation is themost appropriate one. However, when standard deviationdepends on the size of the measure, the coefficient of var-iation (CV) should be employed instead. Because in ourdataset, the standard deviation correlated significantlywith the mean (Kendall Tau over 0.3, p < 0.05 in all sam-ples, see Additional file 4), CV was chosen as a measure ofhybridization variability among replicas in all the analy-
ses. CV data of the repeated PM sequences were used tocompare the reproducibility in same and cross-speciesanalyses. To further test the effect of sequence differenceson hybridization reproducibility, we also carried out thesame analyses comparing CV data for repeated perfectmatch (PM) and mismatch (MM) sequences in thehuman samples. Description of the statistical proceduresof the analyses is based in the comparison of the PM datafrom the different species. The comparisons of the humanPM and MM hybridizations dataset were carried out in thesame way unless specified.
To test whether cross-species hybridizations affected thedistribution of the hybridization reproducibility, thenumber of sequences in each of the following classes ofdecreasing reproducibility was calculated: CV<0.1,extremely reproducible; 0.1<CV<0.25, highly reproduci-ble; 0.25<CV<0.5, reproducible; 0.5<CV<0.75, slightlyreproducible; 0.75<CV<1, poorly reproducible; CV>1,very poorly reproducible. Then, the number of sequencesin each class across species (detailed in Additional file 5)was compared using a two-way ANOVA, followed by anunequal number of samples post-hoc Tukey's test. Speciesand CV classes were used as independent factors in theanalysis.
Probe sequences associated to irreproducible or poorlyreproducible hybridizations – "un-reproducible probesequences" (UPS) – were defined as sequences presentinghigh hybridization CV in more samples of a species thancould result from a random combination of the CV val-ues. Three levels of variation (CV>1, >0.75 and >0.5) wereset as the boundaries of poor reproducibility. The proba-bility of a sequence presenting a CV>X in n samples ran-domly was calculated based on a binomial (Bernoulli)probability distribution. First, pCV>X, the probability that asequence in one sample presented a CV>X was estimatedas the mean number of sequences (across all samples)with CV>X divided by the total number of sequences(7736). pCV>X was then used to calculate the probability ofa sequence to present a CV>X in n samples (psqy, CV>X, n),using the equation:
psqy, CV>X, n = Cm, n [(pCV>X)n(1-pCV>X)m-n]
where Cm, n represents the number of combinations of aset of m objects taken n at a time and is given by Cm, n=[(n!)/(r!(n - r)!)], where m is the total number of samplesin the species or group of species considered, and n thenumber of samples with CV>X. The probability that atleast one of the 7736 sequences analysed presents n sam-ples with CV>X (PCV>X) was calculated as: PCV>X, n = 1-(1-psqy, CV>X, n)7736. The probability values obtained fromthese calculations were used to determine the number ofsamples that may randomly present a CV>X. A probability
Page 15 of 18(page number not for citation purposes)
BMC Genomics 2007, 8:89 http://www.biomedcentral.com/1471-2164/8/89
below 0.01 was chosen to define the maximum numberof samples that may randomly present a CV>X. These cal-culations were made for all species (4 samples in eachnon-human species and 5 human samples), and for thegroups of species that follow: all species (ALL), non-human species (N.H.S.), primates (PRIMATES), non-human primates (N.H.P.) and genus Macaca (MACACA).The maximum number of samples that may randomlypresent CV>X for each species or group of species was cal-culated for the three levels of CV defined and used to iden-tify un-reproducible probe sequences for each species orgroup of species. However, a probe sequence may presenthigh CVs in samples from different species or groups ofspecies. To precise in which of the species or groups ofspecies of those listed above is the sequence associated topoorly reproducible hybridizations, we have used the fol-lowing criteria: i) a probe sequence will be considered un-reproducible for a given group, if that group shows moresamples with CV>X than randomly expected (p < 0.01)and the sequence is also considered un-reproducible forall species within the group or for none of them; ii) asequence is not considered un-reproducible for a group, ifthe sequence shows more samples with CV>X than ran-domly expected (p < 0.01) for the group but also for onlyone subgroup or species within that group. In such a case,the probe sequence is considered un-reproducible for thatspecies or subgroup; finally, iii) when a sequence is con-sidered un-reproducible for two or more species, so it isfor the smallest group that contains those species.Although these criteria are not absolute and other criteriawould result in different assignations, we are confidentthat the overall results will not vary significantly. Descrip-tion of the targets of identified UPS was obtained fromAffymetrix analysis site (NetAffx [37]) and from theGeneBank EST sequences using the nucleotide-nucleotideBLAST (BLASTn) from the NCBI BLAST webpage [39].
For the analysis of the effect of sequence differences on thevalues of the hybridization variability, the mean CV forevery PM sequence in each species was first calculated,and the data used to determine the difference in hybridi-zation CV for every sequence in each species with respectto the human hybridization CVs (data matrices availablein the Additional file 9). One-tailed t test was employed todetermine whether or not the differences between the CVfor each species and the human CVs were significantlygreater than 0. To examine how relevant these differenceswere, interquartile and 5 to 95 percentile ranges were cal-culated for the CV differences between every species andthe human and were compared graphically to the differ-ences between human sample CVs and the mean humanCVs (Figure 5). When evaluating whether the hybridiza-tion variability of the MM sequences was significantlylarger than the variability of their corresponding PM
sequences, individual sample PM and MM data togetherwith mean data were also compared.
The possible relation between hybridization variation andhybridization signal was explored by calculating the cor-relation between hybridization CV and mean hybridiza-tion value in all repeated sequences. The correlationcoefficient between both variables was computed for thesamples of each individual species and for all samplestogether. Student's t-test was used to check whether or notoverall correlation coefficients in each case were signifi-cantly different from zero.
Authors' contributionsMND conceived and designed the study, participated inthe acquisition of the microarray data, carried out the sta-tistical analyses, and was responsible for much of the writ-ing. WPT participated in obtaining the deer data, helpedin the statistical analyses and in drafting and revising themanuscript. MNS is the head of the laboratory; he contrib-uted to the conception and design of the study, and wasinvolved in the writing, the revision and the final approvalof the manuscript. All authors read and approved the finalversion of this manuscript.
Additional material
Additional file 1Raw data used in this study. This spreadsheet contains the description of all repeated probes in the U133 plus 2.0 GeneChip, including the probeset to which the probe belongs (first column, under the header Probe Set ID), the oligonucleotide sequence (Sequence), probe position in the GeneChip (Probe x and Probe y), a code number (Number) and the hybridization value of each sample for that probe. Hybridization values are given sepa-rately for human PM and MM probes.Click here for file[http://www.biomedcentral.com/content/supplementary/1471-2164-8-89-S1.xls]
Additional file 2Normality test of the hybridization values in repeated sequences. Results of the Shapiro-Wilk W test of normality on all sequences repeated more than 6 times in the U133 Plus 2.0 GeneChip. The detailed nucle-otide sequences corresponding to the PM probes. MM probes differ just in a nucleotide in the 13th position. Significant differences from a normal distribution are given as * p < 0.1; ** p < 0.05; and *** p < 0.0012 (equivalent to p < 0.05 after application of Bonferroni correction). The spreadsheet also includes the frequency histograms of the hybridization values of sequence GACAAGGTCGAGACATTCCTGCGCA in 2 samples with a non-normal distribution (p < 0.0012) of the data. It can be appre-ciated that the main cause of non-normality may be attributed to the pres-ence of one outlier in each set of values.Click here for file[http://www.biomedcentral.com/content/supplementary/1471-2164-8-89-S2.xls]
Page 16 of 18(page number not for citation purposes)
BMC Genomics 2007, 8:89 http://www.biomedcentral.com/1471-2164/8/89
AcknowledgementsWe are very grateful to Drs. José Borrel, Luis M. Carrascal, Gugliemmo Fonfani, Joaquín Hortal, Jorge Lobo and Javier Lobón for their advice and comments on the statistics of the paper. We also thank the four anony-mous reviewers of this paper for critical reading of the manuscript and help-ful comments. W.P.-T. was supported by a Predoctoral Fellowship from the Spanish Ministry of Science and Education (FPI Program). This work was
Additional file 3Basic statistics of the hybridization data for the repeated sequences. This spreadsheet contains the information about the mean (mean), standard deviation (sd), coefficient of variation (cv) and minimum (min) and maximum (max) hybridization values for all repeated sequences in each sample. Again, human values for PM and MM probes are detailed as independent samples. The first and second columns of this spreadsheet specify the sequence and the number of times (N. Rps) that it is present in the GeneChip. This large spreadsheet can be opened using Microsoft Excel.Click here for file[http://www.biomedcentral.com/content/supplementary/1471-2164-8-89-S3.txt]
Additional file 4Correlation between mean and standard deviation of hybridization values. Kendall Tau correlations between Standard Deviation and Mean of each sample, including MM probe data from the human samples. Scat-terplots of mean (X axis) versus Standard Deviation (Y axis) for some samples are provided for illustration. Axes are drawn in logarithmic scale.Click here for file[http://www.biomedcentral.com/content/supplementary/1471-2164-8-89-S4.xls]
Additional file 5Number of sequences in CV classes. Data matrices describing the number of sequences in each of the CV classes defined in the text. Quan-tification is detailed for each sample grouped as in the analyses: the first matrix (columns A to D) includes the data used for the species comparison while the second matrix (columns F to I) provides the information for the comparison of human PM and MM sequences.Click here for file[http://www.biomedcentral.com/content/supplementary/1471-2164-8-89-S5.xls]
Additional file 6UPS Probability tables. This spreadsheet details all the data and mathe-matical operations used to calculate the probability of different numbers of samples presenting a CV over a given value (1, 0.75, and 0.5) when hybridizing with a probe sequence. Most values were calculated using Excel formulas, seen by double-clicking on the values. Probability values are given for each number of samples and for each of the groups used throughout the study. All symbols and abbreviations are defined in the spreadsheet.Click here for file[http://www.biomedcentral.com/content/supplementary/1471-2164-8-89-S6.xls]
Additional file 7Identification of the UPS. This spreadsheet contains three matrices iden-tifying the un-reproducible probe sequences (UPS) identified in the differ-ent species and the samples in which they present CV>X and another three matrices describing the un-reproducible probe sequences (UPS) identified by analysing the CV values of PM and MM probes after hybridization of human samples. Each matrix corresponds to a different CV boundary, the first one to CV>1, the second to CV>0.75 and the third to CV>0.5. Each matrix specifies the nucleotide sequence in its first column, which samples present CV>X in the following columns, while the last columns detail the species or group of species (or kind of sequence PM/MM in the human samples) for which that sequence presents more samples with CV>X than could be randomly expected. The final column specifies the species or group of species (or kind of sequence) for which we have considered un-reproducible the probe sequence in the first column.Click here for file[http://www.biomedcentral.com/content/supplementary/1471-2164-8-89-S7.xls]
Additional file 8Characterization of the UPS. Spreadsheet containing two matrices, one describing the PM un-reproducible probe sequences for the different spe-cies or groups of species, and the other describing the MM and PM un-reproducible probe sequences for human samples. For each sequence, the matrix details in the nucleotide sequence, the species or groups in which the sequence behaves as an UPS at the three defined levels (CV>1, CV>0.75, and CV>0.5), the GeneChip probesets containing that sequence and the target of the sequence according to Affymetrix annota-tions and to a search of the GeneBank sequences using BLASTn tool (see Materials and Methods in the text).Click here for file[http://www.biomedcentral.com/content/supplementary/1471-2164-8-89-S8.xls]
Additional file 9Differences Data Matrix. This spreadsheet includes the data matrix used to compare the hybridization variability for each sequence between humans and non-human mammals. For each samples, the matrix gives: columns C to H, the mean hybridization CV of each sequence in each spe-cies (calculated from the sample data in Additional file 3); columns I to M, the difference between the hybridization CV of the human samples and the mean human hybridization CV; columns N to R, the difference between the mean hybridization CV of non-human species and mean human hybridization CV and the difference between the human PM and MM mean hybridization CV (HSAPmm); columns N to R, the difference between the MM hybridization CV and the PM hybridization CV for each human sample. Codes for species and samples, as given in Table 2 of the text.Click here for file[http://www.biomedcentral.com/content/supplementary/1471-2164-8-89-S9.xls]
Page 17 of 18(page number not for citation purposes)
BMC Genomics 2007, 8:89 http://www.biomedcentral.com/1471-2164/8/89
Publish with BioMed Central and every scientist can read your work free of charge
"BioMed Central will be the most significant development for disseminating the results of biomedical research in our lifetime."
Sir Paul Nurse, Cancer Research UK
Your research papers will be:
available free of charge to the entire biomedical community
peer reviewed and published immediately upon acceptance
cited in PubMed and archived on PubMed Central
yours — you keep the copyright
Submit your manuscript here:http://www.biomedcentral.com/info/publishing_adv.asp
BioMedcentral
supported by the Spanish Ministry of Science and Education (grant SAF2002-04016).
References1. Bigger CB, Brasky KM, Langfor RE: DNA microarray analysis of
chimpanzee liver during acute resolving hepatitis C virusinfection. Journal of Virology 2001, 75:7059-7066.
2. Kayo T, Allison DB, Weindruch R, Prolla TA: Influences of agingand caloric restriction on the transcriptional profile of skele-tal muscle from rhesus monkeys. Proceedings of the NationalAcademy of Sciences of the United States of America 2001, 9:5093-5098.
3. Marvanova M, Menager J, Bezard E, Bontrop RE, Pradier L, Wong C:Microarray analysis of nonhuman primates: validation ofexperimental models in neurological disorders. The FASEBJournal 2003, 17:929-931.
4. Enard W, Khaitovich P, Klose J, Zollner S, Heissig F, Giavalisco P,Nieselt-Struwe K, Muchmore E, Varki A, Ravid R, Doxiadis GM, Bon-trop RE, Paabo S: Intra- and interspecific variation in primategene expression patterns. Science 2002, 296:340-343.
5. Karaman MW, Houck ML, Chemnick LG, Nagpal S, Chawannakul D,Sudano D, Pike BL, Ho VV, Ryder OA, Hacia JG: Comparative anal-ysis of gene-expression patterns in human and African greatape cultured fibroblasts. Genome Research 2003, 13:1619-1630.
6. Hacia JG, Makalowski W, Edgemon K, Erdos MR, Robbins CM, FodorSP, Brody LC, Collins FS: Determination of ancestral alleles forhuman single-nucleotide polymorphisms using high-densityoligonucleotide arrays. Nature Genetics 1998, 22:164-167.
7. Hacia JG, Fan JB, Ryder O, Jin L, Edgemon K, Ghandour G, Mayer RA,Sun B, Hsie L, Robbins CM: Evolutionary sequence comparisonsusing high-density oligonucleotide arrays. Nature Genetics 1999,18:155-158.
8. De Moody DE, Zou Z, McIntyre L: Cross-species hybridisation ofpig RNA to human nylon microarrays. BMC Genomics 2002,3:27.
9. Ji W, Zhou W, Gregg K, Yu N, Davis S: A method for cross-spe-cies gene expression analysis with high-density oligonucle-otide arrays. Nucleic Acids Research 2004, 32:e93.
10. Nagpal S, Karaman MW, Timmerman MM, Ho VV, Pike BL, Hacia JG:Improving the sensitivity and specificity of gene expressionanalysis in highly related organisms through the use of elec-tronic masks. Nucleic Acids Research 2004, 32:e51.
11. Shah G, Azizian M, Bruch D, Mehta R, Kittur D: Cross-species com-parison of gene expression between human and porcine tis-sue, using single microarray platform – preliminary results.Clinical Transplantation 2004, 18:76-80.
12. Tsoi SC, Cale JM, Bird IM, Ewart V, Brown LL, Douglas S: Use ofhuman cDNA microarrays for identification of differentiallyexpressed genes in Atlantic Salmon liver during Aeromonassalmonicida infection. Marine Biotechnology 2003, 5:545-554.
13. Affymetrix: GeneChip Expression Analysis: ExperimentalDesign, Statistical analysis, and Biological Interpretation.Santa Clara, CA, Affymetrix; 2004:56.
14. Hopkins WG: Measures of Reliability in Sports and Science.Sports Medicine 2000, 30:1-15.
15. Chismar JD, Mondala T, Fox HS, Roberts E, Langford D, Masliah E,Salomon DR, Head SR: Analysis of result variability from high-density oligonucleotide arrays comparing same-species andcross-species hybridizations. BioTechniques 2002, 33:516-524.
16. Grigoryev DN, Ma SF, Simon BA, Irizarry RA, Ye SQ, Garcia JGN: Invitro identification and in silico utilization of interspeciessequence similarities using GeneChip® technology. BMCGenomics 2005, 6:62.
17. Wang Z, Lewis MG, Nau ME, Arnold A, Vahey MT: Identificationand utilization of inter-species conserved (ISC) probesets onAffymetrix human GeneChip® platforms for the optimiza-tion of the assessment of expression patterns in non humanprimate (NHP) samples. BMC Bioinformatics 2004, 5:165.
18. Dillman JF, Phillips CS: Comparison of non-human primatewhole blood tissue gene expression profiles. Toxicological Sci-ences: an official journal of the Society of Txicology 2005, 87:306-314.
19. Adjaye J, Herwig R, Herrmann D, Wruck W, Benkahla A, Brink TC,Nowak M, Carnwath JW, Hultschig C, Niemann H, Lehrach H:Cross-species hybridisation of human and bovine ortholo-gous genes on high density cDNA microarrays. BMC Genomics2004, 5:83.
20. Daly TM, Dumaual CM, Dotson CA, Farmen MW, Kadam SK, Hock-ett RD: Precision profiling and components of variability anal-ysis for Affymetrix microarray assays run in a clinicalcontext. The Journal of Molecular Diagnostics 2005, 7:404-412.
21. Hasegawa M, Thorne JL, Kishino H: Time scale of eutherian evo-lution estimated without assuming a constant rate of molec-ular evolution. Genes & Genetic Systems 2003, 78:267-283.
22. Amason U, Janke A: Mitogenomic analyses of eutherian rela-tionships. Cytogenic and Genome Research 2002, 96:20-32.
23. Cao Y, Fujiwara M, Nikaido M, Okada N, Hasegawa M: Interordinalrelationships and timescale of eutherian evolution asinferred from mitochondrial genome data. Gene 2000,259:149-158.
24. Bland JM, Altman DG: Measurement error. BMJ 1996, 313:744.25. Bland JM, Altman DG: Measurement error and correlation
coefficients. BMJ 1996, 313:41-42.26. Breslauer KJ, Frank R, Blöcker H, Marky LA: Predicting DNA
duplex stability from the base sequence. Proceedings of theNational Academy of Sciences of the United States of America 1986,83:3746-3750.
27. Irizarry RA, Bolstad BM, Collin F, Cope LM, Hobbs B, Speed TP:Summaries of Affymetrix GeneChip probe level data. NucleicAcids Research 2003, 31:e15.
28. Affymetrix: Statistical Algorithms Description Document.Santa Clara, CA., Affymetrix; 2004:28.
29. Li C, Wong WH: Model-based analysis of oligonucleotidesarrays: Expression index computation and outlier detection.Proceedings of the National Academy of Sciences of the United States ofAmerica 2001, 98:31-36.
30. Affymetrix: Affymetrix GeneChip Operating Software 1.2.Santa Clara, CA., Affymetrix; 2004:736.
31. Fan W, Pritchard JI, Olson JM, Khalid N, Zhao LP: A class of modelsfor analyzing GeneChip gene expression analysis array data.BMC Genomics 2005, 6:16.
32. Harbig J, Sprinkle R, Enkemann SA: A sequence-based identifica-tion of the genes detected by probesets on the AffymetrixU133 plus 2.0 array. Nucleic Acids Research 2005, 33:e31.
33. Gene Expression Omnibus (GEO) main page [http://www.ncbi.nlm.nih.gov/geo/]
34. Progenika Biopharma S.A. [http://www.progenika.com/]35. Ihaka R, Gentleman RR: A Language for Data Analysis and
Graphics. J Comput Graph Stat 1996, 5:299-314.36. Affymetrix-Technical Support Documentation for Gene-
Chip® Human Genome U133 Plus 2.0 Array [http://www.affymetrix.com/support/technical/byproduct.affx?product=hg-u133-plus]
37. Affymetrix-NetAffxTM Analysis Center [https://www.affymetrix.com/site/login/login.affx]
38. Altschul SF, Gish W, Miller W, Myers EW, Lipman DJ: Basic localalignment search tool. Journal of Molecular Biology 1990,215:403-410.
39. NCBI BLAST [http://www.ncbi.nlm.nih.gov/BLAST/]40. Shapiro SS, Wilk MB, Chen HJ: A comparative study of various
tests of normality. Journal of the American Statistical Association1968, 63:1343-1372.
Page 18 of 18(page number not for citation purposes)
Copyright © 2022 FDOKUMEN