Reproducibility of Fluorescent Expression from Engineered ...
22
RESEARCH ARTICLE Reproducibility of Fluorescent Expression from Engineered Biological Constructs in E. coli Jacob Beal 1 *, Traci Haddock-Angelli 2 , Markus Gershater 3 , Kim de Mora 2 , Meagan Lizarazo 2 , Jim Hollenhorst 4 , Randy Rettberg 2 , iGEM Interlab Study Contributors ¶ 1 Raytheon BBN Technologies, Cambridge, MA, United States of America, 2 iGEM Foundation, Cambridge, MA, United States of America, 3 Synthace, London, United Kingdom, 4 Agilent, Santa Clara, CA, United States of America ¶ Membership list can be found in the Acknowledgments section. * [email protected] Abstract We present results of the first large-scale interlaboratory study carried out in synthetic biol- ogy, as part of the 2014 and 2015 International Genetically Engineered Machine (iGEM) competitions. Participants at 88 institutions around the world measured fluorescence from three engineered constitutive constructs in E. coli. Few participants were able to measure absolute fluorescence, so data was analyzed in terms of ratios. Precision was strongly related to fluorescent strength, ranging from 1.54-fold standard deviation for the ratio between strong promoters to 5.75-fold for the ratio between the strongest and weakest pro- moter, and while host strain did not affect expression ratios, choice of instrument did. This result shows that high quantitative precision and reproducibility of results is possible, while at the same time indicating areas needing improved laboratory practices. Introduction Rapid improvements in our ability to both understand and genetically engineer biological organisms offer the potential for revolutionary applications for medicine, manufacturing, agri- culture, and the environment [1–5]. A major barrier to transition from principle to practice, however, is the frequent sensitivity of biological systems to small changes in their cellular or environmental context [6]. This makes it difficult to reproduce or build on prior results in the lab, let alone to ensure desirable behavior in a deployed application, and may play a part in sig- nificant concerns that have been raised with respect to the state of published biomedical litera- ture [7–10]. Practitioners of synthetic biology face particularly strong challenges in this area, because the engineering approaches applied in this area are often particularly demanding of quantitative precision in models and measurements. At the same time, synthetic biology offers a unique opportunity for improving our understanding of biological systems, through insertion of artifi- cial systems intended to operate relatively independently from the evolved systems of their PLOS ONE | DOI:10.1371/journal.pone.0150182 March 3, 2016 1 / 22 OPEN ACCESS Citation: Beal J, Haddock-Angelli T, Gershater M, de Mora K, Lizarazo M, Hollenhorst J, et al. (2016) Reproducibility of Fluorescent Expression from Engineered Biological Constructs in E. coli. PLoS ONE 11(3): e0150182. doi:10.1371/journal. pone.0150182 Editor: D. Dafydd Jones, Cardiff University, UNITED KINGDOM Received: November 23, 2015 Accepted: February 10, 2016 Published: March 3, 2016 Copyright: © 2016 Beal et al. This is an open access article distributed under the terms of the Creative Commons Attribution License, which permits unrestricted use, distribution, and reproduction in any medium, provided the original author and source are credited. Data Availability Statement: All relevant data are within the paper and its Supporting Information files. Funding: Raytheon BBN Technologies, Synthace, and Agilent provided support in the form of salaries for authors JB, MG, and JH, but did not have any additional role in the study design, data collection and analysis, decision to publish, or preparation of the manuscript. The specific roles of these authors are articulated in the author contributions section. Competing Interests: The authors of this manuscript have read the journal’s policy and have the following
-
Upload
khangminh22 -
Category
Documents
-
view
1 -
download
0
Transcript of Reproducibility of Fluorescent Expression from Engineered ...

RESEARCH ARTICLE
Reproducibility of Fluorescent Expressionfrom Engineered Biological Constructs in E.coliJacob Beal1*, Traci Haddock-Angelli2, Markus Gershater3, Kim de Mora2,Meagan Lizarazo2, Jim Hollenhorst4, Randy Rettberg2, iGEM Interlab Study Contributors
1Raytheon BBN Technologies, Cambridge, MA, United States of America, 2 iGEM Foundation, Cambridge,MA, United States of America, 3 Synthace, London, United Kingdom, 4 Agilent, Santa Clara, CA, UnitedStates of America
¶ Membership list can be found in the Acknowledgments section.* [email protected]
AbstractWe present results of the first large-scale interlaboratory study carried out in synthetic biol-
ogy, as part of the 2014 and 2015 International Genetically Engineered Machine (iGEM)
competitions. Participants at 88 institutions around the world measured fluorescence from
three engineered constitutive constructs in E. coli. Few participants were able to measure
absolute fluorescence, so data was analyzed in terms of ratios. Precision was strongly
related to fluorescent strength, ranging from 1.54-fold standard deviation for the ratio
between strong promoters to 5.75-fold for the ratio between the strongest and weakest pro-
moter, and while host strain did not affect expression ratios, choice of instrument did. This
result shows that high quantitative precision and reproducibility of results is possible, while
at the same time indicating areas needing improved laboratory practices.
IntroductionRapid improvements in our ability to both understand and genetically engineer biologicalorganisms offer the potential for revolutionary applications for medicine, manufacturing, agri-culture, and the environment [1–5]. A major barrier to transition from principle to practice,however, is the frequent sensitivity of biological systems to small changes in their cellular orenvironmental context [6]. This makes it difficult to reproduce or build on prior results in thelab, let alone to ensure desirable behavior in a deployed application, and may play a part in sig-nificant concerns that have been raised with respect to the state of published biomedical litera-ture [7–10].
Practitioners of synthetic biology face particularly strong challenges in this area, because theengineering approaches applied in this area are often particularly demanding of quantitativeprecision in models and measurements. At the same time, synthetic biology offers a uniqueopportunity for improving our understanding of biological systems, through insertion of artifi-cial systems intended to operate relatively independently from the evolved systems of their
PLOSONE | DOI:10.1371/journal.pone.0150182 March 3, 2016 1 / 22
OPEN ACCESS
Citation: Beal J, Haddock-Angelli T, Gershater M, deMora K, Lizarazo M, Hollenhorst J, et al. (2016)Reproducibility of Fluorescent Expression fromEngineered Biological Constructs in E. coli. PLoSONE 11(3): e0150182. doi:10.1371/journal.pone.0150182
Editor: D. Dafydd Jones, Cardiff University, UNITEDKINGDOM
Received: November 23, 2015
Accepted: February 10, 2016
Published: March 3, 2016
Copyright: © 2016 Beal et al. This is an open accessarticle distributed under the terms of the CreativeCommons Attribution License, which permitsunrestricted use, distribution, and reproduction in anymedium, provided the original author and source arecredited.
Data Availability Statement: All relevant data arewithin the paper and its Supporting Information files.
Funding: Raytheon BBN Technologies, Synthace,and Agilent provided support in the form of salariesfor authors JB, MG, and JH, but did not have anyadditional role in the study design, data collection andanalysis, decision to publish, or preparation of themanuscript. The specific roles of these authors arearticulated in the author contributions section.
Competing Interests: The authors of this manuscripthave read the journal’s policy and have the following

host or else to apply precise interventions to that host. Due to their engineered nature, thesesystems are likely to be more tractable to study than natural systems, as well as to provide lever-age for the study of natural systems.
An important step toward addressing these issues is to quantify the degree of variabilityexhibited by engineered genetic constructs across different laboratories. Toward this end, wepresent the results of the first large-scale interlaboratory study of reproducibility in syntheticbiology, carried out by students at 88 institutions around the world as part of the 2014 and2015 International Genetically Engineered Machine (iGEM) competitions. This study focusedon one of the most widely used tools in genetic engineering: constitutive expression of fluores-cent protein from an engineered plasmid (although there are a number of well-known disad-vantages to assays based on fluorescent proteins, such as oxygen dependence and foldingtimes, these techniques are readily accessible, widely used, and still one of the best and easiestways to study many biological phenomena). In particular, each participating team measuredthree engineered constitutive constructs in E. coli grown under standardized conditions follow-ing a particular protocol. Previously, a small-scale interlaboratory study with similar designdemonstrated that it is possible for several laboratories to obtain relative measurements accu-rate to within a 2-fold range using flow cytometry [11]. Our new study enhances these resultswith a much wider range of participants and instruments, as well as identifying likely sourcesof variation and key challenges to be addressed.
In particular, we find that strong fluorescent expression can be measured with a remarkabledegree of precision—to a maximum of 1.54-fold standard deviation. Precision degrades signifi-cantly, however, for constructs with weaker expression. Surprisingly, we find no significant cor-relation between strain and observed behavior, suggesting that the constructs measured are notoverly sensitive to host context, while choice of instrument does appear to affect results. Theseresults are promising, in that they show that engineered genetic constructs can exhibit a highdegree of consistency in behavior even in the face of significant variations in context. At thesame time, the limits encountered in this study highlight the need for adoption of calibratedmeasurements producing standardized units (e.g., [12, 13]) and for protocol approaches thatcan reduce the impact of “cultural art” in laboratory methods (i.e., the undocumented or undo-cumentable differences in how an apparently identifical measurement is executed differentlybetween two individuals or laboratories, and in how the data is handled to turn “raw” observa-tions into reported values), which can be reduced by methods such as [14] and [15]. Finally,this study also demonstrates how critical issues in science and reproducibility can be addressedthrough focused undergraduate research challenges and “citizen science” involving studentsaround the world.
Materials and MethodsThe aim of this study is to establish a broadly relevant baseline for precision and replicability inengineered biological systems. As such, we selected the following experimental conditions asbeing both readily accessible to laboratories at varying levels of sophistication world-wide, andalso representative of much work in biological engineering:
• Host organism: E. coli (preferably a DH5-alpha strain)
• Engineered construct: constitutive expression of green fluorescent protein at three levels(“strong”, “medium”, and “weak”), driven by constitutive promoters from the Anderson pro-moter collection [16] (the same collection drawn from in [11]). Constructs are shown in Fig1, with additional details provided in S1 File.
Reproducibility of Fluorescent Expression from Engineered Biological Constructs in E. coli
PLOSONE | DOI:10.1371/journal.pone.0150182 March 3, 2016 2 / 22
competing interests: The authors received no specificfunding for this work. The following authors areemployed by for-profit companies: Jacob Beal isemployed by Raytheon BBN Technologies; MarkusGershater is employed by Synthace; Jim Hollenhorstis employed by Agilent, and their work on this paperwas thus indirectly supported by their salaries. Thisdoes not alter the authors’ adherence to PLOS ONEpolicies on sharing data and materials.

• Molecular cloning: BioBricks Assembly [17] was recommended for building constructs, butnot required; some teams substituted DNA synthesis or other assembly strategies.
• Culture conditions: 16–18 hours of growth in LB broth plus appropriate antibiotic, at 37°Cand shaking at 300 rpm.
• Replication: triplicate
• Measurement: green fluorescence measured as best capable, in absolute SI units if possible.
In the 2014 iGEM Interlab Study, the protocol was intentionally left at this vague level ofspecification, for two reasons. The first goal was to determine what types of equipment werecommonly accessible at participating institutions worldwide. The second goal was to determinehow much variation was common in protocol execution and reporting, for both culturing andmeasurement.
Following analysis of the 2014 study, the protocol was adjusted with the aim of improvingprecision. In particular, the following key changes were made for the 2015 iGEM Study:
• The set of constructs measured was changed to all use the same plasmid backbone (thuseliminating differences in growth and expression due to the use of different antibiotics) andto have a greater range of expression between constructs.
• A set of defined positive and negative controls were added.
Fig 1. Constitutive fluorescence constructs measured in the 2014 and 2015 iGEM Interlab Studies.
doi:10.1371/journal.pone.0150182.g001
Reproducibility of Fluorescent Expression from Engineered Biological Constructs in E. coli
PLOSONE | DOI:10.1371/journal.pone.0150182 March 3, 2016 3 / 22

• Standardized protocols were specified for construction, culturing, and measurement, alongwith checklists and forms for participating teams to fill out as they executed these protocols.These were split across two forms, attached as S2 and S3 Files.
• When possible, teams were encouraged to provide data in both biological and technical trip-licate (for a total of nine replicates). Standardized reporting of individual sample measure-ments also allowed elimination of anomalous samples: in cases where one sample differsfrom all the rest by at least 5-fold or one set of replicates differs by at least 3-fold (and valuesare not very close to zero), those samples were not used for analysis.
Both studies were advertised to all teams participating in iGEM through an informationpage on the iGEM website, as well as social media and iGEM newsletters. The informationpages for the 2014 and 2015 studies are attached as S4 and S5 Files, respectively. Beginningfrom the initial advertisement, teams had several months in which to indicate that they werevolunteering to collect data for the study, to execute the specified protocols and collect fluores-cence data, and finally to return protocol records and fluorescence data via email or web forms.Finally, we analyzed the returned data and protocols and presented preliminary results and rec-ognition of the contributing teams at each year’s iGEM Giant Jamboree.
For the 2014 study, 45 teams participated, and of these 36 teams were ultimately able to con-tribute data for inclusion in the study. For the 2015 study, 85 teams participated, and of these67 teams were ultimately able to contribute data for inclusion in the study. There were 18teams that participated in both studies, of which 15 contributed data to both studies and 2 con-tributed data to only one of the studies. The results presented in this paper thus representexperiments conducted at 88 institutions worldwide. These institutions are widely distributedacross countries and continents: contributing teams hail from 27 different countries, with 42teams from Europe, 19 teams from Asia, 19 teams from North America, 7 teams from Centraland South America, and 1 team from Oceania. The vast majority of participants were under-graduate students, but many teams also included or were comprised of graduate students orhigh-school students. All members designated by a team as deserving co-authorship for theircontributions are recognized as consortium authors in the Acknowledgments section.
ResultsFor the 2014 study, almost all contributing teams produced one usable set of measurements. Ofthe 36 teams contributing data, five teams measured samples with two instruments, but issuesin data reporting means that all but two of those dual data sets had only one readily usable setof data. Accordingly, we analyze using only the best documented dataset for each team, a totalof 36 datasets.
For the 2015 study, a number of teams decided to collect more than one dataset, using mul-tiple instruments and/or multiple strains: all told, the 67 contributing teams produced a total of95 datasets. This presents an additional opportunity for intra-team data analysis, which will beexplored below in our examination of sources of variability.
All values in these datasets are reported in S1 and S2 Tables. In addition, data from the 2015study protocol and measurement forms is included as S3 and S4 Tables.
Absolute vs. Relative UnitsFirst and foremost in our analysis, we observed that almost none of the datasets include data indirectly comparable SI units. Only two datasets from the 2014 study are reported in absoluteunits, and the units obtained for these datasets are not comparable. In the 2015 study, twelveteams reported at least one dataset in absolute units, generally calibrated to a standard
Reproducibility of Fluorescent Expression from Engineered Biological Constructs in E. coli
PLOSONE | DOI:10.1371/journal.pone.0150182 March 3, 2016 4 / 22

fluorophore, most frequently fluorescein. Two groups of these datasets are directly comparable:two datasets are reported in MEFL (molecules of equivalent fluorescein), and four datasets arereported in ng/mL fluorescein.
In both of these groups of data, however, the ratios between constructs within the datasetsare quite similar, while there are two or more magnitudes of difference across the absolutenumbers reported. It thus appears likely that calibration techniques are being applied inconsis-tently. Highly inconsistent calibration is effectively no better than simply using arbitrary unitsto begin with. Thus, as is frequently the case in current biological research, we cannot directlycompare measurements from one lab to another.
We can still, however, consider the precision and reproducibility of relative fluorescentexpression. Accordingly, the remainder of our analysis will use normalized fluorescence, com-paring the ratio of the constructs most similar between the two years (Strong14 and Strong15)to each other promoter measured. This gives us the following five sets of ratio data to analyze:
• 2014: Strong14/Medium14, Strong14/Weak14
• 2015: Strong15/Medium15, Strong15/Positive15, Strong15/Weak15
The exact construct for each device is noted in Fig 1 and S1 File. Note that for the 2015study we include ratios with the suggested positive control, as teams used this construct for 75data sets, producing a significant body of data to analyze. Negative controls, however, werehighly variable in both identity and data handling, including many zero, negative, and near-zero numbers. This renders them a poor target for ratiometric analysis, and we thus do notinclude them in our analysis.
The remainder of our analysis focuses on the five expression ratios that we have identifiedhere.
Replicability and PrecisionIn evaluating precision and replicability, we began with a hypothesis about the sources of varia-tion that are likely to be encountered. In particular, we hypothesized that observed variationcan be viewed as a mixture of three main sources of variation:
• Mistakes and Failures: The most extreme variations will likely be driven by gross protocolfailures, such as contamination of samples, incorrect assembly of constructs, mixing up sam-ples, or mistakes in data interpretation and entry. The occurrence of such failures is oftenbest addressed by replication and by improvement of controls and procedures, such that mis-takes and failures can be more easily detected and an affected experiment repeated.
• Communication-Based Variability: Some variations are driven by differences in how vari-ous people in various laboratories interpret a given experimental protocol. These types ofvariation can often be addressed by standardization and training, and by more precise com-munication of protocols.
• Systemic Variability: Some variation is due to the nature of the system under observation,e.g., inherent variability of biological organisms, precision limits of instruments, variation inreagents, environmental differences (e.g., laboratory altitude). This type of variation is oftenthe most difficult to address, as it is likely to involve fundamental, technological, or economiclimits.
Single-cell fluorescence levels tend to vary following an approximately log-normal distribu-tion (see e.g., [12, 18–21]). As such, we hypothesize that the ratios in the data-set will also varyfollowing a log-normal distribution, plus some outliers caused by mistakes and failures (Note
Reproducibility of Fluorescent Expression from Engineered Biological Constructs in E. coli
PLOSONE | DOI:10.1371/journal.pone.0150182 March 3, 2016 5 / 22

that it is for this reason that we report variability as x-fold rather than ±x: a plus/minus rangeon a log-scale translates to a multiply/divide range in the standand linear scale. Thus, for exam-ple, one 2-fold standard deviation around a mean of 10 is a range of 5 to 20, and two standarddeviations is a range from 2.5 to 40).
To evaluate this hypothesis, we constructed log-normal distribution diagrams for each fluo-rescence expression ratio, in which sorted data is plotted against the expected probability distri-bution (Fig 2). The mostly linear structure of these plots indicates that variation in expressiondoes generally conform closely to log-normal distribution, with more vertical clustering indi-cating tighter distributions.
Data points significantly off of the linear distribution will be considered outliers: Table 1gives the number of points that we are interpreting as outliers above and below the log-normaldistribution of each data set. These we attribute to mistakes and failures and will not use in fur-ther analysis aimed at understanding the relationship between precision of communicationand system variability. In total, 17% of all data points are outliers, and the rate of outliers in the2015 data set is lower than in the 2014 data set. We hypothesize that the decreased rate of
Fig 2. Log-Normal distribution diagrams for fluorescence expression ratios. The mostly linear structure indicates that variation in expression doesgenerally conform closely to log-normal distribution, with more vertical clustering indicating tighter distributions. Data points significantly off the line will beconsidered outliers and not used in further analysis of these distributions.
doi:10.1371/journal.pone.0150182.g002
Reproducibility of Fluorescent Expression from Engineered Biological Constructs in E. coli
PLOSONE | DOI:10.1371/journal.pone.0150182 March 3, 2016 6 / 22
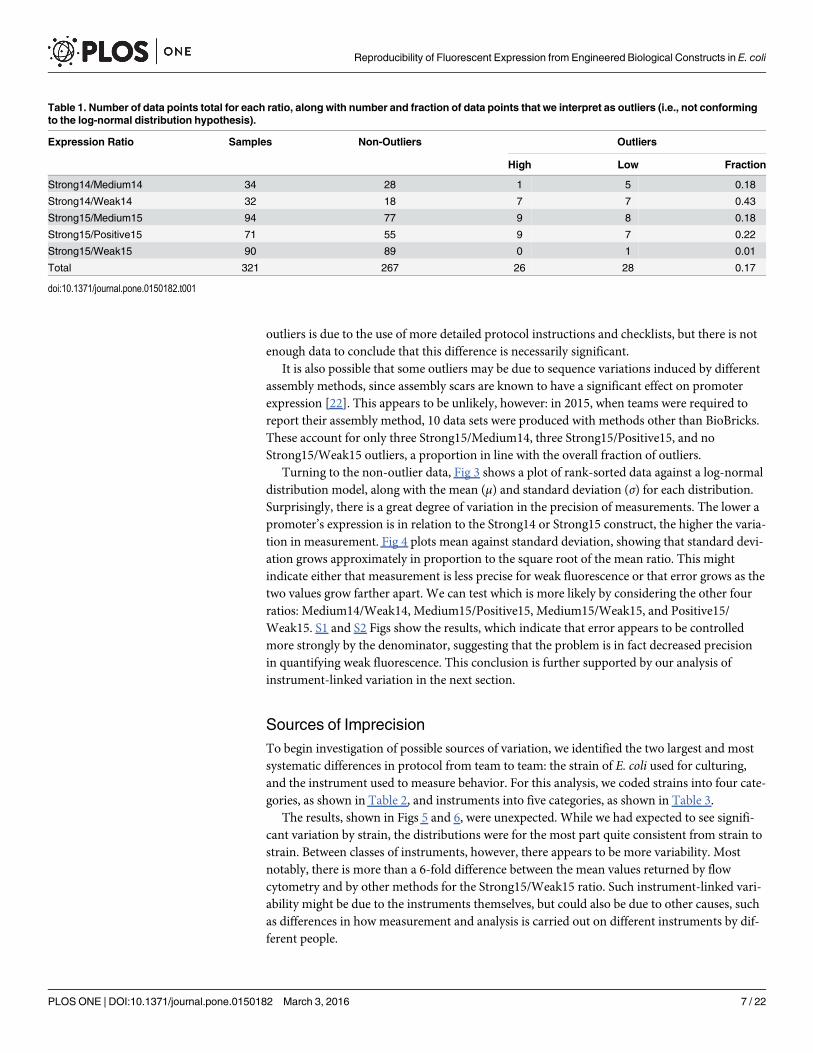
outliers is due to the use of more detailed protocol instructions and checklists, but there is notenough data to conclude that this difference is necessarily significant.
It is also possible that some outliers may be due to sequence variations induced by differentassembly methods, since assembly scars are known to have a significant effect on promoterexpression [22]. This appears to be unlikely, however: in 2015, when teams were required toreport their assembly method, 10 data sets were produced with methods other than BioBricks.These account for only three Strong15/Medium14, three Strong15/Positive15, and noStrong15/Weak15 outliers, a proportion in line with the overall fraction of outliers.
Turning to the non-outlier data, Fig 3 shows a plot of rank-sorted data against a log-normaldistribution model, along with the mean (μ) and standard deviation (σ) for each distribution.Surprisingly, there is a great degree of variation in the precision of measurements. The lower apromoter’s expression is in relation to the Strong14 or Strong15 construct, the higher the varia-tion in measurement. Fig 4 plots mean against standard deviation, showing that standard devi-ation grows approximately in proportion to the square root of the mean ratio. This mightindicate either that measurement is less precise for weak fluorescence or that error grows as thetwo values grow farther apart. We can test which is more likely by considering the other fourratios: Medium14/Weak14, Medium15/Positive15, Medium15/Weak15, and Positive15/Weak15. S1 and S2 Figs show the results, which indicate that error appears to be controlledmore strongly by the denominator, suggesting that the problem is in fact decreased precisionin quantifying weak fluorescence. This conclusion is further supported by our analysis ofinstrument-linked variation in the next section.
Sources of ImprecisionTo begin investigation of possible sources of variation, we identified the two largest and mostsystematic differences in protocol from team to team: the strain of E. coli used for culturing,and the instrument used to measure behavior. For this analysis, we coded strains into four cate-gories, as shown in Table 2, and instruments into five categories, as shown in Table 3.
The results, shown in Figs 5 and 6, were unexpected. While we had expected to see signifi-cant variation by strain, the distributions were for the most part quite consistent from strain tostrain. Between classes of instruments, however, there appears to be more variability. Mostnotably, there is more than a 6-fold difference between the mean values returned by flowcytometry and by other methods for the Strong15/Weak15 ratio. Such instrument-linked vari-ability might be due to the instruments themselves, but could also be due to other causes, suchas differences in how measurement and analysis is carried out on different instruments by dif-ferent people.
Table 1. Number of data points total for each ratio, along with number and fraction of data points that we interpret as outliers (i.e., not conformingto the log-normal distribution hypothesis).
Expression Ratio Samples Non-Outliers Outliers
High Low Fraction
Strong14/Medium14 34 28 1 5 0.18
Strong14/Weak14 32 18 7 7 0.43
Strong15/Medium15 94 77 9 8 0.18
Strong15/Positive15 71 55 9 7 0.22
Strong15/Weak15 90 89 0 1 0.01
Total 321 267 26 28 0.17
doi:10.1371/journal.pone.0150182.t001
Reproducibility of Fluorescent Expression from Engineered Biological Constructs in E. coli
PLOSONE | DOI:10.1371/journal.pone.0150182 March 3, 2016 7 / 22

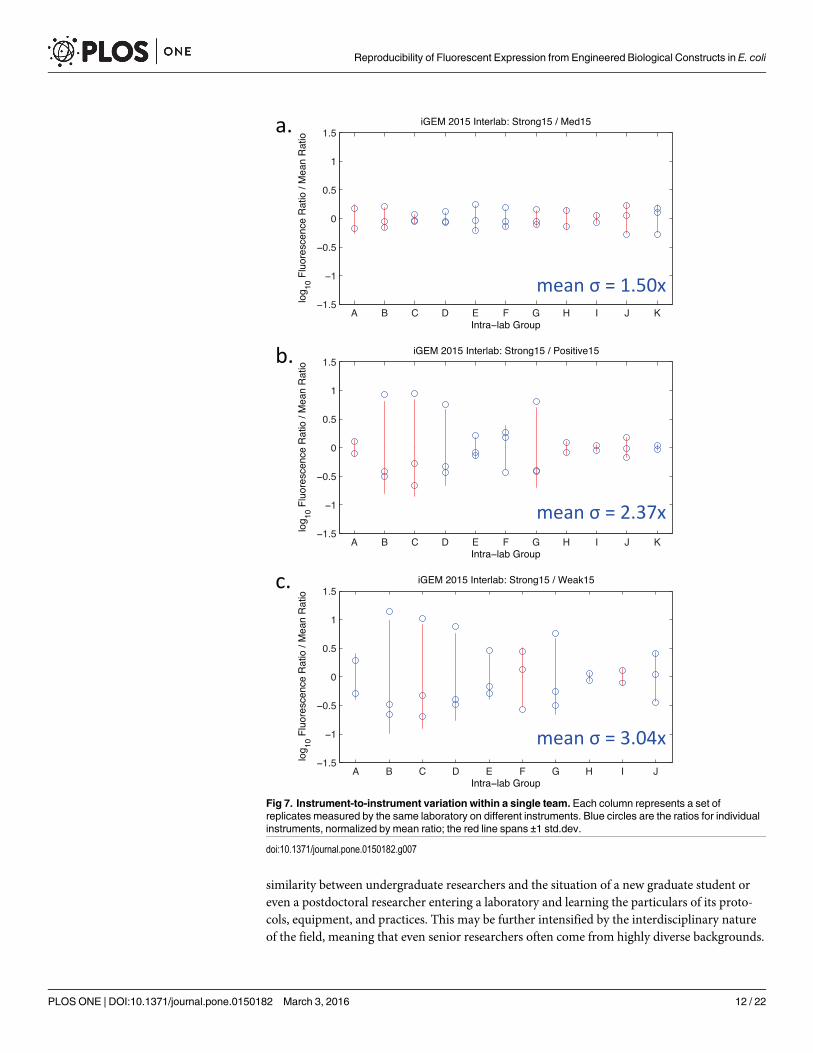
To further investigate the possibility that instrument-linked variation is a source of signifi-cant error, we take advantage of the fact that a number of the contributing teams for the 2015study contributed multiple data sets per sample by measuring the same samples with differentinstruments. For the ratios with Medium15 and Positive15, there are 11 available data-sets, andfor Weak15 there are 10 available data-sets. Most of these have three measurements, two ofwhich are a plate reader and a flow cytometer. If instrument-linked variation is a driving forcein imprecision, then the intra-team variation should be similar in scale to the team-to-teamvariation reported in Fig 3. This is in fact the case, as shown in Fig 7. Most importantly, notethat instrument-linked variation is larger for ratios comparing with lower expression samples,just as it is for variation across data sets overall.
As a cross-check, we also compute the variation between replicates. This variation is muchtighter: the geometric mean of geometric standard deviations across ratios for individual sam-ples is only 1.24-fold, meaning that the fundamental measurement variation of individualinstruments can account for at most approximately half of the tightest observed distribution.
Fig 3. Rank-sorted data for each ratio, omitting outliers. Blue points are observed ratios, red lines show geometric mean (solid) and ±1 std.dev. (dashed),and green line shows log-normal distribution fit.
doi:10.1371/journal.pone.0150182.g003
Reproducibility of Fluorescent Expression from Engineered Biological Constructs in E. coli
PLOSONE | DOI:10.1371/journal.pone.0150182 March 3, 2016 8 / 22
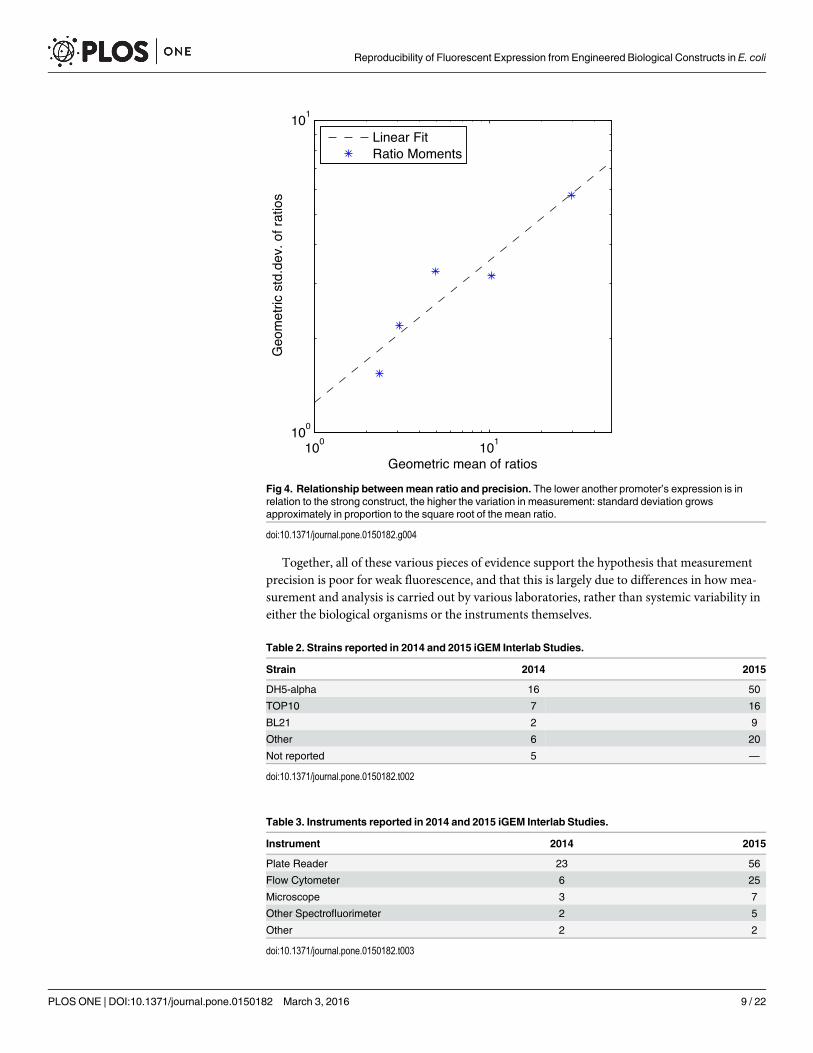
Together, all of these various pieces of evidence support the hypothesis that measurementprecision is poor for weak fluorescence, and that this is largely due to differences in how mea-surement and analysis is carried out by various laboratories, rather than systemic variability ineither the biological organisms or the instruments themselves.
100
101
100
101
Geometric mean of ratios
Geo
met
ric s
td.d
ev. o
f rat
ios
Linear FitRatio Moments
Fig 4. Relationship betweenmean ratio and precision. The lower another promoter’s expression is inrelation to the strong construct, the higher the variation in measurement: standard deviation growsapproximately in proportion to the square root of the mean ratio.
doi:10.1371/journal.pone.0150182.g004
Table 2. Strains reported in 2014 and 2015 iGEM Interlab Studies.
Strain 2014 2015
DH5-alpha 16 50
TOP10 7 16
BL21 2 9
Other 6 20
Not reported 5 —
doi:10.1371/journal.pone.0150182.t002
Table 3. Instruments reported in 2014 and 2015 iGEM Interlab Studies.
Instrument 2014 2015
Plate Reader 23 56
Flow Cytometer 6 25
Microscope 3 7
Other Spectrofluorimeter 2 5
Other 2 2
doi:10.1371/journal.pone.0150182.t003
Reproducibility of Fluorescent Expression from Engineered Biological Constructs in E. coli
PLOSONE | DOI:10.1371/journal.pone.0150182 March 3, 2016 9 / 22

DiscussionOur results reveal a mixed picture of reproducibility and precision for engineered expression offluorescence. On the positive side, the fraction of outliers observed is not too great, and the dis-tributions of results conforms overall quite nicely with the prediction of log-normal distribu-tion. Furthermore, we see that relative expression can be quite tightly quantified for pairs ofstrong fluorescent proteins.
On the negative side, however, the lack of standardized absolute units limits analysis tocomparison of relative levels, which are much less useful than absolute units. Critically, webelieve that the difficulty of performing “quality control” on a data set is a key contributor toboth the number of outliers and to the variation between non-outlier measurements, since mis-takes and failures cannot be readily excluded. Absolute unit measurements can allow controlsamples to be used for more stringent quality control of experiments by direct comparison ofcontrol measurements against expected standard values, thereby allowing detection of
Fig 5. Distributions of data partitioned by E. coli strain for each ratio, omitting outliers.Note that the BL21 subset in 2014 has only a single non-outlierdata point and may thus be effectively ignored.
doi:10.1371/journal.pone.0150182.g005
Reproducibility of Fluorescent Expression from Engineered Biological Constructs in E. coli
PLOSONE | DOI:10.1371/journal.pone.0150182 March 3, 2016 10 / 22

experimental or analytic problems and potentially greatly improving data quality (e.g., asdescribed in [23]).
The difficulty of quantifying larger ratios is also quite concerning, as is the significant varia-tion of values from instrument to instrument, even for the same samples within a single labora-tory. We hypothesize that this phenomenon indicates general difficulties in quantifying weakerlevels of fluorescent expression. It is not surprising that weak signals are more difficult to quan-tify than strong signals. What is surprising is that the dynamic range of effective quantificationappears to be so narrow, since fluorescence is routinely quantified across much wider dynamicranges than the mean strong/weak ratio observed in this study. Our suspicion is that this is notfundamentally due to the instruments (though flow cytometers do typically have a widerdynamic range than the other instruments used), but rather due to differences in how variouslaboratories deal with background fluorescence and with data interpretation and analysis.
One possible criticism of this study is the predominance of undergraduate researchers. Weargue, however, that undergraduate researchers are more representative of the actual cultureand practice of a laboratory than is perhaps comfortable to admit. There is a good deal of
Fig 6. Distributions of data partitioned by measuring instrument for each ratio, omitting outliers.Note that some subsets have only one or zero non-outlier data points and may thus be effectively ignored.
doi:10.1371/journal.pone.0150182.g006
Reproducibility of Fluorescent Expression from Engineered Biological Constructs in E. coli
PLOSONE | DOI:10.1371/journal.pone.0150182 March 3, 2016 11 / 22
similarity between undergraduate researchers and the situation of a new graduate student oreven a postdoctoral researcher entering a laboratory and learning the particulars of its proto-cols, equipment, and practices. This may be further intensified by the interdisciplinary natureof the field, meaning that even senior researchers often come from highly diverse backgrounds.
Fig 7. Instrument-to-instrument variation within a single team. Each column represents a set ofreplicates measured by the same laboratory on different instruments. Blue circles are the ratios for individualinstruments, normalized by mean ratio; the red line spans ±1 std.dev.
doi:10.1371/journal.pone.0150182.g007
Reproducibility of Fluorescent Expression from Engineered Biological Constructs in E. coli
PLOSONE | DOI:10.1371/journal.pone.0150182 March 3, 2016 12 / 22

Overall, we think that the results of this study are largely good news for synthetic biologyand for any other biological research that makes use of engineered expression of fluorescentproteins. First, the Anderson collection promoters seem to be fairly stable in their performancebetween different strains of E. coli, meaning that they are indeed generally a good startingpoint for tuning of gene expression. Second, we have established a clear baseline for precisionand reproducibility. Since this has been established with the aid of undergraduates at a widevariety of institutions around the world, we argue that it should be considered as strong mini-mum standard for accuracy and reproducibility of published work.
Paradoxically, the measurement problems highlighted in this study may also be good news.Is is not surprising that this study shows problems in precision and reproducibility: challengeswith variation in behavior and difficulty in reproducing and building upon results are com-monly voiced concerns within the field. What is surprising and significant, however, is thatthey appear to be tied closely to the use of instruments and/or analysis of data. The instrumentsthemselves appear to be quite reliable, as indicated by the tight replicate-to-replicate distribu-tion. If the instruments are reliable, yet the same sets of samples produce markedly differentrelative values on different instruments, then this indicates that the problem is likely to be inhow people are assaying cells with their instruments and the how they are analyzing the dataproduced by those instruments. This is likely to be compounded by differences in sensitivityand detection range: for example, flow cytometers typically have a wider range than plate read-ers, and thus a flow cytometer data set is likely to be less sensitive to how weak signals andbackground fluorescence are handled. In short, these simple biological systems appear to bemuch less variable than the ways in which we are studying them. This is good news because ifthe variability in precision and reproducibility was primarily systemic—i.e., due to the biologi-cal systems being studied, then it might be very difficult or even impossible to make significantimprovements. Instead, however, much of the observed variability appears to be communica-tion-based, i.e., closely tied to the ways in which people are studying those systems, and thereare thus many good possibilities for rapid improvement in precision.
In particular, to address variability in fluorescent measurement, we recommend pursuit ofthree methods for increasing precision, listed here in order of ease of adoption, are:
• Dissemination, training, and standardization around improved protocols for calibra-tion of assays. There are well-established protocols for calibration of flow cytometers toabsolute units [12, 23–26], but these have not yet been widely adopted outside of themedical diagnostic community. Other calibration protocols exist for measurement of pop-ulation fluorescence (e.g., [13, 27, 28]), but these also have not been effectively dissemi-nated through the community.
• Removing “craft” from protocol execution.Much of the training that scientists receive inwet-lab protocols has an aspect of “apprenticeship” about it: important “craft” information istransmitted that is not formally written down in any location, and this makes it more difficultfor protocols to be correctly replicated. A number of systems have been developed whichmake attempt to regularize the manner in which humans execute protocols (e.g., [14, 29]).These approaches still have lab work being done by humans, but apply techniques such asdetailed checklists and computer monitoring of protocol execution to decrease the skillrequired and the variability of results produced by humans executing protocols.
• Increased automation of protocols. Variability in protocol execution can be reduced yet fur-ther by entirely or almost-entirely automating the execution of protocols. The two mainapproaches currently being developed in these areas are robotics (e.g., [30–33]) and micro-fluidics (e.g., [15, 34]). In the long run, this is where most of the field will likely go, just as
Reproducibility of Fluorescent Expression from Engineered Biological Constructs in E. coli
PLOSONE | DOI:10.1371/journal.pone.0150182 March 3, 2016 13 / 22

automation has produced gains in productivity and precision in most other fields. At present,adopting protocol automation is impractical for most laboratories, as doing so generallyrequires a large investment of time and resources. Ongoing miniaturization and models foroutsourcing to “cloud labs,” however, may soon make this technology much more widelyaccessibly.
Effective use of any of these approaches also requires deepening our understanding of boththe systems we study and the means applied for studying them. We need to know whichaspects of protocols are most sensitive, and which are susceptible to optimization and modifi-cation to fit circumstances, we need better controls and procedures for eliminating outliers,and we also need to extend and apply all of these principles beyond constitutive fluorescence inE. coli to a much wider range of organisms and engineered systems. Toward this end, we aremaking the dataset collected in this study available to the scientific community for deeper, mul-tifactorial analysis, and intend to organize further interlaboratory studies putting our hypothe-ses to the test and extending their range of study.
Supporting InformationS1 File. DNA Constructs. DNA constructs for the 2014 and 2015 iGEM Interlab Studies.(PDF)
S2 File. 2015 Study Protocol. Detailed protocol specification and reporting form providedfor 2015 iGEM Interlab Study.(PDF)
S3 File. 2015 Study Measurement Reporting. Detailed measurement reporting form pro-vided for 2015 iGEM Interlab Study.(PDF)
S4 File. 2014 Study Information Page. Information and instructions provided for 2014iGEM Interlab Study. Document provided is a snapshot of the page as of October 4th, 2015,which includes information presented on participation and the preliminary results of thestudy.(PDF)
S5 File. 2015 Study Information Page. Information and instructions provided for 2015iGEM Interlab Study. Document provided is a snapshot of the page as of October 4th, 2015.(PDF)
S1 Table. 2014 Summary Data. Datasets analyzed for the 2014 iGEM Interlab Study.(CSV)
S2 Table. 2015 Summary Data. Datasets analyzed for the 2015 iGEM Interlab Study.(CSV)
S3 Table. 2015 Protocol Form Responses. Response information from the protocol specifi-cation and reporting form for the 2015 iGEMmeasurement study. Some teams returnedtheir forms (or portions thereof) manually for a number of reasons, most frequently due toInternet censorship in their home countries; entries from these teams are not included in theattached form. Only technical entries for the form are included, and team names have beenreplaced by numbers corresponding to the numbers in the summary data table.(CSV)
Reproducibility of Fluorescent Expression from Engineered Biological Constructs in E. coli
PLOSONE | DOI:10.1371/journal.pone.0150182 March 3, 2016 14 / 22

S4 Table. 2015 Measurement Form Responses. Response information from the measure-ment reporting form for the 2015 iGEMmeasurement study. Some teams returned theirforms (or portions thereof) manually for a number of reasons, most frequently due to Internetcensorship in their home countries; entries from these teams are not included in the attachedform. Only technical entries for the form are included, and team names have been replaced bynumbers corresponding to the numbers in the summary data table.(CSV)
S1 Fig. Additional Log-Normal Distribution Graphs. Log-normal distribution graphs foradditional ratios. Graphs are attached for:
• Medium14/Weak14
• Medium15/Positive15
• Medium15/Weak15
• Positive15/Weak15(PDF)
S2 Fig. Additional Rank-Sorted Graphs. Rank-sorted data graphs for additional ratios.Graphs are attached for:
• Medium14/Weak14
• Medium15/Positive15
• Medium15/Weak15
• Positive15/Weak15(PDF)
AcknowledgmentsThe authors wish to thank Sarah Munro and Marc Salit of NIST for help in designing thisstudy.
Consortium authors include all persons self-identified by contributing teams as deservingco-authorship credit. Contributors are listed alphabetically within team, and teams alphabeti-cally and by year. Note that some persons may be credited as contributing in both years. Teamnames are given as identified in iGEM records: full details of each team’s institution and addi-tional members may be found online in the iGEM Foundation archives at:
http://year.igem.org/Team:namee.g.: full information on the 2015 ETH_Zurich team may be found at:http://2015.igem.org/Team:ETH_Zurich
2014 iGEM Interlab Study Contributors
• Aachen: Philipp Demling, Rene Hanke, Michael Osthege, Anna Schechtel, Suresh Sudarsan,Arne Zimmermann
• Aalto-Helsinki: Bartosz Gabryelczyk, Martina Ikonen, Minnamari Salmela
• ATOMS Turkiye:Muradıye Acar, Muhammed Fatih Aktas, Furkan Bestepe, Furkan SacitCeylan, Sadık Cigdem, Mikail Dohan, Mustafa Elitok, Mehmet Gunduz, Esra Gunduz, Omer
Reproducibility of Fluorescent Expression from Engineered Biological Constructs in E. coli
PLOSONE | DOI:10.1371/journal.pone.0150182 March 3, 2016 15 / 22
Faruk Hatipoglu, Turan Kaya, Orhan Sayin, Safa Tapan, Osman Faruk Tereci, AbdullahUçar, Mustafa Yilmaz
• Austin_Texas: Jeffrey Barrick, Alex Gutierrez, Dennis Mishler, Jordan Monk, Kate Morten-sen, Nathan Shin, Ella Watkins
• BIT: Yintong Chen, Yuji Jin, Yuanjie Shi, Haoqian Myelin Zhang
• Brasil-SP: Bruno Ono, Ieda Maria Martinez Paino, Lais Ribovski, Ivan Silva, Danilo KeijiZampronio
• Braunschweig: Nils Birkholz, Rudiger Frederik Busche, Oliver Konzock, Steffen Lippold,Carsten Ludwig, Melanie Philippi, Lukas Platz, Christian Sigismund, Susanne Weber, MarenWehrs, Niels Werchau, Anna Wronska, Zen-Zen Yen
• BostonU: Yash Agarwal, Evan Appleton, Douglas Densmore, Ariela Esmurria, KathleenLewis, Alan Pacheco
• Carnegie_Mellon:Marcel Bruchez, Danielle Peters, Cheryl Telmer, Lena Wang
• Colombia: Silvia Canas-Duarte, Daniel Giraldo-Perez, Camilo Gomez-Garzon, JorgeMadrid-Wolff, Nathaly Marin-Medina, Valentina Mazzanti, Laura Rodriguez-Forero, EitanScher
• CU-Boulder: Robin Dowell, Samantha O’Hara, Cloe Simone Pogoda, Kendra Shattuck
• DTU-Denmark: Ali Altintas, Anne Pihl Bali, Rasmus Bech, Anne Egholm, Anne SofieLaerke Hansen, Kristian Jensen, Kristian Barreth Karlsen, Caroline Mosbech
• Evry: Sophia Belkhelfa, Noemie Berenger, Romain Bodinier, Cecile Jacry, Laura Matabishi-Bibi, Pierre Parutto, Julie Zaworski
• Groningen: Andries de Vries, Freek de Wijs, Rick Elbert, Lisa Hielkema, Chandhuru Jaga-deesan, Bayu Jayawardhana, Oscar Kuipers, Anna Lauxen, Thomas Meijer, Sandra Mous,Renske van Raaphorst, Aakanksha Saraf, Otto Schepers, Oscar Smits, Jan-Willem Veening,Ruud Detert Oude Weme, Lianne Wieske
• Imperial: Catherine Ainsworth, Xenia Spencer-Milnes
• ITESM-CEM: Alejandro GómezÁvila, Eddie Cano Gamez, Ana Laura Torres Huerta, CarlosAlejandro Meza Ramirez
• LMU-Munich: Philipp Popp, Jara Radeck, Anna Sommer
• LZU-China: Xiangkai Li, Qi Wu, Hongxia Zhao, Ruixue Zhao
• METU_Turkey: Irem Bastuzel, Yasemin Ceyhan, Mayda Gursel, Burak Kizil, Ilkem Kumru,Yasemin Kuvvet, Helin Tercan, Seniz Yuksel
• NU_Kazakhstan: Luiza Niyazmetova
• Oxford: Timothy Ang, Lucas Black, Ciaran Kelly, George Wadhams
• Paris_Bettencourt: Clovis Basier, Urszula Czerwinska
• Sumbawagen: Cindy Suci Ananda, Muhammad Al Azhar, Adelia Elviantari, Maya Fitriana,Arief Budi Witarto, Yulianti
• SUSTC-Shenzhen: Jia Fangxing, Qingfeng Hou, Wan Pei, Chen Rifei, Wang Rong, HuangWei, Zhang Yushan
Reproducibility of Fluorescent Expression from Engineered Biological Constructs in E. coli
PLOSONE | DOI:10.1371/journal.pone.0150182 March 3, 2016 16 / 22

• SYSU-China:He Jianguo, Dengwen Lai, Pai Li, Jianheng Liu, Chunyang Ni, Qianbin Zhang
• Tec-Monterrey: Cinthya Cadenas, Eduardo J. Zardain Canabal, Claudia Nallely AlonsoCantu, Mercedes Alejandra Vazquez Cantu, Eduardo Cepeda Canedo, Cesar Miguel ValdezCordova, Jose Alberto de la Paz Espinosa, Carlos Enrique Alavez Garcia, Ana Laura NavarroHeredia, Adriana Hernandez, Sebastian Valdivieso Jauregui, Eduardo Ramirez Montiel,Eduardo Serna Morales, Yamile Minerva Castellanos Morales, Omar Alonso Cantu Pena,Eduardo A. Ramirez-Rodríguez, Elizabeth Vallejo Trejo
• UANL_Mty-Mexico: Jesus Gilberto Rodriguez Ceja, Jesus Eduardo Martinez Hernandez,Mario Alberto Pena Hernandez, Enrique Amaya Perez, Rebeca Paola Torres Ramirez, J.Claudio Moreno Rocha, Alber Sanchez, Claudia Melissa Guerra Vazquez
• uOttawa:Martin Hanzel, Sarah Mohand-Said, Shihab Sawar, Dylan Siriwardena, AlexTzahristos
• Uppsala:Nils Anlind, Martin Friberg, Erik Gullberg, Stephanie Herman
• Utah_State: Dallin Christensen, Sara Gertsch, Cody Maxfield, Charles Miller, Ryan Putman
• Valencia_UPV: Christine Bauerl, Lucia T Estelles Lopez, Estefania Huet-Trujillo, MartaVazquez Vilar
• Wageningen_UR:Marlène Sophie Birk, Nico Claassens, Walter de Koster, Rik van Rosma-len, Wen Ying Wu
• Warwick: Sian Davies, Dan Goss, William Rostain, Chelsey Tye, Waqar Yousaf
• WPI-Worcester:Natalie Farny, Chloe LaJeunesse, Alex Turland
• XMU-China: An Chen, Jielin Chen, Yahong Chen, Zehua Chen, Baishan Fang, Xiaotong Fu,Xifeng Guo, Yue Jiang, Yiying Lei, Jianqiao Li, Zhe Li, Chang Liu, Weibing Liu, Yang Liu,Yizhu Lv, Qingyu Ruan, Yue Su, Chun Tang, Yushen Wang, Fan Wu, Xiaoshan Yan, RuihuaZhang, Tangduo Zhang
• Yale: Farren Isaacs, Ariel Leyva-Hernandez, Natalie Ma, Stephanie Mao, Yamini Naidu
2015 iGEM Interlab Study Contributors
• Aalto-Helsinki: Tuukka Miinalainen
• Aix-Marseille:Marion Aruanno, Daniel Calendini, Yoann Chabert, Gael Chambonnier,Myriam Choukour, Ella de Gaulejac, Camille Houy, Axel Levier, Loreen Logger, SebastienNin, Valerie Prima, James N. Sturgis
• Amoy: Beibei Fang
• ATOMS-Turkiye: Sadik Cigdem, Turan Kaya, Abdullah Ucar
• Austin_UTexas: Alejandro Gutierrez, Dennis Mishler, Revanth Poondla, Sanjana Reddy,Tyler Rocha, Natalie Schulte, Devin Wehle
• Bielefeld-CeBiTec:Marta Eva Jackowski
• Birkbeck: Sean Ross Craig, Ariana Mirzarafie-Ahi, Elliott Parris, Luba Prout, Barbara Steijl,Rachel Wellman,
• BIT: Zhao Fan, Zhang Jing, YangWei, Yang Yuanzhan, Wen Zhaosen
Reproducibility of Fluorescent Expression from Engineered Biological Constructs in E. coli
PLOSONE | DOI:10.1371/journal.pone.0150182 March 3, 2016 17 / 22

• BostonU: Evan Appletion, Jeffrey Chen, Abha Patil, Shaheer Priracha, Kate Ryan, Nick Sal-vador, John Viola
• Brasil-USP: Camila Maria S. Boralli, Camila Barbosa Bramorski, Juliana Cancino-Bernardi,Ana Laura de Lima, Paula Maria Pincela Lins, Cristiane Casonato Melo, Deborah CezarMendonca, Thiago Mosqueiro, Lais Ribovski, Everton Silva, Graziele Vasconcelos
• Carnegie_Mellon: Ruchi Asthana, Donna Lee, Cheryl Telmer, Michelle Yu
• CityU_HK: Peter Choi, Effie Lau, Kenneth Lau, Oscar Ying
• Cork_Ireland: Brandon Malone, Paul Young
• CSU_Fort_Collins: Aidan Ceney, Dakota Hawthorne, Sharon Lian, SamMellentine,Dylan Miller, Barbara Castro Moreira, Christie Peebles, Olivia Smith, Kevin Walsh, AllisonZimont
• CU_Boulder:Michael Brasino, Michael Donovan, Hannah Young
• Czech_Republic: Jan Bejvl, Daniel Georgiev, Hynek Kasl, Katerina Pechotova, Vaclav Peli-sek, Anna Sosnova, Pavel Zach
• Duke: Anthony Ciesla, Benjamin Hoover
• Edinburgh: Elliott Chapman, Jon Marles-Wright, Vicky Moynihan, Liusaidh Owen, BrookeRothschild-Mancinelli
• EPF_Lausanne: Emilie Cuillery, Joseph Heng, Vincent Jacquot, Paola Malsot, Rocco Meli,Cyril Pulver, Ari Sarfatis, Loic Steiner, Victor Steininger, Nina van Tiel, Gregoire Thouvenin,Axel Uran
• ETH_Zurich: Lisa Baumgartner, Anna Fomitcheva, Daniel Gerngross, Verena Jagger,Michael Meier, Anja Michel
• Exeter University: Jasmine Bird, Bradley Brown, Todd Burlington, Daniel Herring, JosephSlack, Georgina Westwood, Emilia Wojcik
• Freiburg: Julian Bender, Julia Donauer, Ramona Emig, Rabea Jesser, Julika Neumann, LaraStuhn
• Gifu: Takema Hasegawa, Tomoya Kozakai, Haruka Maruyama
• Glasgow: Sean Colloms, Charlotte Flynn, Vilija Lomeikaite, James Provan
• HUST-China: Kang Ning, Shuyan Tang, Guozhao Wu, Yunjun Yang, Zhi Zeng, Yi Zhan
• HZAU-China: Pan Chu, Jun Li, Keji Yan
• IISER_Pune: Chaitanya A. Athale, Swapnil Bodkhe, Manasi Gangan, Harsh Gakhare, YashJawale, Snehal Kadam, Prachiti Moghe, Gayatri Mundhe, Neha Khetan, Ira Phadke, PrashantUniyal, Siddhesh Zadey
• KU Leuven: Ines Cottignie, Eline Deprez, Astrid Deryckere, Jasper Janssens, Frederik Jon-naert, Katarzyna Malczewska, Thomas Pak, Johan Robben, Ovia Margaret Thirukkumaran,Vincent Van Deuren, Laurens Vandebroek, Laura Van Hese, Laetitia Van Wonterghem,Leen Verschooten, Moritz Wolter
• Leicester: Joss Auty, Richard Badge, Liam Crawford, Raymond Dalgleish, Amy Evans, Cam-eron Grundy, Charlie Kruczko, Payal Karia
Reproducibility of Fluorescent Expression from Engineered Biological Constructs in E. coli
PLOSONE | DOI:10.1371/journal.pone.0150182 March 3, 2016 18 / 22
• Lethbridge: Graeme Glaister, Rhys Hakstol, Seme Mate, Karin Otero, Dustin Smith, JeffTingley, Hans-JoachimWieden
• LZU-China: Xiangkai Li, Haotian Wang, Qi Wu, Ningning Yao, Ruixue Zhao
• Marburg:Matthias Franz, Anna Knoerlein, Nicolas Koutsoubelis, Anne C. Loechner, MaxMundt, Alexandra Richter, Oliver Schauer
• METU_Turkey: Ilkem Kumru
• MIT:Marjorie Buss, Sivateja Tangirala, Brian Teague
• Nankai: Tianyi Huang, Xinhao Song, Yibing Wei, Zhaoran Zhang
• NEAU-China: Longzhi Cao, Cheng Li, Kang Yang
• NJAU_China: Zhiqin Chen, Yuxing Fang, Libo Sun, Weiyi Wang, Yang Yang
• Northeastern_Boston: David Adams, Joshua Colls, Ariela Esmurria, Joshua Timmons,David Urick
• NTNU_Trondheim: Julia Anna Adrian, Madina Akan, Youssef Chahibi, Rahmi Lale,Typhaine Le Doujet, Marit Vaagen Roee
• NU_Kazakhstan: Altynay Abdirakhmanova, Askarbek Orakov, Azhar Zhailauova
• OUC-China: Jinyang Liang, Yu Ma, Qikai Qin, Yetian Su
• Oxford: Ju Yeon Han, Raphaella Hull, Wei Chung Kong, Li Chieh Lu, Duke Quinton
• Paris-Saclay: Pauline Aubert, Johan Bourdarias, Olivier Bugaud, Coralie Demon-Chaine,Isabelle Hatin, Ibtissam Kaid-Slimane, Seong Koo Kang, Audrey Moatti, Cheikh Fall Ndiaye
• Pasteur_Paris:Mathilde Ananos, Alexander Arkhipenko, Valentin Bailly, Jules Caput, JavierCastillo, Alma Chapet-Batlle, Floriane Cherrier, Claudia Demarta-Gatsi, Deshmukh Gopaul,Muriel Gugger, Caroline Lambert, Lucas Krauss, Amelie Vandendaele
• SCUT: Li Xiaojing, Lin Xiaomei, Luo Xunxun
• SDU-Denmark: Anders Chr. Hansen, Tina Kronborg, Jens S. Pettersen
• Stanford-Brown: Charles Calvet, Tyler Dae Devlin, Kosuke Fujishima, Danny Greenberg,Tina Ju, Ryan Kent, Daniel Kunin, Erica Lieberman, Griffin McCutcheon, Thai Nguyen,Lynn Rothschild, Joseph D. Shih, Jack Takahashi, Kirsten Thompson, Forrest Tran, DanielXiang
• Stockholm: Felix Richter
• SYSU-Software: Yang Xiaoran, Hu Xiangyue
• SZMS_15_Shenzhen: Changyuan Deng, Shuyu Hua, Yumeng Li, Xinyu Meng, BoxiangWang, Yingqi Wang, XuanWang, Zixuan Xu, Jieyu Yan, Ming Yan, Yineng Zhou
• TecCEM: Edgar Alberto Alcalá Orozco, José Alberto Cristerna Bermúdez, Daniela FloresGómez, José Ernesto Hernández Castañeda, Diana Clarisse Montaño Navarro, Juana YessicaPérezÁvila, María Fernanda Salazar Figueroa, María Fernanda Sánchez Arroyo, Oliva Angél-ica Sánchez Montesinos, Ana Laura Torres Huerta
• TecCEM_HS:Ángel Farid Rojas Cruz, Daniela Flores Gómez, Carlos Ramos Gutiérrez,Alonso Pérez Lona, Carlos Alejandro Meza Ramírez, Fernanda Sotomayor Olivares, Jorge
Reproducibility of Fluorescent Expression from Engineered Biological Constructs in E. coli
PLOSONE | DOI:10.1371/journal.pone.0150182 March 3, 2016 19 / 22

Sebastián Rodríguez Iniesta, Juan Carlos Rueda Silva, Oliva Angélica Sánchez Montesinos,Ana Laura Torres Huerta
• Tokyo_Tech: Shotaro Ayukawa, Takahiro Kashiwagi, Daisuke Kiga, Misa Minegishi, RikuShinohara, Hiraku Tokuma, Yuta Yamazaki, Shuhei Yasunishi, Erinn Sim Zixuan
• TrinityCollegeDublin: Remsha Afzal, Matthew Carrigan, Barry Moran, Marlena Mucha,Arnas Petrauskas
• TU_Delft: Stefan Marsden, Michelle Post, Anne Rodenburg, Hector Sanguesa, Marit van derDoes, Erwin van Rijn, Max van’t Hof
• TU_Eindhoven: Yeshi de Bruin, Hans de Ferrante, Elles Elschot, Laura Jacobs, Jan-WillemMuller, Sjoerd Nooijens, Femke Vaassen, Cas van der Putten, Esther van Leeuwen, Laura vanSmeden, Kwan Kwan Zhu
• Tuebingen: Kevin Sabath, Katharina Sporbeck, Nicolai von Kügelgen, Lisa Wellinger
• UCL: Stefanie Braun, Jack Ho, Yash Mishra, Mariola Sebastian, Lucas von Chamier
• UCLA: Fasih M. Ahsan, Megan A. Satyadi
• UC_San_Diego: Vivienne Gunadhi, Phillip Kyriakakis, Jenny Lee, Walter Thavarajah
• UMaryland: Kimia Abtahi, Robert Hand, Chun Mun Loke, AdamWahab, Iowis Zhu
• UNITN-Trento: Cristina Del Bianco, Fabio Chizzolini, Elisa Godino, Roberta Lentini, SherefS. Mansy, Noel Yeh Martin, Claudio Oss Pegorar
• Utah_State: Alexander Cook, Sara Gertsch, Timothy Kerns, Charles Miller, Chad Nielsen,Michael Paskett, Alexander Torgesen
• Vanderbilt: Stephen Lee, Ophir Ospovat, Sikandar Raza, Daniel Shaykevich, Jarrod Shilts
• Vilnius-Lithuania: Barbora Bajorinaite, Mykolas Bendorius, Ieva Rauluseviciute, IevaSavickyte, Sarunas Tumas
• William_and_Mary:William Buchser, Elli Cryan, Caroline Golino, Andrew Halleran, Tay-lor Jacobs, Michael LeFew, Joe Maniaci, John Marken, Margaret Saha, Panya Vij
• WPI-Worcester: Kayla DeSanty, Natalie Farny, Julie Mazza
Author ContributionsConceived and designed the experiments: JB TH-A KdMMLMG RR. Analyzed the data: JBMG JH TH-A. Wrote the paper: JB TH-A MG KdMML JH RR.
References1. Ro DK, Paradise EM, Ouellet M, Fisher KJ, Newman KL, Ndungu JM, et al. Production of the antimalar-
ial drug precursor artemisinic acid in engineered yeast. Nature. 2006; 440(10.1038):940–943. doi: 10.1038/nature04640 PMID: 16612385
2. Xie Z, Wroblewska L, Prochazka L, Weiss R, Benenson Y. Multi-input RNAi-based logic circuit for iden-tification of specific cancer cells. Science. 2011; 333(6047):1307–1311. doi: 10.1126/science.1205527PMID: 21885784
3. Dunlop MJ, Keasling JD, Mukhopadhyay A. A model for improving microbial biofuel production using asynthetic feedback loop. Systems and synthetic biology. 2010; 4(2):95–104. doi: 10.1007/s11693-010-9052-5 PMID: 20805930
Reproducibility of Fluorescent Expression from Engineered Biological Constructs in E. coli
PLOSONE | DOI:10.1371/journal.pone.0150182 March 3, 2016 20 / 22

4. Khalil AS, Collins JJ. Synthetic biology: applications come of age. Nature Reviews Genetics. 2010; 11(5):367–379. doi: 10.1038/nrg2775 PMID: 20395970
5. Endy D. Foundations for engineering biology. Nature. 2005; 438(7067):449–453. doi: 10.1038/nature04342 PMID: 16306983
6. Kwok R. Five hard truths for synthetic biology. Nature. 2010; 463(7279):288–90. doi: 10.1038/463288aPMID: 20090726
7. Prinz F, Schlange T, Asadullah K. Believe it or not: howmuch can we rely on published data on poten-tial drug targets? Nature reviews Drug discovery. 2011; 10(9):712–712. doi: 10.1038/nrd3439-c1PMID: 21892149
8. Begley CG, Ellis LM. Drug development: Raise standards for preclinical cancer research. Nature. 2012;483(7391):531–533. doi: 10.1038/483531a PMID: 22460880
9. Mobley A, Linder SK, Braeuer R, Ellis LM, Zwelling L. A survey on data reproducibility in cancerresearch provides insights into our limited ability to translate findings from the laboratory to the clinic.PLOS ONE. 2013. doi: 10.1371/journal.pone.0063221
10. Lazebnik Y. Can a biologist fix a radio? x2014;Or, what I learned while studying apoptosis. Cancer cell.2002; 2(3):179–182. doi: 10.1016/S1535-6108(02)00133-2 PMID: 12242150
11. Kelly JR, Rubin AJ, Davis JH, Ajo-Franklin CM, Cumbers J, Czar MJ, et al. Measuring the activity of Bio-Brick promoters using an in vivo reference standard. Journal of Biological Engineering. 2009; 3(4). doi:10.1186/1754-1611-3-4 PMID: 19298678
12. Beal J, Weiss R, Yaman F, Davidsohn N, Adler A. A Method for Fast, High-Precision Characterizationof Synthetic Biology Devices. MIT; 2012. MIT-CSAIL-TR-2012-008.
13. Rosenfeld N, Perkins TJ, Alon U, Elowitz MB, Swain PS. A fluctuation method to quantify in vivo fluo-rescence data. Biophysical journal. 2006; 91(2):759–766. doi: 10.1529/biophysj.105.073098 PMID:16648159
14. Klavins E. The Aquarium Project; Retrieved Oct. 2, 2014. http://klavinslab.org/aquarium.html.
15. Huang H, Densmore D. Integration of microfluidics into the synthetic biology design flow. Lab on aChip. 2014; 14(18):3459–3474. doi: 10.1039/C4LC00509K PMID: 25012162
16. Anderson JC. Anderson promoter collection; Retrieved Oct. 30, 2015. http://parts.igem.org/Promoters/Catalog/Anderson.
17. Shetty RP, Endy D, Knight TF Jr. Engineering BioBrick vectors from BioBrick parts. Journal of biologicalengineering. 2008; 2(1):1–12. doi: 10.1186/1754-1611-2-5
18. Friedman N, Cai L, Xie XS. Linking stochastic dynamics to population distribution: an analytical frame-work of gene expression. Physical review letters. 2006; 97(16):168302. doi: 10.1103/PhysRevLett.97.168302 PMID: 17155441
19. Stanton BC, Nielsen AA, Tamsir A, Clancy K, Peterson T, Voigt C. Genomic mining of prokaryoticrepressors for orthogonal logic gates. Nature Chemical Biology. 2014; 10(2):99–105. doi: 10.1038/nchembio.1411 PMID: 24316737
20. Bonnet J, Yin P, Ortiz ME, Subsoontorn P, Endy D. Amplifying genetic logic gates. Science. 2013; 340(6132):599–603. doi: 10.1126/science.1232758 PMID: 23539178
21. Davidsohn N, Beal J, Kiani S, Adler A, Yaman F, Li Y, et al. Accurate predictions of genetic circuitbehavior from part characterization and modular composition. ACS Synthetic Biology. 2014;. PMID:25369267
22. Iverson SV, Haddock TL, Beal J, Densmore DM. CIDARMoClo: Improved MoClo Assembly Standardand New E. coli Part Library Enable Rapid Combinatorial Design for Synthetic and Traditional Biology.ACS synthetic biology. 2015;. PMID: 26479688
23. Beal J. Bridging the Gap: A Roadmap to Breaking the Biological Design Barrier. Frontiers in Bioengi-neering and Biotechnology. 2014; 2(87). doi: 10.3389/fbioe.2014.00087 PMID: 25654077
24. Wang L, Gaigalas AK, Marti G, Abbasi F, Hoffman RA. Toward quantitative fluorescence measure-ments with multicolor flow cytometry. Cytometry Part A. 2008; 73(4):279–288. doi: 10.1002/cyto.a.20507
25. Hoffman RA, Wang L, Bigos M, Nolan JP. NIST/ISAC standardization study: Variability in assignmentof intensity values to fluorescence standard beads and in cross calibration of standard beads to harddyed beads. Cytometry Part A. 2012; 81(9):785–796. doi: 10.1002/cyto.a.22086
26. SpheroTech. Measuring Molecules of Equivalent Fluorescein (MEFL), PE (MEPE) and RPE-CY5(MEPCY) using Sphero Rainbow Calibration Particles. SpheroTech; 2001. SpheroTechnical Notes:STN-9, Rev C 071398.
Reproducibility of Fluorescent Expression from Engineered Biological Constructs in E. coli
PLOSONE | DOI:10.1371/journal.pone.0150182 March 3, 2016 21 / 22

27. Model MA, Burkhardt JK. A standard for calibration and shading correction of a fluorescence micro-scope. Cytometry. 2001; 44(4):309–316. doi: 10.1002/1097-0320(20010801)44:4%3C309::AID-CYTO1122%3E3.0.CO;2-3 PMID: 11500847
28. Harris DL, Mutz M. Debunking the myth: validation of fluorescein for testing the precision of nanoliterdispensing. Journal of the Association for Laboratory Automation. 2006; 11(4):233–239. doi: 10.1016/j.jala.2006.05.006
29. Hu G, Chen L, Okerlund J, Shaer O. Exploring the Use of Google Glass in Wet Laboratories. In: Pro-ceedings of the 33rd Annual ACM Conference on Human Factors in Computing Systems. ACM; 2015.p. 2103–2108.
30. Chen B, Cahoon D, Canton B, Che A. Software for Engineering Biology in a Multi-Purpose Foundry. In:International Workshop on Bio-Design Automation; 2015.
31. Linshiz G, Stawski N, Poust S, Bi C, Keasling JD, Hillson NJ. PaR-PaR laboratory automation platform.ACS synthetic biology. 2012; 2(5):216–222. doi: 10.1021/sb300075t PMID: 23654257
32. Synthace. Antha Programming language; Retrieved 2015. https://www.antha-lang.org.
33. Vasilev V, Liu C, Haddock T, Bhatia S, Adler A, Yaman F, et al. A Software Stack for Specification andRobotic Execution of Protocols for Synthetic Biological Engineering. 3rd International Workshop onBio-Design Automation. 2011;.
34. Gulati S, Rouilly V, Niu X, Chappell J, Kitney RI, Edel JB, et al. Opportunities for microfluidic technolo-gies in synthetic biology. Journal of The Royal Society Interface. 2009; p. rsif20090083.
Reproducibility of Fluorescent Expression from Engineered Biological Constructs in E. coli
PLOSONE | DOI:10.1371/journal.pone.0150182 March 3, 2016 22 / 22