Reproducibility of a food frequency questionnaire for adolescents
10
Cad. Saúde Pública, Rio de Janeiro, 23(9):2187-2196, set, 2007 2187 Reproducibility of a food frequency questionnaire for adolescents Reprodutibilidade de um questionário de freqüência alimentar para adolescentes 1 Faculdade de Saúde Pública, Universidade de São Paulo, São Paulo, Brasil. 2 Faculdade Evangélica do Paraná, Curitiba, Brasil. Correspondence B. Slater Departamento de Nutrição, Faculdade de Saúde Pública, Universidade de São Paulo. Av. Dr. Arnaldo 715, São Paulo, SP 01246-904, Brasil. [email protected] Dirce Maria Lobo Marchioni 1 Silvia Maria Voci 1 Flávia Emília Leite de Lima 2 Regina Mara Fisberg 1 Betzabeth Slater 1 Abstract To assess the reproducibility of a validated 76- item food frequency questionnaire designed to estimate diet in adolescents (Adolescent Food Frequency Questionnaire – AFFQ) in the city of Sao Paulo, Brazil, a test-retest study was con- ducted (n = 49). Intraclass correlation coefficient (ICC), weighted kappa, and percentage of agree- ment were used in both crude and energy-ad- justed nutrient intakes. Bland Altman plots were used to examine the limits of agreement for en- ergy and macronutrients. The ICC ranged from 0.48 (carbohydrates) to 0.65 (vitamin C) in crude values and from 0.25 (total fat) to 0.58 (vitamin C) in adjusted values. Kappa values ranged from 0.28 (protein and fiber) to 0.56 (unsaturated fat). Bland Altman showed a trend towards larger dif- ference in energy according to increased intake values and a bias towards extreme values for fat intake. The percent of individuals classified in the same category on the two occasions was on average 54.2%. By conclusion, the Adolescent Food Frequency Questionnaire showed reason- able reproducibility and can be used in studies that aim to classify groups into intake categories. Adolescent; Food Habits; Questionnaires; Repro- ducibility of Results Introduction Diet is a relevant factor not only for growth and development, but also for the present and future health of adolescents 1,2,3 . There is increasing evi- dence that diet in childhood and adolescence is related to diseases of adulthood like heart dis- ease, osteoporosis, and cancer 4 . Therefore, the evaluation and quantification of adolescents’ habitual diet are of great concern. To meet both monitoring and nutritional research aims, a reli- able instrument is needed that accurately and precisely assesses this group’s dietary intake 5 . The use of food frequency questionnaires has been increasing in epidemiological studies among adolescents, since beginning in adoles- cence, cognitive processes are considered to be similar to those of adults 3,6,7,8,9 . However, inac- curate diet measurements may obscure the rela- tionship between diet and the target outcome 10 . It is well known that errors are inherent to any assessment of dietary status, so studies for vali- dating and investigating the reproducibility of measurement instruments need to be consid- ered, since they help understand the relation- ship between measured and true values 10 . Such studies have the aim of increasing accuracy and reducing measurement bias 11 . Reproducibility studies assess the extent to which results agree when obtained by the same approach at different points in time 12 . A food frequency questionnaire should reproduce similar results when applied ARTIGO ARTICLE
Transcript of Reproducibility of a food frequency questionnaire for adolescents

Cad. Saúde Pública, Rio de Janeiro, 23(9):2187-2196, set, 2007
2187
Reproducibility of a food frequency questionnaire for adolescents
Reprodutibilidade de um questionário de freqüência alimentar para adolescentes
1 Faculdade de Saúde Pública, Universidade de São Paulo, São Paulo, Brasil.2 Faculdade Evangélica do Paraná, Curitiba, Brasil.
CorrespondenceB. SlaterDepartamento de Nutrição, Faculdade de Saúde Pública, Universidade de São Paulo.Av. Dr. Arnaldo 715, São Paulo, SP01246-904, [email protected]
Dirce Maria Lobo Marchioni 1
Silvia Maria Voci 1
Flávia Emília Leite de Lima 2
Regina Mara Fisberg 1
Betzabeth Slater 1
Abstract
To assess the reproducibility of a validated 76-item food frequency questionnaire designed to estimate diet in adolescents (Adolescent Food Frequency Questionnaire – AFFQ) in the city of Sao Paulo, Brazil, a test-retest study was con-ducted (n = 49). Intraclass correlation coefficient (ICC), weighted kappa, and percentage of agree-ment were used in both crude and energy-ad-justed nutrient intakes. Bland Altman plots were used to examine the limits of agreement for en-ergy and macronutrients. The ICC ranged from 0.48 (carbohydrates) to 0.65 (vitamin C) in crude values and from 0.25 (total fat) to 0.58 (vitamin C) in adjusted values. Kappa values ranged from 0.28 (protein and fiber) to 0.56 (unsaturated fat). Bland Altman showed a trend towards larger dif-ference in energy according to increased intake values and a bias towards extreme values for fat intake. The percent of individuals classified in the same category on the two occasions was on average 54.2%. By conclusion, the Adolescent Food Frequency Questionnaire showed reason-able reproducibility and can be used in studies that aim to classify groups into intake categories.
Adolescent; Food Habits; Questionnaires; Repro-ducibility of Results
Introduction
Diet is a relevant factor not only for growth and development, but also for the present and future health of adolescents 1,2,3. There is increasing evi-dence that diet in childhood and adolescence is related to diseases of adulthood like heart dis-ease, osteoporosis, and cancer 4. Therefore, the evaluation and quantification of adolescents’ habitual diet are of great concern. To meet both monitoring and nutritional research aims, a reli-able instrument is needed that accurately and precisely assesses this group’s dietary intake 5.
The use of food frequency questionnaires has been increasing in epidemiological studies among adolescents, since beginning in adoles-cence, cognitive processes are considered to be similar to those of adults 3,6,7,8,9. However, inac-curate diet measurements may obscure the rela-tionship between diet and the target outcome 10. It is well known that errors are inherent to any assessment of dietary status, so studies for vali-dating and investigating the reproducibility of measurement instruments need to be consid-ered, since they help understand the relation-ship between measured and true values 10. Such studies have the aim of increasing accuracy and reducing measurement bias 11. Reproducibility studies assess the extent to which results agree when obtained by the same approach at different points in time 12. A food frequency questionnaire should reproduce similar results when applied
ARTIGO ARTICLE

Marchioni DML et al.2188
Cad. Saúde Pública, Rio de Janeiro, 23(9):2187-2196, set, 2007
under similar circumstances, over a given time interval, and with the same participants 10,13,14.
The objective of this study was to assess the reproducibility of a validated 76-item food fre-quency questionnaire for assessing habitual diet in adolescents (Adolescent Food Frequency Ques-tionnaire – AFFQ) in the city of São Paulo, Brazil.
Material and methods
This was a reproducibility study using a test-re-test design.
Forty-nine high school sophomores (second-year students), 25 boys and 24 girls (ages 16-19 years) at a public school located on the West Side of the city of São Paulo were invited and agreed to participate in the study. The AFFQ was adminis-tered twice, in May and August of the same year, 2001. On both occasions, students were asked to complete the questionnaire in the classroom, with the presence of a field researcher to help en-sure that the questionnaires were filled out under the same conditions.
Adolescent Food Frequency Questionnaire
The instrument was designed to assess the amounts of foods consumed over the preceding six-month period. The development and valida-tion of the AFFQ were described elsewhere 15. In brief, a list of 76 foods or food groups that contributed to at least 90% of energy and mac-ronutrient intake by adolescents was compiled, based on dietary data from 24h food recall 16. Portion sizes were obtained from the same data-set 16. The questionnaire was self-administered, and students were asked to estimate the average frequency of their intake for each food or food group over the previous six months by select-ing one of the seven categories: never, less than once a month, one to three times a month, once a week, two to four times a week, once a day, twice or more a day. Nutrient intakes were calculated by multiplying the portion weight by its nutrient content. Specific software – Virtual Nutri version 1.0 (Faculdade de Saúde Pública, Universidade de São Paulo, São Paulo, Brasil) – was used to analyze the energy and nutrient content of food intake. Here, food nutritional values were com-piled either from Brazilian tables, food compo-sition analyses furnished by manufacturers, or for foods unavailable in Brazilian databases, food composition tables from other countries, for ex-ample the United States Department of Agricul-ture (USDA) 17.
In the validation study, the instrument showed good accuracy (crude mean r = 0.57) 16.
Initially, we chose a list of nutrients to exam-ine the reproducibility. It included the macro-nutrients and nutrients related to frequently re-ported low intake in this young population, such as iron and calcium, and common diseases in youth (anemia) and adulthood (cardiovascular diseases, cancer, and osteoporosis).
Statistical analysis
Nutrient intakes were log-transformed to improve normality. Most of the nutrients measured by the AFFQ presented high correlations with energy. It was therefore necessary to remove this variation because of its association with measurement er-ror, and this was done by means of the residuals methods proposed by Willet & Stampfer 18.
Intraclass correlation coefficients (ICC) were utilized to assess the reproducibility of the di-etary intake reported by the individuals in the AFFQ test-retest. Differences between individ-ual intakes reported by students in the first and second AFFQ were compared using Wilcoxon signed-rank test.
The percentage concordance was determined by identifying the percentages of individuals classified in the same, adjacent, and opposite categories.
Bland Altman plots were used to examine the limits of agreement for energy and macronu-trients between AFFQ1 and AFFQ2 19. For each individual the difference in the log-transformed measured intake between the two AFFQs was plotted against their average intake from the same questionnaire 19.
To simultaneously examine the contribution of gender to intake reproducibility, we estimated the partial correlations for total energy intake. Gender was not significantly related to reproduc-ibility (r = 0.08, p = 0.589), so the analysis was conducted with no further gender distinction.
To verify concordance of the ordinal data, i.e. in the categories given by intake in tertiles, weighted kappa was utilized. This was derived from the kappa coefficient, with weights based on the magnitudes of the observed discordance 20.
The study was approved by the Research Eth-ics Committee of the School of Public Health, University of São Paulo, and the parents and ado-lescents provided informed consent.

REPRODUCIBILITY OF A FOOD FREQUENCY QUESTIONNAIRE FOR ADOLESCENTS 2189
Cad. Saúde Pública, Rio de Janeiro, 23(9):2187-2196, set, 2007
Results
Table 1 presents means and standard deviations of energy and nutrient intake in the AFFQ test and retest. For the majority of the nutrients as-sessed, the values found in the retest were low-er than in the initial test. Statistical differences between AFFQ1 and AFFQ2 were observed for energy, carbohydrates, total fat, unsaturated fat, fiber, and iron.
Intraclass correlation coefficients (ICC) be-tween the two AFFQs ranged from 0.48 (carbohy-drates) to 0.65 (vitamin C) in crude values (mean value 0.56) and from 0.25 (total fat) to 0.58 (vita-min C) in adjusted values (mean value 0.43), as shown in Table 2. All ICC values decreased after energy adjustment.
Table 3 presents the results for the capacity of the AFFQ to classify individuals within the same tertile, adjacent tertile, and opposite tertile of nu-trient intake, after adjusting for energy, between the test and retest. The proportion of individu-als classified in the same tertile averaged 54.2%, ranging from 44.8% (protein) to 63.2% (vitamin C). The percentage of individuals classified in opposite tertiles ranged from 6.1% for unsatu-rated fat to 14.3% for carbohydrates, total fat, and cholesterol (mean value 11.3%). The values of the weighted kappa coefficient ranged from 0.31 for total fat and cholesterol to 0.56 for unsaturated fat (mean value 0.42).
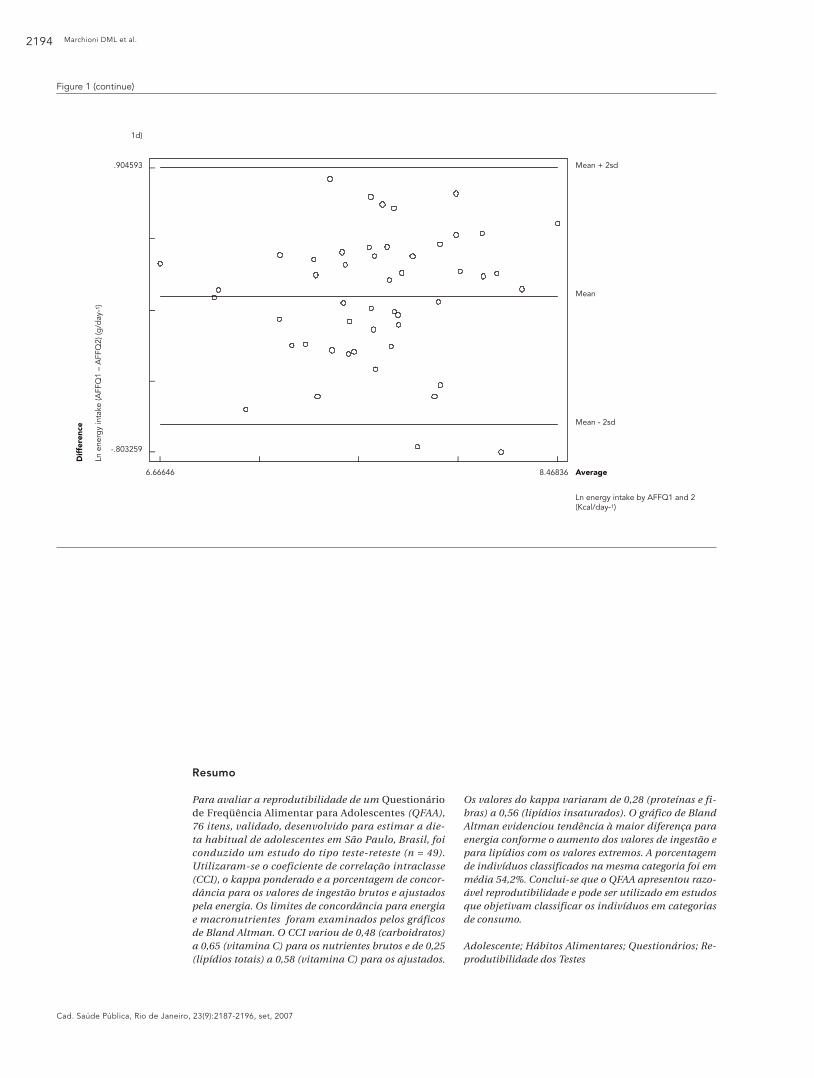
Bland Altman plots were used to further ex-amine the limits of agreement between the two applications of the AFFQ, by plotting individual differences against the mean of the two question-naires (Figure 1). The nutrients chosen for the analysis were energy, total fat, carbohydrate, and protein. The means for energy and macronutri-ents were all positive, indicating a bias towards overestimation in AFFQ1. The Pearson correla-tion coefficient between the differences and mean of the two questionnaires were all positive, but not statistically significant (energy r = 0.090, p = 0.538; protein r = 0.141, p = 0.333; carbohydrate r = 0.004, p = 0.981; lipid r = 0.231, p = 0.111).
Discussion
This paper reports on the reproducibility of a pre-viously validated food frequency questionnaire, designed to estimate adolescents’ habitual food intake. Our results indicate reasonable reproduc-ibility for categorizing individuals according to levels of intake, the usual aim of epidemiological studies.
The mean kappa value was 0.42, thus indicat-ing fair reliability 21. This was similar to the find-
ings by Hansson et al. 22, who reported a median value of 0.40 for the weighted kappa coefficient.
The crude concordance ranged from 44.8% for protein to 63.2% for vitamin C, with a mean of 54.2% of individuals classified in the same tertile. The low percentage of individuals clas-sified in opposite tertiles (11.3%) was notewor-thy. Considering the large variability observed in adolescents’ food intake 23, this percentage of concordance is considered reasonable for repro-ducibility studies involving this type of instru-ment (food frequency questionnaire) and indi-viduals at this stage of life 9. The values obtained in the present study are similar to those found by Vereecken & Maes 9 in a study conducted in Belgium.
The correlations observed in this study are consistent with those from other studies among adolescents. In Rockett et al. 5, the Pearson cor-relation coefficients ranged from 0.26 for protein and iron to 0.58 for calcium. The correlations ob-served by Speck et al. 24 ranged from 0.08 to 0.76, with a two-week interval between applications of the questionnaire. Field et al. 25, assessing the performance of a frequency questionnaire ap-plied with a one-year interval, found correlations from 0.18 to 0.47. Robison et al. 26 reported cor-relation coefficients ranging from 0.44 (protein) to 0.52 (fat).
The time frame is also of concern. The rec-ommendation is that the replication interval should be neither too short (to the point that subjects are able to remember and reproduce the answers by means of a learning process) nor too long (in the sense that it may reflect true changes in diet). In our study, the AFFQ was repeated after a three-month interval, which is considered reasonable 8. However, the time reference can also reflect changes in intake due to seasonality, which may have happened, low-ering the true correlations, especially for nutri-ents in which fruits and vegetables are the main source, like vitamin C and retinol.
Bland Altman showed a trend towards larger difference in energy according to increased in-take values and a bias towards extreme values for fat intake. Although these plots are also recom-mended to graphically investigate potential bias when comparing a method’s repeatability, they have been used more extensively in diet valida-tion studies than in reproducibility studies.
To produce reliable estimates of habitual in-take by means of a food frequency questionnaire, a crucial ability is to deal with abstract concepts and form a mental image of the diet that is as close as possible to the truth 27. According to Goodwin et al. 28, children 13 to 17 years of age were capable of completing the food frequency

Marchioni DML et al.2190
Cad. Saúde Pública, Rio de Janeiro, 23(9):2187-2196, set, 2007
Table 1
Means and standard deviations of daily nutrient intakes estimated by two Adolescent Food Frequency Questionnaires
(AFFQ1 and AFFQ2) in adolescents.
Nutrients Total
AFFQ1 AFFQ2
Energy (Kcal) * 2,452.78±1,086.62 2,121.92±882.26
Protein (g) 80.28±40.01 73.80±34.06
Carbohydrate (g) * 313.03±131.36 274.22±109.76
Total fat (g) * 96.52±51.50 79.55±40.91
Unsaturated fat (g) ** 33.64±21.57 27.81±15.44
Fiber (g) * 15.29±8.94 12.99±6.81
Cholesterol (mg) 283.10±198.70 242.83±148.42
Retinol (mcg) 897.96±591.73 804.67±559.68
Vitamin C (mg) 99.98±77.12 104.98±91.26
Calcium (mg) 738.65±338.87 702.44±373.07
Iron (mg) ** 11.08±5.56 9.54±4.51
* Signifi cance level < 0.01 – Wilcoxon test;
** Signifi cance level < 0.05 – Wilcoxon test.
Table 2
Intraclass correlation coeffi cients (ICC) and confi dence intervals (95%CI) for crude and adjusted energy and nutrient intake
estimated by two Adolescent Food Frequency Questionnaires (AFFQ) in adolescents.
Nutrients Total
Crude ICC (95%CI) Adjusted ICC (95%CI)
Energy (Kcal) 0.53 (0.30-0.71) -
Protein (g) 0.62 (0.42-0.77) 0,39 (0.13-0.60)
Carbohydrate (g) 0.48 (0.24-0.67) 0,28 (-0.01-0.51)
Total fat (g) 0.53 (0.29-0.70) 0.25 (-0.03-0.49)
Unsaturated fat (g) 0.54 (0.31-0.71) 0.49 (0.25-0.68)
Fiber (g) 0.53 (0.30-0.70) 0.38 (0.12-0.60)
Cholesterol (mg) 0.61 (0.40-0.76) 0.57 (0.34-0.73)
Retinol (mcg) 0.55 (0.32-0.72) 0.53 (0.30-0.71)
Vitamin C (mg) 0.65 (0.45-0.79) 0.58 (0.36-0.74)
Calcium (mg) 0.55 (0.33-0.72) 0.52 (0.28-0.70)
Iron (mg) 0.62 (0.42-0.77) 0.33 (0.06-0.55)
Means 0.56 0.43
questionnaire without their parents’ help and to satisfactorily provide dietary information. Like-wise, Field et al. 25 found better reproducibility in sixth and seventh-grade as compared to fourth and fifth-grade students (even if the students were the same age). According to Drewnowski 27, the mental image of the habitual diet is also influ-enced by the foods that individuals like or dislike, thereby becoming a measurement of their atti-tude towards their own diet. This may introduce
errors that increase the variability of the respons-es and produce lower correlations.
Specific self-reported food intakes are gener-ally higher in the first interview than in the sec-ond, as pointed out by McPherson et al. 29. The current study was also consistent with this ob-servation. Cullen & Zakeri 30, in a reproducibility study that considered ethnicity, also found high-er values in the first interview, as did Robinson et al. 26 in their study to assess a food frequency

REPRODUCIBILITY OF A FOOD FREQUENCY QUESTIONNAIRE FOR ADOLESCENTS 2191
Cad. Saúde Pública, Rio de Janeiro, 23(9):2187-2196, set, 2007
Table 3
Percentage classifi cation of adolescents in tertiles, weighted kappa, and crude concordance (p) for adjusted energy intake.
Nutrients Total
Same tertile (%) Adjacent tertile (%) Opposite tertiles (%) Kappa p
Calories (Kcal) 44.8 45.0 10.2 0.34 0.01
Protein (g) 49.0 40.8 10.2 0.28 0.02
Carbohydrate (g) 57.1 28.6 14.3 0.47 < 0.01
Total fat (g) 53.1 32.6 14.3 0.47 < 0.01
Unsaturated fat (g) 61.3 32.6 6.1 0.56 < 0.01
Fiber (g) 49.0 40.8 10.2 0.28 0.02
Cholesterol (mg) 53.0 32.7 14.3 0.50 < 0.01
Retinol (mcg) 57.1 32.7 10.2 0.47 < 0.01
Vitamin C (mg) 63.2 24.5 12.3 0.47 < 0.01
Calcium (mg) 55.1 32.7 12.2 0.41 < 0.01
Iron (mg) 53.1 36.7 10.2 0.41 < 0.01
Average 54.2 34.5 11.3 0.42
3.13757
Mean + 2sd
Mean + 2sd
Mean
Average5.1067
-.964174
.958536
1a)
Ln protein intake by AFFQ1 and 2 (g/day )1-
Ln p
rote
in in
take
(AFF
Q1
– A
FFQ
2) (
g/
day
)1-
Dif
fere
nce
Figure 1
Bland Altman plots for energy and macronutrient intake.
(continue)

Marchioni DML et al.2192
Cad. Saúde Pública, Rio de Janeiro, 23(9):2187-2196, set, 2007
Figure 1 (continue)
Mean
Mean + 2sd
Mean - 2sd
Ln carbohydrates intake by AFFQ1 and 2(g/day- )1
Average
Ln c
arb
ohyd
rate
s in
take
(AFF
Q1
– A
FFQ
2) (
g/d
ay-
)1
Dif
fere
nce
4.62244 6.48952
-.969227
.957382
1b)
(continue)
questionnaire in adolescent girls in the United Kingdom. Nevertheless, a reproducibility test by Rockett et al. 5 reported similar mean values for energy in the first and second interviews.
Because of the correlation identified between the energy and nutrient intakes in the study pop-ulation, ICCs were calculated before and after adjustment for energy. After adjustment, all coef-ficients decreased in relation to the crude value. Yaroch et al. 31 observed the same downward trend. Adjustment for energy would increase the correlation coefficients when the variability in nutrient intake is related to energy intake, but would decrease when the nutrient variability depends on systematic errors of overestimation or underestimation 11. The foods mentioned by adolescents may have low nutritional value (soft drinks, sugar, and fried foods) and high caloric value, thereby favoring a tendency towards exag-gerating the diet’s nutrient content. Thus, such disproportional results may affect the AFFQ’s concordance 4.
Livingstone et al. 32, in a validation study in the early 1990s, called attention to bias caused by
lack of compliance (resulting from irritation and boredom) in completing food questionnaires. All survey methods ultimately depend on subjects’ motivation, compliance, and ability to accurately report their habitual food intake. Although great effort was made in this study to ensure adoles-cents’ compliance and motivation, we cannot be rule out that some may have gotten bored while filling out the questionnaire.
To our knowledge, this is the first food ques-tionnaire developed and validated in Brazil that accesses this age group. The study complements the assessment of this questionnaire. Although good reproducibility does not ensure validity, re-liability studies are often conducted, since they provide information on the answers’ consistency and stability 10. The questionnaire’s performance differed according to the nutrients, as expected. The worst results were for carbohydrates, total fat, and iron. Carbohydrates and cholesterol also showed the worst classification agreement ac-cording to intake tertiles. Even so, the low per-centage of individuals classified in opposite ter-tiles (11.3%) called our attention. It is well known

REPRODUCIBILITY OF A FOOD FREQUENCY QUESTIONNAIRE FOR ADOLESCENTS 2193
Cad. Saúde Pública, Rio de Janeiro, 23(9):2187-2196, set, 2007
Figure 1 (continue)
Mean
Mean + 2sd
Mean - 2sd
Ln fat intake by AFFQ1 and 2) (g/day- )1
Average
1c)
Ln fa
t in
take
(AFF
Q1
– A
FFQ
2) (g
/day
-)1
Dif
fere
nce
3.20112 5.13799
-1.05701
1.10677
(continue)
that errors are inherent to any assessment of di-etary status. Since epidemiological studies rely on food frequency questionnaires because of the rapid application and low cost, evidence of likely misclassification of individuals based on these dietary measures is essential for our understand-ing of diet-related disease risk.
As an age group, adolescents have character-istics that need to be taken into account when ap-plying such a research instrument. They need to
be highly motivated and have enough time to fill out the questionnaire. In order to enhance their ability to adequately record habitual diet, recall strategies and recall cues can be applied 33,34.
In conclusion, a food frequency question-naire for adolescents that was developed and previously validated achieved reasonable repro-ducibility and can be used for studies that aim to classify groups into low, medium, and high consumers.
Marchioni DML et al.2194
Cad. Saúde Pública, Rio de Janeiro, 23(9):2187-2196, set, 2007
Figure 1 (continue)
6.66646 8.46836
-.803259
.904593
Mean
Mean + 2sd
Mean - 2sd
Ln energy intake by AFFQ1 and 2(Kcal/day- )1
Average
Ln e
nerg
y in
take
(AFF
Q1
– A
FFQ
2) (g
/day
-)1
Dif
fere
nce
1d)
Resumo
Para avaliar a reprodutibilidade de um Questionário de Freqüência Alimentar para Adolescentes (QFAA), 76 itens, validado, desenvolvido para estimar a die-ta habitual de adolescentes em São Paulo, Brasil, foi conduzido um estudo do tipo teste-reteste (n = 49). Utilizaram-se o coeficiente de correlação intraclasse (CCI), o kappa ponderado e a porcentagem de concor-dância para os valores de ingestão brutos e ajustados pela energia. Os limites de concordância para energia e macronutrientes foram examinados pelos gráficos de Bland Altman. O CCI variou de 0,48 (carboidratos) a 0,65 (vitamina C) para os nutrientes brutos e de 0,25 (lipídios totais) a 0,58 (vitamina C) para os ajustados.
Os valores do kappa variaram de 0,28 (proteínas e fi-bras) a 0,56 (lipídios insaturados). O gráfico de Bland Altman evidenciou tendência à maior diferença para energia conforme o aumento dos valores de ingestão e para lipídios com os valores extremos. A porcentagem de indivíduos classificados na mesma categoria foi em média 54,2%. Conclui-se que o QFAA apresentou razo-ável reprodutibilidade e pode ser utilizado em estudos que objetivam classificar os indivíduos em categorias de consumo.
Adolescente; Hábitos Alimentares; Questionários; Re-produtibilidade dos Testes

REPRODUCIBILITY OF A FOOD FREQUENCY QUESTIONNAIRE FOR ADOLESCENTS 2195
Cad. Saúde Pública, Rio de Janeiro, 23(9):2187-2196, set, 2007
Contributors
D. M. L. Marchioni was responsible for the statistical analysis, interpretation of the results, and drafting of the manuscript. S. M. Voci, R. M. Fisberg, and F. E. L. Lima collaborated in the interpretation and discussion of the results. B. Slater was responsible for the research design, implementation, and consultancy.
References
1. Centers for Disease Control and Prevention. Up-date: prevalence of overweight among children, adolescents, and adults – United States, 1988-1994. MMWR Morb Mortal Wkly Rep 1997; 46:199-202.
2. Amorim Cruz JA. Dietary habits and nutritional status in adolescents over Europe – Southern Eu-rope. Eur J Clin Nutr 2000; 54(1 Suppl):29-35.
3. Lietz G, Barton KL, Longbottom PJ, Anderson AS. Can the EPIC food-frequency questionnaire be used in adolescent populations? Public Health Nutr 2002; 5:783-9.
4. World Health Organization. Expert consultation on diet, nutrition and the prevention of chronic dis-eases. Geneva: World Health Organization; 2003.
5. Rockett HRH, Wolf AM, Colditz GA. Development and reproducibility of a food frequency question-naire to assess diets of older children and adoles-cents. J Am Diet Assoc 1995; 95:336-40.
6. Domel SB, Baranowski T, Leonard SB, Davis H, Riley P, Baranowski J. Accuracy of fourth- and fifth-grade students’ food records compared with school-lunch observations. Am J Clin Nutr 1994; 59 Suppl:218-20.
7. Andersen LF, Nes M, Lillegaard IT, Sandstad B, Bør-neboe G-Eaa, Drevon CA. Evaluation of a quantita-tive food frequency questionnaire used in a group of Norwegian adolescents. Eur J Clin Nutr 1995; 49:543-54.
8. Livingstone MB, Robson PJ. Measurement of di-etary intake in children. Proc Nutr Soc 2000; 59:279-93.
9. Vereecken CA, Maes L. A Belgian study on the reli-ability and relative validity of Health Behavior in School-Aged Children food-frequency question-naire. Public Health Nutr 2003; 6:581-8.
10. Nelson M. The validation of dietary assessment. In: Margetts B, Nelson M, editors. Design Concepts in Nutrition Epidemiology. 2nd Ed. Oxford: Oxford University Press; 1997. p. 241-72.
11. Willet WC. Nutritional Epidemiology. 2nd Ed. Ox-ford: Oxford University Press; 1998.
12. Szklo M, Javier Nieto F. Epidemiology: beyond the basics. Gaithersburg: Aspen Publisher; 2000.
13. Block G, Hartman AM. Issues in reproducibility and validity of dietary studies. Am J Clin Nutr 1989; 50:1133-8.
14. Litwin MS. How to measure survey reliability and validity. London: Sage Publications; 1995.
15. Slater B, Philippi ST, Fisberg RM, Latorre MRDO. Validation of a semi-quantitative adolescent food frequency questionnaire applied at a public school in Sao Paulo, Brazil. Eur J Clin Nutr 2003; 57:629-35.
16. Nuzzo L. Avaliação do estado nutricional de ado-lescentes de uma instituição particular de ensino [Master’s Thesis]. São Paulo: Faculdade de Saúde Pública, Universidade de São Paulo; 1998.
17. United States Department of Agriculture. USDA national nutrient database for standard reference, release 16 [food composition table]. http://www.nal.usda.gov/fnic/foodcomp (accessed on 28/Jan/2004).
18. Willett WC, Stampfer MJ. Total energy intake: im-plications for epidemiological analyses. Am J Epi-demiol 1986; 124:17-27.
19. Bland JM, Altman DG. Measuring agreement in method comparison studies. Stat Methods Med Res 1999; 8:135-60.
20. Armstrong BK, White E, Saracci R. Principles of Exposure Measurement in Epidemiology. 2nd Ed. Oxford: Oxford University Press; 1995.
21. Landis JR, Koch GG. The measurement of observer agreement for categorical data. Biometrics 1977; 33:159-74.
22. Hansson LM, Galanti MR, Bergström R. Factors affecting reproducibility of dietary reports using food frequency questionnaires. Eur J Clin Nutr 2000; 54:658-64.

Marchioni DML et al.2196
Cad. Saúde Pública, Rio de Janeiro, 23(9):2187-2196, set, 2007
23. Slater B. Desenvolvimento e validação de um ques-tionário semi-quantitativo de freqüência alimen-tar para adolescentes [Doctoral Dissertation]. São Paulo: Faculdade de Saúde Pública, Universidade de São Paulo; 2001.
24. Speck BJ, Bradley CB, Harrell JS, Belyea MJ. A food frequency questionnaire for youth: psychometric analysis and summary of eating habits in adoles-cents. J Adolesc Health 2001; 28:16-25.
25. Field AE, Peterson KE, Gortmaker SL, Cheung L, Rockett H, Fox MK, et al. Reproducibility and va-lidity of a food frequency questionnaire among fourth to seventh grade inner-city school children: implications of age and day-to-day variation in di-etary intake. Public Health Nutr 1999; 2:293-300.
26. Robison S, Skelton R, Barker M, Wioman C. Assess-ing the diet of adolescent girls in the UK. Public Health Nutr 1999; 2:571-7.
27. Drewnowski A. Diet image: a new perspective on the food-frequency questionnaire. Nutr Rev 2001; 59:370-2.
28. Goodwin RA, Brule D, Junkins EA, Dubois S, Beer-Borts S. Development of a food and activity record and a portion-size model booklet for use by 6 to 17 year olds: a review of focus group testing. J Am Diet Assoc 2001; 101:926-8.
29. McPherson R, Hoelscher D, Alexander M, Scanlon K, Serdula M. Dietary assessment methods among school-aged children: validity and reliability. Prev Med 2000; 31 Suppl:11-33.
30. Cullen KW, Zakeri I. The youth/adolescent ques-tionnaire has low validity and modest reliabil-ity among low-income African-American and His-panic seventh- and eighth-grade youth. J Am Diet Assoc 2004; 104:1415-9.
31. Yaroch AL, Resnicow K, Davis M, Davis A, Smith M, Khan LK. Development of a modified picture-sort food frequency questionnaire administered to low-income, overweight, African-American adolescent girls. J Am Diet Assoc 2000; 100:1050-6.
32. Livingstone MBE, Prentice AM, Coward WA, Strain JJ, Black AE, Davies PSW, et al. Validation of esti-mates of energy intake by weighted dietary record and diet history in children and adolescents. Am J Clin Nutr 1992; 56:29-35.
33. Johnson-Kozlow M, Matt GE, Rock CL. Recall strat-egies used by respondents to complete a food fre-quency questionnaire: an exploratory study. J Am Diet Assoc 2006; 106:430-3.
34. Matt GE, Rock CL, Johnson-Kozlow M. Using recall cues to improve measurement of dietary intakes with a food frequency questionnaire in an ethni-cally diverse population: an exploratory study. J Am Diet Assoc 2006; 106:1209-17.
Submitted on 29/Dec/2005Final version resubmitted on 11/Dec/2006Approved on 12/Jan/2007