Validation and reproducibility of dietary assessment methods in adolescents: a systematic literature...
15
Public Health Nutrition: page 1 of 15 doi:10.1017/S1368980013003157 Review Article Validation and reproducibility of dietary assessment methods in adolescents: a systematic literature review Garden Tabacchi 1, *, Emanuele Amodio 1 , Maria Di Pasquale 1 , Antonino Bianco 2 , Mone `m Jemni 3 and Caterina Mammina 1 1 Department of Sciences for Health Promotion and Mother Child Care ‘G. D’Alessandro’, University of Palermo, Via Del Vespro 133, 90127 Palermo, Italy: 2 Sport and Exercise Sciences Unit, University of Palermo, Palermo, Italy: 3 School of Science, University of Greenwich at Medway, London, UK Submitted 27 February 2013: Final revision received 7 August 2013: Accepted 15 October 2013 Abstract Objective: The aim of the present work was to determine what dietary assessment method can provide a valid and accurate estimate of nutrient intake by comparison with the gold standard. Design: A MEDLINE, EMBASE, ISI Web of Science, Cochrane and related references literature review was conducted on dietary assessment methods for adolescents reporting the validity and/or reproducibility values. A study quality assessment on the retrieved FFQ was carried out according to two different scoring systems, judging respectively the quality of FFQ nutrition information and of FFQ validation and calibration. Setting: The present review considered adolescents attending high schools and recruited in hospitals or at home. Subjects: The target of the review was the healthy adolescent population in the age range 13–17 years. Results: Thirty-two eligible papers were included and analysed separately as ‘original articles’ (n 20) and ‘reviews’ (n 12). The majority (n 17) assessed the validation and reproducibility of FFQ. Almost all studies found the questionnaires to be valid and reproducible (r . 0?4), except for some food groups and nutrients. Different design and validation issues were highlighted, such as portion-size estimation, number of food items and statistics used. Conclusions: The present review offers new insights in relation to the characteristics of assessment methods for dietary intake in adolescents. Further meta-analysis is required although the current review provides important indications on the development of a new FFQ, addressing the need for a valid, reproducible, user- friendly, cost-effective method of accurately assessing nutrient intakes in adolescents. Keywords Dietary assessment Adolescents Validation Reproducibility Adolescence is a critical period that is characterized by cognitive, emotional and social development and expo- sure to a significant turnover in lifestyle, including food intake and diet habits. Irregular meals, snacking and meal skipping, which characterize teenagers, often do not allow an accurate dietary assessment (1) and therefore the need to develop valid and reproducible instruments for this purpose is increasing. Different dietary assessment methods among adolescents have been extensively described and validated, such as food records (FR), FFQ, diet histories (DH) and 24 h recalls (24-HR). The FR is not used in large population studies for several reasons (2) : it can be quite expensive; it requires the participant to be literate and motivated; it involves trained staff; and it needs a computerized program specific to recording diet records. Thus, the FR is preferably used at the individual level and is generally considered a good reference instrument against which to validate other dietary methods to be used at the large population level, together with biomarker measurements (3) . The most used dietary assessment methods for large-scale surveys are therefore FFQ, 24-HR and DH, which present advantages such as cost-effectiveness, although they are affected by weak- nesses (4,5) that can produce misreporting. A recent review showed that the major factors influencing under- and over-reporting in recall methods are due to the reliance on respondents’ memory and ability to estimate portion sizes (6) . Subjects’ compliance with recording their food Public Health Nutrition *Corresponding author: Email [email protected] r The Authors 2013
Transcript of Validation and reproducibility of dietary assessment methods in adolescents: a systematic literature...

Public Health Nutrition: page 1 of 15 doi:10.1017/S1368980013003157
Review Article
Validation and reproducibility of dietary assessment methods inadolescents: a systematic literature review
Garden Tabacchi1,*, Emanuele Amodio1, Maria Di Pasquale1, Antonino Bianco2,Monem Jemni3 and Caterina Mammina1
1Department of Sciences for Health Promotion and Mother Child Care ‘G. D’Alessandro’, University of Palermo,Via Del Vespro 133, 90127 Palermo, Italy: 2Sport and Exercise Sciences Unit, University of Palermo, Palermo,Italy: 3School of Science, University of Greenwich at Medway, London, UK
Submitted 27 February 2013: Final revision received 7 August 2013: Accepted 15 October 2013
Abstract
Objective: The aim of the present work was to determine what dietary assessmentmethod can provide a valid and accurate estimate of nutrient intake by comparisonwith the gold standard.Design: A MEDLINE, EMBASE, ISI Web of Science, Cochrane and relatedreferences literature review was conducted on dietary assessment methods foradolescents reporting the validity and/or reproducibility values. A study qualityassessment on the retrieved FFQ was carried out according to two differentscoring systems, judging respectively the quality of FFQ nutrition information andof FFQ validation and calibration.Setting: The present review considered adolescents attending high schools andrecruited in hospitals or at home.Subjects: The target of the review was the healthy adolescent population in theage range 13–17 years.Results: Thirty-two eligible papers were included and analysed separately as‘original articles’ (n 20) and ‘reviews’ (n 12). The majority (n 17) assessed thevalidation and reproducibility of FFQ. Almost all studies found the questionnairesto be valid and reproducible (r . 0?4), except for some food groups and nutrients.Different design and validation issues were highlighted, such as portion-sizeestimation, number of food items and statistics used.Conclusions: The present review offers new insights in relation to the characteristicsof assessment methods for dietary intake in adolescents. Further meta-analysisis required although the current review provides important indications on thedevelopment of a new FFQ, addressing the need for a valid, reproducible, user-friendly, cost-effective method of accurately assessing nutrient intakes in adolescents.
KeywordsDietary assessment
AdolescentsValidation
Reproducibility
Adolescence is a critical period that is characterized by
cognitive, emotional and social development and expo-
sure to a significant turnover in lifestyle, including food
intake and diet habits. Irregular meals, snacking and meal
skipping, which characterize teenagers, often do not
allow an accurate dietary assessment(1) and therefore the
need to develop valid and reproducible instruments for
this purpose is increasing. Different dietary assessment
methods among adolescents have been extensively
described and validated, such as food records (FR), FFQ,
diet histories (DH) and 24 h recalls (24-HR). The FR is not
used in large population studies for several reasons(2): it
can be quite expensive; it requires the participant to be
literate and motivated; it involves trained staff; and it
needs a computerized program specific to recording diet
records. Thus, the FR is preferably used at the individual
level and is generally considered a good reference
instrument against which to validate other dietary methods
to be used at the large population level, together with
biomarker measurements(3). The most used dietary
assessment methods for large-scale surveys are therefore
FFQ, 24-HR and DH, which present advantages such as
cost-effectiveness, although they are affected by weak-
nesses(4,5) that can produce misreporting. A recent review
showed that the major factors influencing under- and
over-reporting in recall methods are due to the reliance
on respondents’ memory and ability to estimate portion
sizes(6). Subjects’ compliance with recording their food
Public
Hea
lth
Nutr
itio
n
*Corresponding author: Email [email protected] r The Authors 2013

intake is often a problem, and this is especially problematic
when they are required to keep records for longer periods
of time(7). Another issue is the time and monetary cost for
the collection and processing of dietary intake information,
which can be overtaken by the use of new technologies,
such as questionnaires using web-based methods. Some
studies state that the web-based computerized assessment
represents an element of innovation for data collection,
with the advantages of cost-efficiency, reductions in data
entry and data coding time, automatic flagging of missing
data, accessibility by the entire population, possibility of
long-term data collection and simplification of the self-
monitoring process, which increases compliance and the
validity of self-reported food intake(8). According to a
recent review conducted by the Innovation of Dietary
Assessment Methods for Epidemiological Studies and
Public Health (IDAMES)(9), this method compares reason-
ably well with more traditional approaches; moreover it is
suitable for adolescents, since the age at which a child
becomes an accurate self-reporter of his/her own dietary
intake has been estimated to be approximately 12 years,
although this varies by dietary assessment method(10).
Since dietary methods validated and used for adolescents
are different worldwide, a comparison of data is often
difficult or unfeasible; standardized surveillance systems are
needed, in order to collect valid and accurate estimates of
food and nutrient intakes. A standardized and sustainable
collection of data on adolescents’ food consumption and
lifestyles is useful to understand the diet-related public
health problems and implement appropriate actions for the
prevention of the related diseases. The ASSO (Adolescents
and Surveillance System for the Obesity prevention) Project,
funded by the Italian Ministry of Health and supported by
different national and international partners, falls within this
context, with the purpose of developing a system for a
standardized collection of dietary intake and lifestyle data in
adolescents. It has the potential to provide the National
Health System with a structure that allows a continuous and
permanent nutritional surveillance on the school popula-
tion, and aspires to propose an example of good practice
by delivering a tool for an effective nutritional surveillance.
In order to establish the best specifically designed tool for
the assessment of food and nutrient intakes by comparison
with the gold standard measure in large populations of
adolescents aged 13–17 years, a systematic literature review
on the dietary assessment instruments found to be valid and
reproducible was performed within Project ASSO and is
described in the present paper.
Methods
Literature search and systematic review
The literature search was conducted on the electronic
databases MEDLINE, EMBASE, ISI Web of Science and
Cochrane. In the MEDLINE and Cochrane databases,
besides free text terms, Medical Subject Headings (MeSH)
and MeSH Major Topics were included in the syntax.
A sensitivity check was executed by deleting terms in the
syntax systematically to see if important articles were
missed with the current syntax. The search was focused
on studies published in the 10 years between 2001 and
2011. No restriction criteria were applied for the country,
while limits were imposed on the language by restricting
the publications to the English, Italian, Spanish and
French idioms. Studies that met all of the following
inclusion criteria were included in the review: describing
dietary assessment methods developed for epidemiolo-
gical purposes; targeting adolescent populations in the
age range 13–17 years; and reporting the validity and/or
reproducibility of the method v. one reference method.
Key search terms, used alone and in combination,
included the following: terms referred to the type of dietary
method (questionnaire, 24-HR, 24h recall, 24-h recall, FFQ,
history, record, diary); terms including diet, nutrition, food,
intake; and terms related to the validation and reliability
of the methods (validity, validation, reliability, reproduci-
bility, calibration). Additional searches were carried out
on websites of national and international organizations
(e.g. universities and relevant professional societies or
organizations) and the grey literature was also considered.
The retrieved records were sent to Endnote�R (version
X4?02), where the duplicates were removed.
After this, an initial screening of titles and abstracts was
performed in order to check exclusion criteria. When a
title or abstract could not be rejected with certainty, the
paper was included in the eligibility papers and the full
text was further evaluated.
Articles were excluded in the following cases: population
age not in the range 13–17 years; non-healthy subjects;
hospitalized or not free-living subjects; pregnant adolescent
women; refugees; vulnerable populations such as low
income or rural; specific ethnicity; overweight/obese sub-
jects; athletes; vegetarians; dietary instrument specific only
to certain nutrients (folate, vitamins, calcium, fat, protein,
etc.), specific only to certain foods (alcohol, beverages, fruit
and vegetables, sugary snacks, seafood, etc.) or specific
only to energy and fast-foods consumption; feeding study
or intervention study; subjects with eating disorders; study
relative to eating or health behaviour; psychometric tests
e.g. for craving; subjects with food allergies; study relative to
intake of particular substances (acrylamide, etc.); ques-
tionnaire only for physical activity assessment; questionnaire
only for nutrition knowledge assessment; study aimed at
perceptions; study where only parental reporting on the
child’s diet was considered; study with only food insecurity
measurement; and study with only portion-size estimation.
The full texts of the articles assessed for eligibility were
examined through a second screening, in order to eval-
uate the relevance of the papers. Some articles and the
relative full version of the questionnaires were obtained
through direct contact with the author. Articles were
Public
Hea
lth
Nutr
itio
n2 G Tabacchi et al.

excluded if a relative comparison of validity and/or
reproducibility was not made for the dietary instrument.
The reference lists of articles retrieved for inclusion in the
review were hand-searched to identify other relevant articles.
If for the same study there was a series of similar articles,
they were all screened and considered for analysis, in
order to avoid possible data loss. The literature search and
the systematic review were conducted by two independent
investigators, after a standardization of the procedure. In
the case of any incongruity, the two investigators came to
an agreement after further analysis and discussion.
Once papers were identified as relevant, data were
extracted into an Excel�R database.
Study quality assessment
A study quality assessment of the retrieved articles was
carried out by two of the investigators independently,
according to two different scoring systems. The reduced
summary score described by Dennis et al.(11) judges the
quality of nutrition information from FFQ in epidemio-
logical studies by applying a priori defined criteria and
is based on the following aspects: the number of food
items, the administration mode (e.g. interviewer v. self-
administered mode) and whether it is a quantitative
instrument. The reduced summary score was ranked as
‘high’ or ‘low’ quality, with a tally of 5 or more ranked as
‘high’, for a total possible score of 8 points.
Since the present analysis is focused on the assessment of
the quality of validation and calibration studies of FFQ, with
the aim of including, excluding or weighting the studies that
utilize an FFQ in the current review, we used an additional
scoring system proposed more recently by Serra-Majem
et al.(12). This system considers the following variables:
type of sample and sample size of the study; statistics to
assess validity (e.g. comparisons between methods’ means,
medians or difference; crude, energy-adjusted, de-attenuated
or intra-class correlation) and statistics to assess agreement
or misclassification; administration mode; seasonality con-
sidered in the validation design; and supplements included
and validated. According to Serra-Majem et al.(12), scores
could range from 0 (poorest quality) to a maximum of
7 (highest quality). This allows for the classification of vali-
dation studies according to their methodological quality.
The summary score was ranked as ‘very good/excellent’
with a tally of 5 or more; ‘good’ with a score between
3?5 and 5; ‘acceptable/reasonable’ with a score between
2?5 and 3?5; or poor with a score of less than 2?5.
For the studies that used semi-quantitative methods
other than FFQ, only the scoring system proposed by
Serra-Majem et al.(12) was applied.
Results
As shown in Fig. 1, a total of 480 articles were retrieved
after duplicates were removed and sixty-eight were included
in the review when specific exclusion criteria were applied.
A further screening procedure based on the full-text
evaluations identified thirty-two eligible papers that were
included in the qualitative synthesis and analysed separately
as ‘original articles’ (n 20) and ‘reviews’ (n 12; Fig. 1).
Original articles
General overview
An overview of the retrieved twenty original articles(1,13–31)
is shown in Table 1.
The majority (n 17)(1,13–20,22–24,26,27,29–31) of them were
identified as studies assessing the validation and repro-
ducibility of FFQ against reference dietary instruments
(Table 2), while the remaining three studies considered
questionnaires other than FFQ analysed for their validity and
reproducibility against different reference methods(21,25,28)
(Table 3).
The outcome in some cases included the values of
validity and reproducibility of the instrument to assess
both food and nutrient intakes(16,17,25,28–30), while some
studies considered only the food intake(18,20–21,27) and
some others only the nutrient intake(1,13–15,19,22–24,26,31).
Since healthy adolescents represent the target of the
present review, the most common setting where the
questionnaires were administered was the school (Table 1).
In some studies the setting was a hospital and in these cases
only the healthy subjects selected by the author were
considered, while in a few other cases the household
environment (direct or telephone interview) was chosen
(Table 1).
FFQ analysed by their intrinsic characteristics
The seventeen studies where FFQ were found to be
reasonably valid and reproducible were analysed on the
basis of their intrinsic characteristics: number of food
groups and food items; consumption interval; paper-based
or web-based format; interview or self-administered mode;
portion size estimation; food composition databases used
for the nutrient conversion; administration duration; and
number of FFQ administered and interval for the retest
(Table 2).
The described FFQ were mostly semi-quantitative,
whereby the instrument addressed both the frequency
and the amount consumed for each food item(32). A quite
high variability was highlighted between the studies.
Foods were gathered into groups that ranged in number
between ten(1) and twenty-four(17) food groups; the
number of food items included in the different FFQ
ranged between twenty-six(23) and 212(13), with an aver-
age of 104. As an FFQ may not be suitable for recalling
diet in the distant past(33), the consumption interval
reported in the retrieved FFQ was generally the previous
week or month, or the previous 6 months or year.
Only two of the retrieved articles had validated a web-
based FFQ in adolescents(20,29) in relation to food and
Public
Hea
lth
Nutr
itio
nDietary assessment methods in adolescents 3

nutrient data, respectively; all the others were paper-
based questionnaires. Four of the FFQ were self-
administered(23,24,30,31), while the rest were partially or
fully interviewer-administered. Portion sizes were estimated
mostly based on photographs/illustrations, while a lower
amount of studies used household measures (e.g. cups,
tablespoons), natural units or a combination of them.
The fourteen studies that translated food intakes into
nutrient intakes(1,13–17,19,22–24,26,29–31) used national or
other types of food composition databases, thus resulting
in a wide heterogeneity of databases.
In those papers reporting the time needed to complete
the FFQ, an average time of 30 min was calculated.
In some studies, the FFQ was administered twice after a
time interval ranging from 1 week to 6 months after the
first administration, in order to evaluate the reproducibility
of the method(16,17,19,23,29–31).
FFQ analysed by the validation study characteristics
The characteristics of the validation study were also
considered: sample size; reference method (FR or 24-HR);
and statistics used to assess the agreement between the
two methods and the reproducibility.
Except for one study where the number of participants
was very high(27) (n 7072), the sample size ranged from
seventeen(17) to 785(13) participants (Table 1). Moreover,
in some studies the sample was not homogeneous for
variables such as sex. Almost all of the studies reported
the difference between males and females: in some
cases(24) it was stated that there was a stronger association
for girls; in other studies the questionnaire performed
better for males in adequately classifying individuals for
all nutrients(13) or according to their total fat and protein
intake(26), or fibre(17) and PUFA intake(17).
With regard to the statistics used in the studies,
comparison between methods to assess measurement
differences in the validation studies used the mean com-
parison as a first approach (this is not shown in Table 2).
Sometimes Student’s t test for paired samples (for normally
distributed variables)(15,26) or the Wilcoxon signed-rank
test (for skewed distributions)(20,24,29) was used.
Although Ambrosini et al.(13) and others(34,35) pre-
viously showed that the correlation coefficient can be a
misleading indicator of agreement, all retrieved studies
calculated Pearson’s or Spearman’s correlation coefficient
(Table 2), respectively when the sample distribution was
Public
Hea
lth
Nutr
itio
n
FFQ validation and/orreproducibility
(n 17)
Other questionnairesvalidation and/or
reproducibility(n 3)
Records identified throughdatabase searching
(n 477)
Additional records identifiedthrough other sources
(n 11)
Records after duplicates removed(n 480)
Records screened(n 68)
Full-text articlesassessed for eligibility
(n 32)
Records excluded afterscreening of
full-text articles(n 36)
Original articles(n 20)
Reviews(n 12)
Records excluded afterscreening of
titles and abstracts(n 412)
Fig. 1 Selection process flow of the original articles and reviews on the validation and/or reproducibility of dietary assessmentmethods in adolescents
4 G Tabacchi et al.

Public Health Nutrition
Table 1 Overview of the twenty eligible original articles
No. of participants
First author(ref) Survey year Country Project name Total Boys GirlsAge
(years)Data collectionsetting Dietary method Reference method Outcome
Ambrosini(13) 2003–2005 Australia The WesternAustralianPregnancyCohort Study(Raine Study)
785 403 382 14 Hospital FFQ 3 d FR Nutrient intakes
Araujo(14) 2005–2006 Brazil None 169 69 100 12–19 School FFQ 3 d FR Nutrient intakesBertoli(15) NR Italy None 19 9 10 16–20 School FFQ 7 d WFR Nutrient intakesCullen(16) 2004 USA None 83 39 44 10–17 Telephone FFQ (BKQ) 24-HR Food and nutrient
intakesDeschamps(17) 1999–2000 France FLVS II 17 8 9 14–18 Home FFQ 24-HR Food and nutrient
intakesHoelscher(18) 1995–1996 USA SBNM Project 209 103 106 6–18 School FFQ non-quantitative
(SBNM secondarylevel questionnaire,Part A)
24-HR Food intakes
Hong(19) 2003–2004 Vietnam None 180 83 97 11–15 School FFQ 24-HR Nutrient intakesLietz(1) 2000–2001 UK EPIC 50 18 32 11–13 School FFQ (EPIC FFQ) 7 d WFR Nutrient intakesMatthys(20) 2004–2005 Belgium None 104 NR NR 12–18 School FFQ 3 d FR Food intakesMoore(21) NR UK None 121 49 72 7–15 24-HR (SNAPTM) 24-HR (24 h multiple-
pass dietary recall)Food intakes
Papadopoulou(22) NR Greece None 250 120 130 14–16 School FFQ (GAFFQ) 3 d WFR Nutrient intakesRockett(23) 1996–1997 USA GUTS 261 NR NR 9–18 All the settings FFQ (short-list FFQ) (i) YAQ FFQ full list Nutrient intakes
(ii) 24-HRShatenstein(24) NR Canada None 65 30 35 7–18 Paediatric
hospitalFFQ 3-d FR Nutrient intakes
Sjoberg(25) 2000 Sweden The GoteborgAdolescenceStudy
51 0 51 15–16 School DH 7-d FR Food and nutrientintakes
Slater(26) 1999 Brazil None 106 52 54 14–18 School FFQ (AFFQ) 24-HR Nutrient intakesVereecken(27) 1997–1998 Belgium HBSC survey
(first part;Flemish HBSC2000 survey)
7072 3352 3720 11–18 School FFQ (HBSC FFQ) 24-HR (24 h FBC) Food intakes
Vereecken(28) 2004 Belgium HELENA School Food and nutrientintakesStudy 1 136 44 92 11–14 24-HR (YANA-C) 1 d FR
Study 2 101 55 46 11–14 24-HR (YANA-C) 24-HRVereecken(29) 2006 Belgium HELENA 55 30 25 13–17 Household FFQ (HELENA FFQ) 24-HR (YANA-C) Food and nutrient
intakesWatanabe(30) 2007 Japan None 63 0 63 12–13 School FFQ 7 d WFR Food and nutrient
intakesWatson(31) Australia ACAES 113 41 72 9–16 School FFQ (ACAES FFQ) 1 d FR Nutrient intakes
NR, not reported; FLVS II, Fleurbaix Laventie Ville Sante Study II; SBNM, School-Based Nutrition Monitoring; EPIC, European Prospective Investigation into Cancer and Nutrition; GUTS, Growing Up Today Study;HBSC, Health Behaviour in School-Aged Children; HELENA, Healthy Lifestyle by Nutrition in Adolescence; ACAES, Australian Child and Adolescent Eating Survey; BKQ, Block Kids Questionnaire; 24-HR, 24 h recall;SNAPTM, Synchronized Nutrition and Activity ProgramTM; GAFFQ, Greek Youth Adolescent’s FFQ; DH, diet history; AFFQ, FFQ for Adolescents; YANA-C, Young Adolescents’ Nutrition Assessment on Computer; FR,food record; WFR, weighed food record; YAQ, Youth/Adolescent Questionnaire; FBC, food behaviour checklist.
Die
taryasse
ssmentm
eth
ods
inad
ole
scents
5

Public Health Nutrition
Table 2 Characteristics of the seventeen FFQ validation studies
First author(ref)
FFQfood
groups
FFQfooditems
Consumptioninterval
FFQtype
Administrationmode
Portion sizeestimationmethod
Foodcompositiondatabase used
Administrationduration
No. of FFQadministered
FFQinterval(retest)
Referencemethod(characteristics)
Statistics usedfor validation
Statisticsused forreproducibility
Quality level,accordingto Denniset al.(11)
Quality level,according toSerra-Majem
et al. (12)
Ambrosini(13) 15 212 Previousyear
PB IW Standardserving sizegiven inhouseholdunits andbased onweighted FRcollected inpreviouswork
Australian foodcompositiondata 1995
NR 1 0 FR (3 d) Pearson’s CC;Bland–Altmanmethod (meanagreement %,LOA %), sloperegression; tertilemethod
NS High Good
Araujo(14) NR 93 NR PB IW NR NutWin software1?5, 2005,FederalUniversity ofSao Paulo,Brazil
NR 1 0 FR (3 d, twoweekdays andone weekendday)
Pearson’s CC; kw,Bland–Altmanmethod (meanagreement %,LOA %), sloperegression;quartile method
NS High Good
Bertoli(15) 16 136 NR PB IW Portionsclassified inthree sizes(A small, Bmedium, Clarge),displayed asa photographfor each item
Foodcompositiondata of theItalianNationalInstitute ofNutrition(Winfood1?0b version;Medimatica,Martinsicuro,Italy)
30 min 1 0 WFR (7 d) Pearson’s CC; kw,Bland–Altmanmethod (meanagreement %,LOA %); tertilemethod
NS High Good
Cullen(16) NR 72 Previousweek
PB IW Visual servingsizes onplates andbowls, basedon the 2005DietaryGuidelines(food groups)and US FDAserving sizes
NHANES data NR 2 1 monthlater
24-HR (two, oneweekday and oneweekend day;over a 7 d period)
Pearson’s CC;paired t tests,Bland–Altmanmethod (meanagreement %,LOA %)
ICC High Good
Deschamps(17) 24 124 Previousyear
PB IW For 45 fooditems:photographs,with threeportion sizes(FLVS I). Forthe other 61food items:averageportion sizefrom FLVS I
French REGALfoodcompositiontable
NR 2 6 monthslater
24-HR (four, oneeach season)
Pearson’s CC;quintile method
ICC High Good
6G
Tab
acchi
eta
l.

Public Health Nutrition
Table 2 Continued
First author(ref)
FFQfood
groups
FFQfooditems
Consumptioninterval
FFQtype
Administrationmode
Portion sizeestimationmethod
Foodcompositiondatabase used
Administrationduration
No. of FFQadministered
FFQinterval(retest)
Referencemethod(characteristics)
Statistics usedfor validation
Statisticsused forreproducibility
Quality level,accordingto Denniset al.(11)
Quality level,according toSerra-Majem
et al. (12)
Hoelscher(18) 19 200 Previousweek
PB IW None None 20–45 min 1 0 24-HR (one, in thesame day 2 hafter the FFQ)
Spearman’s CC; k;% agreement
Spearman’sCC; k; %agreement
High Good
Hong(19) NR 170 Previous 6months
PB IW Book ofportion sizesdescribedandevaluated foruse inVietnameseadults
EIYOKUNversion 1,developedfromVietnamesefoodconsumptiontables
30 min 3 1 monthlaterand 6monthslater
24-HR (four, threeweekdays andone weekendday)
Pearson’s CC; kw;Bland–Altmanmethod (meanagreement %,LOA %); quintilemethod
NS High Good
Lietz(1) 10 130 Previousyear
PB IW Wrappers/labels ofpackagedfoods anddrinks, fromstandardweights ofschool dinnerportions andfrom MAFFphotographicfood atlas andfood portion-size book
NR NR 1 0 WFR (7 d) Spearman’s CC;Bland–Altmanmethod (meanagreement %,LOA %); tertilemethod
NS High Good
Matthys(20) 15 69 Previousmonth
WB SA Based onexistingconsumptiondata ofFlemishadolescentsfrom 1997and theportion-sizequestion wasaccompaniedby a small listof commonstandardmeasures asexamples
None 30–40 min(general
questionnaire1
FFQ)
2 1 monthlater
3 d FR (one, twoweekdays andone weekendday)
Spearman’s CC;Bland–Altmanmethod (meanagreement %,LOA %)
Spearman’sCC; Bland–Altmanmethod(meanagreement%, LOA %)
Low Poor
Papadopoulou(22) 12 108 Previousweek
PB IW NR McCance andWiddowson’sfood tablesandTrichopoulou’s(1992) foodtables
NR 1 0 WFR (3 d) Pearson’s CC NS High Acceptable/reasonable
Die
taryasse
ssmentm
eth
ods
inad
ole
scents
7

Public Health Nutrition
Table 2 Continued
First author(ref)
FFQfood
groups
FFQfooditems
Consumptioninterval
FFQtype
Administrationmode
Portion sizeestimationmethod
Foodcompositiondatabase used
Administrationduration
No. of FFQadministered
FFQinterval(retest)
Referencemethod(characteristics)
Statistics usedfor validation
Statisticsused forreproducibility
Quality level,accordingto Denniset al.(11)
Quality level,according toSerra-Majem
et al. (12)
Rockett(23) NR 26 NR PB IW National FoodConsumptionSurvey FoodsCommonlyEaten byindividuals;for manyfoods,natural ormanufacturedunits used
Harvardsffq?042393program,based onUSDAhandbook 8series andMcCance andWiddowson’sTheCompositionof Foods
NR 1 0 (i) FFQ (YAQ) fulllist; (ii) 24-HR(three, every 4months; over a1-year period)
Pearson’s CC NS Low Good
Shatenstein(24) NR 78 Previousyear
PB SA Food-specificphotographs
CANDATsoftware,based on the2007bCanadianNutrient File
30 min 1 0 FR (3 d, twoweekdays andone weekendday)
Spearman’s CC;Bland–Altmanmethod (meanagreement %,LOA %); quartilemethod
NS High Acceptable/reasonable
Slater(26) NR 76 Previous 6months
PB IW Portion sizes ingrams. For10 items whichpresenteddifferences inintakebetweenmales andfemales,Virtual Nutriprogram wasused
Virtual Nutriprogram
NR 1 0 24-HR (three, twoweekdays andone weekend day,applied atintervals of 45 d)
Pearson’s CC;quartile method
NS High Very good/excellent
Vereecken(27) NR 15 NR PB IW NR None NR 2 1–2weekslater
24-HR (24 h FBC) Spearman’s CC;kw; agreement %
Spearman’sCC; kw;agreement%
Low Good
Vereecken(29) 22 137 NR WB IW and SA Almost 200sets ofstandardizedphotographs
Dutch Nevotable (2001)and theBelgian Nubeltable (2004)
NR 2 1–2weekslater
24-HR (YANA-C)(four, threeweekdays andone weekend day,over a 2-monthperiod)
Spearman’s CC;Bland–Altmanmethod (meanagreement %,LOA %)
Spearman’sCC
High Good
Watanabe(30) 11 82 Previousmonth
PB SA Small, mediumand largeportions.The standardamount for‘medium’ wasdeterminedby consultinga past survey(September2006)
Microsoft�R
Excel 2007program
30 min 2 1 monthlater
WFR (7 d)(‘7 d-FRRI’)
Pearson’s andSpearman’s CC
NS High Poor
8G
Tab
acchi
eta
l.

Public Health Nutrition
Table 2 Continued
First author(ref)
FFQfood
groups
FFQfooditems
Consumptioninterval
FFQtype
Administrationmode
Portion sizeestimationmethod
Foodcompositiondatabase used
Administrationduration
No. of FFQadministered
FFQinterval(retest)
Referencemethod(characteristics)
Statistics usedfor validation
Statisticsused forreproducibility
Quality level,accordingto Denniset al.(11)
Quality level,according toSerra-Majem
et al. (12)
Watson(31) NR 120 Previous 6months
PB SA Natural’ servingsize (e.g.slice ofbread). In theabsence of anaturalserving size,portion sizeswere derivedfrom the 1995NNS(unpublisheddatapurchasedfrom theABS)
Nutrient intakescomputed inFoodWorks(version3?02?581)using thefollowingdatabases:AustralianAusNut 1999database (AllFoods)Revision 14andAusFoods(Brands)Revision 5
NR 2 5 monthslater
FR (1 d) Pearson’s andSpearman’s CC;kw; Bland–Altmanmethod (meanagreement %,LOA %); quintilemethod
Pearson’sandSpearman’sCC
High Good
NR, not reported; PB, paper based; WB, web based; IW, interviewer administered; SA, self-administered; FR, food record; FDA, Food and Drug Administration; FLVS I, Fleurbaix Laventie Ville Sante Study I; MAFF,Ministry of Agriculture, Fisheries, and Foods; NNS, National Nutrition Survey; ABS, Australian Bureau of Statistics; NHANES, National Heatlh and Nutrition Examination Survey; USDA, US Department of Agriculture;WFR, weighted food record; 24-HR, 24 h recall; YAQ, Youth/Adolescent Questionnaire; FBC, food behaviour checklist; YANA-C, Young Adolescents’ Nutrition Assessment on Computer; CC, correlation coefficient; LOA,limits of agreement; kw, weighted kappa coefficient; NS, not stated; ICC, intra-class correlation coefficient.
Table 3 Characteristics of the three validation studies of other questionnaires than the FFQ
Firstauthor(ref)
Dietarymethod
Foodgroups
Fooditems
Consumptioninterval
Questionnairetype
Administrationmode
Portion sizeestimationmethod
Food compositiondatabase used
Administrationduration
No. ofquestionnairesadministered
Interval(retest)
Referencemethod(characteristics)
Statistics used forvalidation
Statisticsused forreproducibility
Quality level,according toSerra-Majem
et al.(12)
Moore(21) 24-HR 21 49 NR WB SA All foods anddrinks wereanalysed bycount (i.e. thenumber oftimes aparticular foodwas selected)
None 15–40 min 1 0 24 h multiple-pass dietaryrecall (fromUSDA)
A combination of themean between-method differencesand Bland–AltmanLOA
NS Poor
Sjoberg(25) DH NR NR NR PB IW Household units Database SwedishNational foodAdministration,1994
30 min 1 0 7 d FR, withina 3-weekperiod afterthe interview
Wilcoxonmatched-pairs test;Spearman’s CC
NS Acceptable/reasonable
Vereecken(28) 24-HR 8 40 NR WB IW About 800photographswere availablein the program(developedwith MicrosoftVisual Basic6?0)
Belgian (NUBEL,1999) and theDutch FoodCompositionTables (NEVO1996)
NR 2 1 week 1 d FR and24-HR
Agreement %; k
statistics and kw;tertile method;Spearman’s CC;Wilcoxonsigned-rank tests;Bland–Altmanmethod
Wilcoxonsigned-ranktests
Acceptable/reasonable
24-HR, 24 h recall; DH, diet history; NR, not reported; WB, web based; PB, paper based; SA, self-administered; IW, interviewer administered; USDA, US Department of Agriculture; FR, food record; LOA, limits ofagreement; CC, correlation coefficient; kw, weighted kappa coefficient; NS, not stated.
Die
taryasse
ssmentm
eth
ods
inad
ole
scents
9
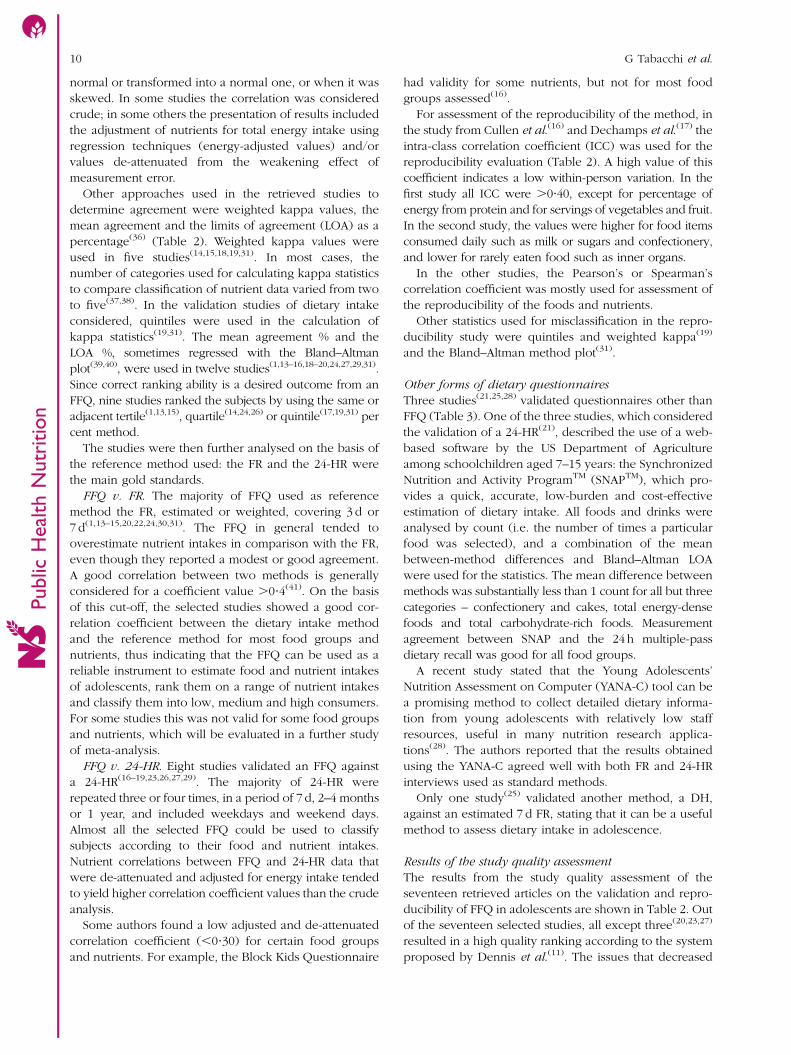
normal or transformed into a normal one, or when it was
skewed. In some studies the correlation was considered
crude; in some others the presentation of results included
the adjustment of nutrients for total energy intake using
regression techniques (energy-adjusted values) and/or
values de-attenuated from the weakening effect of
measurement error.
Other approaches used in the retrieved studies to
determine agreement were weighted kappa values, the
mean agreement and the limits of agreement (LOA) as a
percentage(36) (Table 2). Weighted kappa values were
used in five studies(14,15,18,19,31). In most cases, the
number of categories used for calculating kappa statistics
to compare classification of nutrient data varied from two
to five(37,38). In the validation studies of dietary intake
considered, quintiles were used in the calculation of
kappa statistics(19,31). The mean agreement % and the
LOA %, sometimes regressed with the Bland–Altman
plot(39,40), were used in twelve studies(1,13–16,18–20,24,27,29,31).
Since correct ranking ability is a desired outcome from an
FFQ, nine studies ranked the subjects by using the same or
adjacent tertile(1,13,15), quartile(14,24,26) or quintile(17,19,31) per
cent method.
The studies were then further analysed on the basis of
the reference method used: the FR and the 24-HR were
the main gold standards.
FFQ v. FR. The majority of FFQ used as reference
method the FR, estimated or weighted, covering 3 d or
7 d(1,13–15,20,22,24,30,31). The FFQ in general tended to
overestimate nutrient intakes in comparison with the FR,
even though they reported a modest or good agreement.
A good correlation between two methods is generally
considered for a coefficient value .0?4(41). On the basis
of this cut-off, the selected studies showed a good cor-
relation coefficient between the dietary intake method
and the reference method for most food groups and
nutrients, thus indicating that the FFQ can be used as a
reliable instrument to estimate food and nutrient intakes
of adolescents, rank them on a range of nutrient intakes
and classify them into low, medium and high consumers.
For some studies this was not valid for some food groups
and nutrients, which will be evaluated in a further study
of meta-analysis.
FFQ v. 24-HR. Eight studies validated an FFQ against
a 24-HR(16–19,23,26,27,29). The majority of 24-HR were
repeated three or four times, in a period of 7 d, 2–4 months
or 1 year, and included weekdays and weekend days.
Almost all the selected FFQ could be used to classify
subjects according to their food and nutrient intakes.
Nutrient correlations between FFQ and 24-HR data that
were de-attenuated and adjusted for energy intake tended
to yield higher correlation coefficient values than the crude
analysis.
Some authors found a low adjusted and de-attenuated
correlation coefficient (,0?30) for certain food groups
and nutrients. For example, the Block Kids Questionnaire
had validity for some nutrients, but not for most food
groups assessed(16).
For assessment of the reproducibility of the method, in
the study from Cullen et al.(16) and Dechamps et al.(17) the
intra-class correlation coefficient (ICC) was used for the
reproducibility evaluation (Table 2). A high value of this
coefficient indicates a low within-person variation. In the
first study all ICC were .0?40, except for percentage of
energy from protein and for servings of vegetables and fruit.
In the second study, the values were higher for food items
consumed daily such as milk or sugars and confectionery,
and lower for rarely eaten food such as inner organs.
In the other studies, the Pearson’s or Spearman’s
correlation coefficient was mostly used for assessment of
the reproducibility of the foods and nutrients.
Other statistics used for misclassification in the repro-
ducibility study were quintiles and weighted kappa(19)
and the Bland–Altman method plot(31).
Other forms of dietary questionnaires
Three studies(21,25,28) validated questionnaires other than
FFQ (Table 3). One of the three studies, which considered
the validation of a 24-HR(21), described the use of a web-
based software by the US Department of Agriculture
among schoolchildren aged 7–15 years: the Synchronized
Nutrition and Activity ProgramTM (SNAPTM), which pro-
vides a quick, accurate, low-burden and cost-effective
estimation of dietary intake. All foods and drinks were
analysed by count (i.e. the number of times a particular
food was selected), and a combination of the mean
between-method differences and Bland–Altman LOA
were used for the statistics. The mean difference between
methods was substantially less than 1 count for all but three
categories – confectionery and cakes, total energy-dense
foods and total carbohydrate-rich foods. Measurement
agreement between SNAP and the 24h multiple-pass
dietary recall was good for all food groups.
A recent study stated that the Young Adolescents’
Nutrition Assessment on Computer (YANA-C) tool can be
a promising method to collect detailed dietary informa-
tion from young adolescents with relatively low staff
resources, useful in many nutrition research applica-
tions(28). The authors reported that the results obtained
using the YANA-C agreed well with both FR and 24-HR
interviews used as standard methods.
Only one study(25) validated another method, a DH,
against an estimated 7 d FR, stating that it can be a useful
method to assess dietary intake in adolescence.
Results of the study quality assessment
The results from the study quality assessment of the
seventeen retrieved articles on the validation and repro-
ducibility of FFQ in adolescents are shown in Table 2. Out
of the seventeen selected studies, all except three(20,23,27)
resulted in a high quality ranking according to the system
proposed by Dennis et al.(11). The issues that decreased
Public
Hea
lth
Nutr
itio
n10 G Tabacchi et al.

the quality of the study, according to this quality score,
were related mainly to the number of food items; a
number of food items less than seventy is likely to reduce
the quality of the nutrition information.
According to the score proposed by Serra-Majem
et al.(12), the seventeen articles were ranked as follows: the
study from Slater et al.(26) was very good/excellent; twelve
studies(1,13–19,23,27,29,31) were good; two studies(22,24) were
acceptable/reasonable; and two studies(20,30) were poor.
The quality assessment of the three studies that used
methods other than the FFQ(21,25,28) resulted in one study
being poor(20) and in two studies being acceptable/
reasonable(25,28). The items that affected the quality of the
study, according to the score system from Serra-Majem
et al., were mainly the statistics used to assess validity:
using the mean comparison or the correlation coefficients
alone is not enough to describe one study; the studies from
authors that used correlation coefficients adjusted for
energy or de-attenuated, or other statistics (such as the
Bland–Altman method), in addition to the correlation
coefficients, were ranked into a higher quality level. Data
gathered by self-administration were subject to be less
valid and reliable(20,24,30), as the scoring system assigned
a higher score to the interviewer administration. The
heterogeneity for variables such as sex also retained
importance, but did not influence consistently the final
score. Seasonality and supplements were never reported in
the retrieved studies.
Reviews
A total of twelve reviews were considered for the analy-
sis(2,4,9,39,42–49). In the USA a new version of ASA24 for use
with school-aged children(43) was developed, consisting
of a specialized software program adapted from the
Automated Multiple Pass Method to enable the develop-
ment of a computer-based self-administered 24-HR.
Children 14–16 years of age are also likely to require a
children’s version but testing has not yet been conducted
with this age group; however, the adult version may be
appropriate for those 14–15 years of age or above, but
this has not been thoroughly evaluated.
The review from Cade et al.(46) was prepared to guide
the individual about to embark on the development and/
or use of an FFQ as a dietary assessment tool, and this
provided some guidelines for conducting a validation
study on a new FFQ. In the review from Ortiz-Andrellucchi
et al.(48), 80 % of the reviewed studies used FFQ to assess
micronutrient intakes for which wide variations in the
number of food items were observed (ten to 190 items).
In the studies reviewed, the FFQ comprised the dietary
method that was most utilized to assess the micronutrient
intakes in these groups, in which it is of utmost impor-
tance to recognize methodological aspects such as food
composition databases used for analysis, portion-size
assessment and the time periods between the two dietary
assessment methods.
Where interventions are longer and a large number of
participants is involved, such as those surveys directed at
schoolchildren, 24-HR and 3 d or 7 d FR are possible and
can provide more accurate and detailed data(47).
Some reviews suggested the use of the 24-HR as the
best method to estimate food consumption in adoles-
cents. Specifically, the use of two non-consecutive 24-HR
and a food list to assess the non-users for infrequently
consumed foods was suggested by Biro et al.(42) within
the EFCOSUM (European Food Consumption Survey
Method) Project.
Weighted FR provided the best estimates of energy
intake for younger children aged 0?5 to 4 years, while the
DH method provided better estimates for adolescents
aged 16 years or more(45).
Computer tailoring is important in nutrition research
and is currently one of the most promising and innovative
approaches(44). However, little is known to date and more
research is needed about when, why, where and for
whom computer-tailored nutrition education is effective.
In the review from Probst and Tapsell(49) a wide range of
programs and features for computerized diet assessment
were identified, but they did not specify what age they
referred to.
There are many measurement issues that may impact
on reporting accuracy when assessing the dietary intakes of
children and adolescents(9). One of these is the portion-size
estimation: for the quantification of portion sizes some
papers suggested a picture book, including country-specific
dishes, with additional household measures and other
relevant measurements(42).
Discussion
The present systematic literature review provides useful
information on the most valid and reliable dietary
assessment methods used worldwide in large-scale surveys
on adolescents and suggests the most appropriate tool to
use for the collection of dietary intake data.
In this review, fourteen developed and validated FFQ
were identified. Semi-quantitative FFQ were demonstrated
to be valid and reproducible instruments for estimating
dietary intake in adolescent age at a large-scale level. FFQ
have the advantages of ease of administration, ability to
assess dietary intake over an extended period of time and
low cost(50). However, probably because of misclassifica-
tion, FFQ are not always able to detect weak associations(51),
are less specific and have greater measurement error(50,52).
The FFQ analysed in the current review differed in the way
they were developed and showed large variations in
design characteristics, such as the number of items or
inclusion of portion-size questions, which could affect
reported intakes according to Molag et al.(53). This leads to
the need to further characterize or create new FFQ targeted
to adolescents for a standardized data collection.
Public
Hea
lth
Nutr
itio
nDietary assessment methods in adolescents 11

With regard to the use of a 24-HR for children over
10 years of age, the EFCOSUM Project recommends the
use of two non-consecutive 24-HR. It recommends the
EPIC-SOFT program as the first choice to collect 24-HR in
all European countries(54). However, additional develop-
ments and improvements are needed, and at the moment
the EFCOVAL (European Food Consumption Validation)
Project is trying to adapt and validate it according to the
specific needs of future possible pan-European monitor-
ing surveys. The 24-HR YANA-C is a useful instrument for
collecting data on food and nutrient intakes in adoles-
cents, but it requires too much time to be compiled and is
complex to be used in such a large target population. Also
in the USA the primary instrument used to collect dietary
food intake data in national surveys is a 24-HR: the ASA24
that was developed and is going to be validated also in
school-age children.
Specific design and validation issues were highlighted
in the present review. These issues should be taken into
account when preparing tools for dietary data collection.
The retrieved reviews gave indications about how to
choose appropriate foods; what number of items to
choose; how to manage the portion-size collection; the
method of administration; the use of appropriate nutrient
databases; the pre-testing process; the validation and
reproducibility process; the statistical issues; and other
issues such as the seasonality or the use of supplements.
There are many factors that may affect the validity of a
dietary questionnaire such as respondent characteristics,
questionnaire design and quantification, adequacy of the
reference data, quality control and data management(12).
One of the largest concerns about dietary surveys
based on recall is their reliance on memory, which is
subject to several errors; recall errors increase as a func-
tion of time and up to 30 % of food memory may be lost
from the previous day(55).
The motivation, cognitive ability and literacy level
of the participants are basic determinants for which
instrument to select. Moreover, adolescents experience
difficulty in reporting portion size. Food should be
described in frequencies and quantities of units or por-
tions within a certain time frame; this raises the issue of
the portion-size assessment. Some food items may be
forgotten, other food items may be remembered although
not having been consumed within the given time frame.
Some food items are not recognized because they are part
of a dish (e.g. in pasta with legumes the olive oil is often
ignored, as well as the condiment in the pizza). This may
lead to overestimation or underestimation of intake.
Substantial week-to-week, day-to-day and meal-to-meal
variability in food and portion sizes consumed may
require arithmetic computations to average usual con-
sumption to fit into the FFQ response categories, and
hence may be simplified when a long list of estimations
needs to be done. The current findings suggest for
example to apply a correction factor to decrease the
reported intake of fibre, vitamin C, calcium and iron and
to increase the percentage of energy from fat. In parti-
cular, under-reporting of energy can be a problem in
dietary assessment studies; energy adjustment appears to
minimize the bias generated by under-reporting with
respect to particular nutrients and their association with
various disease outcomes(56). Thus, it is important to
include this value in each validation study that is associated
with the study analysis.
The statistical analyses of validation data (e.g. energy
adjustment, de-attenuation) are important issues to be
considered. Since several factors may affect the measures,
it is difficult to accurately summarize the correlation
coefficient and the agreement for validity and reprodu-
cibility abstracted from published articles. The current
review, therefore, should be considered a rough
description of the validity and reproducibility of the
identified FFQ, which have to be analysed in their entirety
and by food group, nutrient, FFQ length and other
characteristics in a further meta-analysis study. Correla-
tion coefficients were used in all the selected studies, but
this method alone is flawed because it does not measure
the agreement between two methods, only the degree to
which the methods are related(39). Correlation coefficients
can be useful in conjunction with the Bland–Altman
method, which assesses in graphical form the agreement
between the methods across the range of intakes by
plotting the mean of the two methods against the differ-
ence. The mean agreement indicates how well the
FFQ and FR agree on average. The LOA method is used
to determine agreement between absolute values from
each method and provides an informative analysis of
reliability, including information about the magnitude of
errors between methods, the direction of bias between
methods and whether or not bias is constant across levels
of intake.
One important objective is to reduce the costs of
collection and processing of dietary intake information
due to the amounts and complexity of the data usually
involved(57). Beyond new technologies, a recent
approach used in large studies is the Internet-based FFQ.
The questionnaires that used web-based methods were
the FFQ from Matthys et al.(20), the 24-HR SNAP(21), the
24-HR YANA-C(28,58), the Health Behaviour in School-
aged Children (HBSC) FFQ(59) and the Healthy Lifestyle in
Europe by Nutrition in Adolescence (HELENA) FFQ(29).
Vereecken et al.(59) have investigated whether the com-
puter format of the HBSC FFQ would affect the responses
of the adolescents in comparison with the paper-and-
pencil format; some differences were found between the
female and male reporters. In another study(58) an adap-
tation of YANA-C for different country realities in Europe
was described: the feasibility of self-administration
by comparison with administration by an interviewer
was investigated and it was concluded that after an
adaptation, translation and standardization of YANA-C, it
Public
Hea
lth
Nutr
itio
n12 G Tabacchi et al.

is possible to assess the dietary intake of adolescents
by self-administration in a broad international context.
The use of interviewers may be an advantage in some
situations and allows for immediate checking by the
interviewer of improbable or unlikely responses; against
this is the need to standardize the training processes, the
cost of employing interviewers and the influence of the
interviewer’s presence on increasing the likelihood of
social desirability bias in the participant’s responses. In
the light of these considerations, when the quality of the
studies is assessed, the assignment of a higher score to the
studies that use interviewer-administered questionnaires
could be revised. Studies such as those from Matthys(20),
Shatenstein(24) and Watanabe(30), for example, would
gain in quality. Self-administered computerized assess-
ment could be considered a valid way of collecting data;
it makes it possible for participants to register and assess
their dietary intake at their own pace and convenience;
the respondent immediately stores data and interviewers
do not have to be present during the entire interview,
which saves considerable time and decreases costs.
Furthermore, computerized assessment tools can directly
calculate nutrient intakes and energy expenditure, which
makes it possible to give immediate feedback(60). In
addition, adolescents might be more motivated to report
their dietary intake with computer use(28).
The first limit of our review is that studies validating
dietary intake instruments in comparison with biomarkers
were not considered, as they often reflect status rather
than intake, short-term rather than long-term intakes, and
are invasive and expensive(3). Moreover, some foods and
nutrients need particular attention when included in an
FFQ, since relatively poor validity and reproducibility
were observed in FFQ estimates for them; the detailed
information on these foods and nutrients is not given in
the present review, as it is a purpose of further meta-
analysis study. Another limitation is the choice of the
language of the articles, which could have excluded
validated and reliable dietary methods used in other
countries.
Conclusions
There is an ongoing need for the refinement of existing
approaches, especially ones that can be used in large
epidemiological studies. The analysed validation studies
in adolescents justify advocating the FFQ method over the
24-HR and suggest the development of a new semi-
quantitative FFQ that could fit the purposes of the ASSO
Project. The design of the FFQ will be established in
detail after a meta-analysis study on the validity and
reproducibility of the identified FFQ, ranking by specific
characteristics such as food group, nutrient or FFQ length.
The ASSO-FFQ will be a new tool addressing the need
for a valid, reproducible, user-friendly, fast, cost-effective,
standardized method of accurately assessing nutrient
intakes in adolescents.
Acknowledgements
Sources of funding: The work was performed within the
Adolescents and Surveillance System for the Obesity
prevention (ASSO) Project (code GR-2008-1140742, CUP
I85J10000500001), a young researchers’ project funded by
the Italian Ministry of Health. The Italian Ministry of
Health had no role in the design, analysis or writing of
this article. Conflicts of interest: The authors state there
are no conflicts of interest. Ethics: Ethical approval was
given by the ethical committee of the Azienda Ospedaliera
Universitaria Policlinico Paolo Giaccone (approval code
n.9/2011). Authors’ contributions: All authors contributed
to the development of the review. G.T., C.M. and
A.B. performed the search, screening and elaboration
of concepts. E.A., M.d.P. and M.J. provided a valuable
contribution to the whole manuscript.
References
1. Lietz G, Barton KL, Longbottom PJ et al. (2002) Can theEPIC food-frequency questionnaire be used in adolescentpopulations? Public Health Nutr 5, 783–789.
2. Rockett HRH, Berkeya CS & Colditz GA (2003) Evaluationof dietary assessment instruments in adolescents. Curr
Opin Clin Nutr Metab Care 6, 557–562.3. Lampe JW & Rock CL (2008) Biomarkers and their use in
nutrition intervention. In Nutrition in the Prevention and
Treatment of Disease, 2nd ed., pp. 187–201 [AM Coulstonand CJ Boushey, editors]. San Diego, CA: Academic Press.
4. Thompson FE & Subar AF (2008) Dietary assessmentmethodology. In Nutrition in the Prevention and Treat-
ment of Disease, 2nd ed., pp. 5–46 [AM Coulston andCJ Boushey, editors]. San Diego, CA: Academic Press..
5. Ngo J, Engelen A, Molag M et al. (2009) A review of the useof information and communication technologies for dietaryassessment. Br J Nutr 101, Suppl. 2, S102–S112.
6. Poslusna K, Ruprich J, de Vries JHM et al. (2009)Misreporting of energy and micronutrient intake estimatedby food records and 24 hour recalls, control and adjust-ment methods in practice. Br J Nutr 108, Suppl. 2, S73–S85.
7. Gibson RS (2005) Principles of Nutritional Assessment, 2nded. New York: Oxford University Press.
8. Kroeze W, Werkman A & Brug J (2006) A systematic reviewof randomized trials on the effectiveness of computer-tailored education on physical activity and dietary behaviors.Ann Behav Med 31, 205–223.
9. Innovation of Dietary Assessment Methods for Epidemio-logical Studies and Public Health (2009) Dietary Assess-ment Methods: State of the Art Report. http://nugo.dife.de/twiki41/pub/IDAMES/IdamesResults/2009_WP4_Report.pdf(accessed February 2013).
10. Livingstone MB, Robson PJ & Wallace JM (2004) Issues indietary intake assessment of children and adolescents. Br J
Nutr 92, Suppl. 2, S213–S222.11. Dennis LK, Snetselaar LG, Nothwehr FK et al. (2003)
Developing a scoring method for evaluating dietarymethodology in reviews of epidemiologic studies. J Am
Diet Assoc 103, 483–487.
Public
Hea
lth
Nutr
itio
nDietary assessment methods in adolescents 13

12. Serra-Majem L, Frost Andersen L, Henrıque Sanchez P et al.(2009) Evaluating the quality of dietary intake validationstudies. Br J Nutr 102, Suppl. 1, S3–S9.
13. Ambrosini GL, de Klerk NH, O’Sullivan TA et al. (2009) Thereliability of a food frequency questionnaire for use amongadolescents. Eur J Clin Nutr 63, 1251–1259.
14. Arajuo MC, Massae Yokoo E & Alves Pereira R (2010)Validation and calibration of a semiquantitative foodfrequency questionnaire designed for adolescents. J AmDiet Assoc 110, 1170–1177.
15. Bertoli S, Petroni ML, Pagliato E et al. (2005) Validationof food frequency questionnaire for assessing dietarymacronutrients and calcium intake in Italian children andadolescents. J Pediatr Gastroenterol Nutr 40, 555–560.
16. Cullen KW, Watson K & Zakeri I (2008) Relative reliabilityand validity of the Block Kids Questionnaire among youthaged 10 to 17 years. J Am Diet Assoc 108, 862–866.
17. Deschamps V, De Lauzon-Guillain B, Lafay L et al. (2009)Reproducibility and relative validity of a food-frequencyquestionnaire among French adults and adolescents. Eur JClin Nutr 63, 282–291.
18. Hoelscher D, Day S, Kelder SH et al. (2003) Reproducibilityand validity of the secondary level School-Based NutritionMonitoring student questionnaire. J Am Diet Assoc 103,186–194.
19. Hong TK, Dibley MJ & Sibbritt D (2010) Validity andreliability of an FFQ for use with adolescents in Ho ChiMinh City, Vietnam. Public Health Nutr 13, 368–375.
20. Matthys C, Pynaert I, De Keyzer W et al. (2007) Validity andreproducibility of an adolescent web-based food frequencyquestionnaire. J Am Diet Assoc 107, 605–610.
21. Moore HJ, Ells LJ, McLure SA et al. (2008) The developmentand evaluation of a novel computer program to assessprevious-day dietary and physical activity behaviours inschool children: the Synchronised Nutrition and ActivityProgramTM (SNAPTM). Br J Nutr 99, 1266–1274.
22. Papadopoulou SK, Barboukis V, Dalkiranis A et al. (2008)Validation of a questionnaire assessing food frequency andnutritional intake in Greek adolescents. Int J Food Sci Nutr59, 148–154.
23. Rockett HRH, Berkey CS & Colditz GA (2007) Comparisonof a short food frequency questionnaire with the Youth/Adolescent Questionnaire in the Growing Up Today Study.Int J Pediatr Obes 2, 31–39.
24. Shatenstein B, Amre D, Jabbour M et al. (2010) Examiningthe relative validity of an adult food frequency question-naire in children and adolescents. J Pediatr GastroenterolNutr 51, 645–652.
25. Sjoberg A & Hulthe L (2004) Assessment of habitual mealpattern and intake of foods, energy and nutrients inSwedish adolescent girls: comparison of diet history with7-day record. Eur J Clin Nutr 58, 1181–1189.
26. Slater B, Philippi ST, Fisberg RM et al. (2003) Validation of asemi-quantitative adolescent food frequency questionnaireapplied at a public school in Sao Paulo, Brazil. Eur J ClinNutr 57, 629–635.
27. Vereecken CA & Maes L (2003) A Belgian study on thereliability and relative validity of the Health Behaviour inSchool-Aged Children food-frequency questionnaire. PublicHealth Nutr 6, 581–588.
28. Vereecken CA, Covents M, Matthys C et al. (2005) Youngadolescents’ nutrition assessment on computer (YANA-C).Eur J Clin Nutr 59, 658–667.
29. Vereecken CA, De Bourdeaudhuij I & Maes L (2010)The HELENA online food frequency questionnaire:reproducibility and comparison with four 24-hour recallsin Belgian-Flemish adolescents. Eur J Clin Nutr 64,541–548.
30. Watanabe M, Yamaoka K, Yokotsuka M et al. (2010)Validity and reproducibility of the FFQ (FFQW82) for
dietary assessment in female adolescents. Public HealthNutr 14, 297–305.
31. Watson JF, Collins CE, Sibbritt DW et al. (2009) Reprodu-cibility and comparative validity of a food frequencyquestionnaire for Australian children and adolescents. IntJ Behav Nutr Phys Act 6, 62.
32. Willett W (1998) Nutritional Epidemiology, 2nd ed. NewYork: Oxford University Press.
33. Fraser GE, Lindsted KD, Knutsen SF et al. (1998) Validity ofdietary recall over 20 years among California Seventh-dayAdventists. Am J Epidemiol 148, 810–818.
34. Chinn S (1990) The assessment of methods of measure-ment. Stat Med 9, 351–362.
35. Hebert JR & Miller DR (1991) The inappropriateness ofconventional use of the correlation coefficient in assessingvalidity and reliability of dietary assessment methods. Eur JEpidemiol 7, 339–343.
36. Bland JM & Altman DG (1999) Measuring agreement inmethod comparison studies. Stat Methods Med Res 8,135–160.
37. Brenner H & Kliebsch U (1996) Dependence of weightedkappa coefficients on the number of categories. Epidemiology7, 199–202.
38. Sim J & Wright CC (2005) The kappa statistic in reliabilitystudies: use, interpretation, and sample size requirements.Phys Ther 85, 257–268.
39. Altman DG (1991) Practical Statistics for Medical Research.London: Chapman and Hall.
40. Bland JM & Altman DG (1986) Statistical methods forassessing agreement between two methods of clinicalmeasurement. Lancet 1, 307–310.
41. Cade JE, Burley VJ, Warm DL et al. (2004) Food frequencyquestionnaires: a review of their design, validation andutilization. Nutr Res Rev 17, 5–22.
42. Biro G, Hulshof KF, Ovesen L et al. (2002) Selection ofmethodology to assess food intake. Eur J Clin Nutr 56,Suppl. 2, S25–S32.
43. Bliss RM (2004) Researchers produce innovation in dietaryrecall. Agric Res 52, 10–12.
44. Brug J, Oenema A & Campbell M (2003) Past, present, andfuture of computer-tailored nutrition education. Am J ClinNutr 77, 1028–1034.
45. Burrows TL, Martin RJ & Collins CE (2010) A systematicreview of the validity of dietary assessment methods inchildren when compared with the method of doublylabeled water. J Am Diet Assoc 110, 1501–1510.
46. Cade JE, Thompson RL, Burley V et al. (2002) Development,validation and utilisation of food-frequency questionnaires –a review. Public Health Nutr 5, 567–587.
47. Contento IR, Randell JS & Basch CE (2002) Reviewand analysis of evaluation measures used in nutritioneducation intervention research. J Nutr Educ Behav 34,2–25.
48. Ortiz-Andrellucchi A, Henriquez-Sanchez P, Sanchez-Villegas A et al. (2009) Dietary assessment methods formicronutrient intake in infants, children and adolescents: asystematic review. Br J Nutr 102, Suppl. 1, S87–S117.
49. Probst YC & Tapsell LC (2005) Overview of computerizeddietary assessment programs for research and practice innutrition education. J Nutr Educ Behav 37, 20–26.
50. Subar AF (2004) Developing dietary assessment tools. J AmDiet Assoc 104, 769–770.
51. Schatzkin A, Kipnis V, Carroll RJ et al. (2003) A comparisonof a food frequency questionnaire with a 24-hour recall foruse in an epidemiological cohort study: results from thebiomarker based Observing Protein and Energy Nutrition(OPEN) study. Int J Epidemiol 32, 1054–1062.
52. Kipnis V, Subar AF, Midthune D et al. (2003) The structureof dietary measurement error. Results of the OPENbiomarker study. Am J Epidemiol 158, 14–21.
Public
Hea
lth
Nutr
itio
n14 G Tabacchi et al.

53. Molag ML, de Vries JHM, Ocke MC et al. (2007) Designcharacteristics of food frequency questionnaires in relationto their validity. Am J Epidemiol 166, 1468–1478.
54. Slimani N & Valsta L (2002) Perspectives of using theEPIC-SOFT programme in the context of pan-Europeannutritional monitoring surveys: methodological and practicalimplications. Eur J Clin Nutr 56, Suppl. 2, S63–S74.
55. Fries E, Green P & Bowen DJ (1995) What did I eatyesterday? Determinants of accuracy in 24-hour foodmemories. Appl Cogn Psychol 9, 143–155.
56. Gnardellis C, Boulou C & Trichopoulou A (1998) Magnitude,determinants and impact of under-reporting of energyintake in a cohort study in Greece. Public Health Nutr 1,131–137.
57. Thompson FE, Subar AF, Loria CM et al. (2010) Need fortechnological innovation in dietary assessment. J Am DietAssoc 110, 48–51.
58. Vereecken CA, Covents M, Sichert-Hellert W et al. (2008)Development and evaluation of a self-administered com-puterized 24-h dietary recall method for adolescents inEurope. Int J Obes (Lond) 32, Suppl. 5, S26–S34.
59. Vereecken CA & Maes L (2006) Comparison of a computer-administered and paper-and-pencil administered question-naire on health and lifestyle behaviors. J Adolesc Health 38,426–432.
60. Evers W & Carol B (2007) An Internet-based assessmenttool for food choices and physical activity behaviors. J NutrEduc Behav 39, 105–106.
Public
Hea
lth
Nutr
itio
nDietary assessment methods in adolescents 15