Nutritional Status, Dietary Intake and Dietary Diversity ... - MDPI
14
Citation: Swart, E.C.; van der Merwe, M.; Williams, J.; Blaauw, F.; Viljoen, J.M.M.; Schenck, C.J. Nutritional Status, Dietary Intake and Dietary Diversity of Landfill Waste Pickers. Nutrients 2022, 14, 1172. https:// doi.org/10.3390/nu14061172 Academic Editors: Penny Love and Colin Bell Received: 24 December 2021 Accepted: 28 February 2022 Published: 10 March 2022 Publisher’s Note: MDPI stays neutral with regard to jurisdictional claims in published maps and institutional affil- iations. Copyright: © 2022 by the authors. Licensee MDPI, Basel, Switzerland. This article is an open access article distributed under the terms and conditions of the Creative Commons Attribution (CC BY) license (https:// creativecommons.org/licenses/by/ 4.0/). nutrients Article Nutritional Status, Dietary Intake and Dietary Diversity of Landfill Waste Pickers Elizabeth C. Swart 1, * , Maria van der Merwe 2 , Joy Williams 1 , Frederick Blaauw 3 , Jacoba M. M. Viljoen 4 and Catherina J. Schenck 5 1 Department of Dietetics and Nutrition, Faculty of Community and Health Sciences, University of the Western Cape, Bellville, Cape Town 7530, South Africa; [email protected] 2 School of Public Health, University of the Western Cape, Bellville, Cape Town 7530, South Africa; [email protected] 3 School of Economic Sciences, North-West University, Potchefstroom Campus, Private Bag X6001, Potchefstroom 2520, South Africa; [email protected] 4 School of Economics and Econometrics, University of Johannesburg, Johannesburg 2092, South Africa; [email protected] 5 Department of Social Work, DSI/NRF/CSIR Chair in Waste and Society, University of Western Cape, Bellville, Cape Town 7530, South Africa; [email protected] * Correspondence: [email protected] Abstract: The purpose of this study was to investigate and describe the nutritional status, dietary intake and dietary diversity of waste pickers in South Africa, a socioeconomically vulnerable group who makes a significant contribution to planetary health through salvaging recyclable material from dumpsites. Participants were weighed and measured to calculate body mass index (BMI). Dietary intake was recorded using a standardised multipass 24 h recall. Individual dietary diversity scores were derived from the dietary recall data. Data were collected from nine purposefully selected landfill sites located in six rural towns and three cities in four of the nine provinces in South Africa, providing nutritional status information on 386 participants and dietary intake on 358 participants after data cleaning and coding. The mean BMI of the study sample was 23.22 kg/m 2 . Underweight was more prevalent among males (22.52%) whilst 56.1% of the females were overweight or obese. The average individual dietary diversity score was 2.46, with 50% scoring 2 or less. Dietary intake patterns were characterised as monotonous, starch-based and lacking vegetables and fruits. The nutritional status, dietary intake and dietary diversity of waste pickers reflect their precarious economic status, highlighting the need for health, social and economic policies to improve access and affordability of nutritious food. Keywords: waste pickers; nutritional status; dietary intake; dietary diversity; South Africa 1. Introduction Nutrition is a critical component of health and development, with adequate nutrition aiding the prevention of malnutrition in all its forms, improving productivity and creating opportunities to gradually break the cycles of hunger and poverty. South Africa is an upper-middle-income country with a culturally diverse popula- tion estimated at 59.6 million people [1]. Social, health and economic disparities remain and are aggravated by persistent high poverty, entrenched structural inequality and un- employment [2–4]. The country is experiencing rapid epidemiological transition, with noncommunicable diseases (NCDs) increasing to be the major cause of death, with an estimated 269,000 NCD related deaths annually [5]. This increase as well as the substan- tial higher burden is particularly noted among lower socioeconomic groups and obese persons [6–8]. The nutrition situation in South Africa is complex and typical of a country in nutrition transition. Undernutrition, notably stunting and micronutrient deficiencies, coexist with Nutrients 2022, 14, 1172. https://doi.org/10.3390/nu14061172 https://www.mdpi.com/journal/nutrients
-
Upload
khangminh22 -
Category
Documents
-
view
2 -
download
0
Transcript of Nutritional Status, Dietary Intake and Dietary Diversity ... - MDPI

�����������������
Citation: Swart, E.C.; van der Merwe,
M.; Williams, J.; Blaauw, F.; Viljoen,
J.M.M.; Schenck, C.J. Nutritional
Status, Dietary Intake and Dietary
Diversity of Landfill Waste Pickers.
Nutrients 2022, 14, 1172. https://
doi.org/10.3390/nu14061172
Academic Editors: Penny Love and
Colin Bell
Received: 24 December 2021
Accepted: 28 February 2022
Published: 10 March 2022
Publisher’s Note: MDPI stays neutral
with regard to jurisdictional claims in
published maps and institutional affil-
iations.
Copyright: © 2022 by the authors.
Licensee MDPI, Basel, Switzerland.
This article is an open access article
distributed under the terms and
conditions of the Creative Commons
Attribution (CC BY) license (https://
creativecommons.org/licenses/by/
4.0/).
nutrients
Article
Nutritional Status, Dietary Intake and Dietary Diversity ofLandfill Waste PickersElizabeth C. Swart 1,* , Maria van der Merwe 2 , Joy Williams 1, Frederick Blaauw 3 , Jacoba M. M. Viljoen 4
and Catherina J. Schenck 5
1 Department of Dietetics and Nutrition, Faculty of Community and Health Sciences, University of the WesternCape, Bellville, Cape Town 7530, South Africa; [email protected]
2 School of Public Health, University of the Western Cape, Bellville, Cape Town 7530, South Africa;[email protected]
3 School of Economic Sciences, North-West University, Potchefstroom Campus, Private Bag X6001,Potchefstroom 2520, South Africa; [email protected]
4 School of Economics and Econometrics, University of Johannesburg, Johannesburg 2092, South Africa;[email protected]
5 Department of Social Work, DSI/NRF/CSIR Chair in Waste and Society, University of Western Cape, Bellville,Cape Town 7530, South Africa; [email protected]
* Correspondence: [email protected]
Abstract: The purpose of this study was to investigate and describe the nutritional status, dietaryintake and dietary diversity of waste pickers in South Africa, a socioeconomically vulnerable groupwho makes a significant contribution to planetary health through salvaging recyclable material fromdumpsites. Participants were weighed and measured to calculate body mass index (BMI). Dietaryintake was recorded using a standardised multipass 24 h recall. Individual dietary diversity scoreswere derived from the dietary recall data. Data were collected from nine purposefully selected landfillsites located in six rural towns and three cities in four of the nine provinces in South Africa, providingnutritional status information on 386 participants and dietary intake on 358 participants after datacleaning and coding. The mean BMI of the study sample was 23.22 kg/m2. Underweight was moreprevalent among males (22.52%) whilst 56.1% of the females were overweight or obese. The averageindividual dietary diversity score was 2.46, with 50% scoring 2 or less. Dietary intake patternswere characterised as monotonous, starch-based and lacking vegetables and fruits. The nutritionalstatus, dietary intake and dietary diversity of waste pickers reflect their precarious economic status,highlighting the need for health, social and economic policies to improve access and affordability ofnutritious food.
Keywords: waste pickers; nutritional status; dietary intake; dietary diversity; South Africa
1. Introduction
Nutrition is a critical component of health and development, with adequate nutritionaiding the prevention of malnutrition in all its forms, improving productivity and creatingopportunities to gradually break the cycles of hunger and poverty.
South Africa is an upper-middle-income country with a culturally diverse popula-tion estimated at 59.6 million people [1]. Social, health and economic disparities remainand are aggravated by persistent high poverty, entrenched structural inequality and un-employment [2–4]. The country is experiencing rapid epidemiological transition, withnoncommunicable diseases (NCDs) increasing to be the major cause of death, with anestimated 269,000 NCD related deaths annually [5]. This increase as well as the substan-tial higher burden is particularly noted among lower socioeconomic groups and obesepersons [6–8].
The nutrition situation in South Africa is complex and typical of a country in nutritiontransition. Undernutrition, notably stunting and micronutrient deficiencies, coexist with
Nutrients 2022, 14, 1172. https://doi.org/10.3390/nu14061172 https://www.mdpi.com/journal/nutrients

Nutrients 2022, 14, 1172 2 of 14
a rising incidence of overweight and obesity and the associated consequences such asNCDs [9]. The South African food system is highly commercialised with the majorityof households purchasing all their food. The food system is furthermore characterisedby cultural and socioeconomic diversity and high levels of income inequality, renderingvulnerable population groups at risk of food insecurity and hunger [10].
The percentage of the population that experienced hunger decreased from 29.3% in2002 to 11.3% in 2018 and the percentage of people with limited general access to fooddecreased from 29.1% to 23.8% from 2010 to 2018 [10]. However, the COVID-19 pandemicforegrounded the failures of the food system to provide sufficient, healthy, nutritious foodand to serve the most vulnerable people in South Africa, potentially reversing progressachieved in the reduction of hunger of the past two decades. The National Income Dy-namics Survey, Coronavirus Rapid Mobile Survey (NIDS-CRAM), a monthly nationallyrepresentative panel survey conducted since May 2020, indicated immediate adverse effectson employment and food security and widening inequality. Between March and June 2020,40% of the NIDS-CRAM sample reported the loss of employment as a result of COVID-19and 22% of adults and 15% of children were reported to have gone to bed hungry [11,12].
Waste is an unavoidable byproduct of human activities and if accumulated in largequantities, it can lead to degradation of the environment, natural resources and healthproblems [13]. It is estimated that South Africa generated approximately 54.2 million tonsof waste in 2017, of which an estimated 20.7 million tons were recycled. In addition, SouthAfrica produces approximately 31 million tons of food annually, of which an estimated10 million tons (34.3%) is lost to waste [14].
The commercialisation of waste management, coupled with an increase in recyclingpractices and unabated unemployment resulted in the survivalist activity of informal wastepicking by the poorest and marginalised on landfill sites [15,16]. Their diversification oflivelihood is an important strategy towards poverty alleviation. Waste pickers collect,sort, recycle, repurpose and/or sell materials thrown away by others; salvaging andrevaluing waste through the recycling value chain [17]. While some rummage in searchof necessities, others collect and sell recyclables to middlemen or businesses or work inrecycling warehouses or plants owned by their cooperatives or associations [15,18]. InSouth Africa, there are an estimated 60,000 to 90,000 informal waste pickers operating atdifferent levels [18].
These informal waste pickers operate at the lowest level in the hierarchy of entities thatcollect and dispose of waste, including municipal waste collection services and recyclingstructures. Yet they significantly contribute to the economy in general and the recyclingeconomy in particular [19]. Nationally, it is estimated that waste pickers save municipalitiesup to R750 million per year by collecting waste at no cost and saving landfill space [20].While waste pickers are typically scorned and treated as a nuisance, their valuable contribu-tion towards waste management and recycling industries are increasingly being recognisedand valued by the South African government and stakeholders in the waste industry; withseveral attempts to integrate waste pickers into formal waste and recycling structures [19].Their contribution to the economy is in stark contrast to the meagre, and extremely vari-able, mean financial benefit from informal waste picking trade activities of R451.90 (lessthan 30 USD) per week in a case study by Schenck et al. in 2018 [21]. Considering thateach waste picker in the above case study had a mean of four financial dependents, theirhousehold income would seldom exceed the poverty line of R1 268 (82 USD) per personper month [22].
Waste pickers were particularly hard hit by the initial national lockdown regulationsfollowing the outbreak of COVID-19, demonstrating their vulnerability to socioeconomicfactors. As an informal sector, waste picking was not regarded as an essential serviceand waste pickers were dismissed for the role they play in the waste sector, resultingin income loss, hunger and reliance on food relief efforts. Reports regarding a lack ofconsultation and communication with stakeholders demonstrate how the impact of the

Nutrients 2022, 14, 1172 3 of 14
pandemic extended beyond the immediate risk of infection to further adverse effects relatedto policy decisions [23].
Although it has been documented that waste pickers obtain food through their activi-ties, the exact contribution of their “findings” to their dietary intake is difficult to quantify,and largely unknown. No scientifically analysed information is available on the nutritionalstatus and dietary intake of waste pickers in South Africa. The objectives of the study wereto (1) assess the nutritional status of people who make a living of informal waste pickingfrom landfill sites, (2) to assess the dietary intake of waster pickers, and (3) to assess thedietary diversity of waste pickers.
2. Materials and Methods
This study on the nutritional status, dietary intake and dietary diversity of wastepickers on landfill sites in South Africa, collected quantitative cross-sectional data fromnine purposefully selected landfill sites (in six rural towns and three cities and representingboth outsourced and municipally managed landfill sites) in four of the nine provinces inSouth Africa in 2015.
Trained fieldworkers, proficient in the languages spoken on the respective landfillsites, collected socioeconomic data using a questionnaire with quantitative and open-endedexplanatory, qualitative questions where more information was required. Dietary intakewas recorded by the trained field workers, using a standardised 24 h recall record formand a standardised dietary intake toolkit to assist with quantification [24]. Where possible,interview days were selected to ensure that 24 h recalls represented week and weekenddays proportionally. Measurements of weight and height were obtained by one researcher,to limit interobserver variability. Bodyweight was recorded to the nearest 0.1 kg (A&DPersonal Precision Scale, Tokyo, Japan) and height to the nearest 1mm (using a portablestadiometer), applying standardised methodology and were used to calculate body massindex (BMI) according to World Health Organization (WHO) criteria [25].
All waste pickers present on the landfill site on the day of data collection who werewilling to participate were interviewed. A total of 409 adult waste pickers were interviewedand missing values were recorded for some participants. Discrepancies between numbersof waste pickers with dietary intake, anthropometric measurements and general sociode-mographic information are the result of waste pickers’ choice not to continue due to timeconstraints when new trucks with fresh waste arrived. No missing values were recordedfor the two smallest landfill sites. Statistical analyses of selected variables in each dataset revealed no systematic bias for those participants with missing values (independentt-test all p-values were ≥0.05; paired sample t-test after replacing missing values withseries mean for continuous variables could not be performed as the standard error of thedifference was 0) See Table S1. Subsequently, information on all participants was includedin the analyses using a pairwise exclusion analysis by analysis when applicable.
The study was approved by the Senate Research Ethics Committee of the University ofthe Western Cape (reference number 15/4/24). After receiving information on the processand purpose of the research, participants completed written consent to confirm voluntaryparticipation. Illiterate participants gave verbal consent in the presence of a third personas a witness. Consent forms and information sheets were translated in the most spokenlanguages and explained in the language best understood. Participants were compensatedfor their involvement in the form of food worth 1 USD, following the interviews andanthropometric measurements. Questionnaires and data collection forms were anonymisedand identified by a code for data analysis purposes. All information acquired was storedsecurely. Hard copies were stored in a sealed box in a locked cabinet and electronic datawas stored on a password-protected computer.

Nutrients 2022, 14, 1172 4 of 14
Data Analysis
Anonymised data, recorded in Microsoft Excel 2016, was exported and analysed inIBM SPSS Statistics 25, 2017 for descriptive analysis. Pairwise exclusion was performedand cases were excluded if the variables under investigation were missing.
Anthropometric data was recoded and analysed according to BMI categories. Theanthropometric status of male and female waste pickers was compared to the findingsof the South African Demographic Health Survey (SADHS) of 2016 reported in their keyfindings report [26]. The 2016 SADHS used a stratified, two-stage sampling design toprovide estimates that were representative of national, provincial and locality type (urbanand nonurban areas) and included a sample of 11,083 households. Both studies used thesame BMI categories for underweight, overweight and obesity and excluded pregnantwomen and women who have given birth in the last two months.
The dietary intake data collection was done according to the Centre of Excellencein Food Security Manual on Dietary intake assessment—24 h recall [24]. Quantified 24 hdietary recall data were coded and converted to nutrient intakes using the electronic SouthAfrican Medical Research Council Food Composition Database. Acceptable macronutrientdistribution ranges (AMDR) were used to assess macronutrient intake of participants [27].Accordingly, the AMDR for carbohydrates is 45–65% of energy, for protein it is 10–35% ofenergy and for fat it is 20–35% of energy.
Micronutrient intake of participants were compared to the dietary reference intake(DRI) values for men and women aged ≥ 19 years [28]. The estimated average requirements(EARs) according to gender and age groups were applied, when established, and adequateintakes (AIs) when EARs were not established.
Dietary adequacy was determined through individual dietary diversity scores. The24 h recall data was cleaned and coded according to each of sixteen food groups, namely:cereals; white roots and tubers; vitamin A-rich vegetables and tubers; dark green leafyvegetables; other vegetables; vitamin A-rich fruits; other fruits; organ meat; flesh meats;eggs; fish and seafood; legumes, nuts and seeds; milk and milk products; oils and fats;sweets; and spices, condiments and beverages. A dietary diversity score was calculatedby summing the number of nine aggregated food groups (starchy staples; dark greenleafy vegetables; vitamin A-rich fruits and vegetables; other fruits and vegetables; organmeat; meat and fish; eggs; legumes, nuts and seeds; and milk and milk products) fromwhich foods had been consumed, with a potential score range of 0 to 9 [29]. Only foodsconsumed in quantities above 1 tablespoon (15 g) were included and each group was onlycounted once.
3. Results3.1. Sociodemographic Characteristics
The majority (234) of the 409 participants were male, with six of the sites being maledominated, one site allowed only male waste pickers and the remaining two sites hadpredominantly female waste pickers. While some of the participants did not know theirage, the mean age of the 88.3% of the respondents who knew their age was 39 years.Female participants were on average 5 years older than their male counterparts. Themajority (82.1%) of the study participants were black Africans and the remainder was ofmixed ancestry (Coloured South Africans). A small proportion (7.9%) of the participantscompleted secondary education and none had any tertiary education. The income of wastepickers varied greatly depending on the types of waste delivered to landfill sites. This isdescribed elsewhere [30,31]
3.2. Nutritional Status
Of the 409 participants, anthropometric measurements were taken for 386 individuals.The mean BMI of males and females were 20.9 ± 2.9 kg/m2 and 26.4 ± 6.3 kg/m2 respec-tively, with most males (74.9%) having a normal BMI, compared to 42.4% of the females.While underweight was more prevalent among males (16.4%) than females (6.7%) (see
Nutrients 2022, 14, 1172 5 of 14
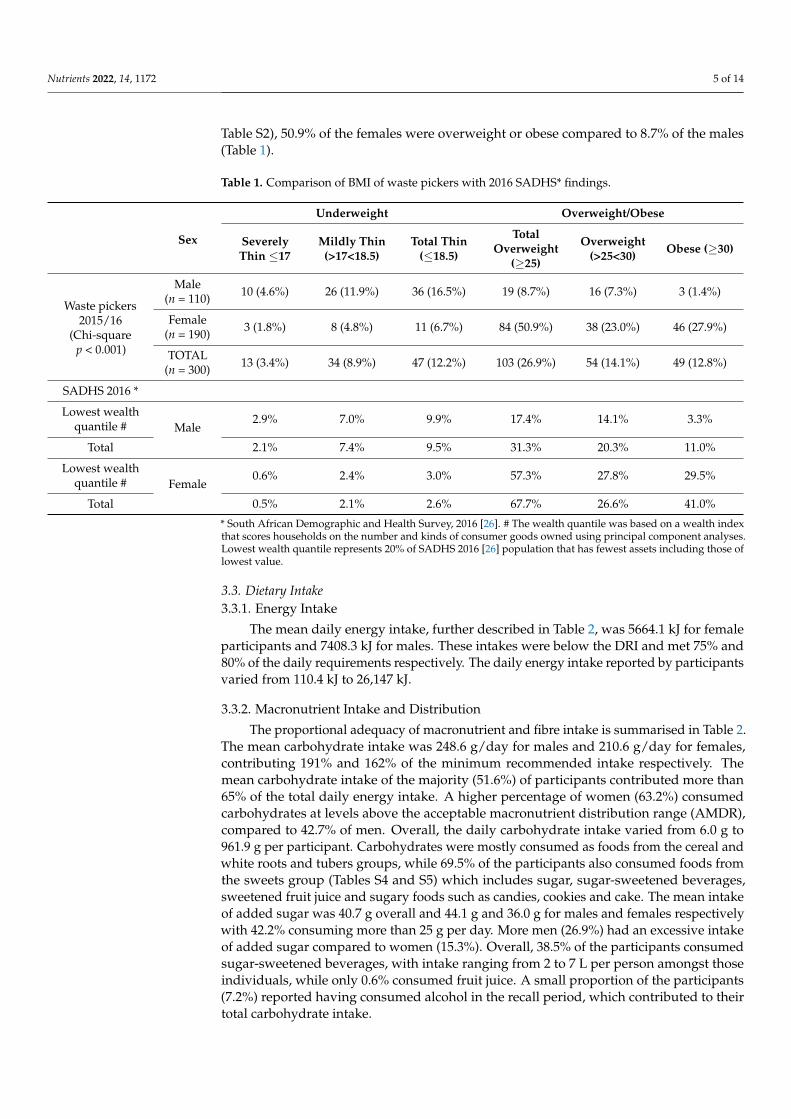
Table S2), 50.9% of the females were overweight or obese compared to 8.7% of the males(Table 1).
Table 1. Comparison of BMI of waste pickers with 2016 SADHS* findings.
Sex
Underweight Overweight/Obese
SeverelyThin ≤17
Mildly Thin(>17<18.5)
Total Thin(≤18.5)
TotalOverweight
(≥25)
Overweight(>25<30) Obese (≥30)
Waste pickers2015/16
(Chi-squarep < 0.001)
Male(n = 110) 10 (4.6%) 26 (11.9%) 36 (16.5%) 19 (8.7%) 16 (7.3%) 3 (1.4%)
Female(n = 190) 3 (1.8%) 8 (4.8%) 11 (6.7%) 84 (50.9%) 38 (23.0%) 46 (27.9%)
TOTAL(n = 300) 13 (3.4%) 34 (8.9%) 47 (12.2%) 103 (26.9%) 54 (14.1%) 49 (12.8%)
SADHS 2016 *
Lowest wealthquantile # Male
2.9% 7.0% 9.9% 17.4% 14.1% 3.3%
Total 2.1% 7.4% 9.5% 31.3% 20.3% 11.0%
Lowest wealthquantile # Female
0.6% 2.4% 3.0% 57.3% 27.8% 29.5%
Total 0.5% 2.1% 2.6% 67.7% 26.6% 41.0%
* South African Demographic and Health Survey, 2016 [26]. # The wealth quantile was based on a wealth indexthat scores households on the number and kinds of consumer goods owned using principal component analyses.Lowest wealth quantile represents 20% of SADHS 2016 [26] population that has fewest assets including those oflowest value.
3.3. Dietary Intake3.3.1. Energy Intake
The mean daily energy intake, further described in Table 2, was 5664.1 kJ for femaleparticipants and 7408.3 kJ for males. These intakes were below the DRI and met 75% and80% of the daily requirements respectively. The daily energy intake reported by participantsvaried from 110.4 kJ to 26,147 kJ.
3.3.2. Macronutrient Intake and Distribution
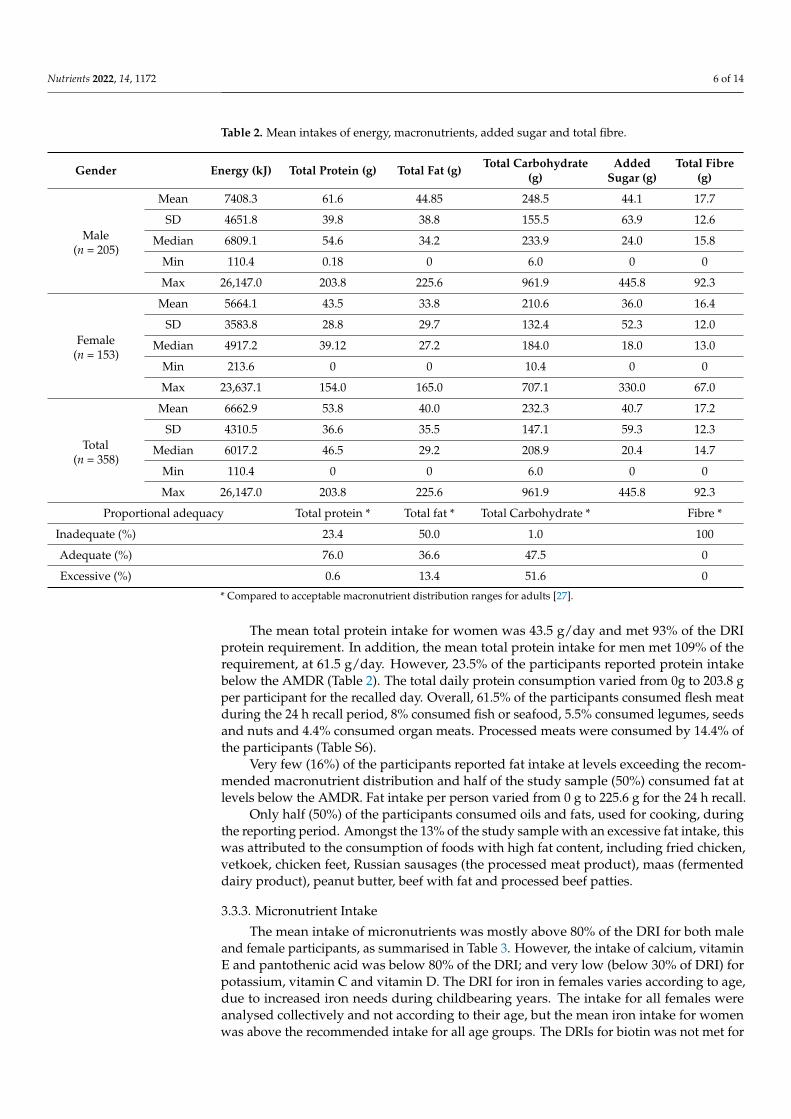
The proportional adequacy of macronutrient and fibre intake is summarised in Table 2.The mean carbohydrate intake was 248.6 g/day for males and 210.6 g/day for females,contributing 191% and 162% of the minimum recommended intake respectively. Themean carbohydrate intake of the majority (51.6%) of participants contributed more than65% of the total daily energy intake. A higher percentage of women (63.2%) consumedcarbohydrates at levels above the acceptable macronutrient distribution range (AMDR),compared to 42.7% of men. Overall, the daily carbohydrate intake varied from 6.0 g to961.9 g per participant. Carbohydrates were mostly consumed as foods from the cereal andwhite roots and tubers groups, while 69.5% of the participants also consumed foods fromthe sweets group (Tables S4 and S5) which includes sugar, sugar-sweetened beverages,sweetened fruit juice and sugary foods such as candies, cookies and cake. The mean intakeof added sugar was 40.7 g overall and 44.1 g and 36.0 g for males and females respectivelywith 42.2% consuming more than 25 g per day. More men (26.9%) had an excessive intakeof added sugar compared to women (15.3%). Overall, 38.5% of the participants consumedsugar-sweetened beverages, with intake ranging from 2 to 7 L per person amongst thoseindividuals, while only 0.6% consumed fruit juice. A small proportion of the participants(7.2%) reported having consumed alcohol in the recall period, which contributed to theirtotal carbohydrate intake.
Nutrients 2022, 14, 1172 6 of 14
Table 2. Mean intakes of energy, macronutrients, added sugar and total fibre.
Gender Energy (kJ) Total Protein (g) Total Fat (g) Total Carbohydrate(g)
AddedSugar (g)
Total Fibre(g)
Male(n = 205)
Mean 7408.3 61.6 44.85 248.5 44.1 17.7
SD 4651.8 39.8 38.8 155.5 63.9 12.6
Median 6809.1 54.6 34.2 233.9 24.0 15.8
Min 110.4 0.18 0 6.0 0 0
Max 26,147.0 203.8 225.6 961.9 445.8 92.3
Female(n = 153)
Mean 5664.1 43.5 33.8 210.6 36.0 16.4
SD 3583.8 28.8 29.7 132.4 52.3 12.0
Median 4917.2 39.12 27.2 184.0 18.0 13.0
Min 213.6 0 0 10.4 0 0
Max 23,637.1 154.0 165.0 707.1 330.0 67.0
Total(n = 358)
Mean 6662.9 53.8 40.0 232.3 40.7 17.2
SD 4310.5 36.6 35.5 147.1 59.3 12.3
Median 6017.2 46.5 29.2 208.9 20.4 14.7
Min 110.4 0 0 6.0 0 0
Max 26,147.0 203.8 225.6 961.9 445.8 92.3
Proportional adequacy Total protein * Total fat * Total Carbohydrate * Fibre *
Inadequate (%) 23.4 50.0 1.0 100
Adequate (%) 76.0 36.6 47.5 0
Excessive (%) 0.6 13.4 51.6 0
* Compared to acceptable macronutrient distribution ranges for adults [27].
The mean total protein intake for women was 43.5 g/day and met 93% of the DRIprotein requirement. In addition, the mean total protein intake for men met 109% of therequirement, at 61.5 g/day. However, 23.5% of the participants reported protein intakebelow the AMDR (Table 2). The total daily protein consumption varied from 0g to 203.8 gper participant for the recalled day. Overall, 61.5% of the participants consumed flesh meatduring the 24 h recall period, 8% consumed fish or seafood, 5.5% consumed legumes, seedsand nuts and 4.4% consumed organ meats. Processed meats were consumed by 14.4% ofthe participants (Table S6).
Very few (16%) of the participants reported fat intake at levels exceeding the recom-mended macronutrient distribution and half of the study sample (50%) consumed fat atlevels below the AMDR. Fat intake per person varied from 0 g to 225.6 g for the 24 h recall.
Only half (50%) of the participants consumed oils and fats, used for cooking, duringthe reporting period. Amongst the 13% of the study sample with an excessive fat intake, thiswas attributed to the consumption of foods with high fat content, including fried chicken,vetkoek, chicken feet, Russian sausages (the processed meat product), maas (fermenteddairy product), peanut butter, beef with fat and processed beef patties.
3.3.3. Micronutrient Intake
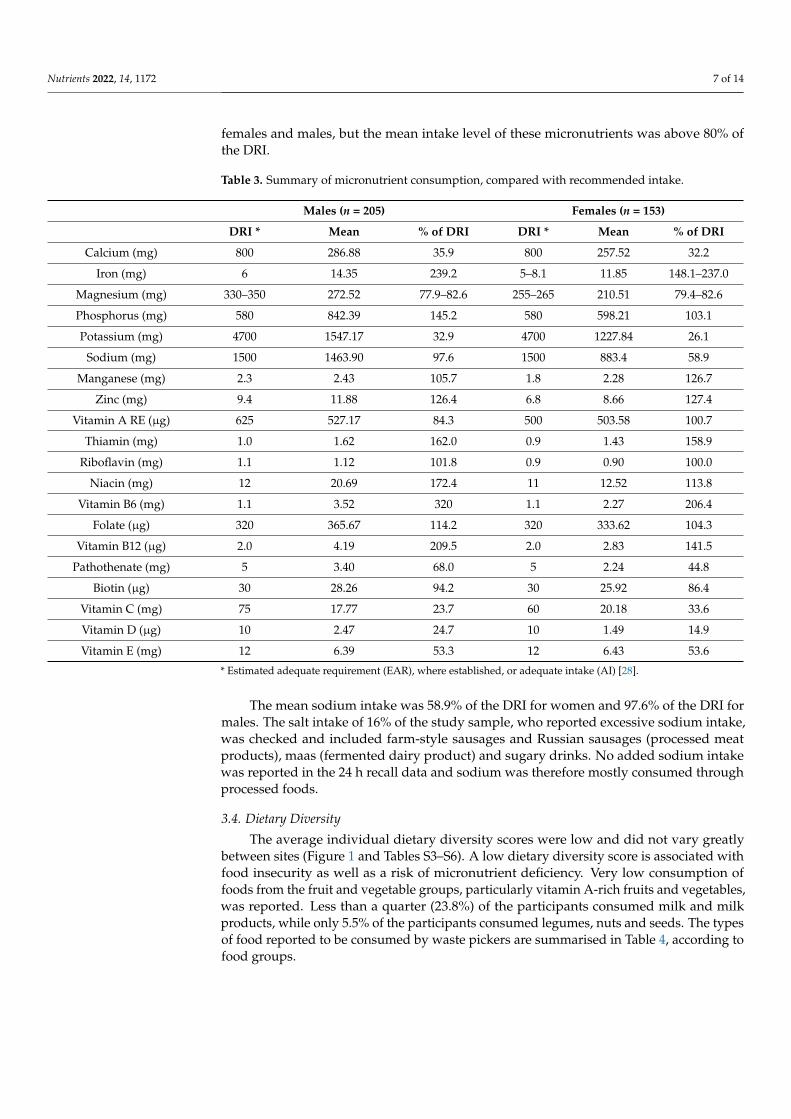
The mean intake of micronutrients was mostly above 80% of the DRI for both maleand female participants, as summarised in Table 3. However, the intake of calcium, vitaminE and pantothenic acid was below 80% of the DRI; and very low (below 30% of DRI) forpotassium, vitamin C and vitamin D. The DRI for iron in females varies according to age,due to increased iron needs during childbearing years. The intake for all females wereanalysed collectively and not according to their age, but the mean iron intake for womenwas above the recommended intake for all age groups. The DRIs for biotin was not met for
Nutrients 2022, 14, 1172 7 of 14
females and males, but the mean intake level of these micronutrients was above 80% ofthe DRI.
Table 3. Summary of micronutrient consumption, compared with recommended intake.
Males (n = 205) Females (n = 153)
DRI * Mean % of DRI DRI * Mean % of DRI
Calcium (mg) 800 286.88 35.9 800 257.52 32.2
Iron (mg) 6 14.35 239.2 5–8.1 11.85 148.1–237.0
Magnesium (mg) 330–350 272.52 77.9–82.6 255–265 210.51 79.4–82.6
Phosphorus (mg) 580 842.39 145.2 580 598.21 103.1
Potassium (mg) 4700 1547.17 32.9 4700 1227.84 26.1
Sodium (mg) 1500 1463.90 97.6 1500 883.4 58.9
Manganese (mg) 2.3 2.43 105.7 1.8 2.28 126.7
Zinc (mg) 9.4 11.88 126.4 6.8 8.66 127.4
Vitamin A RE (µg) 625 527.17 84.3 500 503.58 100.7
Thiamin (mg) 1.0 1.62 162.0 0.9 1.43 158.9
Riboflavin (mg) 1.1 1.12 101.8 0.9 0.90 100.0
Niacin (mg) 12 20.69 172.4 11 12.52 113.8
Vitamin B6 (mg) 1.1 3.52 320 1.1 2.27 206.4
Folate (µg) 320 365.67 114.2 320 333.62 104.3
Vitamin B12 (µg) 2.0 4.19 209.5 2.0 2.83 141.5
Pathothenate (mg) 5 3.40 68.0 5 2.24 44.8
Biotin (µg) 30 28.26 94.2 30 25.92 86.4
Vitamin C (mg) 75 17.77 23.7 60 20.18 33.6
Vitamin D (µg) 10 2.47 24.7 10 1.49 14.9
Vitamin E (mg) 12 6.39 53.3 12 6.43 53.6
* Estimated adequate requirement (EAR), where established, or adequate intake (AI) [28].
The mean sodium intake was 58.9% of the DRI for women and 97.6% of the DRI formales. The salt intake of 16% of the study sample, who reported excessive sodium intake,was checked and included farm-style sausages and Russian sausages (processed meatproducts), maas (fermented dairy product) and sugary drinks. No added sodium intakewas reported in the 24 h recall data and sodium was therefore mostly consumed throughprocessed foods.
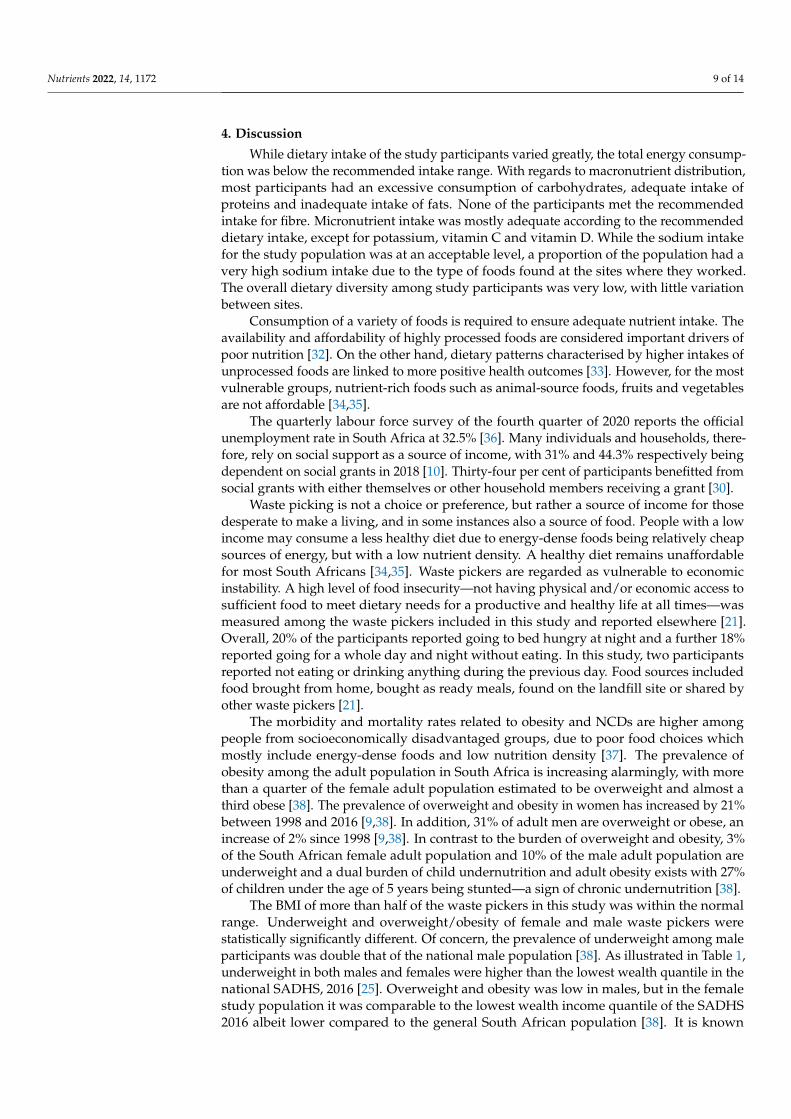
3.4. Dietary Diversity
The average individual dietary diversity scores were low and did not vary greatlybetween sites (Figure 1 and Tables S3–S6). A low dietary diversity score is associated withfood insecurity as well as a risk of micronutrient deficiency. Very low consumption offoods from the fruit and vegetable groups, particularly vitamin A-rich fruits and vegetables,was reported. Less than a quarter (23.8%) of the participants consumed milk and milkproducts, while only 5.5% of the participants consumed legumes, nuts and seeds. The typesof food reported to be consumed by waste pickers are summarised in Table 4, according tofood groups.

Nutrients 2022, 14, 1172 8 of 14
Nutrients 2022, 14, x FOR PEER REVIEW 8 of 14
scone, sorghum porridge, vetkoek (fried dough), Weet-Bix, wholegrain breakfast cereal
White roots and tubers Potato, sweet potato Vitamin A rich vegetables and
tubers Carrot, pumpkin
Vitamin A rich fruits None Dark green leafy vegetables Amaranth leaves, broccoli, cabbage, Swiss chard
Other vegetables Beetroot, garlic, lettuce, mixed vegetables, onion, sweet pepper, tomato
Other fruits Apple, banana, grape, lemon, pear
Organ meat Beef liver, chicken feet, chicken giblets, chicken head, sheep liver
Flesh meats Bacon, beef, beef patty, beef sausage, chicken, mutton, ostrich, polony, pork, salami, turkey, vienna sausage
Fish and seafood Fish, pilchards Eggs Egg
Legumes, nuts and seeds Beans, peanuts, soya mince Milk and milk products Cheese, cheese spread, milk, yogurt
Oils and fats Canola oil, margarine, mayonnaise, nondairy creamer, peanut butter, sunflower oil
Sweets
Carbonated cold drink, chocolate, chocolate coated bar, cold drink squash, condensed milk, dairy fruit juice mix, jam, glucose drink, sweets, sweetened orange juice, sugar
Spices, condiments and bever-ages
BBQ sauce, beer, Bovril (meat extract paste), coffee, curry sauce, fruit chutney, gravy, instant soup, mango achar, Rooibos tea, sorghum beer, soup powder, spirits, tomato sauce, tea, vinegar, wine
Figure 1. Box plot of dietary diversity scores per site. Sites 1, 3 and 7 were in urban areas. All other sites were in rural areas.
4. Discussion
Figure 1. Box plot of dietary diversity scores per site. Sites 1, 3 and 7 were in urban areas. All othersites were in rural areas.
Table 4. Summary of types of food consumed by waste pickers, according to food groups.
Food Groups Types of Foods Reported to be Consumed by Waste Pickers
CerealsBread, breakfast cereal, hot cross bun, maize porridge, oats porridge, pasta, pizza,rice, samp (split white corn), scone, sorghum porridge, vetkoek (fried dough),Weet-Bix, wholegrain breakfast cereal
White roots and tubers Potato, sweet potato
Vitamin A rich vegetables and tubers Carrot, pumpkin
Vitamin A rich fruits None
Dark green leafy vegetables Amaranth leaves, broccoli, cabbage, Swiss chard
Other vegetables Beetroot, garlic, lettuce, mixed vegetables, onion, sweet pepper, tomato
Other fruits Apple, banana, grape, lemon, pear
Organ meat Beef liver, chicken feet, chicken giblets, chicken head, sheep liver
Flesh meats Bacon, beef, beef patty, beef sausage, chicken, mutton, ostrich, polony, pork,salami, turkey, vienna sausage
Fish and seafood Fish, pilchards
Eggs Egg
Legumes, nuts and seeds Beans, peanuts, soya mince
Milk and milk products Cheese, cheese spread, milk, yogurt
Oils and fats Canola oil, margarine, mayonnaise, nondairy creamer, peanut butter, sunflower oil
SweetsCarbonated cold drink, chocolate, chocolate coated bar, cold drink squash,condensed milk, dairy fruit juice mix, jam, glucose drink, sweets, sweetenedorange juice, sugar
Spices, condiments and beveragesBBQ sauce, beer, Bovril (meat extract paste), coffee, curry sauce, fruit chutney,gravy, instant soup, mango achar, Rooibos tea, sorghum beer, soup powder, spirits,tomato sauce, tea, vinegar, wine
Nutrients 2022, 14, 1172 9 of 14
4. Discussion
While dietary intake of the study participants varied greatly, the total energy consump-tion was below the recommended intake range. With regards to macronutrient distribution,most participants had an excessive consumption of carbohydrates, adequate intake ofproteins and inadequate intake of fats. None of the participants met the recommendedintake for fibre. Micronutrient intake was mostly adequate according to the recommendeddietary intake, except for potassium, vitamin C and vitamin D. While the sodium intakefor the study population was at an acceptable level, a proportion of the population had avery high sodium intake due to the type of foods found at the sites where they worked.The overall dietary diversity among study participants was very low, with little variationbetween sites.
Consumption of a variety of foods is required to ensure adequate nutrient intake. Theavailability and affordability of highly processed foods are considered important drivers ofpoor nutrition [32]. On the other hand, dietary patterns characterised by higher intakes ofunprocessed foods are linked to more positive health outcomes [33]. However, for the mostvulnerable groups, nutrient-rich foods such as animal-source foods, fruits and vegetablesare not affordable [34,35].
The quarterly labour force survey of the fourth quarter of 2020 reports the officialunemployment rate in South Africa at 32.5% [36]. Many individuals and households, there-fore, rely on social support as a source of income, with 31% and 44.3% respectively beingdependent on social grants in 2018 [10]. Thirty-four per cent of participants benefitted fromsocial grants with either themselves or other household members receiving a grant [30].
Waste picking is not a choice or preference, but rather a source of income for thosedesperate to make a living, and in some instances also a source of food. People with a lowincome may consume a less healthy diet due to energy-dense foods being relatively cheapsources of energy, but with a low nutrient density. A healthy diet remains unaffordablefor most South Africans [34,35]. Waste pickers are regarded as vulnerable to economicinstability. A high level of food insecurity—not having physical and/or economic access tosufficient food to meet dietary needs for a productive and healthy life at all times—wasmeasured among the waste pickers included in this study and reported elsewhere [21].Overall, 20% of the participants reported going to bed hungry at night and a further 18%reported going for a whole day and night without eating. In this study, two participantsreported not eating or drinking anything during the previous day. Food sources includedfood brought from home, bought as ready meals, found on the landfill site or shared byother waste pickers [21].
The morbidity and mortality rates related to obesity and NCDs are higher amongpeople from socioeconomically disadvantaged groups, due to poor food choices whichmostly include energy-dense foods and low nutrition density [37]. The prevalence ofobesity among the adult population in South Africa is increasing alarmingly, with morethan a quarter of the female adult population estimated to be overweight and almost athird obese [38]. The prevalence of overweight and obesity in women has increased by 21%between 1998 and 2016 [9,38]. In addition, 31% of adult men are overweight or obese, anincrease of 2% since 1998 [9,38]. In contrast to the burden of overweight and obesity, 3%of the South African female adult population and 10% of the male adult population areunderweight and a dual burden of child undernutrition and adult obesity exists with 27%of children under the age of 5 years being stunted—a sign of chronic undernutrition [38].
The BMI of more than half of the waste pickers in this study was within the normalrange. Underweight and overweight/obesity of female and male waste pickers werestatistically significantly different. Of concern, the prevalence of underweight among maleparticipants was double that of the national male population [38]. As illustrated in Table 1,underweight in both males and females were higher than the lowest wealth quantile in thenational SADHS, 2016 [25]. Overweight and obesity was low in males, but in the femalestudy population it was comparable to the lowest wealth income quantile of the SADHS2016 albeit lower compared to the general South African population [38]. It is known
Nutrients 2022, 14, 1172 10 of 14
that the prevalence of overweight and obesity varies among different population groupsand the severity of obesity increases with increasing wealth [38], although overweightand obesity is very high in South African females regardless of wealth quantile. Thelower prevalence of overweight and obesity among the study population, compared to thenational population is therefore potentially attributed to their socioeconomic status. Theprevalence of overweight and obesity however remains a concern, due to the associationwith NCDs, the leading cause of death in South Africa [2]. Access to public health servicesfor NCD related treatment for waste pickers may be limited especially given the highopportunity cost as their daily survival is based on their engagement at the landfill sites atcritical times of waste deposits.
Representing the leading cause of mortality worldwide (71% of all deaths), the preva-lence of NCD multimorbidity is exploding in low- and middle-income countries, andsubstantially increasing in sub-Saharan Africa, particularly among lower socioeconomicgroups and obese persons [9–11]. A large study (n = 1025) amongst waste pickers in thelargest dumpsite in Latin America found 32.6% to be overweight and 21.1% obese, witha 24.2% prevalence of hypertension 24.2% and 10.1% of diabetes [39]. Another studyfrom Brazil established that 29.5% of 253 male-dominant (86.2%) pushcart waste pickersin the city of Santos were overweight or obese [40]. Auler et al. (2014) reported a muchhigher prevalence of overweight (51.1%) and obesity (25.7%) with hypertension (32.8%)and diabetes (11.4%) among 268 waste pickers in southern Brazil [41].
In the absence of national data on the dietary intake of adult South Africans, a recentreview of dietary surveys in the adult South African population from 2000 to 2015 [42]concluded that energy intake varied from low intakes in informal settlements to very highintakes in urban centres. Macronutrient intake varied similarly to energy intakes but remainwithin acceptable minimum distribution ranges [42]. Overall, food consumption patterns inthe country have dramatically shifted towards a concerning overall increase in daily energyintake, a diet of sugar-sweetened beverages, an increase in the proportion of processedfoods and animal source foods, added sugar and a shift away from vegetables [43].
Many low-income households consume monotonous, low-quality diets, typicallycereal-based and lacking in vegetables, fruit and animal-source foods [44]. Monotonousdiets and a lack of dietary diversity is closely associated with food insecurity [45]. The riskof micronutrient deficiencies also increases when dietary diversity is low [46] although itshould be noted that mandatory fortification of maize meal, wheat flour and bread [47]is assumed to have contributed to the micronutrient content of diets of the waste pickers.Dietary diversity is a proxy for nutrient adequacy [29]. National food diversity wasevaluated in 2009 as a proxy for food security, with a dietary diversity score below 4regarded to reflect poor dietary diversity and poor food security [48]. Overall, a nationallevel dietary diversity score of 4.02 reflects that the majority of South Africans consumeda diet low in dietary variety, albeit with significant provincial differences. Low dietarydiversity correlated with socioeconomic status, lower-income groups having the lowestdietary diversity score of 2.93 [48]. At 2.465, the average dietary diversity score of wastepickers included in this study is lower than the average score of low-income groups in thenational evaluation; implying that waste pickers are at explicit risk of food insecurity andmicronutrient deficiencies due to inadequate diets.
Food groups most commonly consumed, according to the evaluation of nationaldietary diversity [48], included starchy staples, meat and fish, dairy and vegetables otherthan vitamin A rich food. Eggs, legumes and vitamin A-rich fruits and vegetable were theleast consumed among the national population. Similarly, the most commonly deficientfood groups observed in a recent review of dietary surveys in South Africa includedvegetables and fruits, and milk and milk products [42]. Based on reported intake overthe past 24 h, 49% and 59% of participants in the 2016 Demographic and Health Surveyreported consuming fruit and vegetables respectively, with variations between populationgroups and according to income status [38]. It is a global trend for low-income householdsto spend less on fresh produce than higher-income households [49]. Of further concern,
Nutrients 2022, 14, 1172 11 of 14
the consumption of fresh vegetables in South Africa declined whilst consumption of ultra-processed foods increased dramatically between 1994 and 2012 [43].
Fruit and vegetable consumption amongst waste pickers in this study is much lowerthan the reported national consumption and confirms that these foods are not accessibleand/or affordable to socially vulnerable populations. A low intake of fruits and vegetablesare of particular concern in relation to micronutrient deficiencies. Meat was the food mostcommonly collected on landfill sites [21]. This would explain why most of the waste pickersconsumed foods from the meat and fish group, contrary to what would be expected dueto their socioeconomic status as it was sometimes obtained from the sites and not boughtwith household income. The variation in overall dietary intake among waste pickers in thisstudy is likely an indication of varied access to food retrieved from the landfill site.
Frequent consumption of food products not beneficial to health, such as sugary drinks,is of concern. According to the 2016 South African Demographic Health Survey [38], 36% ofparticipants reported drinking any sugar-sweetened beverage (607 mL on average) and 14%reported drinking fruit juice (304 mL on average). A similar proportion of waste pickers inthis study reported consuming sweetened beverages. The absence of access to water on thelandfill sites [30] may be contributing to the consumption of sugary beverages.
With food production, processing and marketing being driven by profit, ultraprocessedfood is becoming increasingly available and affordable [50]. At the same time, food securityand the nutritional status of the most vulnerable population groups are likely to deterioratefurther due to the health and socioeconomic impacts of the COVID-19 pandemic [44].In South Africa, it is estimated that 9.34 million people faced high levels of acute foodinsecurity by the end of 2020 with projections of a further increase with regards to thenumber of people affected.
Particular attention should be paid, through policy interventions, to curb increasingfood prices and the energy cost of food preparation. Access to and the affordability ofnutrient-dense foods, by the most vulnerable and marginalised populations, includingwaste pickers as a particularly vulnerable group, should be improved. This may include, butare not limited to, policies to make healthy food options more affordable with considerationof a subsidy for the vulnerable, increased targeted social protection including food relief,and an extension of the health promotion levy to tax other unhealthy food items.
4.1. Significance for Public Health
Waste pickers are an extremely vulnerable population from an occupational healthperspective [31]. In addition, their precarious income generation and fierce relative compe-tition for “spots” on landfill sites to seek out a livelihood compromise their health seekingbehaviour, yet they contribute to reduction of waste to landfill sites and environmentalsustainability. Knowledge and understanding of the lived realities of waste pickers shouldguide service delivery planning by community nutrition and public health practitioners.Targeted service delivery to this vulnerable population could include the provision ofhealth screening, primary health care and chronic care through mobile outreach services.In addition, a coordinated approach to extend service delivery to include aspects of socialservices will go a long way to improve their lives. These extended services could includeapplying for identity documents to allow the opportunity to access social grants, andregistration on the indigent programme for free basic services such as water and electricity.The rendering of services to this population should be planned and executed with sensitiv-ity and understanding of their unique working (and often also living) conditions. Wastepickers cannot afford the opportunity cost of not working for a day.
4.2. Limitations
Reported dietary intake is subject to bias caused by systematic underreporting, over-reporting or omission of foods by an individual during the interviewing process. Theconvenience sample approach, including all participants available on the day and willingto participate, may introduce sample selection bias. It was not feasible to repeat the dietary
Nutrients 2022, 14, 1172 12 of 14
intake assessment as the informal and fluid nature of the setting made it difficult to locatethe respondents. The findings from this study are not regarded as representative of othersettings.
Supplementary Materials: The following supporting information can be downloaded at: https://www.mdpi.com/article/10.3390/nu14061172/s1, Table S1: Missing values per landfill site; Table S2:Body mass index of participants; Table S3: Body mass index classification according to landfill site;Table S4: Summary of food consumption per site by food group; Table S5: Consumption of food andbeverages that are not part of a healthy eating plan; Table S6: Average individual dietary diversityscore per site.
Author Contributions: E.C.S., C.J.S., F.B. and J.M.M.V.; conceptualised the study. E.C.S., J.W. andM.v.d.M.; prepared the first draft. All authors have read and agreed to the published version of themanuscript.
Funding: This research/study was made possible thanks to funding by the DSI-NRF Centre ofExcellence in Food Security (UID 91490), South Africa Project number 140504.
Institutional Review Board Statement: The Senate Research Ethics Committee of the University ofthe Western Cape provided ethics approval for the study (reference number 15/4/24).
Informed Consent Statement: The information sheet advised potential participants that a report orarticle may be written on the findings of the research, and that the authors will ensure that theiridentity will not be disclosed in such event. After receiving information on the process and purposeof the research, participants completed written consent to confirm voluntary participation. Illiterateparticipants gave verbal consent in the presence of a third person as a witness. Consent forms andinformation sheets were translated in the most spoken languages and explained in the language bestunderstood by the participant. The manuscript does not contain any individual person’s data inany form.
Data Availability Statement: The anonymised datasets used and analysed during the current studyare available from the corresponding author on reasonable request.
Acknowledgments: We thank Ria Laubscher, South African Medical Research Council, and EbenGerryts, for their assistance with analyses.
Conflicts of Interest: The funders had no role in the design of the study; in the collection, analyses,or interpretation of data; in the writing of the manuscript, or in the decision to publish the results.
References1. Statistics South Africa. Mid-Year Population Estimates 2020; Statistical Release P0302 [Internet]; Statistics South Africa: Pretoria,
South Africa, 2020. Available online: http://www.statssa.gov.za/publications/P0302/P03022020.pdf (accessed on 4 April 2021).2. Pillay-van Wyk, V.; Msemburi, W.; Laubscher, R.; Dorrington, R.E.; Groenewald, P.; Glass, T.; Bradshaw, D. Mortality trends and
differentials in South Africa from 1997 to 2012: Second National Burden of Disease Study. Lancet Glob. Health 2016, 4, e642–e653.[CrossRef]
3. World Bank. Overcoming Poverty and Inequality in South Africa—An Assessment of Drivers, Constraints and Opportunities OvercomingPoverty and Inequality in South Africa; World Bank: Washington, DC, USA, 2018.
4. Ataguba, J.E.; Akazili, J.; McIntyre, D. Socioeconomic-related health inequality in South Africa: Evidence from General HouseholdSurveys. Int. J. Equity Health 2011, 10, 48. [CrossRef]
5. World Health Organization. Noncommunicable Diseases Progress Monitor 2020; World Health Organization: Geneva, Switzerland,2020.
6. Bigna, J.J.; Noubiap, J.J. The Rising Burden of Non-Communicable Diseases in Sub-Saharan Africa; The Lancet Global Health; ElsevierLtd.: London, UK, 2019; Volume 7, pp. e1295–e1296.
7. Gouda, H.N.; Charlson, F.; Sorsdahl, K.; Ahmadzada, S.; Ferrari, A.J.; Erskine, H.; Leung, J.; Santamauro, D.; Lund, C.; Aminde,L.N.; et al. Burden of non-communicable diseases in sub-Saharan Africa, 1990–2017: Results from the Global Burden of DiseaseStudy 2017. Lancet Glob. Health 2019, 7, e1375–e1387. [CrossRef]
8. Statistics South Africa. Mortality and Causes of Death in South Africa, 2016: Findings from Death Notification; Statistics South Africa:Pretoria, South Africa, 2016.
9. Shisana, O.; Labadarios, D.; Rehle, T.; Simbayi, L.; Zuma, K.; Dhansay, A.; Reddy, P.; Parker, W.; Hoosain, E.; Naidoo, P.; et al. TheSouth African National Health and Nutrition Examination Survey, 2012 (SANHANES-1); HSRC Press: Cape Town, South Africa, 2014.
10. Statistics South Africa. General Household Survey 2018; Statistics South Africa: Pretoria, South Africa, 2018.

Nutrients 2022, 14, 1172 13 of 14
11. Jain, R.; Budlender, J.; Zizzamia, R. The Labour Market and Poverty Impacts of COVID-19 in South Africa; SALDRU Working PaperNo. 264; SALDRU, UCT: Cape Town, South Africa, 2020.
12. Van der Berg, S.; Zuze, L.; Bridgman, G. The Impact of the Coronavirus and Lockdown on Children’s Welfare in South Africa Evidencefrom NIDS-CRAM Wave 1; NIDS-CRAM Policy Brief 11; Stellenbosch University, Department of Economics: Stellenbosch, SouthAfrica, 2020.
13. Mote, B.N.; Kadam, S.B.; Kalaskar, S.K.; Thakare, B.S.; Adhav, A.S.; Muthuvel, T. Occupational and environmental health hazards(physical & mental) among rag-pickers in Mumbai slums: A cross-sectional study. Sci. J. Public Health 2016, 4, 1–10.
14. Oelofse, S.; Polasi, T.; Haywood, L.; Musvoto, C. Increasing Reliable, Scientific Data and Information on Food Losses and Waste inSouth Africa; CSIR: Pretoria, South Africa, 2021; Available online: https://wasteroadmap.co.za/wp-content/uploads/2021/06/17-CSIR-Final_Technical-report_Food-waste.pdf (accessed on 19 September 2021).
15. Waste Pickers | WIEGO [Internet]. Women in Informal Employment: Globalizing and Organizing. Available online: https://www.wiego.org/informal-economy/occupational-groups/waste-pickers (accessed on 12 April 2021).
16. Qotole, M.; Xali, M.; Barchiesi, F. The Commercialisation of Waste Management in South Africa [Internet]. Occasional. McDonald,D.A., Bond, P., Eds.; Municipal Services Project. 2001. Available online: www.queensu.ca/msp (accessed on 12 April 2021).
17. Schenck, R.; Blaauw, P.F. The work and lives of street waste pickers in Pretoria—A case study of recycling in South Africa’s urbaninformal economy. Urban Forum. 2011, 22, 411–430. [CrossRef]
18. Godfrey, L.; Oelofse, S. Historical review of waste management and recycling in South Africa. Resources 2017, 6, 57. [CrossRef]19. Samson, M.; Timm, M.; Chidzungu, S.; Dladla, T.; Kadyamadare, N.; Maema, G. Lessons from Waste Picker Integration Initiatives:
Development of Evidence Based Guidelines to Integrate Waste Pickers into South African Municipal Waste Management Systems; FinalTechnical Report: Johannesburg Case Study; DEFF and DST: Pretoria, South Africa, 2020.
20. Farber, T. Meet the Bin Scavengers Saving SA R750-Million a Year [Internet]. Times Live. 2016. Available online: https://www.timeslive.co.za/sunday-times/news/2016-05-08-meet-the-bin-scavengers-saving-sa-r750-million-a-year/ (accessed on13 April 2021).
21. Schenck, C.J.; Blaauw, P.F.; Viljoen, J.M.; Swart, E.C. Social work and food security: Case study on the nutritional capabilities ofthe landfill waste pickers in South Africa. Int. Soc. Work 2018, 61, 571–586. [CrossRef]
22. Statistics South Africa. National Poverty Lines 2020; Statistical Release P0310.1; Statistics South Afric: Pretoria, South Africa, 2020.23. Harrisberg, K. How Are We Meant to Eat? A South African Waste Picker on Life under Lockdown [Internet]. Thomson Reuters
Foundation News, 2020. Available online: https://news.trust.org/item/20200407102057-bcmya/?fbclid=IwAR1zi_Lj-KoMrgbhGt3FgKKenVUqJ2sWkl6GtjsxxD6Q3k_qr4LTtjA4OGk (accessed on 7 April 2021).
24. Faber, M.; Kunneke, E.; Wentzel-Viljoen, E.; Wenhold, F. Dietary Intake Assessment–24 Hour Recall. Centre of Excellence in FoodSecurity; DST-NRF Centre of Excellence in Food Security/South African Medical Research Council: Cape Town, South Africa,2016.
25. World Health Organization; Body Mass Index-BMI [Internet]. Available online: http://www.euro.who.int/en/health-topics/disease-prevention/nutrition/a-healthy-lifestyle/body-mass-index-bmi (accessed on 17 May 2021).
26. Statistics South Africa. South African Demographic and Health Survey 2016: Key Indicators Report; Statistics South Africa: Pretoria,South Africa, 2017.
27. Institute of Medicine. Dietary Reference Intakes for Energy, Carbohydrates, Fiber, Fat, Fatty Adds, Cholesterol, Protein, and Amino Acids;National Academies Press: Washington, DC, USA, 2005.
28. Dietary Reference Intakes (DRIs): Recommended Dietary Allowances and Adequate Intakes, Vitamins. Food and NutritionBoard, Institute of Medicine, National Academies [Internet]. Available online: https://www.ncbi.nlm.nih.gov/books/NBK56068/table/summarytables.t2/?report=objectonly (accessed on 21 June 2021).
29. Food and Agriculture Organization of the United Nations. Guidelines for Measuring Household and Individual Dietary Diversity;Kennedy, G., Ballard, T., Dop, M., Eds.; Food and Agriculture Organization of the United Nations: Rome, Italy, 2013.
30. Schenck, C.J.; Blaauw, P.F.; Swart, E.C.; Viljoen, J.M.M.; Mudavanhu, N. The management of South Africa’s landfills and wastepickers on them: Impacting lives and livelihoods. Dev. S. Afr. 2019, 36, 80–98. [CrossRef]
31. Schenck, C.J.; Blaauw, P.F.; Viljoen, J.M.M.; Swart, E.C. Exploring the potential health risks faced by waste pickers on landfills inSouth Africa: A socio-ecological perspective. Int. J. Environ. Res. Public Health 2019, 16, 2059. [CrossRef] [PubMed]
32. Popkin, B.M.; Adair, L.S.; Ng, S.W. The global nutrition transition and the pandemic of obesity in developing countries. Nutr. Rev.2012, 70, 3–21. [CrossRef]
33. Wrottesley, S.V.; Pisa, P.T.; Norris, S.A. The influence of maternal dietary patterns on body mass index and gestational weightgain in urban black South African women. Nutrients 2017, 9, 732. [CrossRef] [PubMed]
34. Temple, N.J.; Steyn, N.P. The cost of a healthy diet: A South African perspective. Nutrition 2011, 27, 505–508. [CrossRef]35. Vermeulen, H. A Balanced Food Basked Approach to Monitor Food Affordability in South Africa. Ph.D. Nutrition. 2020. Available
online: https://repository.up.ac.za/bitstream/handle/2263/73175/Vermeulen_Balanced_2020.pdf?sequence=1&isAllowed=y(accessed on 19 September 2021).
36. Statistics South Africa. Quarterly Labour Force Survey. Quarter 4: 2020; Statistical Release P0211; Statistics South Africa: Pretoria,South Africa, 2021.
37. Moreira, P.A.; Padra, P.D. Educational and economic determinants of food intake in Portuguese adults: A cross-sectional survey.BMC Public Health 2004, 4, 58. [CrossRef] [PubMed]

Nutrients 2022, 14, 1172 14 of 14
38. South African National Department of Health. South Africa Demographic Health Survey 2016; Department of Health, South Africa;Statistics South Africa; South African Medical Research Council: Pretoria, South Africa, 2019.
39. Resende Nogueira Cruvinel, V.; Pintas Marques, C.; Cardoso, V.; Rita Carvalho Garbi Novaes, M.; Navegantes Araújo, W.;Angulo-Tuesta, A.; Escalda, P.M.F.; Galato, D.; Brito, P.; da Silva, E.N.; et al. Health conditions and occupational risks in a novelgroup: Waste pickers in the largest open garbage dump in Latin America. BMC Public Health 2019, 19, 581.
40. Rozman, M.A.; de Ezevedo, C.H.; de Jesus, R.R.C.; Filho, R.M.; Junior, V.P. Anemia in recyclable waste pickers using humandriven pushcarts in the city of Santos, southeastern Brazil. Braz. J. Epidemiol. 2010, 13, 326–336.
41. Auler, F.; Nakashima, A.T.A.; Cuman, R.K.N. Health conditions of recyclable waste pickers. J. Community Health 2014, 39, 17–22.[CrossRef] [PubMed]
42. Mchiza, Z.J.; Steyn, N.P.; Hill, I.; Kruger, A.; Schönfeldt, H.; Nel, J.; Wentzel-Viljoen, E. A review of dietary surveys in the adultSouth African population from 2000 to 2015. Nutrients 2015, 7, 8227–8250. [CrossRef]
43. Ronquest-Ross, L.C.; Vink, N.; Sigge, G.O. Food consumption changes in South Africa since 1994. S. Afr. J. Sci. 2015, 111, 12.[CrossRef]
44. FAO; IFAD; UNICEF; WFP; WHO. The State of Food Security and Nutrition in the World 2020. Transforming Food Systems for AffordableHealthy Diets; FAO: Rome, Italy, 2020.
45. Faber, M.; Schwabe, C.; Drimie, S. Dietary diversity in relation to other household food security indicators. Int. J. Food Saf. Nutr.Public Health 2009, 2, 1–15. [CrossRef]
46. Chakona, G.; Shackleton, C. Minimum Dietary Diversity Scores for Women Indicate Micronutrient Adequacy and Food InsecurityStatus in South African Towns. Nutrients 2017, 9, 812. [CrossRef]
47. Friesen, V.M.; Mbuya, M.N.N.; Aaron, G.J.; Pachón, H.; Adegoke, O.; Noor, R.A.; Swart, R.; Kaaya, A.; Wieringa, F.T.; Neufeld,L.M. Fortified foods are major contributors to intakes of vitamin A and iodine, but not iron, in diets of women of reproductiveage in four African countries. J. Nutr. 2020, 150, 2183–2190. [CrossRef] [PubMed]
48. Labadarios, D.; Steyn, N.P.; Nel, J. How diverse is the diet of adult South Africans? Nutr. J. 2011, 10, 33. [CrossRef]49. Institute of Medicine, National Research Council. Supplemental Nutrition Assistance Program: Examining the Evidence to Define
Benefit Adequacy; Caswell, J., Yaktine, A., Eds.; National Academies Press: Washington, DC, USA, 2013.50. Sanders, D.; Joubert, L.; Greenberg, S.; Hutton, B.; Bautista Hernández, F.A.; Rojas, I.C.D. At the Bottom of the Food Chain: Small
Operators versus Multinational Corporations in the Food Systems of Brazil, Mexico and South Africa; Economic Justice Network: CapeTown, South Africa, 2018.