Differential regulation of renal prostaglandin receptor mRNAs by dietary salt intake in the rat
Upload
independentCategory
view
3download
0
Dietary intake and barriers to dietary compliance in black type 2diabetic patients attending primary health-care services
Gladys Nthangeni1, Nelia P Steyn2,*, Marianne Alberts3, Krisela Steyn2, Naomi S Levitt4,Ria Laubscher5, Lesley Bourne6, Judy Dick7 and Norman Temple8
1Department of Human Nutrition, University of the North, Pietersburg, South Africa: 2Chronic Diseases of Lifestyle(CDL) Unit, Medical Research Council, PO Box 19070, Tygerberg 7505, South Africa: 3Department of MedicalSciences, University of the North, Pietersburg, South Africa: 4Department of Medicine, University of Cape Town,South Africa: 5Centre for Epidemiological Research in Southern Africa, Medical Research Council, Cape Town,South Africa: 6Health and Development Group, Medical Research Council, Cape Town, South Africa: 7HealthSystems Research Unit, Medical Research Council, Cape Town, South Africa: 8Centre for Science, AthabascaUniversity, Athabasca, Alberta, Canada
Submitted 9 May 2001: Accepted 15 August 2001
Abstract
Objective: To determine the dietary intake, practices, knowledge and barriers todietary compliance of black South African type 2 diabetic patients attending primaryhealth-care services in urban and rural areas.Design: A cross-sectional survey. Dietary intake was assessed by three 24-hour recalls,and knowledge and practices by means of a structured questionnaire (n ¼ 133 men,155 women). In-depth interviews were then conducted with 25 of the patients toexplore their underlying beliefs and feelings with respect to their disease. Trainedinterviewers measured weight, height and blood pressure. A fasting venous bloodsample was collected from each participant in order to evaluate glycaemic control.Setting: An urban area (Sheshego) and rural areas near Pietersburg in the NorthernProvince of South Africa.Subjects: The sample comprised 59 men and 75 women from urban areas and 74 menand 80 women from rural areas. All were over 40 years of age, diagnosed with type 2diabetes for at least one year, and attended primary health-care services in the studyarea over a 3-month period in 1998.Results: Reported dietary results indicate that mean energy intakes were low (,70% ofRecommended Dietary Allowance), 8086–8450 kJ day21 and 6967–7382 kJ day21 inmen and women, respectively. Urban subjects had higher ðP , 0:05Þ intakes ofanimal protein and lower ratios of polyunsaturated fat to saturated fat than ruralsubjects. The energy distribution of macronutrients was in line with therecommendations for a prudent diet, with fat intake less than 30%, saturated fatless than 10% and carbohydrate intake greater than 55% of total energy intake. In mostrespects, nutrient intakes resembled a traditional African diet, although fibre intakewas low in terms of the recommended 3–6 g/1000 kJ. More than 90% of patients atethree meals a day, yet only 32–47% had a morning snack and 19–27% had a lateevening snack. The majority of patients indicated that they followed a special diet,which had been given to them by a doctor or a nurse. Only 3.4–6.1% were treated bydiet alone. Poor glycaemic control was found in both urban and rural participants,with more than half of subjects having fasting plasma glucose above 8 mmol l21 andmore than 35% having plasma glycosylated haemoglobin level above 8.6%. Hightriglyceride levels were found in 24 to 25% of men and in 17 to 18% of women.Obesity (body mass index $30 kg m22) was prevalent in 15 to 16% of men comparedwith 35 to 47% of women; elevated blood pressure ($160/95 mmHg) was leastprevalent in rural women (25.9%) and most prevalent in urban men (42.4%).Conclusions: The majority of black, type 2 diabetic patients studied showed poorglycaemic control. Additionally, many had dyslipidaemia, were obese and/or had anelevatedbloodpressure.Quantitativeandqualitativefindings indicated that thesepatientsfrequently received incorrect and inappropriate dietary advice from health educators.
KeywordsBlack South Africans
Diabetes mellitusNon-insulin-dependent
diet therapyDiet therapy
q The Authors 2002*Corresponding author: Email [email protected]
Public Health Nutrition: 5(2), 329–338 DOI: 10.1079/PHN2001256

Recent studies have indicated that the prevalence of type 2
diabetes mellitus is an increasing health concern in black
South Africans. The age-adjusted prevalence of diabetes in
urban settings was found to be 8% in Cape Town1and 5.3%
in Durban2. In peri-urban Xhosa speakers, the age-
adjusted prevalence was found to be 4.5%3 and in rural
settings of Kwa-Zulu Natal, 4.2%4. Numerous studies have
demonstrated poor glycaemic control5, obesity6 and
hypertension7 in the majority of black diabetic patients
in South Africa.
The main goal of therapy for patients with type 2
diabetes is to optimise quality of life and to prevent acute
metabolic and long-term complications with reduction of
premature morbidity and mortality8. In managing the
disease, dietary therapy should form an essential
component of treatment. In this respect the Association
for Dietetics in South Africa have published a position
paper on the dietary management of type 2 diabetes9.
These recommendations focus on energy intake for
optimal weight control, a high intake of dietary fibre (3–
6 g/1000 kJ) and complex carbohydrates (50–65% of total
energy), a low fat intake (,30% energy) and a low
saturated fat intake (,10%). Additionally regular meals
and snacks are prescribed, with a limited alcohol intake
and regular exercise as part of the lifestyle9.
It is not known to what extent poor dietary compliance
is a problem in black South African type 2 diabetic
patients. One of the few studies that examined this
question indicated that when dietary advice was the sole
treatment, it appeared to have no effect on the metabolic
control of the patients10. It has been suggested that
nutrition therapy for black patients is unsuccessful when
the diet prescription does not relate to the patient’s cultural
environment and economic situation, and is presented in
ways that are difficult for low-literacy patients to under-
stand and implement11.
To date there is a paucity of data on dietary intake and
practices and dietary advice given to black type 2 diabetic
patients who attend primary health-care services in South
Africa. Due to the limited number of dietitians, particularly
dietitians conversant in indigenous languages and culture,
doctors and nurses currently give much of the dietary
advice. The aim of this study was to evaluate the dietary
intake and practices, the knowledge and barriers
associated with dietary compliance, as well as metabolic
control and associated disorders, in a group of urban and
rural, black, type 2 diabetic patients. The results will assist
in planning culturally appropriate dietary guidelines for
black patients in a primary heath-care setting.
Methods
Subjects and ethics
The study was undertaken in the central region of the
Northern Province of South Africa, in Sheshego, a suburb
of the city of Pietersburg, and in surrounding rural areas
(40–100 km from Pietersburg). The Northern Province
borders on Zimbabwe in the north and on Mozambique in
the east. It is one of the most poverty-stricken provinces of
the country due to its high unemployment rate12.
The sample comprised 59 men and 75 women from
urban areas and 74 men and 80 women from rural areas,
over 40 years of age, diagnosed with type 2 diabetes for at
least one year and without renal failure. The participants
were consecutive patients who attended primary health-
care services in the study area over a 3-month period in
1998. All patients visiting the clinics were willing to
participate in the study.
Ethical approval for the study was obtained from the
Ethics Committee of the University of the North. Informed
consent was received from subjects prior to their inclusion
in the study.
Dietary intake
The repeated 24-hour recall method was selected to assess
the dietary intake of the participants as it is easy to
administer, gives valid information on groups, and is
practical to use with illiterate populations when the
interviews are conducted by well-trained fieldworkers13.
Participants were required to recall their entire previous
day’s food consumption. Interviews were conducted
according to a training manual drawn up for the purpose
of the survey. Interviews included two weekdays and a
weekend recall for each participant. There was a period of
at least 7 days between repetitions of the dietary
questionnaire. The patients did not know in advance
that their consumption on a specific day was to be studied.
One interview was conducted at the home of each
participant and the others at the clinics/hospital attended
by the participant.
Four fieldworkers were trained by an experienced
dietitian to conduct the dietary interviews. They were
selected according to their practical experience in field-
work as well as their ability to communicate in the local
language (Pedi). Dietary aids (food models) were used by
the fieldworkers to obtain detailed information on portion
sizes consumed. The food models were selected based on
average food portions and types of local foods commonly
consumed in the northern areas of South Africa, as
published in the literature14 – 17. Dietary data were
analysed using SAS18 and local food composition tables19.
Mean nutrient intakes were compared with the Recom-
mended Dietary Allowances (RDAs)20.
Dietary practices, knowledge and treatment of the
disease
Questions on dietary practices and knowledge and
treatment of the disease were incorporated into a general
questionnaire developed for the purpose of the survey.
The same fieldworkers who conducted the dietary
interviews completed this questionnaire. Content validity21
G Nthangeni et al.330

was ensured by having the questionnaire evaluated by
five experts in the field of type 2 diabetes and diet.
In order to explore the quantitative dietary data of these
patients in more depth, in-depth interviews were
conducted with 25 purposefully selected participants.
The in-depth interview is regarded as one of the best
qualitative research techniques to use in probing
underlying meanings and values22. A Northern Sotho-
speaking woman, experienced in using qualitative
methods, was further trained to do the in-depth inter-
views. Each interview was audio taped, then transcribed,
translated into English and prepared for content analysis.
Biochemical tests and anthropometry
Fasting venous blood samples were collected from
patients into tubes containing ethylenediaminetetraacetic
acid (EDTA) for glycosylated haemoglobin (HbA1c)
analysis, into tubes containing fluoride for glucose analysis
and into plain tubes for lipid analyses. Blood samples were
centrifuged within 6 h on a Beckman GF-15 centrifuge at
3000 rev min21 for 15 min, and supernatant stored at
2708C until analysed. The analyses were done within 6
months from the day of collection. Glucose was measured
with a Tecknicon RA-XT autoanalyser and a glucose
oxidase kit. Glycosylated haemoglobin was measured
using the IMX system, with a reference range of 4.3–6.6%.
Total cholesterol (TC), high-density lipoprotein choles-
terol (HDL-C) and triglycerides (TG) were measured using
a Dimension ES autoanalyser with kits supplied by Dade
Behring. Low-density lipoprotein cholesterol (LDL-C)
values were estimated using the Friedewald formula23:
LDL-C¼TC-(HDL-C+TG/2.2). Reference values for glu-
cose, HbA1c and lipids are shown in Table 68,24–26.
Trained fieldworkers measured weight, height and
blood pressure of each patient according to standard
procedures27. Weight was measured on a digital scale to
the nearest 0.01 kg; height on an anthropometer to the
nearest 0.1 cm; and body mass index (BMI) was calculated
(weight/height squared). The blood pressure was
measured with the person seated and rested for at least 5
minutes, using a mercury manometer (sphygmomano-
meter) that had been calibrated to the nearest
0.01 mmHg28. Consecutive measurements were taken on
the right arm. The mean of three readings was used for
analysis.
Pilot study
A pilot study was undertaken on 20 diabetics (10 men and
10 women) at a clinic in the Northern Province that was
not included in the sample area. The general ques-
tionnaire, as well as the 24-hour recall recording form,
were tested and adapted accordingly.
Statistical analyses
To test for differences between urban and rural subjects,
the Wilcoxon two-sample test was used for continuous
variables and either the Chi-square test or Fisher’s exact
test was used for categorical variables. The 95%
confidence interval was used to test for significance.
Results
The mean age of the participants in the urban and rural
areas was 62.2 (standard deviation (SD) 10.1) and 61.9
(9.8) years, respectively. The percentage of illiteracy was
18.6 and 22.7 for urban men and women and 29.7 and 24.4
for rural men and women, respectively. More than 70% of
all the patients studied lived on a state pension (social
security) or disability grant. Hypertension had been
diagnosed in 53–63% of men and in 55–61% of women.
The majority of men (66–68%) and women (93–96%)
reported that they were taking oral hypoglycaemic agents,
and 27% of men and 3–5% of women were using insulin.
Dietary intake
The reported energy and macronutrient intakes of the
patients are presented in Table 1. Mean energy intakes of
all groups were less than 70% of the RDA’s minimum
range (RDA for men, 9660 kJ day21; for women,
7980 kJ day21)20. Mean protein intakes were above the
RDA for men and women (63 and 50 g day21, respect-
ively). Total mean fibre intakes were low compared with
the minimum recommended amounts of 29 g for men and
24 g for women, based on 3–6 g fibre per 1000 kJ per day9.
Mean fat and animal protein intakes were low and resulted
in mean cholesterol intakes below the recommended
maximum (300 mg day21)29. The main differences
between mean intakes of urban versus rural subjects
were found in animal protein, saturated fat (not
significant) and in the polyunsaturated to saturated fat
(P/S) ratio. Urban subjects had higher intakes of animal
protein and saturated fat and lower P/S ratios than their
rural counterparts. Mean reported alcohol intakes were
low (,5 g day21) in all groups.
Energy distribution of subjects in the present study
complies well with the distribution of macronutrients
recommended by the South African Dietetic Association9
for the dietary management of type 2 diabetes (Table 1).
Total mean fat intakes were far below the recommended
maximum of 30% and mean saturated fat intakes lay below
10% of energy intake. Carbohydrate intakes were far
above the recommended minimum of 55% of energy
intake. The high carbohydrate intake can be explained by
the finding that the most commonly consumed foods were
refined maize porridge, brown bread and/or sorghum,
which were consumed in large quantities (Table 2).
Chicken, beef and milk were the most frequently
consumed sources of protein, and cabbage and spinach
the most commonly consumed vegetables.
Dietary practices and knowledge
In both urban and rural areas, the majority of patients
Dietary practices of black type 2 diabetic patients 331

Table 1 Mean energy (SD) and macronutrient intakes in type 2 diabetic patients in the study
NutrientsUrban menðn ¼ 59Þ
Rural menðn ¼ 74Þ
Urban/ruralWilcoxonP-value
Urban womenðn ¼ 75Þ
Rural womenðn ¼ 82Þ
Urban/ruralWilcoxonP-value
Energy (kJ) 8449 (1881) 8086 (1906) 0.29 7381 (1894) 6967 (1816) 0.19Protein (g) 75 (18.1) 70 (21.6) 0.07 65 (22.3) 59 (17.5) 0.15Plant protein (g) 44 (12.6) 43 (11.2) 0.80 39 (12.6) 39 (12.4) 0.85Animal protein (g) 31 (14.0) 26 (18.4) 0.018* 26 (18.6) 20 (13.4) 0.09Total fibre (g) 21 (6.3) 21 (6.8) 0.47 21 (8.6) 19 (6.7) 0.50Insoluble fibre (g) 2.5 (1.6) 2.7 (2.1) 0.95 2.6 (1.6) 3.1 (1.7) 0.07Soluble fibre (g) 2.0 (1.3) 2.3 (2.5) 0.54 2.2 (1.6) 2.3 (1.7) 0.54Total carbohydrate (g) 336 (83.7) 322 (79.5) 0.31 288 (74.3) 274 (81.5) 0.24Total sugar (g) 15 (10.6) 12 (12.0) 0.10 16 (10.8) 14 (11.8) 0.13Added sugar (g) 2.6 (5.2) 3.8 (11.0) 0.79 4.0 (7.2) 2.1 (5.1) 0.18Cholesterol (mg) 118 (77.9) 114 (102.5) 0.27 126 (118.7) 105 (92.6) 0.38Fat (g) 30 (11.3) 29 (12.9) 0.33 28 (12.8) 27 (11.3) 0.82Saturated fat (g) 7.6 (4.0) 7.1 (4.4) 0.27 7.2 (5.1) 6.1 (3.4) 0.36Monounsaturated fat (g) 10.2 (5.1) 9.3 (5.1) 0.22 9.0 (5.0) 8.9 (4.7) 0.93Polyunsaturated fat (g) 8.1 (4.0) 8.1 (4.0) 0.60 7.4 (3.2) 8.2 (3.6) 0.12P/S ratio† 1.2 (0.5) 1.4 (0.7) 0.27 1.3 (0.6) 1.5 (0.6) 0.019*Alcohol (g) 1.9 (9.0) 0.4 (2.3) 0.45 0.9 (4.4) 0.9 (4.5) 0.76Total protein as % energy 15.1 (2.6) 14.4 (2.7) 0.12 14.7 (2.9) 14.3 (2.6) 0.73Plant protein as % energy 8.6 (1.2) 9.0 (1.2) 0.07 8.9 (1.4) 9.2 (1.2) 0.037*Animal protein as % energy 6.4 (4.4) 5.3 (3.3) 0.046* 5.8 (3.7) 4.9 (3.1) 0.29Total fat as % energy 13.6 (4.6) 13.3 (4.5) 0.72 14.0 (4.3) 14.8 (5.6) 0.60Saturated fat as % energy 3.4 (1.8) 3.3 (1.7) 0.46 3.6 (2.1) 3.4 (1.8) 0.57Monounsaturated fat as % energy 4.7 (2.3) 4.3 (1.8) 0.57 4.5 (1.8) 4.9 (2.4) 0.43Polyunsaturated fat as % energy 3.7 (1.2) 3.8 (1.7) 0.71 3.8 (1.1) 4.5 (1.8) 0.015*Carbohydrate as % energy 66.4 (5.4) 67.0 (5.7) 0.39 65.9 (5.8) 65.7 (6.3) 0.84Added sugar as % energy 3.1 (2.4) 2.6 (2.7) 0.08 3.8 (2.9) 3.5 (3.3) 0.37Alcohol as % energy 1.1 (5.0) 0.3 (1.9) 0.45 0.8 (5.7) 0.8 (4.1) 0.77
*, P , 0:05.† P/S: ratio of polyunsaturated fats to saturated fats.
GN
than
geni
eta
l.332

Table 2 Food items most commonly consumed by type 2 diabetics in the study, as derived from three 24-hour recalls
Urban menðn ¼ 59Þ
Rural menðn ¼ 74Þ
Chi-squareP-value
Urban womenðn ¼ 75Þ
Rural womenðn ¼ 80Þ
Chi-squareP-valueFood % Mean (g) SD % Mean (g) SD % Mean (g) SD % Mean (g) SD
Brown bread 92 145 66 86 152 56 0.507 93 128 58 90 135 56 0.317Maize porridge 75 721 138 82 723 218 0.782 87 597 174 76 584 195 0.811Tea (Ceylon) 66 303 136 81 278 87 0.914 59 284 81 75 337 167 0.390Sorghum porridge 66 671 159 76 616 184 0.097 69 560 203 79 596 146 0.143Chicken 76 94 31 76 99 33 0.784 72 96 38 69 100 45 0.783Beef 36 80 40 22 96 41 0.155 24 70 43 16 108 114 0.155Milk 28 165 100 30 99 23 0.174 25 171 139 23 133 105 0.180Apple 31 163 51 23 137 26 0.121 40 136 31 30 146 24 0.203Cabbage 25 109 52 50 114 79 0.815 27 86 32 38 101 61 0.598Tea (herbal) 22 281 93 18 242 35 0.332 47 314 103 30 310 107 0.883Spinach 20 208 77 39 116 48 0.000* 31 136 84 29 130 53 0.602Oranges 20 174 59 27 205 52 0.193 47 184 62 35 168 64 0.317
*, P , 0:05.
Table 3 Practices related to dietary regimes of patients in the study
Dietary advice givenUrban menðn ¼ 59Þ (%)
Rural menðn ¼ 74Þ (%) P-value
Urban womenðn ¼ 75Þ (%)
Rural womenðn ¼ 80Þ (%) P-value
1. Diet was explained by 78 83.8 0.39 78.7 79.3 0.92Doctor 56.1 71.6 0.06 63.5 57 0.4Dietitian 15.8 8.1 0.17 4.1 14.3 0.03*Nurse 22.8 12.2 0.11 18.9 27.3 0.22Others 3.5 1.4 0.58 1.4 3.9 0.62
2. Diet explained to family 0 0 0.71 0 1.2 0.693. Exchange lists provided 32.7 41.9 0.22 34 39 0.244. Years following the diet
,1 year 8.7 16.2 0.34 18.7 13.4 0.831–5 years 55.9 55.4 56 59.8$5 years 35.6 28.4 25.3 26.8
5. Comments on the dietExpensive 64.4 60.8 0.67 52 47.6 0.57Unfamiliar foods 8.5 2.7 0.13 14.7 11 0.48Not tasty 44.1 43.2 0.92 40 36.6 0.66Not explained 30.5 10.8 0.004* 24 20.8 0.62Not traditional 27.1 23 0.58 21.3 7.3 0.011*Foods unavailable 20.3 20.3 0.99 22.7 26.7 0.62Other reasons 5.1 4.1 0.77 6.7 2.4 0.21
Knowledge and practices1. What is diabetes? 0.144 0.581
Correct 27.1 39.2 25.3 29.3Incorrect 15.6 6.8 14.7 11Unsure 57.6 54.1 58.7 59.8
2. What changes in blood? 0.007* 0.007*Correct 6.9 24.3 12 17.1Incorrect 8.5 9.5 9.3 18.3Unsure 84.8 63.9 77.3 64.6
3. Action taken when they believe they are hyperglycaemic?Take medication 59.3 63.5 0.62 56 56.1 0.99Eat 54.2 50 0.62 41.3 28.1 0.08Sleep 30.5 28.4 0.78 25.3 24.4 0.89Visit clinic 8.5 14.9 0.26 16 18.3 0.71Nothing/other 3.4 4.1 0.42 5.3 10.9 0.24
4. Action taken when they believe they are hypoglycaemic?Take medication 56 54.1 0.829 52 31.7 0.010*Eat 54.2 46 0.342 48 22 0.001*Sleep 13.6 23 0.167 21.3 6.1 0.005*Visit clinic 3.4 5.4 0.578 9.3 9.8 0.92Nothing/other 3.4 0 0.697 5.3 6.1 0.55
*, P , 0:05.
Dietary practices of black type 2 diabetic patients 333
(78–84%) had had a ‘diabetic’ diet explained to them by
either a doctor (56–72%) or a nurse (12–27%) (Table 3).
Only 4–16% had been counselled by a dietitian. Most of
the patients (84–92%) stated that they followed the diet
explained to them. However, less than 7% of men and
women were using diet alone as a means of treatment
for their diabetes. Apart from one rural woman, no diet
had been explained to family members and less than
half of the patients had received exchange lists, namely
the recommended portion sizes within different food
groups. Patients had many complaints about the dietary
advice they had received: notably, that the diet was
expensive, not tasty, not traditional and that foods were
not available. Less than 40% of patients were able to give
an explanation of their disease. Their practices also
reflected poor knowledge, since more than 50% of
participants indicated that they take medication when
hypoglycaemic and, conversely, eat when they are
hyperglycaemic.
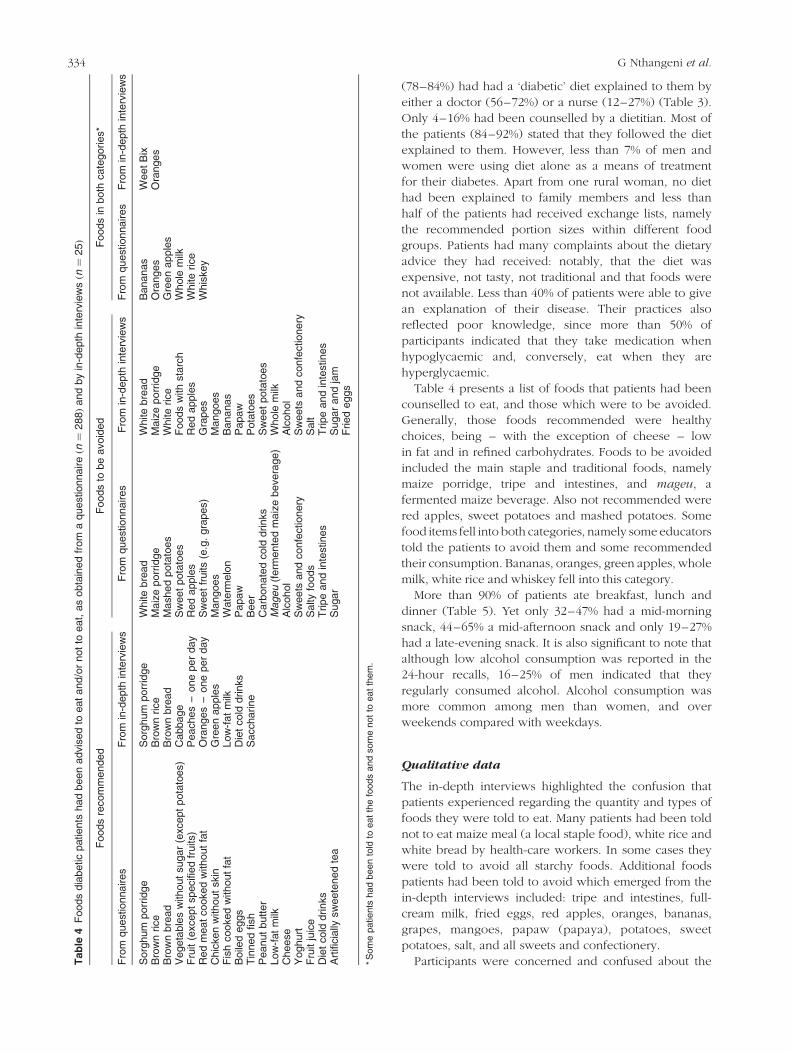
Table 4 presents a list of foods that patients had been
counselled to eat, and those which were to be avoided.
Generally, those foods recommended were healthy
choices, being – with the exception of cheese – low
in fat and in refined carbohydrates. Foods to be avoided
included the main staple and traditional foods, namely
maize porridge, tripe and intestines, and mageu, a
fermented maize beverage. Also not recommended were
red apples, sweet potatoes and mashed potatoes. Some
food items fell into both categories, namely some educators
told the patients to avoid them and some recommended
their consumption. Bananas, oranges, green apples, whole
milk, white rice and whiskey fell into this category.
More than 90% of patients ate breakfast, lunch and
dinner (Table 5). Yet only 32–47% had a mid-morning
snack, 44–65% a mid-afternoon snack and only 19–27%
had a late-evening snack. It is also significant to note that
although low alcohol consumption was reported in the
24-hour recalls, 16–25% of men indicated that they
regularly consumed alcohol. Alcohol consumption was
more common among men than women, and over
weekends compared with weekdays.
Qualitative data
The in-depth interviews highlighted the confusion that
patients experienced regarding the quantity and types of
foods they were told to eat. Many patients had been told
not to eat maize meal (a local staple food), white rice and
white bread by health-care workers. In some cases they
were told to avoid all starchy foods. Additional foods
patients had been told to avoid which emerged from the
in-depth interviews included: tripe and intestines, full-
cream milk, fried eggs, red apples, oranges, bananas,
grapes, mangoes, papaw (papaya), potatoes, sweet
potatoes, salt, and all sweets and confectionery.
Participants were concerned and confused about theTab
le4
Foods
dia
betic
patients
had
been
advis
ed
toeat
and/o
rnot
toeat,
as
obta
ined
from
aquestionnaireðn¼
288Þ
and
by
in-d
epth
inte
rvie
wsðn¼
25Þ
Foods
recom
mended
Foods
tobe
avoid
ed
Foods
inboth
cate
gories*
Fro
mquestionnaires
Fro
min
-depth
inte
rvie
ws
Fro
mquest
ionnaires
Fro
min
-depth
inte
rvie
ws
Fro
mquest
ionnaires
Fro
min
-depth
inte
rvie
ws
Sorg
hum
porr
idge
Sorg
hum
porr
idge
White
bre
ad
White
bre
ad
Bananas
Weet
Bix
Bro
wn
rice
Bro
wn
rice
Maiz
eporr
idge
Maiz
eporr
idge
Ora
nges
Ora
nges
Bro
wn
bre
ad
Bro
wn
bre
ad
Mash
ed
pota
toes
White
rice
Gre
en
apple
sV
egeta
ble
sw
ithout
sugar
(except
pota
toes)
Cabbage
Sw
eet
pota
toes
Foods
with
sta
rch
Whole
milk
Fru
it(e
xce
pt
specifi
ed
fruits)
Peach
es
–one
per
day
Red
apple
sR
ed
apple
sW
hite
rice
Red
meat
cooked
without
fat
Ora
nges
–one
per
day
Sw
eet
fruits
(e.g
.gra
pes)
Gra
pes
Whis
key
Chic
ken
without
skin
Gre
en
apple
sM
angoes
Mangoes
Fis
hcooked
without
fat
Low
-fat
milk
Wate
rmelo
nB
ananas
Boile
deggs
Die
tcold
drinks
Papaw
Papaw
Tin
ned
fish
Saccharine
Beer
Pota
toes
Peanut
butt
er
Carb
onate
dcold
drinks
Sw
eet
pota
toes
Low
-fat
milk
Mageu
(ferm
ente
dm
aiz
ebevera
ge)
Whole
milk
Cheese
Alc
ohol
Alc
ohol
Yoghurt
Sw
eets
and
confe
ctionery
Sw
eets
and
confe
ctio
nery
Fru
itju
ice
Salty
foods
Salt
Die
tcold
drinks
Tripe
and
inte
stin
es
Tripe
and
inte
stin
es
Art
ificia
llysw
eete
ned
tea
Sugar
Sugar
and
jam
Fried
eggs
*S
om
epatients
had
been
told
toeat
the
foods
and
som
enot
toeat
them
.
G Nthangeni et al.334

amounts and portion sizes they were allowed to eat. This is
illustrated by the following direct quotations:
‘No, the doctor did not give me measurements, he just
told me about the drink that we must drink’.
‘Many doctors said you just eat porridge up to this limit’
[showing the palm of the hand].
‘I just eat like any other person’.
From the interviews it became apparent that these
patients were receiving dietary advice from many sources.
Apart from the health-care staff, the following were also
consulted: relatives, other type 2 diabetic patients,
traditional healers, Christian faith healers and herbalists.
Many of the participants indicated that they are ‘forced’
to eat certain foods they do not like. For example, ‘We are
forced to eat this dirty porridge’ was said, referring to
sorghum. Few of the patients knew or acknowledged that
type 2 diabetes is a chronic condition that cannot be cured.
Patients generally had a poor knowledge regarding their
disease and treatment. This is illustrated by the following
two statements:
‘Sugar, they even surprised me because they said I must
not eat sugar, but they say I must take a teaspoon of
sugar when I feel dizzy’.
‘Don’t you understand me when I say that sometimes I
just feel dizzy, I don’t know what it is’.
The belief that their condition is curable has led many
patients to try alternative treatments, including: raw
chicken gallbladder, aloes (plant species), concoctions
from the herbalist, nngu (indigenous vegetable), boiled
litchi leaves, mopani worms (larvae of Imbrasia belina
moth), salt water, prayer water and a dance by a traditional
healer. Some also believe that the disease is the result of
being bewitched, namely: ‘Maybe it is not diabetes, maybe
we are bewitched how will we know?’ and ‘Do you want
to tell me that you don’t know there are witches? If they
hate you, they can hate you and do something, yes’.
Although some patients had been advised on what to
eat, few had changed their eating habits. One reason given
for this may be that the dietary advice was not culturally
appropriate. This is illustrated by the following quotes:
‘You know that in the Sotho, in our culture, I can’t say I
no longer eat it [maize meal], there are occasions where
I am forced to be available, let me say funerals…when
they put food on the corrugated iron, I also carry on
eating. I just lie to myself and say after all it is one day it
does not matter’.
‘…It seems all doctors say the same thing that the beef
tripe, goat, sheep and so on, don’t eat, so I am used to
them so much that I cannot stop eating them
completely’.
‘I don’t like it when they say everything [all food] is not
good for us’.
Indicators of poor glycaemic control,
dyslipidaemia, obesity and hypertension
Poor glycaemic control was found in a large proportion of
participants based on the South African guidelines for the
management of type 2 diabetes at the primary care level8
(Table 6). This was the case for fasting serum glucose
above 8 mmol l21 (59–67%) and for plasma HbA1c above
8.6% (37–43%).
Hypertriglyceridaemia, as defined in the South African
guidelines, was found in 24–25% of males and in 17–18%
of women. No subjects had abnormal HDL-C values
according to the original South African guidelines. More
recent and stricter criteria24 indicate that higher percen-
tages had poor glycaemic control and dyslipidaemia, with
25 to 38% having low HDL-C values and more than 35%
having abnormal LDL-C values. Obesity prevalence
ranged from 15 to 16% in men and from 35 to 47% of
women. A blood pressure $160/95 mmHg was found in
33 to 42% of men and in 26 to 33% of women.
Hypertension had been diagnosed in 53 to 63% of males
Table 5 Meal patterns and alcohol consumption of type 2 diabetic patients studied
MealsUrban menðn ¼ 59Þ
Rural menðn ¼ 74Þ
Chi-squareP-value
Urban womenðn ¼ 75Þ
Rural womenðn ¼ 80Þ
Chi-squareP-value
Breakfast, % (number) 100 (59) 97.3 (72) 0.50 100 (75) 98.8 (79) –Morning snack, % (number) 42.4 (25) 37.8 (28) 0.59 46.7 (35) 32.1 (26) 0.07Lunch, % (number) 100 (59) 93.2 (69) 0.06 100 (75) 92.6 (75) 0.06Afternoon snack, % (number) 55.9 (33) 48.6 (36) 0.40 65.3 (49) 44.4 (36) 0.01*Dinner, % (number) 100 (59) 100 (74) – 100 (75) 98.8 (79) –Evening snack, % (number) 27.1 (16) 21.6 (16) 0.46 24.0 (18) 18.5 (15) 0.42Number of meals, mean (SD) 4.3 (1.0) 4.0 (1.1) 0.16 4.4 (1) 3.9 (0.9) 0.001*Number of foods per snack period
Morning snack, mean (SD) 2.5 (1.6) 2.0 (1.4) 0.22 2.5 (1.6) 2.0 (1.5) 0.20Afternoon snack, mean (SD) 1.8 (1.0) 1.8 (1.2) 0.62 2.2 (1.7) 1.5 (0.8) 0.03*Evening snack, mean (SD) 0.6 (1.9) 1.4 (0.7) 0.73 1.2 (0.5) 1.9 (1.9) 0.21
Regular alcohol consumptionOn weekdays, % (number) 17.0 (10) 16.2 (12) 0.91 1.3 (1) 4.9 (4) 0.36On weekends, % (number) 25.4 (15) 17.6 (13) 0.26 4.0 (3) 6.1 (5) 0.72
*, P , 0:05.
Dietary practices of black type 2 diabetic patients 335

and in 55 to 61% of females prior to the study. No
significant differences were noted between urban and
rural participants for biochemistry, blood pressure and
anthropometry.
Discussion
This study has used a combination of quantitative and
qualitative methods in order to gain a better understanding
of the dietary intake, practices and beliefs of black type 2
diabetic patients in a particularly poor part of South Africa.
When examining the diet from a nutritional point of view,
it generally appears to follow the recommended
guidelines9, even when taking the probability of dietary
underreporting into consideration. The diet is high in
carbohydrate (maize, sorghum and brown bread), and low
in fat, particularly saturated fats. In this respect it reflects
the traditional African diet. The low energy intake is very
similar to that found in two recent studies in the Northern
Province in black adults30,31, and possibly reflects some
underreporting32. This is probably due to the difficulty in
establishing accurate portion sizes for maize porridge,
which is eaten in large quantities by hand. A shortcoming
of the nutritional intake of the patients is the finding that
their fibre intake was below that recommended to bring
about a reduction in LDL-C33, one of the benefits
associated with a high dietary fibre intake.
The meal pattern described by patients did not conform
to the recommendation of small frequent meals spaced
throughout the day34,35. Major barriers to dietary
compliance observed were related to foods allowed and
to the patients’ understanding of portion sizes. Patients
were given conflicting advice with respect to the types of
foods they were allowed to eat and they generally
appeared to have little understanding of portion sizes, as
illustrated by reports that they were not provided with
exchange lists. A major concern is the finding that patients
were told to avoid maize porridge and to eat sorghum
instead. This does not make sense both culturally and
scientifically, since maize is the traditional staple food of
the region and additionally maize has been found to have
a lower glycaemic index than sorghum, especially when
eaten cold36. The finding that patients had a high intake of
maize indicates that they were disregarding this recom-
mendation in any event. Some fruits had also been contra-
indicated (e.g. red apples) without sound nutritional
reason. At most health-care centres attended by black
patients in South Africa, doctors and nurses counsel with
respect to dietary treatment. Unfortunately, they have little
training in nutrition and, additionally, may have poor
knowledge with respect to foods that are traditionally
eaten. Consequently, the dietary advice given is frequently
inconsistent, sometimes incorrect and often confusing to
patients37.
The finding that a large proportion of these patients had
poor glycaemic control, were hypertensive and over-
weight comes as no surprise, and echoes that of similar
studies in black diabetic patients where it has been found
Table 6 Percentage of type 2 diabetic patients with abnormal blood values, obesity and hypertension, and their medication usage
Blood variableUrban menðn ¼ 57Þ
Rural menðn ¼ 73Þ
Chi-squareP-value
Urban womenðn ¼ 74Þ
Rural womenðn ¼ 80Þ
Chi-squareP- value
Glucose.7 mmol l21* 62.1 74.0 0.14 72.2 67.1 0.49.8 mmol l21† 60.8 59.2 0.22 67.1 65.4 0.88
HbA1c.7%* 56.9 69.9 0.12 59.7 66.7 0.37.8.6%† 39.7 42.5 0.05 38.9 37.0 0.39
Triglycerides$2 mmol l21* 25.9 28.4 0.79 18.9 23.2 0.45$2.2 mmol l21† 24.1 24.7 0.95 17.5 17.0 0.94
Total cholesterol$5 mmol l21* 39.0 41.1 0.81 30.0 54.9 0.52$6.5 mmol l21† 5.2 11.0 0.49 14.9 9.8 0.25
HDL-C#1.2 mmol l21* 35.6 30.1 0.51 37.8 25.0 0.09,0.9 mmol l21† 0 0 0 0 0 0
LDL-C$3 mmol l21 35.1 41.7 0.45 63.5 56.8 0.39
BMI$30 kg m22 15.3 16.2 0.85 46.7 35.4 0.15Blood pressure
$140/90 mmHg* 76.3 64.9 0.32 62.7 54.9 0.34$160/95 mmHg† 42.4 33.3 0.24 33.0 25.9 0.37
MedicationOHGA‡ 67.8 66.2 0.99 96.0 92.7 0.68Insulin 27.1 27.0 2.7 4.9Other 5.1 6.8 6.7 2.4
Reference values: *, Working Group of the National Diabetes Advisory Board (SEMDSA)8; †, Society for Endocrinal Metabolism and Diabetes of SouthernAfrica24.‡ OHGA – oral hypoglycaemic agents.
G Nthangeni et al.336

that 76% of women were hypertensive and 54% were
obese7.
The finding that patients in the present study were
poorly controlled and overweight cannot be ascribed to
their diet alone, since type 2 diabetes is known to be
associated with several adverse cardiovascular risk factors,
namely hypertension, increased serum triglycerides and
decreased HDL-C38,39. Lifestyle factors such as lack of
exercise, alcohol consumption and cigarette smoking
could also have contributed to the poor glycaemic control
and dyslipidaemia found in these patients, as well as poor
compliance with medication.
Conclusions
The majority of black, type 2 diabetic patients studied
showed poor glycaemic control. Additionally, many had
dyslipidaemia, were obese and/or had an elevated blood
pressure. Although it is difficult to determine the extent to
which dietary compliance contributed to this, the
following factors were identified as contributors: lack of
knowledge regarding the disease; inadequate and
inaccurate dietary counselling; and poor compliance
with dietary advice given.
Recommendations
It is recommended that a culturally appropriate dietary
intervention programme be developed for black type 2
diabetic patients. This should include a diet plan that is
based on the traditional staple foods – maize and/or
sorghum, and be spaced throughout the day in well-
balanced portion sizes. Patients should be encouraged to
increase their fibre intake, e.g. by including legumes,
which are culturally acceptable and have a low glycaemic
index40. Additionally, patients need to be given accurate
dietary and lifestyle information on their disease from
doctors and nurses since they are the main nutrition
educators. This may require that health professionals be
retrained in the concepts of an optimal diabetic diet which
is culturally and economically acceptable to black patients.
Acknowledgements
We thank the following organisations who contributed
financially to this study: Medical Research Council, South
African Sugar Association, Novo Nordisk, and the
Norwegian Universities Committee for Development
Research and Education (NUFU).
References
1 Levitt NS, Katzenellenbogen JM, Bradshaw D, Hoffman MN,Bonnici F. The prevalence and identification of risk factorsfor NIDDM in urban Africans in Cape Town, South Africa.Diabetes Care 1993; 16: 601–7.
2 Omar MAK, Seedat MA, Motala AA, Dyer RB, Becker P. The
prevalence of diabetes mellitus and impaired glucosetolerance in a group of urban South African blacks. S. Afr.Med. J. 1993; 83: 641–3.
3 Erasmus RT, Blanco E, Okesina AB, Matsha T, Gqweta Z, MesJA. Prevalence of diabetes mellitus and impaired glucosetolerance in factory workers from Transkei, South Africa.S. Afr. Med. J. 2001; 91: 157–90.
4 Motala AA, Pirie FJ, Gouws E, Omar MAK, Gray IP. Theprevalence of diabetes mellitus and associated risk factors ina rural South African community of Zulu descent. J.Endocrinol. Metal. Diabetes S. Afr. 2001; 6: 39.
5 Levitt NS, Bradshaw D, Zwarenstein MF, Bawa AA,Maphumolo S. Audit of public sector primary diabetes carein Cape Town South Africa; high prevalence of compli-cations, uncontrolled hyperglycaemia, and hypertension.Diabetes Med. 1997; 14: 1073–7.
6 Van Rooijen AJ, Rheeder P, Eales CJ. Urban black femalepatients’ perception and knowledge of non-insulin depen-dent diabetes mellitus (NIDDM): a pilot study. J. Endocrinol.Metal. Diabetes S. Afr. 2001; 6: 38.
7 Mohamed E. The implementation of the national diabetestype 2 guidelines at primary level. J. Endocrinol. Metal.Diabetes S. Afr. 2001; 6: 38.
8 Working Group of the National Diabetes Advisory Board(SEMDSA). Guidelines for the management of type II (non-insulin-dependent) diabetes mellitus at primary health carelevel in South Africa. S. Afr. Med. J. 1997; 87: 497–512.
9 Association for Dietetics in Southern Africa. Dietary manage-ment of people with diabetes mellitus. Position Statement. S.Afr. J. Clin. Nutr. 1997; 9: 1233–4.
10 Erasmus RT, Blanco EB, Okesina AB, Gqweta Z, Matsha T.Assessment of glycaemic control in stable type 2 black SouthAfrican diabetics attending a peri-urban clinic. Postgrad.Med. J. 1999; 75: 603–6.
11 Gohdes D. Diet therapy for minority patients with diabetes.Diabetes Care 1988; 11: 189–91.
12 Alberts M. The Dikgale Health and Demographic Study.Sovenga: University of the North, 1995.
13 Nelson M, Bingham SA. Assessment of food consumptionand nutrient intake. In: Margetts BM, Nelson M, eds. DesignConcepts in Nutritional Epidemiology, 2nd ed. Oxford:Oxford University Press, 1997.
14 Bourne LT, Langenhoven ML, Steyn K, Jooste PL, LaubscherR, Van der Vyfer E. Nutrient intake in the urban Africanpopulation of the Cape peninsula South Africa. The BriskStudy. Central Afr. J. Med. 1993; 39: 238–48.
15 Ladzani R, Steyn NP, Nel JH. A socio-economic profile ofhouseholds in semi-rural areas of Lebowa with specificreference to dietary habits. S. Afr. J. Food Sci. Nutr. 1992; 4:60–3.
16 Gresse A, Voster HH. The glycaemic index and second mealeffect of the typical African meal in black non-insulindependent diabetic subjects. S. Afr. J. Food Sci. Nutr. 1992; 4:64–9.
17 Gresse A, Voster HH. Eating habits and nutrient intakes ofblack patients with diabetes mellitus. S. Afr. J. Food Sci. Nutr.1992; 4: 76.
18 SAS Institute, Inc. SAS User’s Guide: Statistics, 5th ed. Cary,NC: SAS Institute, Inc., 1985.
19 National Research Programme for Nutritional Intervention.Food Composition Tables. Tygerberg: South African MedicalResearch Council, 1999.
20 Food and Nutrition Board, National Research CouncilRecommended Dietary Allowances, 10th ed. Washington,DC: National Academy Press, 1989.
21 Polit DF, Hungler BP. Nursing Research, Principle andMethods, 5th ed. Philadelphia, PA: Lippicot Company, 1995.
22 Ely M, Anzul M, Friedman T, Garner D, Steinmetz AM. DoingQualitative Research: Circles within Circles. London: TheFalmer Press, 1998.
Dietary practices of black type 2 diabetic patients 337
23 Friedewald WT, Levy RJ, Frederickson DS. Estimation of theconcentration of low-density lipoprotein cholesterol inplasma without use of the preparative ultracentrifuge. Clin.Chem. 1972; 18: 499–502.
24 Society for Endocrinal Metabolism and Diabetes of SouthernAfrica. Guidelines for Type 2 Diabetes at Primary Care Level.Johannesburg: Servier, 1999.
25 Lipid and Atherosclerosis Society of Southern Africa WorkingGroup. Diagnosis, management and prevention of thecommon dyslipidaemias in South Africa – clinical guide-lines, 2000. S. Afr. Med. J. 2000; 90: 164–77.
26 Raubenheimer PJ, Levitt NS. What is good control in diabetesmellitus? Cont. Med. Educ. 2000; 18: 915–8.
27 Mahan LK, Escott-Stump S. Krause’s Food, Nutrition, andDiet Therapy, 10th ed. Philadelphia, PA: WB SaundersCompany, 2000.
28 World Health Organization (WHO). Arterial Hypertension.Report of a WHO expert committee. WHO Technical ReportsSeries No. 628. Geneva: WHO, 1978.
29 American Heart Association (AHA). Dietary guidelines forhealthy American adults. Position statement. Circulation1988; 77: 721A–4A.
30 Steyn NP, Burger S, Monyeki KD, Alberts M, Nthangeni G.Seasonal Variation in Dietary Intake of the Adult Populationof Dikgale. Sovenga: University of the North, 1999.
31 Steyn NP, Senekal M, Brits S, Nel JH. Urban and ruraldifferences in dietary intake, weight status and nutritionknowledge of black female students. Asia Pacific J. Clin.Nutr. 2000; 9: 53–8.
32 Steyn NP, MacIntyre UE, Olwagon R, Albert M. Validation ofmultiple 24-hour recalls in a rural adult population using
energy intake and estimated basal metabolic ratios.Epidemiol Infec. 2001; 16(1): 23–6.
33 Nuttall FQ. Dietary fiber in the management of diabetes.Diabetes 1993; 42: 503–6.
34 Bertelsen JC, Christiansen C, Thomsen C, Poulsen PL,Vestergaard S, Steinov A, Rasmussen LH, Rasmussen O,Hermansen K. Effect of meal frequency on blood glucose,insulin, and free fatty acids. Diabetes Care 1993; 16: 4–7.
35 Jenkins DJ, Ocana A, Jenkins AL, Wolever TM, Vuksan V,Katzman HM, Greenberg G, Patten R. Metabolic advantagesof spreading nutrient load: effects of increased mealfrequency in non-insulin dependent diabetes. Am. J. Clin.Nutr. 1992; 55: 461–7.
36 Venter CS, Voster HH, Van Rooyen A, Kruger-Locke MM,Silvis N. Comparison of the effects of maize porridgeconsumed at different temperatures on blood glucose andacetate levels in healthy volunteers. S. Afr. J. Food Sci. Nutr.1990; 2: 2–5.
37 Silvis N. Nutritional recommendations for individuals withdiabetes mellitus. S. Afr. J. Food Sci. Nutr. 1992; 81: 162–6.
38 Turner RC, Millns H, Neil HAW, Stratton IM, Manley SE,Matthews DR, Holman RR. Risk factors for coronary arterydisease in non-insulin dependent diabetes mellitus: UnitedKingdom prospective diabetes study (UKPDS: 23). BMJ1998; 316: 823–8.
39 Grundy SM. Hypertriglyceridemia, atherogenic dyslipide-mia, and the metabolic syndrome. Am. J. Cardiol. 1998;81(4A): 18B–25B.
40 Mbenyane XG. The glycemic index of indigenous SouthAfrican foods. PhD thesis, Potchefstroom Universiteit virChristelike Hoer Onderwys, Potchefstroom, 1997.
G Nthangeni et al.338
Copyright © 2022 FDOKUMEN