DIETARY REFERENCE VALUES - GOV.UK
58
<V • • 0 '•" DIETARY REFERENCE VALUES A GUIDE
-
Upload
khangminh22 -
Category
Documents
-
view
0 -
download
0
Transcript of DIETARY REFERENCE VALUES - GOV.UK

<V
• •
0 '•"
DIETARY REFERENCE VALUES
A GUIDE
Department of Health
Dietary Ref erence Values A Guide
London: HMSO

© Crown copyright 1991 First published 1991
ISBN 0 11 3213964
Dietary Reference Values A Guide
prepared for the Department of Health by Jenny Salmon BSc MSc(Nutrition) SRD
LTh

Contents
Page
Introduction 1
The need for more than one standard 5
Definitions 5
How should Dietary Reference Values be used? 8
A note of caution 10
Conclusions of the Panel 11
Energy 12
Protein 15
Fat and fatty acids 17
Sugars and starches 20
Non-starch polysaccharides 22
Vitamins Vitamin A 24
Thiamin 25
Riboflavin 26
Niacin 26
Vitamin B6 28
Vitamin B12 29
Folate 29
Pantothenic Acid 30
Biotin 31
Vitamin C 31
Vitamin D 32
Vitamin E 33
Vitamin K 34
Other organic compounds 35
Minerals Calcium 36
Phosphorus 37
Magnesium 38
Iron 39
Zinc 40 Sodium 41
V
Potassium 43 Chloride 43 Copper 44 Iodine 44 Selenium 45 Other minerals 46
References 47
Glossary of Terms and abbreviations 48
Tables and Figures 51
vi

Introduction
How many calories should I eat so as not to get fat?
Is a 6ft shotputter who eats 140g of fat a day increasing his risk of having a heart attack?
How much vitamin C does a 6 year old need?
A study of students' diets showed that they ate, on average, 20g dietary fibre a day. Is this enough?
All four questions, and many more like them, may be answered only if there is some sort of 'standard'. This standard would give direct answers to questions of the "How much do I need?" type. It would also provide a yardstick against which people's nutrient intakes could be measured to provide answers to the "Is it enough?" type of question.
It all sounds so simple and so easy, but it isn't.
It is precisely because it sounds easy but isn't that there has been so much mis-interpretation of experiments to find out how well people are fed.
'Standards' in the form of Recommended Intakes for Nutrients (DHSS 1969) and Recommended Daily Amounts (RDA) of food energy and nutrients (DHSS 1979) have existed in the UK for over 30 years. But some of the people who have used them did not always understand how they had been derived, how they were intended to be used and the degree of accuracy which ought to be attributed to them. In particular, these 'standards' were often used - wrongly - to assess the adequacy of the diet of an individual.
In order to try to overcome the 'abuses' of the figures, and to update them in the light of recent information about nutrient requirements, the Chief Medical Officer asked the Committee on Medical Aspects of Food Policy (COMA) to set up a Panel to consider the matter. The Panel prepared the Government publication Dietary Reference Values for Food Energy and Nutrients for the United Kingdom. (DH 1991)
In the past, revisions of recommendations have provided updated versions of previous figures. The present Panel decided to base its conclusions on a review of the original scientific literature on human nutrient needs and intakes.
The full Report contains a summary of the research which led the Panel to make its recommendations so it is, perhaps, not surprising that the full report runs to more than 200 pages.

This research is important for anyone who wants to understand the scientific basis for the Panel's conclusions. In an ideal world, everyone who needs to use the figures would read the full report. But this shorter publication has been prepared for those wishing to grasp quickly the practical significance of the full report, including those individuals who want to understand its relevance to their own diet. It is intended to give readers information about
* what the figures are * how they were derived * the degree of confidence they should have in each of them * how the figures should be used
Why the difficulty?
Deciding how much protein or vitamin C or calcium a person should eat for optimal health is difficult for many reasons, not least because there is no definition of optimal health.
Individual variation
People differ from each other in the amounts of energy and nutrients they need.
Given this individual variation, how can energy or nutrient recommendations be made which are intended for everyone in a particular population group? How does one represent this range of need by just one figure?
An absorbing problem
A further difficulty in making recommendations for nutrient intake is that the absorption of some nutrients is far from complete. More than 90% of the proteins, fats and carbohydrates in food are digested and absorbed, but only about 15% of the iron eaten gets into the body. Even this proportion is not fixed - it depends on need (how low body stores are), other dietary constituents and the form in which the iron occurs in food. If two people have exactly the same need for iron but one absorbs twice as much as the other, then to get the same amount of iron in the body, the poor absorber will need to eat twice as much iron as the good absorber. What intake figure should be used for the standard?
Is prevention of deficiency signs enough?
What function of a nutrient does one consider in deciding on levels of intake? For example, it is well known that vitamin C deficiency results, sooner or later, in scurvy with bleeding gums, teeth dropping out and wounds failing to heal properly. It is not too difficult to find out the amount of vitamin C which will prevent those deficiency symptoms, but would larger amounts confer any other benefits beyond the anti-scurvy function of vitamin C?
The need for standards
Much work in nutrition is based on finding out what people eat, translating the foods into nutrients and comparing the amounts of those nutrients with standards.
The need for some type of standard is not in dispute. The question is, what should the standard be?
If the aim is to ensure that almost everyone in the country or group gets enough of every nutrient, the figures chosen should, clearly, be high enough to cover the needs of people who have high requirements. Inevitably, this means that, if the people with average or lower-than-average needs eat that much, they will be getting far more than they need. Provided the extra consumption is not harmful, there is no biological disadvantage in setting standards at the top of the range. But it could mean that many people would strive to eat amounts of nutrients they don't need. This could be expensive and wasteful.
The amounts of most nutrients which may be consumed by some people in excess of their needs are most unlikely to be harmful. The same cannot be said of energy.
If the standard for energy intake of a group of people were designed to be enough for those individuals with high needs, it would be too much for most people in the group. If all the members of the group strove to consume that much energy, many of them would become too fat . . . which is clearly undesirable.
A more sensible approach, and the one which has been adopted by the Panel, is to set energy standards at the average need, knowing that some people will need more and some will need less.
This thinking was the basis of the RDIs and RDAs made in 1969 and 1979 respectively.
Essentially, the figures for nutrients were enough or more than enough to cover the needs of almost every healthy person in the country while those for energy were set at the estimated average requirement.
Problems in use - individuals and groups
Recommended figures have been abused mainly because there has been confusion between the term 'individual need for' and 'recommended intake of' a nutrient. In reality, almost all people need less than the 'recommended amounts' of a nutrient.
Erring on the side of caution and setting recommendations for nutrient intake at the upper end of the range, as previous figures have done, makes sense if the sole objective is to set a figure in order to minimise the risk of deficiency in a population.
The trouble was, and is, that many users of the standard want to be able to assess the adequacy or otherwise of individuals' diets. The 1969 and 1979 figures were

not designed to be, and should not be, used for this purpose. But they were.
Suppose an individual was found to be eating 10% less thiamin than the RDI or RDA. What could one say about the adequacy of this individual's thiamin intake? The correct answer is 'very little' . . . for two reasons. The first is that dietary surveys to find out what people eat can only give an indication of food intake. But even if this practical problem could be overcome, there is the inherent difficulty that RDIs and RDAs were deliberately set high to ensure that they were enough even for people with high needs. Almost all people need less - some a bit less, most a lot less. It is likely that the individual eating 10% less thiamin than the RDA was eating enough or more than enough for his needs. But there was no way of telling by using the RDI or RDA.
Despite these sources of error, some people would have compared the individual's thiamin intake with the standard and concluded (probably quite wrongly) that this individual was thiamin deficient.
The 1969 and 1979 "recommended" figures were designed to be used to assess the adequacy of the diets of groups of people to help minimise the risk of under-nutrition. Any group may be expected to include people with high needs and people with low needs. If the results of a dietary survey revealed that the average nutrient intake for the group was near the RDA, one could conclude that the chance of undernutrition in any individual was small and that most people in the group were getting enough or more than enough.
How much is too much?
High intakes of some nutrients can have undesirable effects. Even so, some members of the public believe that, 'if a little is good, more must be better'. Although the diets of most people in the UK do not result in intakes of any vitamins or minerals that have undesirable effects, the possibility nevertheless exists.
It must be remembered, too, that, as nutrition issues are taken up and certain causes championed by the media, there will be a temptation for people to take food supplements such as vitamin and mineral tablets. This could well increase the likelihood of intakes of nutrients that are dangerously high.
It would, therefore, be useful to have some indication of the relative risks and benefits of high intakes of nutrients. The 1969 and 1979 recommendations gave no such guidance and this has been looked at for the first time by the Panel.
4
The Need For More Than One Standard
Nutritionists need to use reference values for energy and nutrients for different purposes.
It would be useful to be able to assess the adequacy of the diets of groups of people and of individuals. Sometimes it is necessary to know the level of intake that will be enough even for people with high needs but some nutrients are toxic if taken in large amounts - so, how much constitutes too much?
All of these issues have been addressed by the Panel in considering the new 'Dietary Reference Values'. So it is not surprising that they have produced, not one set of figures, but up to four for some nutrients.
DEFINITIONS
Energy, protein, vitamins and minerals
ESTIMATED AVERAGE REQUIREMENT (EAR) - the Panel's estimate of the average requirement or need for food energy or a nutrient. Clearly, many people will need more than the average and many people will need less.
REFERENCE NUTRIENT INTAKE (RNI) - an amount of a nutrient that is enough for almost every individual, even someone who has high needs for the nutrient. This level of intake is, therefore, considerably higher than most people need. If individuals are consuming the RNI of a nutrient, they are most unlikely to be deficient in that nutrient.
LOWER REFERENCE NUTRIENT INTAKE (LRNI) - the amount of a nutrient that is enough for only the small number of people with low needs. Most people will need more than the LRNI if they are to eat enough. If individuals are habitually eating less than the LRNI they will almost certainly be deficient.
SAFE INTAKE - a term normally used to indicate the intake of a nutrient for which there is not enough information to estimate requirements. A safe intake is one which is judged to be adequate for almost everyone's needs but not so large as to cause undesirable effects.
DIETARY REFERENCE VALUES (DRVs) - a general term used to cover all the figures produced by the Panel - LRNI, EAR, RNI, and safe intake.
All DRVs are intended to apply to healthy people; they do not make any allowance for the different energy and nutrient needs imposed by some diseases.

By using the word 'reference', the Panel hoped that users will not interpret any of the figures as recommended or desirable intakes but will use the most appropriate set of figures for any given situation and use them as a general point of reference rather than as definitive values set in tablets of stone. Figure 1 shows how LRNI, EAR and RNI are related to each other.
Figure 1 Relationship between various reference values
Lower Reference Estimated Reference Nutrient Intake Average Nutrient (LRNI) Requirement Intake
(EAR) (ANt)
The Lower Reference Nutrient Intake is enough for only a small number of people (about 3% of the population who have low needs). It is not enough for most people.
The Estimated Average Requirement for energy or a nutrient is the amount which any stated group of people will, on average, need.
The Reference Nutrient Intake is the amount of a nutrient which is enough for at least 97% of the population.
Fats, sugars and starches
These nutrients differ from proteins, vitamins and minerals in that there are no deficiency signs or symptoms that are specifically associated with a low intake of fats or sugars or starches. (They are, of course, major contributors to energy intake, an inadequate intake of which results in weight loss.)
There is a requirement for essential fatty acids, but this is extremely low and will almost certainly be met if energy intake is adequate.
With that exception, there is no requirement, as such, for fats, sugars or starches.
And within the confines of overall energy needs, neither is there a lower value below which deficiency is likely nor an upper limit beyond which undesirable effects are likely. There can be no LRNI or EAR or RN!.
Nevertheless, research has shown that the proportions in the diet of fats - in particular of certain fatty acids - starches and sugars may affect health. The Panel therefore considered it important that the Dietary Reference Values should give some guidance on the desirable intakes of these nutrients; intakes which, in the light of present knowledge, seem to be conducive to good health and to minimising the risk of developing diseases such as heart disease or cancer. For these nutrients, Dietary Reference Values are given as average contributions to dietary energy for groups of people.
Non-starch polysaccharides
This term effectively replaces 'dietary fibre' (see p. 22). Research in recent years has helped to clarify the role that non-starch polysaccharides (NSP) play in the body. The Panel has suggested a Dietary Reference Value based on an estimated desirable average intake, and the expected range of individual intakes around that figure.
7
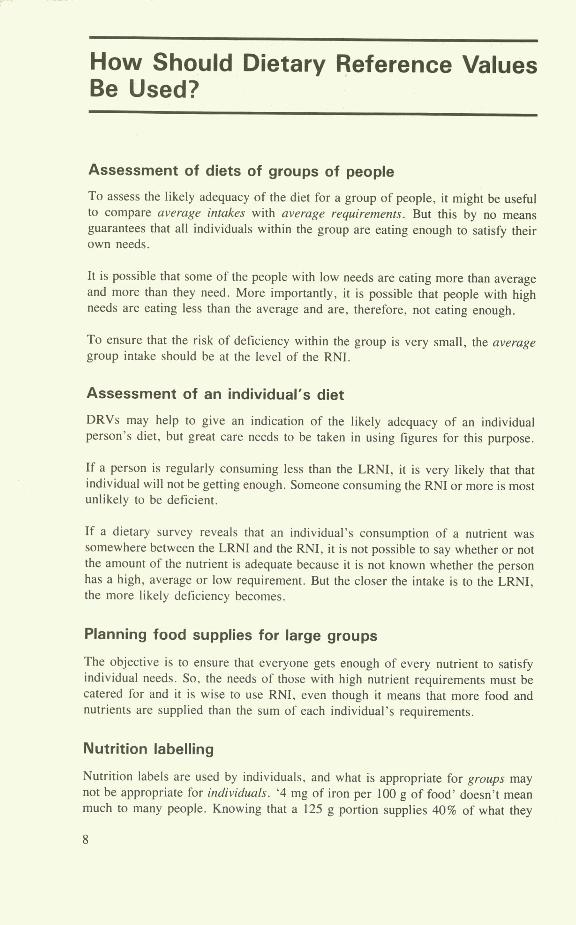
How Should Dietary Reference Values Be Used?
Assessment of diets of groups of people
To assess the likely adequacy of the diet for a group of people, it might be useful to compare average intakes with average requirements. But this by no means guarantees that all individuals within the group are eating enough to satisfy their own needs.
It is possible that some of the people with low needs are eating more than average and more than they need. More importantly, it is possible that people with high needs are eating less than the average and are, therefore, not eating enough.
To ensure that the risk of deficiency within the group is very small, the average group intake should be at the level of the RNI.
Assessment of an individual's diet
DRVs may help to give an indication of the likely adequacy of an individual person's diet, but great care needs to be taken in using figures for this purpose.
If a person is regularly consuming less than the LRNI, it is very likely that that individual will not be getting enough. Someone consuming the RNI or more is most unlikely to be deficient.
If a dietary survey reveals that an individual's consumption of a nutrient was somewhere between the LRNI and the RNI, it is not possible to say whether or not the amount of the nutrient is adequate because it is not known whether the person has a high, average or low requirement. But the closer the intake is to the LRNI, the more likely deficiency becomes.
Planning food supplies for large groups
The objective is to ensure that everyone gets enough of every nutrient to satisfy individual needs. So, the needs of those with high nutrient requirements must be catered for and it is wise to use RNI, even though it means that more food and nutrients are supplied than the sum of each individual's requirements.
Nutrition labelling
Nutrition labels are used by individuals, and what is appropriate for groups may not be appropriate for individuals. '4 mg of iron per 100 g of food' doesn't mean much to many people. Knowing that a 125 g portion supplies 40% of what they

need may mean more, and that is the form in which the Panel recommends that food labelling should in future convey information about nutrient content. The Panel recommends that, whenever possible, because the RNI would provide more than most people need, nutrient content should be expressed as a percentage of the EAR, which would be interpreted as just that - an average requirement.

A Note of Caution!
The Panel emphasised that, for most nutrients, there were insufficient data to set the EAR or LRNI or RNI or safe intake with any great confidence. Some of the data used in deriving the figures are based on dietary surveys which, in themselves, are not absolutely precise.
So, IT IS IMPORTANT THAT ALL DIETARY REFERENCE VALUES FOR PROTEINS, VITAMINS AND MINERALS ARE TREATED CAUTIOUSLY AS INDICATIONS OF THE RANGES OF REQUIREMENTS LIKELY TO BE FOUND WITHIN THE UK POPULATION. EQUALLY, THE VALUES FOR ENERGY, FATS, SUGARS AND STARCHES ARE INTENDED TO BE INDICATIONS OF APPROPRIATE INTAKES.
RIC
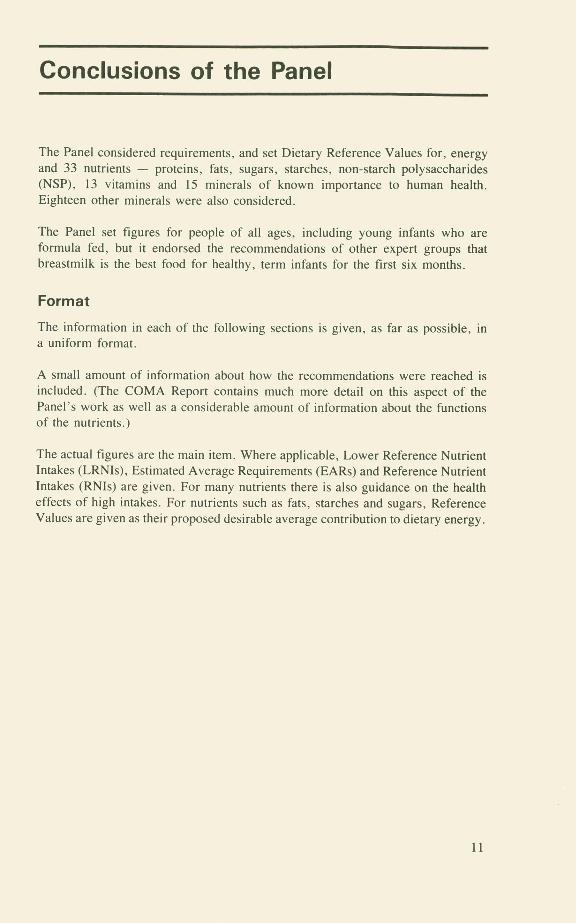
Conclusions of the Panel
The Panel considered requirements, and set Dietary Reference Values for, energy and 33 nutrients - proteins, fats, sugars, starches, non-starch polysaccharides (NSP), 13 vitamins and 15 minerals of known importance to human health. Eighteen other minerals were also considered.
The Panel set figures for people of all ages, including young infants who are formula fed, but it endorsed the recommendations of other expert groups that breastmilk is the best food for healthy, term infants for the first six months.
Format
The information in each of the following sections is given, as far as possible, in a uniform format.
A small amount of information about how the recommendations were reached is included. (The COMA Report contains much more detail on this aspect of the Panel's work as well as a considerable amount of information about the functions of the nutrients.)
The actual figures are the main item. Where applicable, Lower Reference Nutrient Intakes (LRNIs), Estimated Average Requirements (EARs) and Reference Nutrient Intakes (RNIs) are given. For many nutrients there is also guidance on the health effects of high intakes. For nutrients such as fats, starches and sugars, Reference Values are given as their proposed desirable average contribution to dietary energy.
11
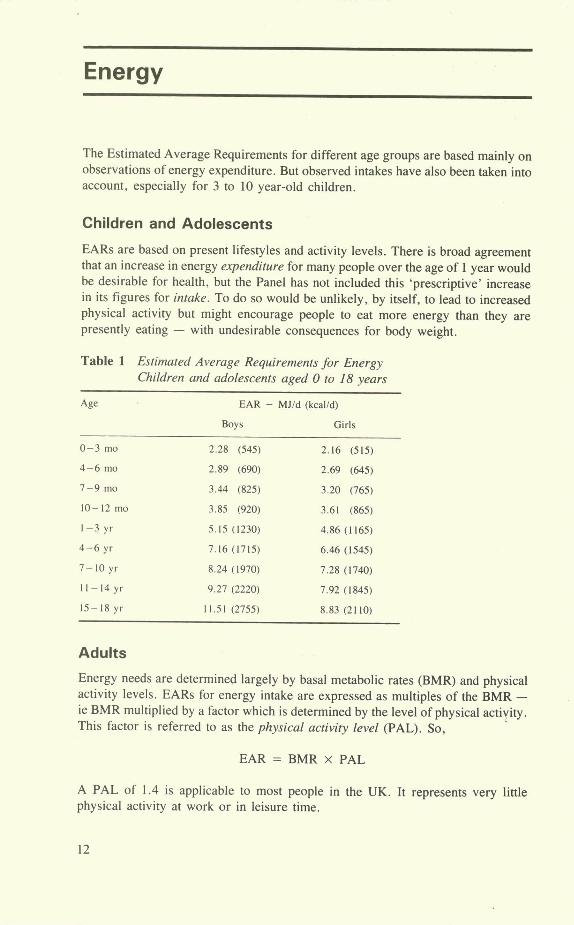
Energy
The Estimated Average Requirements for different age groups are based mainly on observations of energy expenditure. But observed intakes have also been taken into account, especially for 3 to 10 year-old children.
Children and Adolescents
EARs are based on present lifestyles and activity levels. There is broad agreement that an increase in energy expenditure for many people over the age of 1 year would be desirable for health, but the Panel has not included this 'prescriptive' increase in its figures for intake. To do so would be unlikely, by itself, to lead to increased physical activity but might encourage people to eat more energy than they are presently eating - with undesirable consequences for body weight.
Table 1 Estimated Average Requirements for Energy Children and adolescents aged 0 to 18 years
Age EAR - MJ/d (kcal/d)
Boys Girls
0-3 mo 2.28 (545) 2.16 (515)
4-6 mo 2.89 (690) 2.69 (645)
7-9 mo 3.44 (825) 3.20 (765)
10-12 mo 3.85 (920) 3.61 (865)
1-3 yr 5.15 (1230) 4.86 (1165)
4-6 yr 7.16(1715) 6.46(1545)
7-10 yr 8.24 (1970) 7.28 (1740)
11-14 yr 9.27 (2220) 7.92 (1845)
15-18 yr 11.51 (2755) 8.83 (2110)
Adults
Energy needs are determined largely by basal metabolic rates (BMR) and physical activity levels. EARs for energy intake are expressed as multiples of the BMR - le BMR multiplied by a factor which is determined by the level of physical activity. This factor is referred to as the physical activity level (PAL). So,
EAR = BMR x PAL
A PAL of 1.4 is applicable to most people in the UK. It represents very little physical activity at work or in leisure time.
12

PALs of 1.6 for women and 1.7 for men represent moderate activity during work time and during leisure.
PALs of 1.8 for women and 1.9 for men represent high levels of physical activity at work and during recreational activities.
Table 2 Estimated Average Requirements for Energy Adults (assuming low activity levels at work and leisure) (PAL = 1.4)
Age EAR - MJ/d (kca!/d)
Males Females
19-49 yr 10.60 (2550) 8.10 (1940)
50-59 yr 10.60 (2550) 8.00 (1900)
60-64 yr 9.93 (2380) 7.99 (1900)
65-74 yr 9.71 (2330) 7.96 (1900)
75+ yr 8.77 (2100) 7.61 (1810)
Pregnant women
Although energy is needed during pregnancy to support the growth of the fetus and to enable fat to be deposited in the mother's body (for later use during lactation), considerable reductions occur in physical activity and metabolic rate to help to compensate for the increased needs.
The Panel concluded that the need to increase energy intakes during pregnancy is limited to a modest increment during the last trimester only. The increase in EAR above pre-pregnancy intake is 0.8 MJ/d (200 kcal/d) for the final three months only. But women who were underweight at the start of pregnancy may need to eat more.
Lactating women
Breastfeeding is an energy-demanding activity because breastmilk has to contain enough energy to supply the needs of the growing infant. Even taking into account the fact that body fat stored during pregnancy is used to supply some of that energy, additional energy intake, over and above pre-pregnancy intakes, is needed during lactation.
As soon as weaning begins, the mother's energy needs begin to return to their pre-pregnancy levels. For the purpose of setting EARs, breastfeeding mothers are classified in two groups. Group 1 mothers are those whose breastmilk supplies all or most of the infant's food only for the first 3 months. Group 2 mothers are those who supply all or nearly all the infant's energy and nutrient needs for 6 months or more.
13
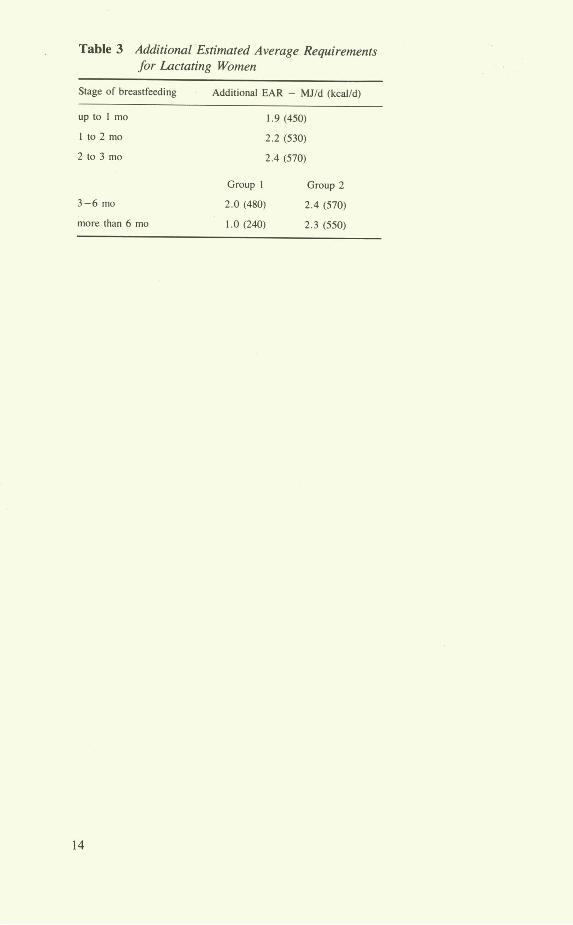
Table 3 Additional Estimated Average Requirements for Lactating Women
Stage of breastfeeding Additional EAR - MJ/d (kcal/d)
up to 1 mo 1.9(450)
I to 2 mo 2.2 (530)
2 to 3 mo 2.4 (570)
Group I Group 2
3-6 mo 2.0 (480) 2.4 (570)
more than 6 mo 1.0 (240) 2.3 (550)
14
Protein
Figures are mainly based on data from nitrogen balance studies and the recommen-dations in the World Health Organisation report, Energy and Protein Requirements. (WHO 1985)
Previously, Recommended Protein Intakes/Amounts in the UK have not been based on needs but on the fact that people in the UK who are accustomed to taking at least 10% of their energy as protein are not protein deficient.
The 1991 figures are based on estimates of need and make allowance for the fact that, although about 90% of protein in food is digested, only about 70% of protein in food is incorporated into body tissue. Even so, the figures for both EAR and RN! are considerably lower than the 1979 Recommended Daily Amounts.
The protein RNIs for all adults aged 19 years and over are 0.75 g/kg/d.
Figures for children and pregnant and lactating women allow for:
i growth in children
ii growth of fetal and maternal tissue in pregnant women
iii breastmilk production in lactating women
The figures are valid only if the needs for energy and all other nutrients are met. If energy needs are not met, dietary protein is used preferentially as a source of energy rather than the raw material' for tissue growth and repair. DRVs are based on the assumption that the protein is of high quality; in other words that the essential amino acid composition in food proteins is close to the human body's need. The normal mixed UK diet provides protein of such quality.
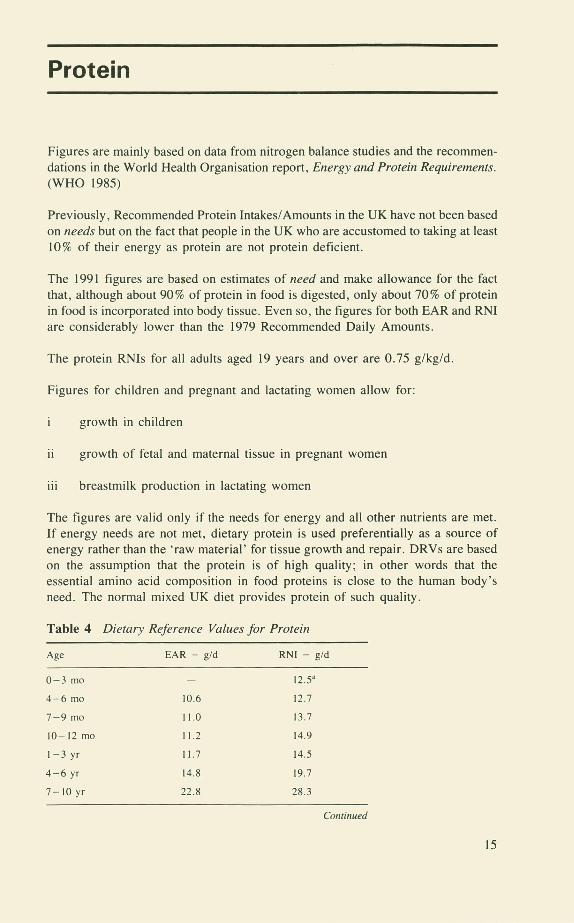
Table 4 Dietary Reference Values for Protein
Age EAR - g/d RNI - gid
0-3 mo - 12.5
4-6 mo 10.6 12.7
7-9 mo 11.0 13.7
10-12 mo 11.2 14.9
1-3 yr 11.7 14.5
4-6 yr 14.8 19.7
7-10yr 22.8 28.3
Continued
15
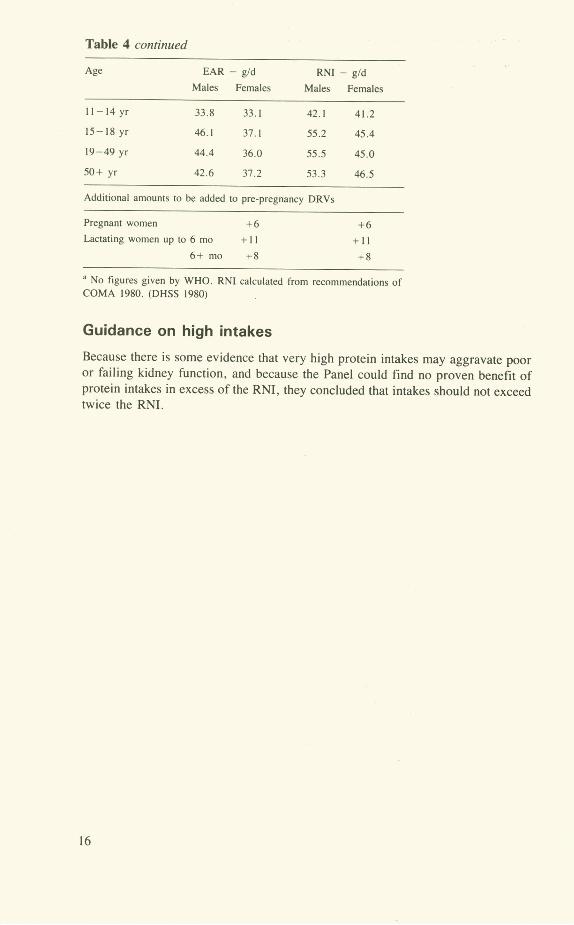
Table 4 continued
Age EAR - g/d RN! - gld
Males Females Males Females
11-14yr 33.8 33.1 42.1 41.2
15-18 yr 46.1 37.1 55.2 45.4
19-49 yr 44.4 36.0 55.5 45.0
50+ yr 42.6 37.2 53.3 46.5
Additional amounts to be added to pre-pregnancy DRVs
Pregnant women +6 +6
Lactating women up to 6 mo + II + II
6+mo +8 +8
No figures given by WHO. RN! calculated from recommendations of COMA 1980. (DHSS 1980)
Guidance on high intakes
Because there is some evidence that very high protein intakes may aggravate poor or failing kidney function, and because the Panel could find no proven benefit of protein intakes in excess of the RN!, they concluded that intakes should not exceed twice the RN!.
RE

Fat and Fatty Acids
Definitions
Triglyceride. The form in which most fats occur in food. A triglyceride consists of three fatty acid molecules attached to a glycerol molecule. A given weight of fatty acids is, therefore, equivalent to a larger weight of fat (triglyceride).
Fatty acid. A molecule consisting mainly of a carbon chain (of variable length) with hydrogen attached. About 16 different fatty acids make up the bulk of the fatty acids in food.
Saturated fatty acid (SFA). One which contains the maximum possible number of hydrogen atoms. The most abundant SFA in foods are myristic acid with 14 carbon atoms in the chain (C 14), palmitic acid with 16 carbon atoms (C 16) and stearic acid (C 18).
Monounsaturated fatty acid. This is usually a long chain fatty acid in which 2 hydrogen atoms are 'missing'. The most common one in food is oleic acid with 18 carbon atoms.
Polyunsaturated fatty acid (PUFA). Usually a long chain fatty acid in which more than two hydrogen atoms are 'missing'. The most common ones are linoleic acid with 4 hydrogen atoms missing and linolenic acid with 6 hydrogen atoms missing. These two PUFA are known as the essential fatty acids (EFA) because they cannot be made in the body.
Cis and trans. Terms used to indicate the spatial arrangement of atoms in a molecule such as an unsaturated fatty acid. Naturally occurring unsaturated fatty acids are usually in the cis configuration.
Dietary fats (triglycerides) are important at two distinct levels of intake.
Essential fatty acids
There is a specific requirement for linoleic acid and one form of linolenic acid, alpha-linolenic acid. Hence these two are called 'essential fatty acids' (EFAs).
Although deficiency does not occur in free-living people eating a 'normal' diet, it is possible to estimate the minimum intakes for infants, children and adults.
The Panel concluded that linoleic acid should provide at least 1 % and alpha-linolenic acid should provide at least 0.2% of total energy intake.
17

Total fat intake
People in the UK, as in other western countries, are accustomed to eating far more fat than is needed just to prevent essential fatty acid deficiency. Much research effort has been put into trying to find out whether or not the present high levels of fat intake are detrimental to health, and particularly whether it is a contributory cause of heart disease and/or some cancers.
After reviewing the considerable amount of evidence on the effect of diet on blood cholesterol levels, heart disease and cancers, the Panel concluded that:
The higher the blood cholesterol level in a population group or individual, the greater the risk of heart disease
ii Increasing the intake of C14 and C16 saturated fatty acids raises blood cholesterol levels
iii Linoleic acid and its derivatives lower blood cholesterol; linolenic acid and its derivatives inhibit clot formation
iv Monounsaturated fatty acids probably have no effect on blood cholesterol levels
v Dietary cholesterol has a relatively small effect on blood cholesterol levels
vi Trials to try to alter heart disease rates by reducing blood cholesterol levels have generally resulted in lower incidences of heart disease but have not affected total mortality rates
vii There is not enough evidence to demonstrate conclusively a link between the intake of fat or any fatty acid and cancer, but the evidence that is available makes it wise to caution against unlimited intakes of fat or of any fatty acid
viii Typical UK diets contain small amounts of trans fatty acids. Although there have been suggestions that trans-fatty acids may increase the risk of heart disease, there is not enough information about their effects on health to draw any firm conclusions about intakes. But, for the sake of prudence, intakes should not rise above the current estimated average level.
Dietary Reference Values for fat and fatty acids
In arriving at Dietary Reference Values for fatty acids, the Panel recognised that any such values would be rather arbitrary, because, apart from EFAs, there is no absolute need for fat or any fatty acid and, within overall energy needs, no well-defined signs or symptoms of deficiency or excess intake. Nevertheless, because of the relationship between fat and certain fatty acids on the one hand, and coronary heart disease and cancers on the other, the Panel decided that Reference Values would be useful.
The DRVs for fat are derived by adding up the reference values for the individual
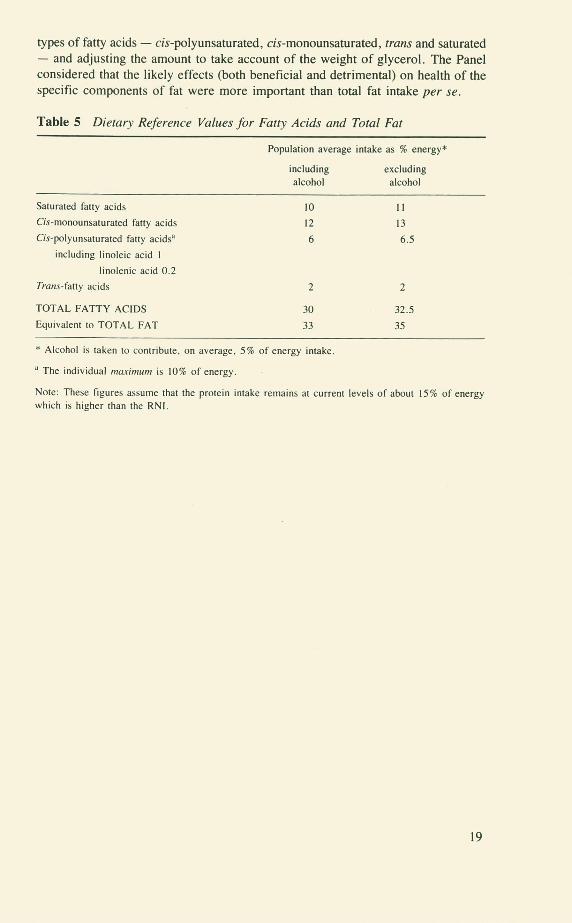
types of fatty acids - cis-polyunsaturated, cis-monounsaturated, trans and saturated - and adjusting the amount to take account of the weight of glycerol. The Panel considered that the likely effects (both beneficial and detrimental) on health of the specific components of fat were more important than total fat intake per Se.
Table 5 Dietary Reference Values for Fatty Acids and Total Fat
Population average intake as % energy*
including excluding
alcohol alcohol
Saturated fatty acids 10 11
Cis-monounsaturated fatty acids 12 13
Cis-polyunsaturated fatty acids 6 6.5
including linoleic acid I
linolenic acid 0.2
Trans-fatty acids 2 2
TOTAL FATTY ACIDS 30 32.5
Equivalent to TOTAL FAT 33 35
* Alcohol is taken to contribute, on average, 5% of energy intake.
The individual ,naxi,nu,n is 10% of energy.
Note: These figures assume that the protein intake remains at current levels of about 15% of energy which is higher than the RN!.
19
Sugars and Starches
Sugars
The food sugars which are most important in human nutrition are the monosaccharides - glucose and fructose - and the disaccharides - sucrose and lactose. Some physiological effects of sugars are determined at least as much by their physical form as by their chemical structures.
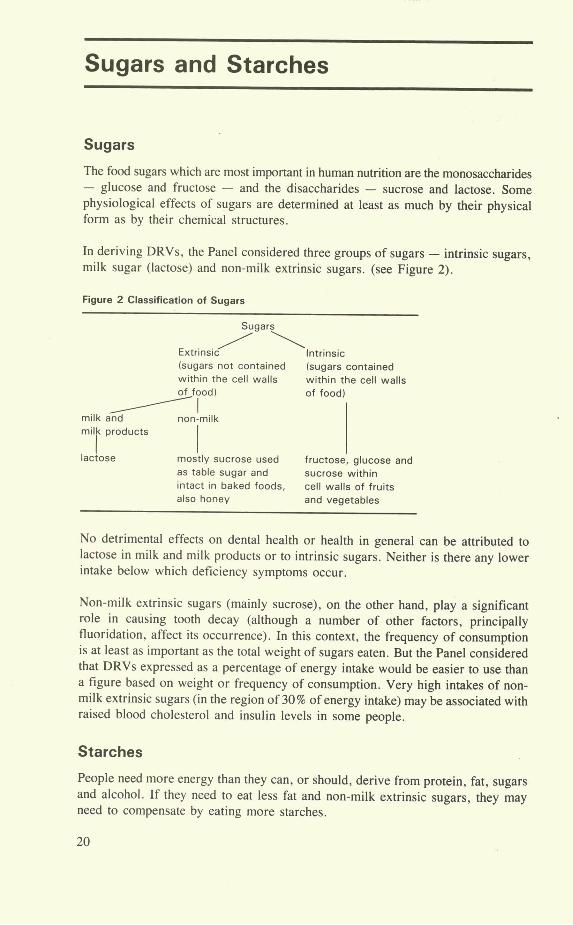
In deriving DRVs, the Panel considered three groups of sugars - intrinsic sugars, milk sugar (lactose) and non-milk extrinsic sugars. (see Figure 2).
Figure 2 Classification of Sugars
Sugars
Extrinsic Intrinsic (sugars not contained (sugars contained within the cell walls within the cell walls of food) of food(
milk and non-milk milk products
lactose mostly sucrose used fructose, glucose and as table sugar and sucrose within intact in baked foods, cell walls of fruits also honey and vegetables
No detrimental effects on dental health or health in general can be attributed to lactose in milk and milk products or to intrinsic sugars. Neither is there any lower intake below which deficiency symptoms occur.
Non-milk extrinsic sugars (mainly sucrose), on the other hand, play a significant role in causing tooth decay (although a number of other factors, principally fluoridation, affect its occurrence). In this context, the frequency of consumption is at least as important as the total weight of sugars eaten. But the Panel considered that DRVs expressed as a percentage of energy intake would be easier to use than a figure based on weight or frequency of consumption. Very high intakes of non-milk extrinsic sugars (in the region of 30% of energy intake) may be associated with raised blood cholesterol and insulin levels in some people.
Starches
People need more energy than they can, or should, derive from protein, fat, sugars and alcohol. If they need to eat less fat and non-milk extrinsic sugars, they may need to compensate by eating more starches.
20

There are no known detrimental effects of high or very high starch intakes (provided, of course that requirements for energy, protein, EFAs, vitamins and minerals are met).
Dietary Reference Values
The DRV for non-milk extrinsic sugars is about 60 g!d, representing 10% of total energy intake. This is an average figure for the UK population.
The Panel gave a Dietary Reference Value of 37% of total energy from starch, intrinsic sugars and lactose in milk and milk products, but could not justify giving a separate figure for each of these carbohydrates.
It must be emphasised that the figures of 10% for non-milk extrinsic sugars and 37% for other available carbohydrates are based on the fact that, in reality, on average, 5% of energy comes from alcohol and current intakes of protein are about 15% of energy (ie above the RNI). If alcohol is excluded from the calculations, the DRVs become 11% for non-milk extrinsic sugars and 39% for starches, intrinsic sugars and lactose in milk and milk products.
Table 6 Dietary Reference Values for Sugars and Starches
Non-milk Starches, intrinsic sugars
extrinsic and lactose in milk and
sugars milk products
% energy % energy
If alcohol is included and protein is at
current level of about 15% 10 37
If alcohol is excluded and protein is at
current level of about 15% Il 39
21
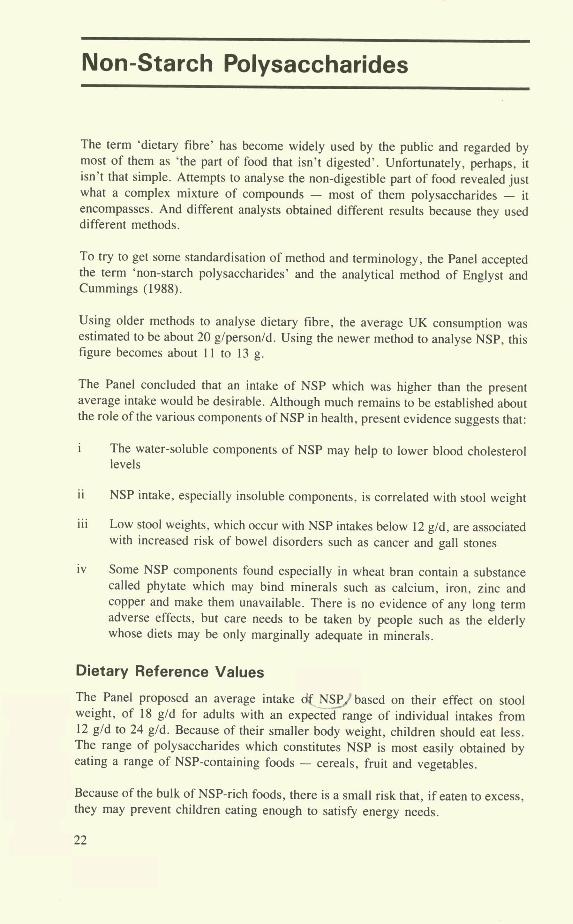
Non-Starch Polysaccharides
The term 'dietary fibre' has become widely used by the public and regarded by most of them as 'the part of food that isn't digested'. Unfortunately, perhaps, it isn't that simple. Attempts to analyse the non-digestible part of food revealed just what a complex mixture of compounds - most of them polysaccharides - it encompasses. And different analysts obtained different results because they used different methods.
To try to get some standardisation of method and terminology, the Panel accepted the term 'non-starch polysaccharides' and the analytical method of Englyst and Cummings (1988).
Using older methods to analyse dietary fibre, the average UK consumption was estimated to be about 20 g/person/d. Using the newer method to analyse NSP, this figure becomes about 11 to 13 g.
The Panel concluded that an intake of NSP which was higher than the present average intake would be desirable. Although much remains to be established about the role of the various components of NSP in health, present evidence suggests that:
i The water-soluble components of NSP may help to lower blood cholesterol levels
ii NSP intake, especially insoluble components, is correlated with stool weight
iii Low stool weights, which occur with NSP intakes below 12 g/d, are associated with increased risk of bowel disorders such as cancer and gall stones
iv Some NSP components found especially in wheat bran contain a substance called phytate which may bind minerals such as calcium, iron, zinc and copper and make them unavailable. There is no evidence of any long term adverse effects, but care needs to be taken by people such as the elderly whose diets may be only marginally adequate in minerals.
Dietary Reference Values
' The Panel proposed an average intake of NSP based on their effect on stool > weight, of 18 g/d for adults with an expected range of individual intakes from
12 g/d to 24 g/d. Because of their smaller body weight, children should eat less. The range of polysaccharides which constitutes NSP is most easily obtained by eating a range of NSP-containing foods - cereals, fruit and vegetables.
Because of the bulk of NSP-rich foods, there is a small risk that, if eaten to excess, they may prevent children eating enough to satisfy energy needs.
22

Guidance on high intakes
There is no evidence that intakes of NSP above 32g/d are associated with any ill effects. But no increase in stool weights occurs with intakes greater than this. So the Panel saw no virtue in exceeding 32g/d.
23

Vitamins
VITAMIN A
Dietary vitamin A is measured as retinol equivalent because, as well as the ready-formed vitamin (retinol) in foods of animal origin, flcarotene in plant foods is converted to retinol in the body. 6 jug /3carotene is equivalent to 1 jig retinol.
Adults
Previously, vitamin A requirements have been derived from depletion/repletion studies. But these tend to give overestimates of requirements. A better method - the one used to calculate DRVs - is to estimate the amount of dietary vitamin A needed to build and maintain a specified body store in the liver. DRVs are based on calculations of intakes needed to maintain a liver store of 20 lAg retinol/g liver. This is the same basis as was used by FAO/WHO (1988).
There are no recommendations about the proportion of vitamin A which should be derived from /3carotene and from retinol. Although there is some evidence that carotene may offer some protection against cancer, the Panel considered that the
evidence was insufficient to make specific recommendations.
Infants
Values are based on the fact that 100 g/d from breast milk is adequate to prevent deficiency. But it is probably not enough to build and maintain a body store of the vitamin. Reference intakes for infants are, therefore, higher than 100 g/d.
Children
No experimental data are available to establish the vitamin A requirements of children. There is a requirement for growth as well as the maintenance of body stores and DRVs are based on the assumption that there is a gradual transition from the requirements of infants to those of adults.
Guidance on high intakes
carotene is not toxic but intakes of retinol in excess of need, if taken over a long period of time, may be dangerous. They may lead to liver and bone damage and other problems.
Regular intakes should not exceed 7500 g/d for women or 9000 btgld for men. An intake of retinol in excess of 3300 g/d is hazardous during pregnancy because it may cause birth defects. Women who are pregnant or may become pregnant need to avoid excessive intakes.
24
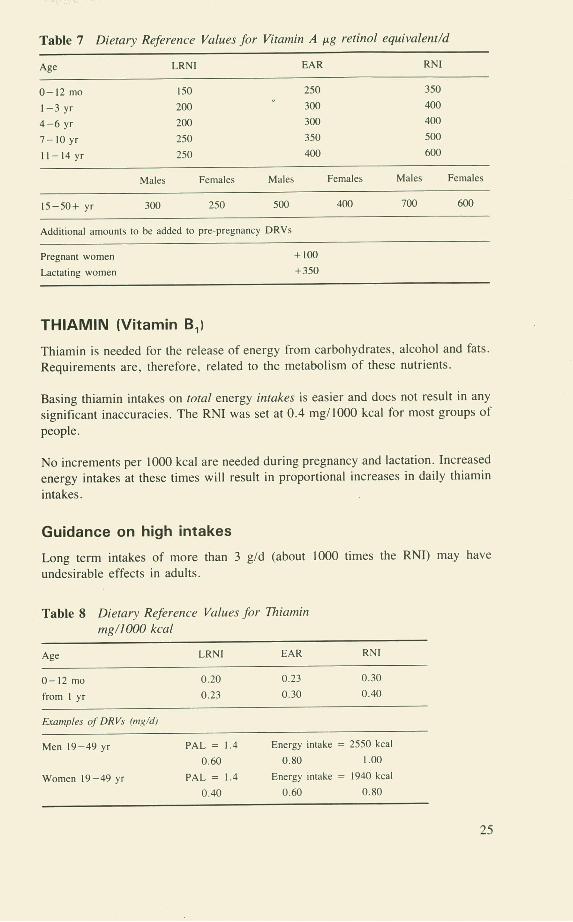
Table 7 Dietary Reference Values for Vitamin A p.g retinol equivalent/d
Age LRNI EAR RN!
0-12 mo 150 250 350
1-3 yr 200 300 400
4-6 yr 200 300 400
7-10 yr 250 350 500
11-14yr 250 400 600
Males Females Males Females Males Females
15-50+ yr 300 250 500 400 700 600
Additional amounts to be added to pre-pregnancy DRVs
Pregnant women + IOU
Lactating women +350
THIAMIN (Vitamin B1)
Thiamin is needed for the release of energy from carbohydrates, alcohol and fats. Requirements are, therefore, related to the metabolism of these nutrients.
Basing thiamin intakes on total energy intakes is easier and does not result in any
significant inaccuracies. The RN! was set at 0.4 mg/bOO kcal for most groups of
people.
No increments per 1000 kcal are needed during pregnancy and lactation. Increased energy intakes at these times will result in proportional increases in daily thiamin
intakes.
Guidance on high intakes
Long term intakes of more than 3 g/d (about 1000 times the RN!) may have
undesirable effects in adults.
Table 8 Dietary Reference Values Jbr Thia,nin mg/J000 kcal
Age LRNI EAR RN!
0-12 mo 0.20 0.23 0.30
from I yr 0.23 0.30 0.40
Examples of DRVs mg/d)
Men 19-49 yr PAL = 1.4 Energy intake = 2550 kcal
0.60 0.80 1.00
Women 19-49 yr PAL = 1.4 Energy intake = 1940 kcal
0.40 0.60 0.80
25
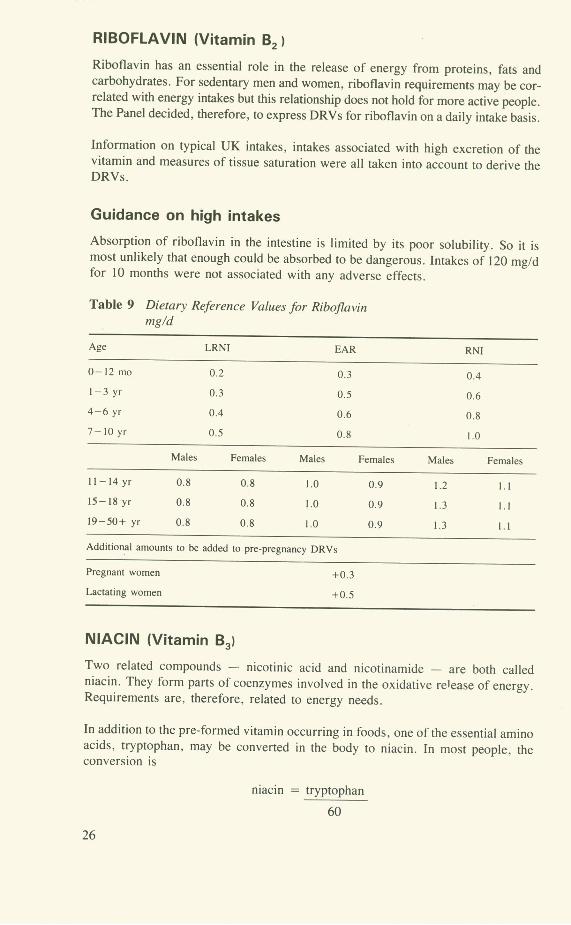
RIBOFLAVIN (Vitamin 132
Riboflavin has an essential role in the release of energy from proteins, fats and carbohydrates. For sedentary men and women, riboflavin requirements may be cor-related with energy intakes but this relationship does not hold for more active people. The Panel decided, therefore, to express DRVs for riboflavin on a daily intake basis.
Information on typical UK intakes, intakes associated with high excretion of the vitamin and measures of tissue saturation were all taken into account to derive the DRVs.
Guidance on high intakes
Absorption of riboflavin in the intestine is limited by its poor solubility. So it is most unlikely that enough could be absorbed to be dangerous. Intakes of 120 mg/d for 10 months were not associated with any adverse effects.
Table 9 Dietary Reference Values for Riboflavin mg/d
Age LRNI EAR RN!
0-12 mo 0.2 0.3 0.4
1-3 yr 0.3 0.5 0.6
4-6 yr 0.4 0.6 0.8
7-I0 yr 0.5 0.8 1.0
Males Females Males Females Males Females
11-14 yr 0.8 0.8 1.0 0.9 1.2 1.1
15-18 yr 0.8 0.8 1.0 0.9 1.3 1.1
19-50+ yr 0.8 0.8 1.0 0.9 1.3 1.1
Additional amounts to be added to pre-pregnancy DRVs
Pregnant women +0.3
Lactating women +0.5
NIACIN (Vitamin B3)
Two related compounds - nicotinic acid and nicotinamide - are both called niacin. They form parts of coenzymes involved in the oxidative re1 ease of energy. Requirements are, therefore, related to energy needs.
In addition to the pre-formed vitamin occurring in foods, one of the essential amino acids, tryptophan, may be converted in the body to niacin. In most people, the conversion is
niacin = trvDtonhan
26
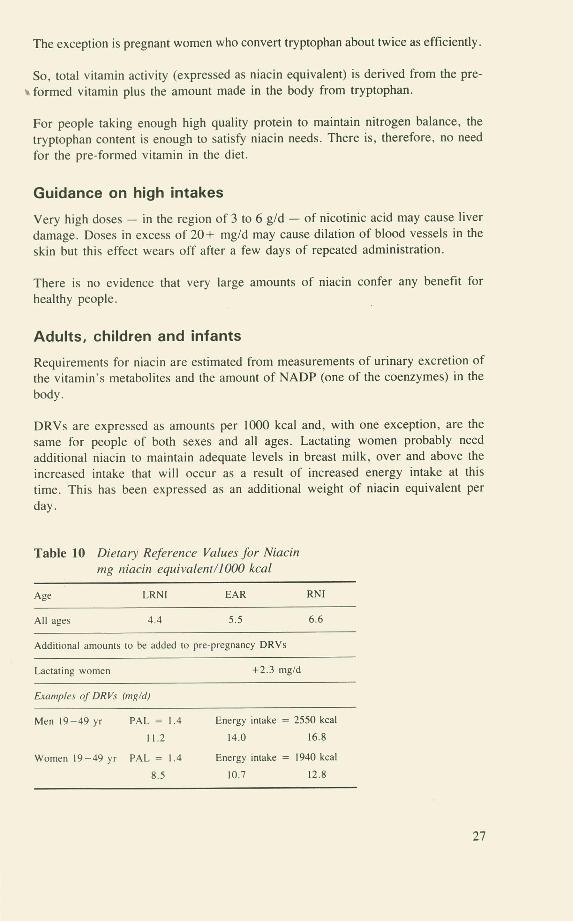
The exception is pregnant women who convert tryptophan about twice as efficiently.
So, total vitamin activity (expressed as niacin equivalent) is derived from the pre-a formed vitamin plus the amount made in the body from tryptophan.
For people taking enough high quality protein to maintain nitrogen balance, the tryptophan content is enough to satisfy niacin needs. There is, therefore, no need for the pre-formed vitamin in the diet.
Guidance on high intakes
Very high doses - in the region of 3 to 6 g/d - of nicotinic acid may cause liver
damage. Doses in excess of 20+ mg/d may cause dilation of blood vessels in the skin but this effect wears off after a few days of repeated administration.
There is no evidence that very large amounts of niacin confer any benefit for
healthy people.
Adults, children and infants
Requirements for niacin are estimated from measurements of urinary excretion of the vitamin's metabolites and the amount of NADP (one of the coenzymes) in the
body.
DRVs are expressed as amounts per 1000 kcal and, with one exception, are the same for people of both sexes and all ages. Lactating women probably need additional niacin to maintain adequate levels in breast milk, over and above the increased intake that will occur as a result of increased energy intake at this time. This has been expressed as an additional weight of niacin equivalent per
day.
Table 10 Dietary Reference Values for Niacin ing niacin equivalent/1000 kcal
Age LRNI EAR RNI
All ages 4.4 5.5 6.6
Additional amounts to be added to pre-pregnancy DRVs
Lactating women +2.3 mg/d
Examples of DRVs mg/d)
Men 19-49 yr PAL = 1.4 Energy intake = 2550 kcal
11.2 14.0 16.8
Women 19-49 yr PAL = 1.4 Energy intake = 1940 kcal
8.5 10.7 12.8
27

VITAMIN B6
Vitamin B6 is a mixture of compounds that are all interconvertible. They are of central importance in the body's protein metabolism. Requirements are, therefore, related to the amounts of amino acids that are metabolised and DRVs are based on current protein intakes in the UK.
Adults and children
Requirements have been estimated mainly from measuring blood vitamin B6 levels and changes in the metabolism of two amino acids - methionine and tryptophan - during depletion and repletion studies.
Although blood concentrations of vitamin B6 fall during pregnancy, there is no evidence of any benefit in raising these levels. Neither is there any evidence of additional need (measured on a gIg protein basis) during lactation.
Oral contraceptives do not increase requirements for the vitamin.
Infants
DRVs for formula-fed infants are based on the vitamin B6 concentration in breastmilk.
Guidance on high intakes
Very high intakes of vitamin B6 may help to counter some of the undesirable side effects of contraceptive steroids in some women. However, high intakes have been associated with impaired function of sensory nerves. The amounts of the vitamin involved have varied from 50 mg/d to 2 to 7 g/d. Return to normal intakes has led to the return of normal or near normal nerve function.
Table 11 Dietary Reference Values for Vitamin B6 p.g/g protein
Age LRN! EAR RN!
0-6 mo 3.5 6 8
7-9 mo 6 8 10
10-12 mo 8 10 13
from I yr II 13 15
Examples of DRVs (mg/d. based on actual protein intake (14.7% of total energy) and EARs for energy
mg/d
Men 19-49 yr Energy intake = 2550 kcal
1.0 1.2 1.4
Women 19-49 yr Energy intake = 1940 kcal
0.8 0.9 1.2
28

VITAMIN B12
Vitamin 1312 is needed to help produce the myelin sheaths around nerves and is also involved with folic acid in the metabolism of some amino acids. Deficiency of vitamin 1312 leads to megaloblastic anaemia and neurological problems.
Adults
DRVs have been derived from three types of study - intakes of groups known to
eat few vitamin 1312-containing foods but who do not have megaloblastic anaemia; amounts of the vitamin needed to effect a slow cure of vitamin B12-deficiency anaemia; and the response of anaemic patients to parenteral vitamin 1312 . The RNI
of vitamin 1312 is enough not only to prevent anaemia but also to create liver stores of the vitamin.
Infants and children
DRVs are based on the amount of the vitamin that was needed to cure megaloblastic anaemia in infants fed breastmilk which was low in vitamin 1312 .
Values for children have been interpolated between the values for infants and adults.
Guidance on high intakes
High intakes of vitamin 1312 are not dangerous. Injected amounts as large as 3 mg/d have not been associated with harmful effects.
Table 12 Dietary, Reference Values for Vitamin B12 g/d
Age LRNI EAR RN!
0-6 mo 0.10 0.25 0.30
7-12 mo 0.25 0.35 0.40
1-3 yr 0.30 0.40 0.50
4-6 yr 0.50 0.70 0.80
7-10 yr 0.60 0.80 1.00
11-14 yr 0.80 1.00 1.20
15+ yr 1.00 1.25 1.50
Additional amounts to be added to pre-pregnancy DRVs
Lactating women +0.5
FOLATE
Folate is the generic name for a large number of compounds derived from folic acid. Although some forms of folate in foods are more available than others, the
PTIJ
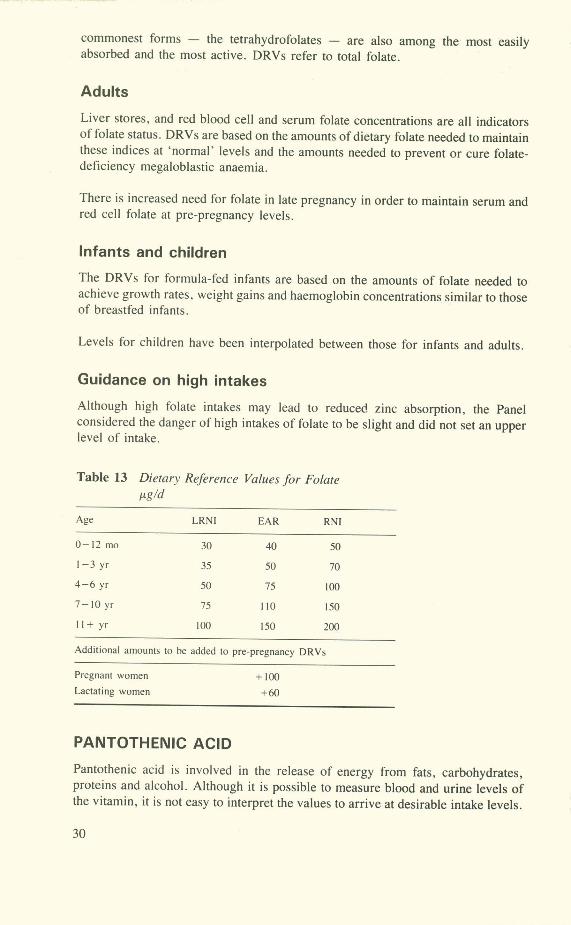
commonest forms - the tetrahydrofolates - are also among the most easily absorbed and the most active. DRVs refer to total folate.
Adults
Liver stores, and red blood cell and serum folate concentrations are all indicators of folate status. DRVs are based on the amounts of dietary folate needed to maintain these indices at 'normal' levels and the amounts needed to prevent or cure folate-deficiency megaloblastic anaemia.
There is increased need for folate in late pregnancy in order to maintain serum and red cell folate at pre-pregnancy levels.
Infants and children
The DRVs for formula-fed infants are based on the amounts of folate needed to achieve growth rates, weight gains and haemoglobin concentrations similar to those of breastfed infants.
Levels for children have been interpolated between those for infants and adults.
Guidance on high intakes
Although high folate intakes may lead to reduced zinc absorption, the Panel considered the danger of high intakes of folate to be slight and did not set an upper level of intake.
Table 13 Dietary Reference Values for Folate
Age LRNI EAR RNI
0-12 mo 30 40 50
1-3 yr 35 50 70
4-6 yr 50 75 100
7-10yr 75 110 150
11+ yr 100 ISO 200
Additional amounts to be added to pre-pregnancy DRVs
Pregnant women + 100 Lactating women +60
PANTOTHENIC ACID
Pantothenic acid is involved in the release of energy from fats, carbohydrates, proteins and alcohol. Although it is possible to measure blood and urine levels of the vitamin, it is not easy to interpret the values to arrive at desirable intake levels.
30

Adults and children
There are no DRVs for pantothenic acid but the Panel considered that current UK intakes of 3 to 7 mg/d are adequate or more than adequate.
Infants
The Panel endorsed the value of 1.7 mg/d (equivalent to 3 mg/1000 kcal) recom-mended by DHSS (1980).
Guidance on high intakes
High intakes of pantothenic acid are not dangerous and intakes of 10 g/d as calcium pantothenate for six weeks were associated with only mild and reversible gastro-intestinal disturbances.
1KOCIM-011
There have been no studies of biotin requirements but current intakes are 10 to 70 g/d and there is no evidence of biotin deficiency. The Panel concluded that intakes
of 10 to 200 g/d were both adequate and safe.
Guidance on high intakes
Very little information is available but intakes up to 200 Lg/d are certainly safe.
VITAMIN C
Humans, unlike most animals, do not synthesise vitamin C and therefore have a dietary requirement for this nutrient. Animals which synthesise their vitamin C have tissues which are saturated with the vitamin. There has been considerable debate about whether or not intakes in humans should be large enough to achieve the same state of tissue saturation.
Such a high level of intake is not necessary for vitamin C to perform its known functions of promoting wound healing and preventing the symptoms of scurvy.
DRVs are based on the amount of vitamin C needed to prevent the signs and symptoms of scurvy, on vitamin C turnover studies and on biochemical indices of vitamin C status in humans.
Adults and children
10 mg/d of vitamin C is sufficient to prevent and to cure all the clinical signs of scurvy. But it is not enough to give measurable plasma levels of the vitamin. Vitamin C begins to appear in plasma at intakes of about 30 mg/d and reaches a maximum concentration with intakes of about 70 mg/d.
Significant amounts of vitamin C are present in plasma when intakes are 40 mg/d.
31

The EAR has been calculated by interpolation between 10 mg selected as the LRNI and 40 mg as the RN!.
The additional DRVs for lactation are enough to provide adequate vitamin C levels in breastmilk and to maintain maternal stores.
Smoking increases vitamin C requirements significantly.
Infants
DRVs are based on the amounts of vitamin C which prevent scurvy.
Guidance on high intakes
Intakes at levels of 20 times the RN!, or more, have been associated with diarrhoea and increased risk of developing oxalate kidney stones in susceptible people. There is no conclusive evidence that amounts of 1 g or more of vitamin C offer protection against the common cold, cancer or any other disorder. If people who are used to such high intakes suddenly revert to 'normal' intakes, they may develop signs of scurvy.
Table 14 Dietary Reference Values for Vitamin C mg/d
Age LRNI EAR RNI
0-12mo 6 15 25
1-10yr 8 20 30
1I—I4yr 9 22 35
15+ yr 10 25 40
Addittonal amounts to be added to pre-pregnancy DRVs
Pregnant women + 10
Lactating women +30
VITAMIN D
Vitamin D is needed for the absorption of calcium and its utilisation in the body
In the UK, people whose skins are exposed to the sun's ultraviolet radiation are capable of synthesising enough vitamin D during the months of April through October to satisfy needs during those months and to build up liver stores to last through the other five months of the year.
DRVs are based on the need to maintain adequate blood levels of a metabolite of vitamin D - 25-hydroxyvitamin D - throughout the year. This substance is con-verted in the kidney to 1 ,25-dihydroxyvitamin D - the active compound which promotes calcium absorption and deposition in bone.
32
Adults
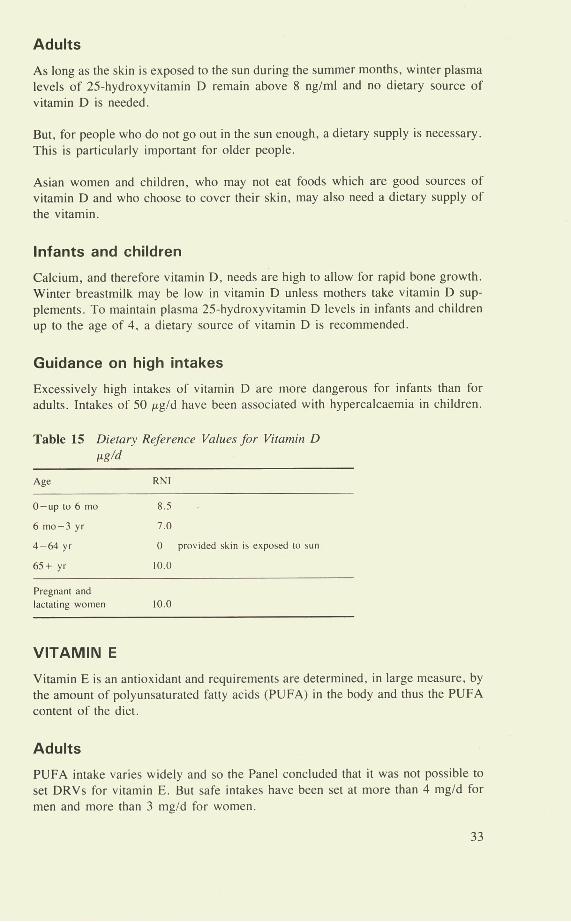
As long as the skin is exposed to the sun during the summer months, winter plasma levels of 25-hydroxyvitamin D remain above 8 ng/ml and no dietary source of vitamin D is needed.
But, for people who do not go out in the sun enough, a dietary supply is necessary. This is particularly important for older people.
Asian women and children, who may not eat foods which are good sources of vitamin D and who choose to cover their skin, may also need a dietary supply of the vitamin.
Infants and children
Calcium, and therefore vitamin D, needs are high to allow for rapid bone growth. Winter breastmilk may be low in vitamin D unless mothers take vitamin D sup-plements. To maintain plasma 25-hydroxyvitamin D levels in infants and children up to the age of 4, a dietary source of vitamin D is recommended.
Guidance on high intakes
Excessively high intakes of vitamin D are more dangerous for infants than for adults. Intakes of 50 sg/d have been associated with hypercalcaemia in children.
Table 15 Dietary Reference Values for Vitamin D 1ug/d
Age RNI
0—up to 6 mo 8.5
6 mo-3 yr 7.0
4-64 yr 0 provided skin is exposed to sun
65+ yr 10.0
Pregnant and
lactating women 10.0
VITAMIN E
Vitamin E is an antioxidant and requirements are determined, in large measure, by the amount of polyunsaturated fatty acids (PUFA) in the body and thus the PUFA content of the diet.
Adults
PUFA intake varies widely and so the Panel concluded that it was not possible to set DRVs for vitamin E. But safe intakes have been set at more than 4 mg/d for men and more than 3 mg/d for women.
33

Infants
Safe intakes are based on the vitamin E content of breastmilk. Infant formulae should provide not less than 0.3 mgl100 ml and not less than 0.4 mglg PUFA.
An indication of appropriate intakes may also be derived by relating vitamin E intake to the DRV for PUFA intake (6% of total energy) suggested by the Panel.
Table 16 Examples of Average Intakes
These daily intakes are based on 0.4 mg vitamin E equivalent/g PUFA; PUFA = 6% total energy intake
mg/d
Men 19-49 yr Energy intake = 2550 kcal
7
Women 19-49 yr Energy intake = 1940 kcal
5
Guidance on high intakes
Few adverse effects have been reported from doses of vitamin E up to 3200 nig/d.
VITAMIN K
Vitamin K is the precursor of several compounds needed to enable blood to clot. Clotting time, therefore, gives an indication of vitamin K status.
Adults
Few studies have been made to estimate adults' vitamin K requirements or to gather accurate data on the vitamin K contents of foods.
Too little information exists to establish accurate DRVs for vitamin K but intakes of I /Lg/kg body weight/d are safe and seem to be adequate.
Infants
Haemorrhagic disease is a rare life-threatening condition caused by vitamin K deficiency in early life. To protect against its occurrence, many paediatricians recommend that newborn babies receive a single dose of vitamin K, usually at birth. Thereafter, an intake of 10 sg/d (equivalent to 2 beg/kg) is suggested as both safe and adequate.
Guidance on high intakes
Naturally-occurring vitamin K is free from harmful effects even when taken in milligram quantities ie at least 100 times the safe intake. But the Panel concluded that synthetic preparations of menadione (a form of vitamin K) are better avoided.
34

OTHER ORGANIC COMPOUNDS
Foods contain thousands of other organic compounds, some of which have biological effects. The Panel reviewed the literature on compounds such as caffeine, lecithin, ornithine, bioflavonoids and para-amino benzoic acid but was not convinced that any of them isa dietary essential. The only two possible exceptions are taurine and carnitine which may be needed by premature infants.
35
Minerals
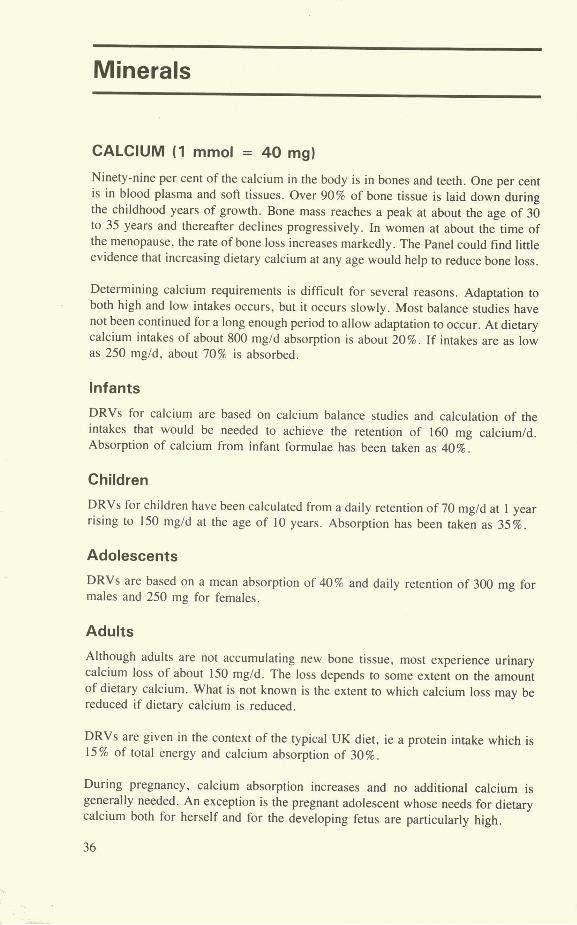
CALCIUM (1 mmol = 40 mg)
Ninety-nine per cent of the calcium in the body is in bones and teeth. One per cent is in blood plasma and soft tissues. Over 90% of bone tissue is laid down during the childhood years of growth. Bone mass reaches a peak at about the age of 30 to 35 years and thereafter declines progressively. In women at about the time of the menopause, the rate of bone loss increases markedly. The Panel could find little evidence that increasing dietary calcium at any age would help to reduce bone loss.
Determining calcium requirements is difficult for several reasons. Adaptation to both high and low intakes occurs, but it occurs slowly. Most balance studies have not been continued for a long enough period to allow adaptation to occur. At dietary calcium intakes of about 800 mg/d absorption is about 20%. If intakes are as low as 250 mg/d, about 70% is absorbed.
Infants
DRVs for calcium are based on calcium balance studies and calculation of the intakes that would be needed to achieve the retention of 160 mg calcium/d. Absorption of calcium from infant formulae has been taken as 40%.
Children
DRVs for children have been calculated from a daily retention of 70 mg/d at 1 year rising to 150 mg/d at the age of 10 years. Absorption has been taken as 35%.
Adolescents
DRVs are based on a mean absorption of 40% and daily retention of 300 mg for males and 250 mg for females.
Adults
Although adults are not accumulating new bone tissue, most experience urinary calcium loss of about 150 mg/d. The loss depends to some extent on the amount of dietary calcium. What is not known is the extent to which calcium loss may be reduced if dietary calcium is reduced.
DRVs are given in the context of the typical UK diet, ie a protein intake which is 15% of total energy and calcium absorption of 30%.
During pregnancy, calcium absorption increases and no additional calcium is generally needed. An exception is the pregnant adolescent whose needs for dietary calcium both for herself and for the developing fetus are particularly high.
36

There is no conclusive evidence that a high calcium intake in the elderly prevents bone loss but information is scanty. For pen- and post-menopausal women receiving oestrogen therapy, calcium supplements may permit a reduced effective oestrogen dose.
Guidance on high intakes
Increased intake of calcium leads to progressively reduced rates of absorption. Accumulation of calcium may be caused by failure of the body's control mechanism, not by high dietary intakes. The Panel was not convinced that any benefit would accrue from intakes as high as 2 g/d which are sometimes recommended for the prevention or treatment of osteoporosis. But, because high intakes of calcium are not associated with any detrimental effects, it may be prudent for those at particularly high risk of osteoporosis to take diets which are richer in calcium.
Table 17 Dietary Reference Values for Calcium mg/d
Age LRNI EAR RNI
0-12 mo 240 400 525
1-3 yr 200 275 350
4-6 yr 275 350 450
7-10 yr 325 425 550
Males Females Males Females Males Females
11-14 yr 450 480 750 625 1000 800
15-18 yr 450 480 750 625 1000 800
19+ yr 400 400 525 525 700 700
Additional amounts to be added to pre-pregnancy DRVs
Lactating women +550
PHOSPHORUS 0 mmol = 30.9 mg)
The major part of the phosphorus in the body is associated with calcium in bone. These two minerals are present in roughly equimolar amounts but (because they have different atomic weights) not in equal weights.
Infants, adults and children
DRVs for phosphorus are based on DRVs for calcium - when measured in mmol. For infants, it is particularly important that this balance between calcium and phosphorus is maintained.
37
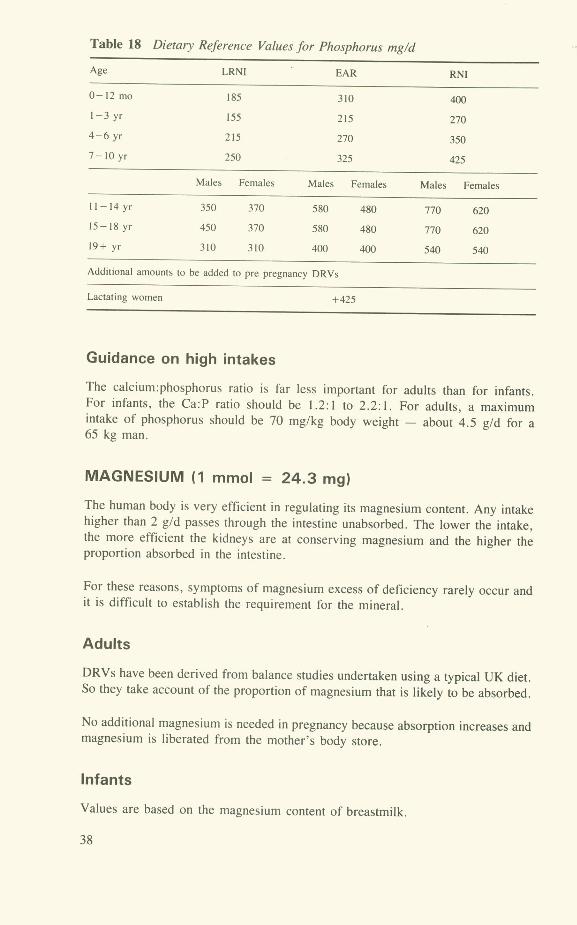
Table 18 Dietary Reference Values for Phosphorus mg/d
Age LRNI EAR RN!
0-12mo 185 310 400
1-3 yr 155 215 270
4-6 yr 215 270 350
7-10yr 250 325 425
Males Females Males Females Males Females
11-14 yr 350 370 580 480 770 620
15-18 yr 450 370 580 480 770 620
19+ yr 310 310 400 400 540 540
Additional amounts to be added to pre pregnancy DRVs
Lactating women +425
Guidance on high intakes
The calcium:phosphorus ratio is far less important for adults than for infants. For infants, the Ca:P ratio should be 1.2:1 to 2.2:1. For adults, a maximum intake of phosphorus should be 70 mg/kg body weight - about 4.5 g/d for a 65 kg man.
MAGNESIUM (1 mmol = 24.3 mg)
The human body is very efficient in regulating its magnesium content. Any intake higher than 2 g/d passes through the intestine unabsorbed. The lower the intake, the more efficient the kidneys are at conserving magnesium and the higher the proportion absorbed in the intestine.
For these reasons, symptoms of magnesium excess of deficiency rarely occur and it is difficult to establish the requirement for the mineral.
Adults
DRVs have been derived from balance studies undertaken using a typical UK diet. So they take account of the proportion of magnesium that is likely to be absorbed.
No additional magnesium is needed in pregnancy because absorption increases and magnesium is liberated from the mother's body store.
Infants
Values are based on the magnesium content of breastmilk.
38
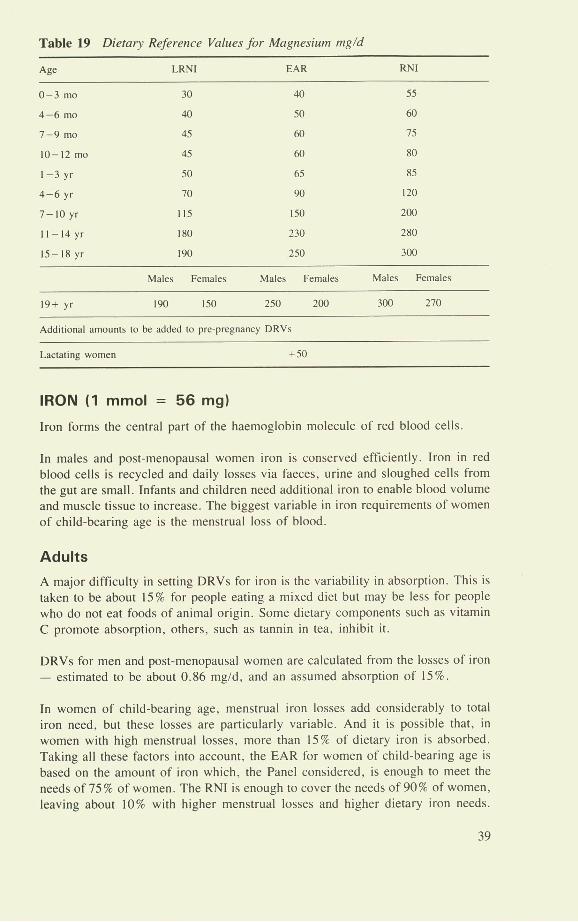
Table 19 Dietary Reference Values for Magnesium mg/d
Age LRNI EAR RNI
0-3 mo 30 40 55
4-6 mo 40 50 60
7-9 mo 45 60 75
10-12m0 45 60 80
1-3yr 50 65 85
4-6 yr 70 90 120
7-10 yr 115 ISO 200
1I-14yr ISO 230 280
15-18 yr 190 250 300
Males Females Males Females Males Females
19+ yr 190 150 250 200 300 270
Additional amounts to be added to pre-pregnancy DRVs
Lactating women +50
IRON (1 mmol = 56 mg)
Iron forms the central part of the haemoglobin molecule of red blood cells
In males and post-menopausal women iron is conserved efficiently. Iron in red blood cells is recycled and daily losses via faeces, urine and sloughed cells from the gut are small. Infants and children need additional iron to enable blood volume and muscle tissue to increase. The biggest variable in iron requirements of women of child-bearing age is the menstrual loss of blood.
Adults
A major difficulty in setting DRVs for iron is the variability in absorption. This is taken to be about 15% for people eating a mixed diet but may be less for people who do not eat foods of animal origin. Some dietary components such as vitamin C promote absorption, others, such as tannin in tea, inhibit it.
DRVs for men and post-menopausal women are calculated from the losses of iron - estimated to be about 0.86 mg/d, and an assumed absorption of 15%.
In women of child-bearing age, menstrual iron losses add considerably to total iron need, but these losses are particularly variable. And it is possible that, in women with high menstrual losses, more than 15% of dietary iron is absorbed. Taking all these factors into account, the EAR for women of child-bearing age is based on the amount of iron which, the Panel considered, is enough to meet the needs of 75% of women. The RNI is enough to cover the needs of 90% of women, leaving about 10% with higher menstrual losses and higher dietary iron needs.
39
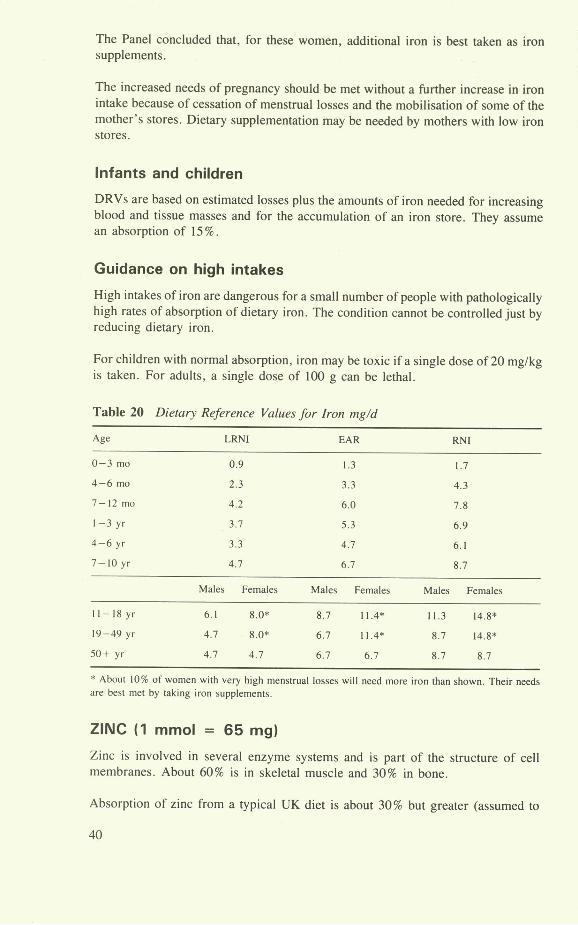
The Panel concluded that, for these women, additional iron is best taken as iron supplements.
The increased needs of pregnancy should be met without a further increase in iron intake because of cessation of menstrual losses and the mobilisation of some of the mother's stores. Dietary supplementation may be needed by mothers with low iron stores.
Infants and children
DRVs are based on estimated losses plus the amounts of iron needed for increasing blood and tissue masses and for the accumulation of an iron store. They assume an absorption of 15%.
Guidance on high intakes
High intakes of iron are dangerous for a small number of people with pathologically high rates of absorption of dietary iron. The condition cannot be controlled just by reducing dietary iron.
For children with normal absorption, iron may be toxic if a single dose of 20 mg/kg is taken. For adults, a single dose of 100 g can be lethal.
Table 20 Dietary Reference Values for Iron mg/d
Age LRNI EAR RNI
0-3 ma 0.9 1.3 1.7
4-6 mo 2.3 3.3 4.3
7-12 ma 4.2 6.0 7.8
1-3 yr 3.7 5.3 6.9
4-6 yr 3.3 4.7 6.1
7-10 yr 4.7 6.7 8.7
Males Females Males Females Males Females
11-18 yr 6.1 8.0* 8.7 11.4* 11.3 14.8*
19-49 yr 4.7 8.0* 6.7 114* 8.7 14.8*
50+ yr 4.7 4.7 6.7 6.7 8.7 8.7
* About 10% of women with very high menstrual losses will need more iron than shown. Their needs are best met by taking iron supplements.
ZINC 0 mmol = 65 mg)
Zinc is involved in several enzyme systems and is part of the structure of cell membranes. About 60% is in skeletal muscle and 30% in bone.
Absorption of zinc from a typical UK diet is about 30% but greater (assumed to
40
be 50%) at intakes around the Lower Reference Nutrient Intake. Absorption also increases during pregnancy so no additional intake is necessary at that time. The concentration of zinc in pancreatic juice is high but much of the mineral is re-absorbed. So losses of zinc are, generally, low.
Adults
DRVs have been derived from calculations of basal losses, studies of zinc turnover and metabolic studies of patients on total parenteral feeding.
Infants and children
DRVs for infants have been derived by adding estimated needs for growth to basal losses. Those for children are interpolated from adult values.
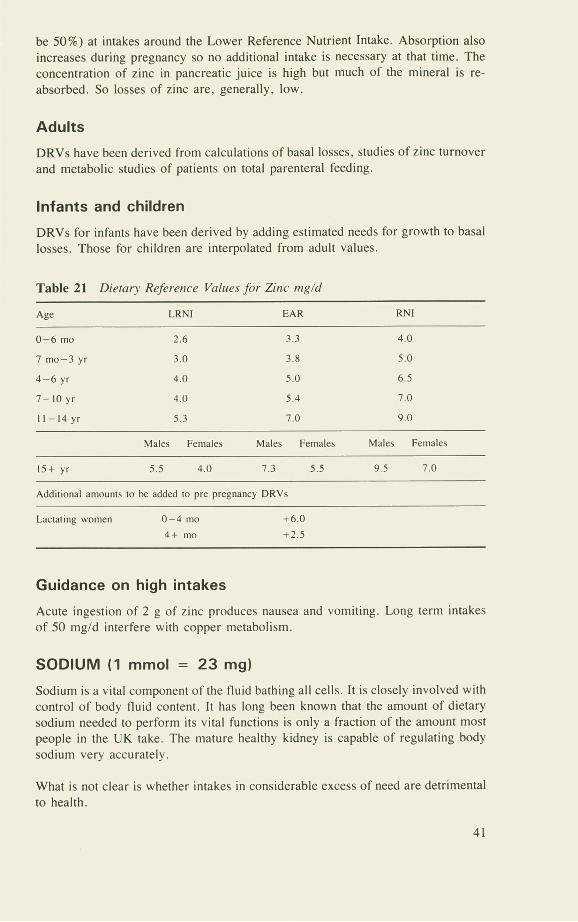
Table 21 Dietary Reference Values for Zinc tng/d
Age LRNI EAR RNI
0-6 mo 2.6 3.3 4.0
7 mo-3 yr 3.0 3.8 5.0
4-6 yr 4.0 5.0 6.5
7-10 yr 4.0 5.4 7.0
11-14 yr 5.3 7.0 9.0
Males Females Males Females Males Females
15+ yr 5.5 4.0 7.3 5.5 9.5 7.0
Additional amounts to be added to pre pregnancy DRVs
Lactating women 0-4 mo +6.0
4+ mo +2.5
Guidance on high intakes
Acute ingestion of 2 g of zinc produces nausea and vomiting. Long term intakes of 50 mg/d interfere with copper metabolism.
SODIUM (1 mmol = 23 mg)
Sodium is a vital component of the fluid bathing all cells. It is closely involved with control of body fluid content. It has long been known that the amount of dietary sodium needed to perform its vital functions is only a fraction of the amount most people in the UK take. The mature healthy kidney is capable of regulating body sodium very accurately.
What is not clear is whether intakes in considerable excess of need are detrimental to health.
41
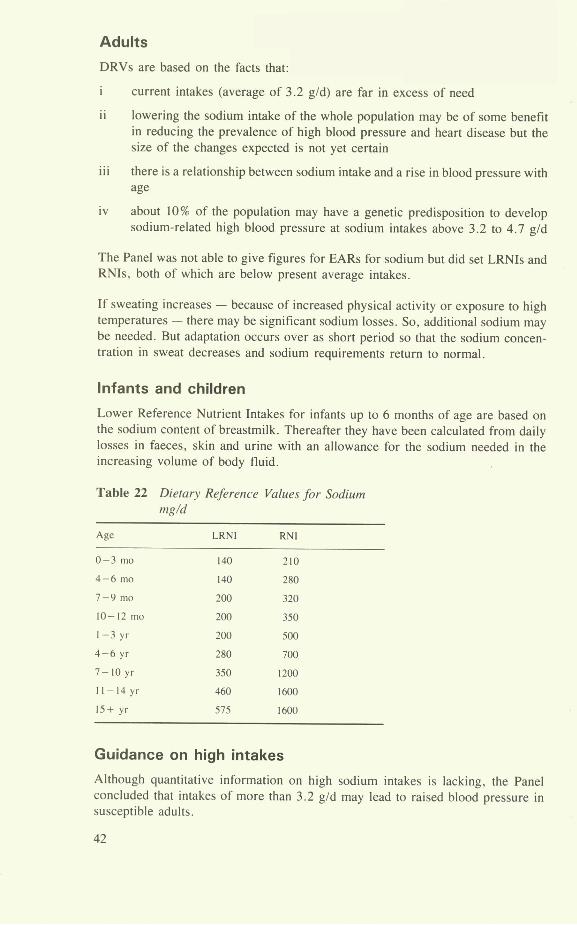
tOO f) Adults -
DRVs are based on the facts that:
i current intakes (average of 3.2 g/d) are far in excess of need
ii lowering the sodium intake of the whole population may be of some benefit in reducing the prevalence of high blood pressure and heart disease but the size of the changes expected is not yet certain
iii there is a relationship between sodium intake and a rise in blood pressure with age
iv about 10% of the population may have a genetic predisposition to develop sodium-related high blood pressure at sodium intakes above 3.2 to 4.7 g/d
The Panel was not able to give figures for EARs for sodium but did set LRNIs and RNIs, both of which are below present average intakes.
If sweating increases - because of increased physical activity or exposure to high temperatures - there may be significant sodium losses. So, additional sodium may be needed. But adaptation occurs over as short period so that the sodium concen-tration in sweat decreases and sodium requirements return to normal.
Infants and children
Lower Reference Nutrient Intakes for infants up to 6 months of age are based on the sodium content of breastmilk. Thereafter they have been calculated from daily losses in faeces, skin and urine with an allowance for the sodium needed in the increasing volume of body fluid.
Table 22 Dieta,' Reference Values for Sodium mg/d
Age LRNI RN!
0-3 mo 140 210
4-6 mo 140 280
7-9 mo 200 320
10-12 mo 200 350
1-3 yr 200 500
4-6 yr 280 700
7-10yr 350 1200
tt-14yr 460 1600
15+ yr 575 1600
Guidance on high intakes
Although quantitative information on high sodium intakes is lacking, the Panel concluded that intakes of more than 3.2 g/d may lead to raised blood pressure in susceptible adults.
42
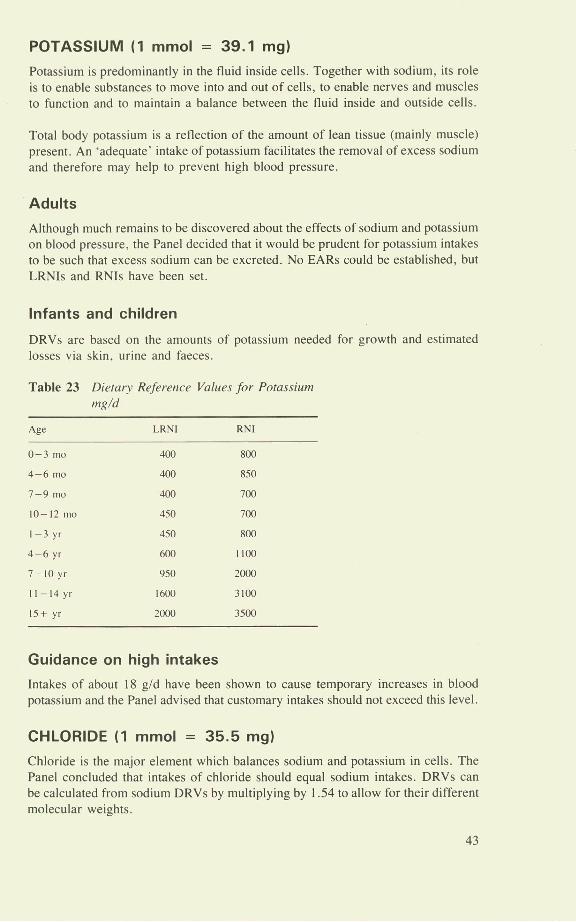
POTASSIUM (1 mmol = 39.1 mg)
Potassium is predominantly in the fluid inside cells. Together with sodium, its role is to enable substances to move into and out of cells, to enable nerves and muscles to function and to maintain a balance between the fluid inside and outside cells.
Total body potassium is a reflection of the amount of lean tissue (mainly muscle) present. An 'adequate' intake of potassium facilitates the removal of excess sodium and therefore may help to prevent high blood pressure.
Adults
Although much remains to be discovered about the effects of sodium and potassium on blood pressure, the Panel decided that it would be prudent for potassium intakes to be such that excess sodium can be excreted. No EARs could be established, but LRNIs and RNIs have been set.
Infants and children
DRVs are based on the amounts of potassium needed for growth and estimated losses via skin, urine and faeces.
Table 23 Dietary Reference Values for Potassium mg/d
Age LRNI RN!
0-3 mo 400 800
4-6 mo 400 850
7-9 mo 400 700
10-12 mo 450 700
1-3 yr 450 800
4-6 yr 600 1100
7-10 yr 950 2000
11—I4yr 1600 3100
15+ yr 2000 3500
Guidance on high intakes
Intakes of about 18 g/d have been shown to cause temporary increases in blood potassium and the Panel advised that customary intakes should not exceed this level.
CHLORIDE (1 mmol = 35.5 mg)
Chloride is the major element which balances sodium and potassium in cells. The Panel concluded that intakes of chloride should equal sodium intakes. DRVs can be calculated from sodium DRVs by multiplying by 1.54 to allow for their different molecular weights.
43

COPPER 1 itmol = 63.5 jtg
There is only a small amount of information about the need for copper, and the Panel was able to set only RNIs.
TabLe 24 Dietary Reference Values for Copper mg/d
Age RNI
0-12 mo 0.3
l-3yr 0.4
4-6 yr 0.6
7—lOyr 0.7
II-14yr 0.8
15-16 yr 1.0
18+ yr 1.2
Amounts to be added to pre-pregnancy DRVs
Lactating women +0.3
Guidance on high intakes
Although high intakes of copper are harmful, little detailed information is available. In some countries, copper levels of 1.6 mg/I in drinking water have been associated with toxic effects.
IODINE 1 moI = 127 Itg
Iodine is needed for the production of thyroid hormones which help to con-trol metabolism, and in infants, to ensure normal development of the nervous system.
Adults
DRVs have been derived from studies of habitual intakes and the incidence of iodine-deficiency goitre. No EARs could be established but values for LRNIs and RNIs have been set.
Infants
DRVs for infants are based on studies of the iodine content of breastmilk.
44

Table 25 Dietary Reference Values for Iodine 1tg/d
Age LRNI RNI
0-3 mo 40 50
4—I2mo 40 60
1-3yr 40 70
4-6 yr 50 100
7-10 yr 55 110
I1—I4yr 65 130
15+ yr 70 140
Guidance on high intakes
Excessively high intakes of iodine cause hyperthyroidism and some people are more sensitive than others to iodine. An upper intake of 17 tg/kg/d or no more than 1000 ttgld has been set.
SELENIUM 1 Itmol = 79 jAg
Selenium is part of an enzyme that helps to prevent structures inside cells being oxidised. The amount of this enzyme increases with increasing selenium intake up to a point. Thereafter, additional dietary selenium has no effect on the amount of the enzyme. Levels of the mineral in blood, tissues and urine all reflect dietary intake. About 55% of dietary selenium is absorbed.
The Panel found no evidence that high intakes of selenium help to prevent cancer or that smoking or oral contraceptives increase selenium requirements.
DRVs have been set for LRNI and RNI but insufficient information about human requirements was available to enable the Panel to set EARs.
Table 26 Dietary Reference Values for Selenium tg/d
Age LRNI RNI
0-3mo 4 10
4-6mo 5 13
7-9mo 5 10
10—I2mo 6 10
l-3yr 7 IS
4-6 yr 10 20
7-10 yr 16 30
I1-14yr 25 45
Males Females Males Females
15-18 yr 40 40 70 60
19+ yr 40 40 75 60
Lactating women + IS + 15
45

Guidance on high intakes
The upper intake has been set at 6 jiglkgld for adults.
OTHER MINERALS
The Panel considered many other minerals and was able to set Safe Intakes for several of them.
Table 27 Safe Intakes for Other Minerals
Molybdenum 50-400 sg/d adults
0.5— 1.5 g/kg/d infants, children and adolescents.
Manganese more than 1.4 mg/d adults
16 sg/kg/d infants and children
Chromium more than 25 g/d adults
0.1 - 1.0 /Ag/kg/d children and adolescents.
Fluoride 0.05 mg/kg/d upper limit for infants and young children.
46
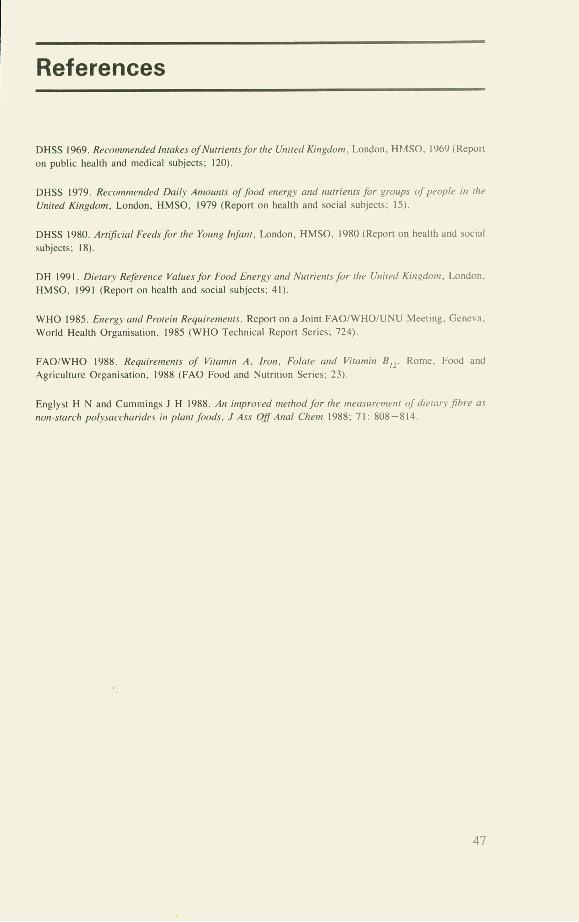
References
DHSS 1969. Recommended Intakes of Nutrients for the United Kingdom, London, HMSO. 1969 (Report on public health and medical subjects; 120).
DHSS 1979. Recommended Daily Amounts of fbod energy and nutrients for groups of people in the United Kingdom, London, HMSO, 1979 (Report on health and social subjects; IS).
DHSS 1980. Artificial Feeds for the Young Infant, London, HMSO. 1980 (Report on health and social
subjects; 18).
DH 1991. Dicta cv Reference Values for Food Energy and Nutrients for the United Kingdom, London,
HMSO. 1991 (Report on health and social subjects; 41).
WHO 1985. Energy and Protein Requirements. Report on a Joint FAOIWHOIUNU Meeting, Geneva, World Health Organisation. 1985 (WHO Technical Report Series; 724).
FAO/WHO 1988. Requirements of Vitamin A, Iron, Folate and Vitamin B171 Rome, Food and
Agriculture Organisation. 1988 (FAO Food and Nutrition Series; 23).
Englyst H N and Cummings J H 1988. An improved method for the measurement of dietary fibre as
non-starch polysaccharides in plant foods, J Ass Off Anal chem 1988; 71: 808-814.
47

Glossary of Terms and Abbreviations
Terms relating to weight measurement
g gram.
mg milligram or 10 3g or one-thousandth of 1 g.
Ag microgram or 10 6g or one-millionth of I g.
ng nanogram or 10 9g or one-thousand-millionth of 1 g.
kg kilogram or 103g or 1000 g.
mmol millimole = amount of an element or compound equal to the atomic or molecular weight in g x 10- .
Terms relating to energy
kcal kilocalorie = 103 or 1000 calories. A unit used to measure the energy value of food.
kJ kilojoule = 10 or 1000 joules. A unit used to measure the energy value of food I kcal = 4.184 kJ.
MJ megajoule = 106 J or 1 million joules.
BMR Basal Metabolic Rate. Rate at which the body uses energy when the body is at complete rest. Values depend on sex, body weight. For a 65 kg man, BMR is about 7.56 MJId. For a 55 kg woman, BMR is about 5.98 MJ/d.
PAL Physical Activity Level. A multiple of BMR; the ratio of overall daily energy expenditure to BMR. Values range from 1.4 (for a person with light energy expenditure in work who has non-active leisure pursuits) to 1.9 for a man in energy-demanding work whose leisure time pursuits are also energy demanding.
Terms relating to energy and nutrient intakes
RDI Recommended Daily Intakes of Nutrients for the United Kingdom, 1969.
RDA Recommended Daily Amounts of Food Energy and Nutrients for Groups of People in the United Kingdom, 1979.
DRV Dietary Reference Value. A term used to cover LRNI, EAR, RN! and safe intake.
48

EAR Estimated Average Requirement of a group of people for energy or protein or a vitamin or mineral. About half will usually need more than the EAR, and half less.
LRNI Lower Reference Nutrient Intake for protein or a vitamin or mineral. An amount of the nutrient that is enough for only the few people in a group who have low needs.
RN! Reference Nutrient Intake for protein or a vitamin or mineral. An amount of the nutrient that is enough, or more than enough, for most (usually at least 97%) people in a group. If average intake of a group is at RNI, then the risk of deficiency in the group is very small.
Safe intake A term to indicate intake or range of intakes of a nutrient for which there is not enough information to estimate RN!, EAR or LRNI. It is an amount that is enough for almost everyone but not so large as to cause undesirable effects.
Terms relating to fat
Fat Dietary fat - usually triglycerides ie 3 fatty acid molecules joined to I molecule of glycerol.
Fatty acid A molecule of variable length consisting mainly of a carbon chain to which hydrogen atoms are attached.
(EFA) Essential fatty acid. One which cannot be made in the body and which must be supplied by food.
(SFA) Saturated fatty acid. One which contains the maximum possible number of hydrogen atoms.
Monounsaturated fatty acid. One in which each molecule has 2 hydrogen atoms missing. As a result, the molecule is said to contain one double bond.
(PUFA) Polyunsaturated fatty acid. A fatty acid in which each molecule has more than 2 hydrogen atoms missing. As a result, the molecule is said to contain, respectively, 2 or 3 or 4 double bonds.
cis and trans isomers. Terms which relate to the spatial arrangement of atoms in molecules such as monounsaturated or polyunsaturated fatty acids. Most fatty acids which occur naturally in foods are cis.
Cholesterol. It may be ingested in foods such as egg yolk and offal, but most is made in the body. An essential component of every living cell wall, it is transported round the body in blood and may be converted to
vitamin D.
WE
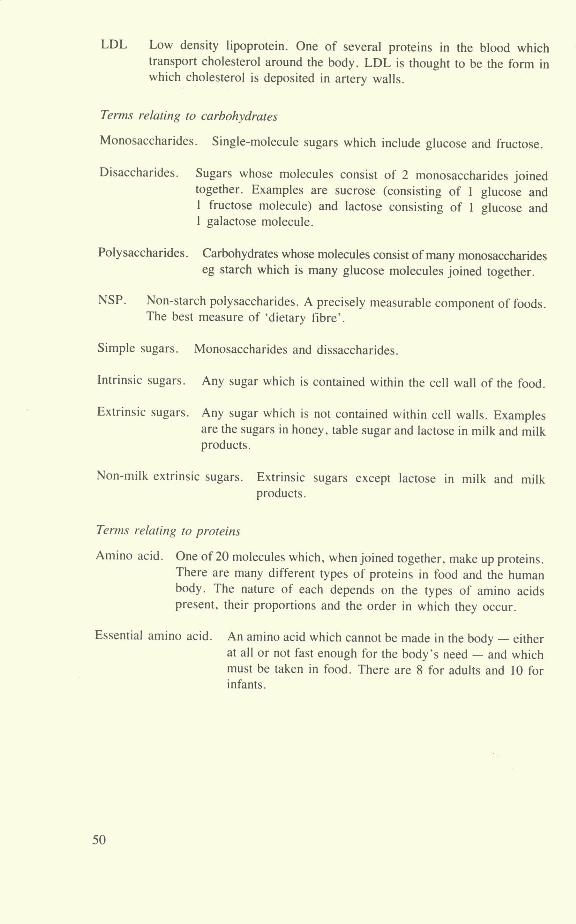
LDL Low density lipoprotein. One of several proteins in the blood which transport cholesterol around the body. LDL is thought to be the form in which cholesterol is deposited in artery walls.
Terms relating to carbohydrates
Monosaccharides. Single-molecule sugars which include glucose and fructose.
Disaccharides. Sugars whose molecules consist of 2 monosaccharides joined together. Examples are sucrose (consisting of 1 glucose and 1 fructose molecule) and lactose consisting of 1 glucose and 1 galactose molecule.
Polysaccharides. Carbohydrates whose molecules consist of many monosaccharides eg starch which is many glucose molecules joined together.
NSP. Non-starch polysaccharides. A precisely measurable component of foods. The best measure of 'dietary fibre'.
Simple sugars. Monosaccharides and dissaccharides.
Intrinsic sugars. Any sugar which is contained within the cell wall of the food.
Extrinsic sugars. Any sugar which is not contained within cell walls. Examples are the sugars in honey, table sugar and lactose in milk and milk products.
Non-milk extrinsic sugars. Extrinsic sugars except lactose in milk and milk products.
Terms relating to proteins
Amino acid. One of 20 molecules which, when joined together, make up proteins. There are many different types of proteins in food and the human body. The nature of each depends on the types of amino acids present, their proportions and the order in which they occur.
Essential amino acid. An amino acid which cannot be made in the body - either at all or not fast enough for the body's need - and which must be taken in food. There are 8 for adults and 10 for infants.
50
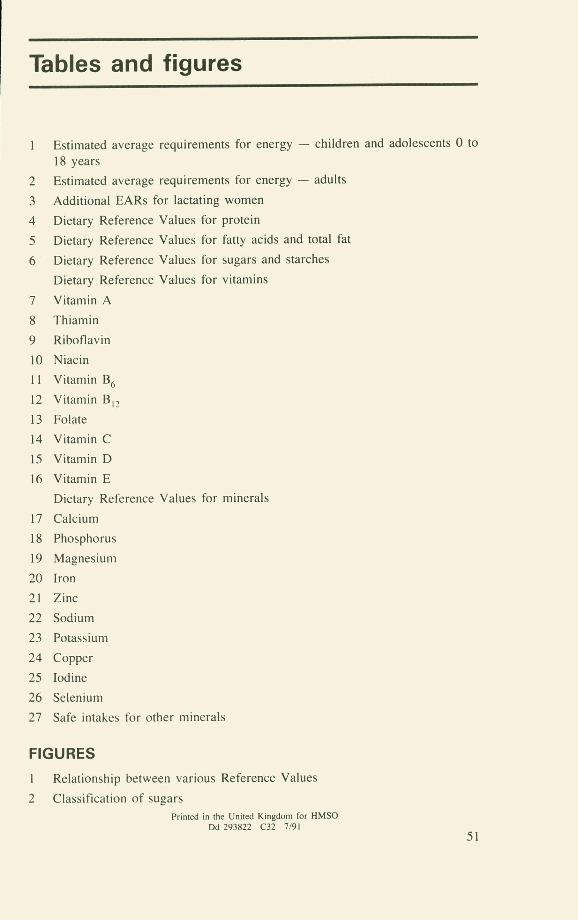
Tables and figures
1 Estimated average requirements for energy - children and adolescents 0 to
18 years
2 Estimated average requirements for energy - adults
3 Additional EARs for lactating women
4 Dietary Reference Values for protein
5 Dietary Reference Values for fatty acids and total fat
6 Dietary Reference Values for sugars and starches
Dietary Reference Values for vitamins
7 Vitamin A
8 Thiamin
9 Riboflavin
10 Niacin
11 Vitamin B6
12 Vitamin 1311
13 Folate
14 Vitamin C
15 Vitamin D
16 Vitamin E
Dietary Reference Values for minerals
17 Calcium
18 Phosphorus
19 Magnesium
20 Iron
21 Zinc
22 Sodium
23 Potassium
24 Copper
25 Iodine
26 Selenium
27 Safe intakes for other minerals
FIGURES
I Relationship between various Reference Values
2 Classification of sugars
Printed in the United Kingdom for HMSO Dd 293822 C32 7/91
51

HMSO publications are available from:
HMSO Publications Centre (Mall and telephone orders only) P0 Box 276, London, SW8 513T Telephone orders 071-8739090 General enquiries 071-8730011 (queuing system in operation for both numbers)
HMSO Bookshops 49 High Hoibom, London, WC1 V 6HB 071-8730011 (counter service only) 258 Broad Street, Birmingham, B1 2HE 021-643 3740 Southey House, 33 Wine Street, Bristol, BS1 2BQ (0272)264306 9-21 Princess Street, Manchester, M60 8AS 061-8347201 80 Chichester Street, Belfast, BT1 4JY (0232) 238451 71 Lothian Road, Edinburgh, EH3 9AZ 031-2284181
HMSO's Accredited Agents (see Yellow Pages)
and through good booksellers
£5.75 net