Dietary reference values for vitamin K
79
University of Dundee Dietary reference values for vitamin K EFSA Panel on Dietetic Products, Nutrition and Allergies (NDA) Published in: EFSA Journal DOI: 10.2903/j.efsa.2017.4780 Publication date: 2017 Licence: CC BY-ND Document Version Publisher's PDF, also known as Version of record Link to publication in Discovery Research Portal Citation for published version (APA): EFSA Panel on Dietetic Products, Nutrition and Allergies (NDA) (2017). Dietary reference values for vitamin K. EFSA Journal, 15(5), [e04780]. https://doi.org/10.2903/j.efsa.2017.4780 General rights Copyright and moral rights for the publications made accessible in Discovery Research Portal are retained by the authors and/or other copyright owners and it is a condition of accessing publications that users recognise and abide by the legal requirements associated with these rights. • Users may download and print one copy of any publication from Discovery Research Portal for the purpose of private study or research. • You may not further distribute the material or use it for any profit-making activity or commercial gain. • You may freely distribute the URL identifying the publication in the public portal. Take down policy If you believe that this document breaches copyright please contact us providing details, and we will remove access to the work immediately and investigate your claim. Download date: 06. Jul. 2022
-
Upload
khangminh22 -
Category
Documents
-
view
0 -
download
0
Transcript of Dietary reference values for vitamin K

University of Dundee
Dietary reference values for vitamin K
EFSA Panel on Dietetic Products, Nutrition and Allergies (NDA)
Published in:EFSA Journal
DOI:10.2903/j.efsa.2017.4780
Publication date:2017
Licence:CC BY-ND
Document VersionPublisher's PDF, also known as Version of record
Link to publication in Discovery Research Portal
Citation for published version (APA):EFSA Panel on Dietetic Products, Nutrition and Allergies (NDA) (2017). Dietary reference values for vitamin K.EFSA Journal, 15(5), [e04780]. https://doi.org/10.2903/j.efsa.2017.4780
General rightsCopyright and moral rights for the publications made accessible in Discovery Research Portal are retained by the authors and/or othercopyright owners and it is a condition of accessing publications that users recognise and abide by the legal requirements associated withthese rights.
• Users may download and print one copy of any publication from Discovery Research Portal for the purpose of private study or research. • You may not further distribute the material or use it for any profit-making activity or commercial gain. • You may freely distribute the URL identifying the publication in the public portal.
Take down policyIf you believe that this document breaches copyright please contact us providing details, and we will remove access to the work immediatelyand investigate your claim.
Download date: 06. Jul. 2022

SCIENTIFIC OPINION
ADOPTED: 5 April 2017
doi: 10.2903/j.efsa.2017.4780
Dietary reference values for vitamin K
EFSA Panel on Dietetic Products, Nutrition and Allergies (NDA),Dominique Turck, Jean-Louis Bresson, Barbara Burlingame, Tara Dean,
Susan Fairweather-Tait, Marina Heinonen, Karen Ildico Hirsch-Ernst, Inge Mangelsdorf,Harry J McArdle, Androniki Naska, Gra _zyna Nowicka, Kristina Pentieva, Yolanda Sanz,
Alfonso Siani, Anders Sj€odin, Martin Stern, Daniel Tom�e, Henk Van Loveren, Marco Vinceti,Peter Willatts, Christel Lamberg-Allardt, Hildegard Przyrembel, Inge Tetens, C�eline Dumas,
Lucia Fabiani, Sofia Ioannidou and Monika Neuh€auser-Berthold
Abstract
Following a request from the European Commission, the EFSA Panel on Dietetic Products, Nutrition andAllergies (NDA) derives dietary reference values (DRVs) for vitamin K. In this Opinion, thePanel considers vitamin K to comprise both phylloquinone and menaquinones. The Panel considers thatnone of the biomarkers of vitamin K intake or status is suitable by itself to derive DRVs for vitamin K.Several health outcomes possibly associated with vitamin K intake were also considered but data couldnot be used to establish DRVs. The Panel considers that average requirements and population referenceintakes for vitamin K cannot be derived for adults, infants and children, and therefore sets adequateintakes (AIs). The Panel considers that available evidence on occurrence, absorption, function andcontent in the body or organs of menaquinones is insufficient, and, therefore, sets AIs forphylloquinone only. Having assessed additional evidence available since 1993 in particular related tobiomarkers, intake data and the factorial approach, which all are associated with considerableuncertainties, the Panel maintains the reference value proposed by the Scientific Committee for Food(SCF) in 1993. An AI of 1 lg phylloquinone/kg body weight per day is set for all age and sex populationgroups. Considering the respective reference body weights, AIs for phylloquinone are set at 70 lg/dayfor all adults including pregnant and lactating women, at 10 lg/day for infants aged 7–11 months, andbetween 12 lg/day for children aged 1–3 years and 65 lg/day for children aged 15–17 years.
© 2017 European Food Safety Authority. EFSA Journal published by John Wiley and Sons Ltd on behalfof European Food Safety Authority.
Keywords: vitamin K, phylloquinone, menaquinones, Adequate Intake, Dietary Reference Value
Requestor: European Commission
Question number: EFSA-Q-2011-01232
Correspondence: [email protected]
EFSA Journal 2017;15(5):4780www.efsa.europa.eu/efsajournal
Panel members: Jean-Louis Bresson, Barbara Burlingame, Tara Dean, Susan Fairweather-Tait, MarinaHeinonen, Karen-Ildico Hirsch-Ernst, Inge Mangelsdorf, Harry J McArdle, Androniki Naska, MonikaNeuh€auser-Berthold, Gra_zyna Nowicka, Kristina Pentieva, Yolanda Sanz, Alfonso Siani, Anders Sj€odin,Martin Stern, Daniel Tom�e, Dominique Turck, Henk Van Loveren, Marco Vinceti and Peter Willatts.
Acknowledgements: The Panel wishes to thank EFSA staff: Krizia Ferrini, Joaquim Maia, ChristosStefanidis and Olga Vidal Pariente for the support provided to this Scientific Opinion.
Suggested citation: EFSA NDA Panel (EFSA Panel on Dietetic Products, Nutrition and Allergies), Turck D,Bresson J-L, Burlingame B, Dean T, Fairweather-Tait S, Heinonen M, Hirsch-Ernst KI, Mangelsdorf I,McArdle HJ, Naska A, Nowicka G, Pentieva K, Sanz Y, Siani A, Sj€odin A, Stern M, Tom�e D, Van Loveren H,Vinceti M, Willatts P, Lamberg-Allardt C, Przyrembel H, Tetens I, Dumas C, Fabiani L, Ioannidou S andNeuh€auser-Berthold M, 2017. Scientific Opinion on the dietary reference values for vitamin K. EFSA Journal2017;15(5):4780, 78 pp. https://doi.org/10.2903/j.efsa.2017.4780
ISSN: 1831-4732
© 2017 European Food Safety Authority. EFSA Journal published by John Wiley and Sons Ltd on behalfof European Food Safety Authority.
This is an open access article under the terms of the Creative Commons Attribution-NoDerivs License,which permits use and distribution in any medium, provided the original work is properly cited and nomodifications or adaptations are made.
The EFSA Journal is a publication of the European FoodSafety Authority, an agency of the European Union.
Dietary reference values for vitamin K
www.efsa.europa.eu/efsajournal 2 EFSA Journal 2017;15(5):4780

Summary
Following a request from the European Commission, the EFSA Panel on Dietetic Products, Nutritionand Allergies (NDA) was asked to deliver a Scientific Opinion on dietary reference values (DRVs) forthe European population, including vitamin K.
Vitamin K represents a family of fat-soluble compounds with the common chemical structure of3-substituted 2-methyl-1,4-napthoquinone. It naturally occurs in food as phylloquinone (vitamin K1)and menaquinones (vitamin K2). Phylloquinone has a phytyl side chain and is the primary dietary formof vitamin K in Europe: it is mainly found in dark green leafy vegetables (e.g. spinach, lettuce andother salad plants) and Brassica. Menaquinones are a group of compounds with an unsaturated sidechain from 4 to 13 isoprenyl units (vitamin K2 or MK-n) and are found mainly in animal products suchas meat, cheese and eggs. Apart from MK-4 that is formed via metabolic conversion of phylloquinoneduring its absorption in the intestinal mucosa and in other organs, menaquinones are produced bybacteria capable of food fermentation and specific anaerobic bacteria of the colon microbiota. In thisOpinion, the Panel considers vitamin K to comprise both phylloquinone and menaquinones.
Vitamin K acts as a cofactor of c-glutamyl carboxylase (GGCX) that catalyses the carboxylation ofglutamic acid (Glu) residues into c-carboxyglutamic acid (Gla) residues in vitamin K-dependent proteins(Gla-proteins), which convert them into their active forms. These Gla-proteins are involved in differentphysiological processes, including blood coagulation or bone mineralisation. MK-7 may have a greaterbioactivity compared to phylloquinone in stimulating c-carboxylation, but the available data areinsufficient to set different activity coefficients for phylloquinone and menaquinones.
In adults, vitamin K deficiency is clinically characterised by a bleeding tendency in relation to a lowactivity of blood coagulation factors, resulting in an increase in prothrombin time (PT) or partialthromboplastin time (or activated partial thromboplastin time). Symptomatic vitamin K deficiency andimpairment of normal haemostatic control in healthy adults may take more than 2–3 weeks to developat a ‘low’ phylloquinone intake (i.e. < 10 lg/day). Exclusively breastfed infants are susceptible tobleeding, due to the low vitamin K content of human milk and their small body pool of vitamin K.Administration of phylloquinone at a pharmacological dose, either orally or by intramuscular injection,is usual practice for prevention of haemorrhagic disease in newborn infants. No tolerable upper intakelevel has been set for vitamin K by the Scientific Committee on Food (SCF).
Phylloquinone is absorbed in the intestine in the presence of dietary fat. Studies on absorption ofphylloquinone in healthy adults show widely variable results. The data for absorption of some dietarymenaquinones (MK-4, MK-7 or MK-9) in comparison with phylloquinone are also limited. Absorption ofmenaquinones produced by gut bacteria in the distal intestine remains uncertain, and therefore theircontribution to vitamin K status is unclear. The Panel considers that it is not possible to estimateprecisely an average absorption of phylloquinone, menaquinones, and thus vitamin K from the diet.
After intestinal absorption, phylloquinone and individual menaquinones are transported into theblood by lipoproteins. The clearance of MK-7 and MK-9 from serum/plasma is slower than forphylloquinone. Vitamin K accumulates primarily in the liver, but is also present in bones and othertissues and has a fast turnover in the body. The liver contains widely variable concentrations ofphylloquinone and menaquinones, which are catabolised to the same metabolites and excreted in bileand urine. Phylloquinone crosses the placenta in small quantities, while for menaquinones, this isunclear.
PT is the only vitamin K biomarker for which a change (increase) has been associated with vitaminK deficiency. Possible changes in the other biomarkers (concentration/activity of coagulation factors, ofthe undercarboxylated forms of vitamin-K dependent proteins, or of vitamin K in blood; urinaryconcentration of Gla residues or of the 5C- and 7C-metabolites) according to phylloquinone intake aredifficult to interpret, as no cut-off value to define adequate vitamin K status is available. There is nobiomarker for which a dose–response relationship with phylloquinone intake has been established.Studies investigating the relationship between biomarkers and intake of different individualmenaquinones often used doses that are much higher than the limited observed intake data of theseindividual menaquinones available in Europe. There is no reference level for c-carboxylation that canbe considered as ‘optimal’ related to functions controlled by vitamin K status and the dietary intakes ofphylloquinone or menaquinones required for maximal or ‘optimal’ urinary Gla excretion have not beendetermined. Thus, the Panel concludes that none of these biomarkers is suitable by itself to assessvitamin K adequacy. The Panel also concludes that data are insufficient for deriving the requirementfor vitamin K according to sex or for ‘younger’ and ‘older’ adults.
Dietary reference values for vitamin K
www.efsa.europa.eu/efsajournal 3 EFSA Journal 2017;15(5):4780
The Panel notes the uncertainties in the food composition data and available consumption datarelated to phylloquinone, individual menaquinones or vitamin K. The Panel concludes that availabledata on intake of phylloquinone or menaquinones and health outcomes in healthy subjects cannot beused to derive DRVs for vitamin K. Data on vitamin K biomarkers and health outcomes with noquantitative data on vitamin K intake were not considered. The Panel considers a total body pool ofphylloquinone of about 0.55 lg/kg body weight in healthy adults at steady state not to be associatedwith signs of vitamin K deficiency and to be a desirable body pool size for phylloquinone. ThePanel notes that available data do not allow the estimation of the daily dietary intake of phylloquinonerequired to balance total phylloquinone losses through urine and bile and to maintain an adequatebody pool of phylloquinone. There is no data on the total body pool of menaquinones.
The Panel considers that average requirements and population reference intakes for vitamin Kcannot be derived for adults, infants and children, and therefore sets adequate intakes (AIs). ThePanel considers that available evidence on intake, absorption, function and content in the body ororgans of menaquinones is insufficient, and thus sets AIs for phylloquinone only. Having assessedadditional evidence available since 1993 related to biomarkers, intake data and the factorial approach,the Panel concludes that all possible approaches investigated to set DRVs for vitamin K are associatedwith considerable uncertainties and that the available scientific evidence is insufficient to update theprevious reference value. Therefore, the Panel maintains the reference value proposed by the SCF in1993. Thus, an AI of 1 lg phylloquinone/kg body weight per day is set for all age and sex populationgroups.
For adults, the Panel considers the respective reference body weights of men and women and afterrounding up, sets the same AI of 70 lg phylloquinone/day. The Panel notes that the proposed AI inadults is close to the median phylloquinone intake of 76 lg/day in the 2012 German National NutritionSurvey II that used updated phylloquinone composition data. The Panel considers that there is noevidence of different vitamin K absorption and different losses according to age in adults; thus sets thesame AI for ‘younger’ and ‘older’ adults.
For infants and children, the Panel considers that the requirement for growth would be covered by anintake of 1 lg phylloquinone/kg body weight per day. Considering the respective reference body weights,and after rounding up, AIs for phylloquinone are set at 10 lg/day for infants aged 7–11 months, andbetween 12 lg/day for children aged 1–3 years and 65 lg/day for children aged 15–17 years.
For pregnant women, taking into account the mean gestational increase in body weight and thereference body weight of non-pregnant women, the AI is the same as that for non-pregnant womenobtained after rounding. For lactating women, the Panel considers that the AI of 1 lg/kg body weightper day of phylloquinone set for non-lactating women covers the small excretion of vitamin K in breastmilk. Thus, the AI for pregnant or lactating women is set at 70 lg phylloquinone/day.
Dietary reference values for vitamin K
www.efsa.europa.eu/efsajournal 4 EFSA Journal 2017;15(5):4780
Table of contents
Abstract.................................................................................................................................................. 1Summary................................................................................................................................................ 3Background as provided by the European Commission ............................................................................... 7Terms of Reference as provided by the European Commission .................................................................... 7Assessment............................................................................................................................................. 81. Introduction................................................................................................................................ 82. Definition/category ...................................................................................................................... 82.1. Chemistry ................................................................................................................................... 82.2. Function of vitamin K................................................................................................................... 92.2.1. Biochemical functions .................................................................................................................. 92.2.2. Health consequences of deficiency and excess............................................................................... 102.2.2.1. Deficiency................................................................................................................................... 102.2.2.2. Excess ........................................................................................................................................ 112.3. Physiology and metabolism .......................................................................................................... 112.3.1. Intestinal absorption.................................................................................................................... 122.3.1.1. Intestinal absorption of phylloquinone........................................................................................... 122.3.1.2. Intestinal absorption of menaquinones.......................................................................................... 132.3.1.3. Conclusions on intestinal absorption ............................................................................................. 132.3.2. Transport in blood ....................................................................................................................... 142.3.3. Distribution to tissues .................................................................................................................. 152.3.4. Storage ...................................................................................................................................... 152.3.4.1. Kinetic studies on the total body pool of phylloquinone .................................................................. 152.3.4.2. Measurements of phylloquinone and menaquinones in the liver of adults......................................... 162.3.4.3. Measurements of phylloquinone and menaquinones in the liver of fetuses and newborns ................. 172.3.4.4. Measurements of phylloquinone and menaquinones in extra-hepatic tissues .................................... 182.3.4.5. Conclusions on storage ................................................................................................................ 182.3.5. Metabolism ................................................................................................................................. 182.3.6. Elimination.................................................................................................................................. 192.3.6.1. Faeces........................................................................................................................................ 192.3.6.2. Urine .......................................................................................................................................... 202.3.6.3. Breast milk ................................................................................................................................. 202.3.6.4. Conclusions on elimination ........................................................................................................... 212.3.7. Interaction with other nutrients .................................................................................................... 212.4. Biomarkers ................................................................................................................................. 212.4.1. Prothrombin time (PT) test and partial thromboplastin time (PTT) test ............................................ 212.4.2. Plasma concentration and activity of blood coagulation factors ....................................................... 222.4.3. Circulating concentration of the undercarboxylated form of vitamin K-dependent proteins ................ 232.4.3.1. Protein induced by vitamin K absence or antagonism-II (PIVKA-II) and S:E ratio.............................. 232.4.3.2. Undercarboxylated osteocalcin (OC) and matrix c–carboxyglutamic acid protein (MGP)..................... 242.4.3.3. Conclusions on circulating concentration of the undercarboxylated form of vitamin K-dependent
proteins ...................................................................................................................................... 252.4.4. Circulating concentration of vitamin K ........................................................................................... 262.4.5. Urinary concentration of c-carboxyglutamic acid (Gla) residues ....................................................... 272.4.6. Urinary concentration of vitamin K metabolites 5C and 7C.............................................................. 282.4.7. Conclusions on biomarkers........................................................................................................... 282.5. Effects of genotypes.................................................................................................................... 293. Dietary sources and intake data ................................................................................................... 303.1. Dietary sources ........................................................................................................................... 303.2. Dietary intake in Europe .............................................................................................................. 303.2.1. Dietary intake of ‘total vitamin K’ estimated by EFSA...................................................................... 313.2.1.1. Methodology ............................................................................................................................... 313.2.1.2. Results ....................................................................................................................................... 313.2.1.3. Discussion .................................................................................................................................. 323.2.2. Dietary intake of phylloquinone and menaquinones as reported in the literature .............................. 323.2.3. Conclusions on dietary intake in Europe ........................................................................................ 334. Overview of Dietary Reference Values and recommendations.......................................................... 344.1. Adults......................................................................................................................................... 344.2. Infants and children .................................................................................................................... 354.3. Pregnancy and lactation............................................................................................................... 37
Dietary reference values for vitamin K
www.efsa.europa.eu/efsajournal 5 EFSA Journal 2017;15(5):4780

5. Criteria (endpoints) on which to base Dietary Reference Values ...................................................... 385.1. Indicators of vitamin K requirement .............................................................................................. 385.1.1. Adults......................................................................................................................................... 385.1.1.1. Use of biomarkers ....................................................................................................................... 385.1.1.2. Factorial approach ....................................................................................................................... 385.1.1.3. Intake data................................................................................................................................. 395.1.1.4. Conclusions on indicators of vitamin K requirement for adults......................................................... 395.1.2. Infants and children .................................................................................................................... 395.1.3. Pregnant or lactating women ....................................................................................................... 395.2. Vitamin K intake and health consequences .................................................................................... 405.2.1. Cardiovascular-related outcomes .................................................................................................. 405.2.2. Bone health ................................................................................................................................ 415.2.3. Conclusions on vitamin K intake and health consequences.............................................................. 436. Data on which to base Dietary Reference Values ........................................................................... 436.1. Adults......................................................................................................................................... 446.2. Infants aged 7–11 months ........................................................................................................... 446.3. Children...................................................................................................................................... 446.4. Pregnancy .................................................................................................................................. 456.5. Lactation .................................................................................................................................... 45Conclusions............................................................................................................................................. 45Recommendations for research ................................................................................................................ 46References.............................................................................................................................................. 46Abbreviations .......................................................................................................................................... 59Appendix A – Concentrations of phylloquinone and menaquinones in breast milk of healthy mothers............. 62Appendix B – Dietary surveys in the EFSA Comprehensive European Food Consumption Database included inEFSA’s nutrient intake calculation for ‘total vitamin K’ ................................................................................. 66Appendix C – ‘Total vitamin K’ intakes in males in different surveys, estimated by EFSA according to ageclass and country .................................................................................................................................... 67Appendix D – ‘Total vitamin K’ intakes in females in different surveys, estimated by EFSA according to ageclass and country .................................................................................................................................... 69Appendix E – Minimum and maximum percentage contributions of different food groups (FoodEx2 level 1) to‘total vitamin K’ intake estimates in males ................................................................................................. 71Appendix F – Minimum and maximum percentage contributions of different food groups (FoodEx2 level 1) to‘total vitamin K’ intake estimates in females .............................................................................................. 72Appendix G – Estimated dietary intakes of phylloquinone and menaquinones in European countries asreported in the literature.......................................................................................................................... 73
Dietary reference values for vitamin K
www.efsa.europa.eu/efsajournal 6 EFSA Journal 2017;15(5):4780
Background as provided by the European Commission
The scientific advice on nutrient intakes is important as the basis of Community action in the fieldof nutrition, for example such advice has in the past been used as the basis of nutrition labelling. TheScientific Committee for Food (SCF) report on nutrient and energy intakes for the EuropeanCommunity dates from 1993. There is a need to review and if necessary to update these earlierrecommendations to ensure that the Community action in the area of nutrition is underpinned by thelatest scientific advice.
In 1993, the SCF adopted an opinion on the nutrient and energy intakes for the EuropeanCommunity.1 The report provided Reference Intakes for energy, certain macronutrients andmicronutrients, but it did not include certain substances of physiological importance, for exampledietary fibre.
Since then new scientific data have become available for some of the nutrients, and scientificadvisory bodies in many European Union (EU) Member States and in the United States have reportedon recommended dietary intakes. For a number of nutrients these newly established (national)recommendations differ from the reference intakes in the SCF (1993) report. Although there isconsiderable consensus between these newly derived (national) recommendations, differing opinionsremain on some of the recommendations. Therefore, there is a need to review the existing EUReference Intakes in the light of new scientific evidence, and taking into account the more recentlyreported national recommendations. There is also a need to include dietary components that were notcovered in the SCF opinion of 1993, such as dietary fibre, and to consider whether it might beappropriate to establish reference intakes for other (essential) substances with a physiological effect.
In this context, the European Food Safety Authority (EFSA) is requested to consider the existingpopulation reference intakes for energy, micro- and macronutrients and certain other dietarycomponents, to review and complete the SCF recommendations, in the light of new evidence, and inaddition advise on a population reference intake for dietary fibre.
For communication of nutrition and healthy eating messages to the public, it is generally moreappropriate to express recommendations for the intake of individual nutrients or substances in food-based terms. In this context, EFSA is asked to provide assistance on the translation of nutrient basedrecommendations for a healthy diet into food based recommendations intended for the population as awhole.
Terms of Reference as provided by the European Commission
In accordance with Article 29 (1)(a) and Article 31 of Regulation (EC) No 178/20022, theCommission requests EFSA to review the existing advice of the SCF on population reference intakes forenergy, nutrients and other substances with a nutritional or physiological effect in the context of abalanced diet which, when part of an overall healthy lifestyle, contribute to good health throughoptimal nutrition.
In the first instance, EFSA is asked to provide advice on energy, macronutrients and dietary fibre.Specifically advice is requested on the following dietary components:
• Carbohydrates, including sugars;• Fats, including saturated fatty acids, polyunsaturated fatty acids and monounsaturated fatty
acids, trans fatty acids;• Protein;• Dietary fibre.
Following on from the first part of the task, EFSA is asked to advise on population reference intakesof micronutrients in the diet and, if considered appropriate, other essential substances with anutritional or physiological effect in the context of a balanced diet which, when part of an overallhealthy lifestyle, contribute to good health through optimal nutrition.
Finally, EFSA is asked to provide guidance on the translation of nutrient-based dietary advice intoguidance, intended for the European population as a whole, on the contribution of different foods or
1 Scientific Committee for Food, Nutrient and energy intakes for the European Community, Reports of the Scientific Committeefor Food 31st series, Office for Official Publication of the European Communities, Luxembourg, 1993.
2 Regulation (EC) No 178/2002 of the European Parliament and of the Council of 28 January 2002 laying down the generalprinciples and requirements of food law, establishing the European Food Safety Authority and laying down procedures inmatters of food safety. OJ L 31, 1.2.2002, p. 1–24.
Dietary reference values for vitamin K
www.efsa.europa.eu/efsajournal 7 EFSA Journal 2017;15(5):4780

categories of foods to an overall diet that would help to maintain good health through optimalnutrition (food-based dietary guidelines).
Assessment
1. Introduction
In 1993, the SCF adopted an opinion on the nutrient and energy intakes for the EuropeanCommunity (1993). For vitamin K, SCF (1993) did not set any average requirement (AR) or populationreference intake (PRI). The SCF considered that an intake of 1 lg/kg body weight per day, providedby a usual mixed diet, is adequate.
The purpose of this Opinion is to review dietary reference values (DRVs) for vitamin K. Vitamin Knaturally occurs in food as phylloquinone (vitamin K1) and menaquinones (vitamin K2, MK-n). ThePanel notes that DRVs set by other authorities and bodies (Section 4) are mainly related to data onphylloquinone and that the role of MK-n in meeting vitamin K requirement is often not considered.However, some new data are available on both types of components. Therefore, the Panel considersthat MK-n should be included, in addition to phylloquinone, in this assessment. In this ScientificOpinion, the Panel considers that vitamin K comprises both phylloquinone and menaquinones.
2. Definition/category
The data discussed in this Opinion not only include data on vitamin K administered orally, but alsoparenterally when the data provide additional information on the role of vitamin K in the body.
2.1. Chemistry
Vitamin K represents a family of fat-soluble compounds with the common chemical structure 3-substituted 2-methyl-1,4-napthoquinone (Figure 1).
Phylloquinone (also called phytonadione or phytomenadione) is from plant origin. It contains aphytyl group and is the primary dietary form of vitamin K, mainly found in green leafy vegetable plantsand Brassica (Section 3.1).
Menaquinones are a group of compounds with unsaturated side chains of varying length (MK-n)3
from 4 to 13 isoprenyl units at the 3-position of the 2-methyl-1,4-napthoquinone group and found inanimal products such as meat, cheese and egg (Section 3.1).
Most menaquinones, i.e. the medium-chain and long-chain MK-n (MK-6 or higher) but not the short-chain MK-4 (also called menatetrenone), are produced by bacteria, including bacteria capable of food
Phylloquinone (vitamin K1)
Menaquinone-4 (vitamin K2)
Menaquinone-7 (vitamin K2)
Phylloquinone 2,3-epoxide
Five carbon vitamin K metabolite
Seven carbon vitamin K metabolite
Molecular masses – Phylloquinone: 450.7 g/mol; MK-4: 444.7 g/mol; MK-7: 648.9 g/mol; 5C-metabolite:272.3 g/mol; 7C-metabolite: 298.3 g/mol (see above).
Figure 1: Chemical structures of vitamin K and metabolites
3 MK-5 = 512.8 g/mol; MK-6 = 580.9 g/mol; MK-8 = 717.1 g/mol; MK-9: 785.2 g/mol; MK-10 = 853.4 g/mol; MK-11 = 921.5 g/mol;MK-12 = 989.6 g/mol; MK-13 = 1,057.7 g/mol
Dietary reference values for vitamin K
www.efsa.europa.eu/efsajournal 8 EFSA Journal 2017;15(5):4780

fermentation, gut bacteria in animals and anaerobic bacteria of the human colon microbiota (Conly andStein, 1992). In breastfed infants, the production of menaquinones by gut microbiota is probably low,as most bacteria of their microbiota, including Bifidobacterium, Lactobacillus and Clostridium species,do not produce menaquinones; and with weaning, there is a progressive colonisation of the gut byMK-producing bacteria such as Bacteroides fragilis and Escherichia coli (Greer, 2010; Shearer et al.,2012). In humans, MK-4 is produced via metabolic conversion of phylloquinone during its absorption inthe intestinal mucosa and in other organs (Section 2.3.5).
Menadione (unsubstituted 2-methyl-1,4-napthoquinone, a chemical analogue of 1,4-naphthoquinonewith a methyl group in the 2-position, and that is also called vitamin K3) is a water-soluble synthetic formof vitamin K that plays a role as an intermediate in the metabolic conversion of phylloquinone to MK-4(Section 2.3.5). Menadiol sodium phosphate (also called vitamin K4) is a synthetic water-soluble formderived from menadione by reduction. Dihydrophylloquinone is present in foods made with partiallyhydrogenated fat like hydrogenated soybean oil (Section 3.1).
2.2. Function of vitamin K
2.2.1. Biochemical functions
Vitamin K (i.e. either phylloquinone or menaquinones) acts as a cofactor of the enzyme c-glutamylcarboxylase (GGCX) that catalyses the post-translational carboxylation of glutamic acid (Glu) residuesinto c-carboxyglutamic acid (Gla) residues in the amino-terminal domain of different vitaminK-dependent proteins. This reaction converts these proteins, also called Gla-proteins, into their activeform (Stafford, 2005). These proteins all display calcium-mediated actions, with the Gla residueslocated at their specific calcium-binding sites (Ferland, 1998; Litwack, 2008).
During the c-glutamyl carboxylation of vitamin K-dependent proteins, the active (reduced) form ofvitamin K (hydroquinone) is converted to vitamin K epoxide (Figure 1), the oxidised form of vitamin K,that is subsequently reduced back to hydroquinone (Furie et al., 1999; Tie et al., 2005). This redoxcycle, called vitamin K cycle, takes place in different tissues, particularly in the liver and bone. Itinvolves the integral membrane enzymes GGCX and vitamin K epoxide reductase (VKOR), acting onmembrane-bound vitamin K (Stafford, 2005; Tie et al., 2005; Oldenburg et al., 2008; Tie and Stafford,2008; Wu et al., 2011). VKOR controls a critical step of the vitamin K cycle that is blocked by warfarinand is at the bottom of warfarin’s anticoagulant activity (Garcia and Reitsma, 2008). Unlike in adults,vitamin K epoxide is detectable in newborn cord plasma, and may reflect ‘low’ concentrations of VKOR(Bovill et al., 1993). Infants born with a rare genetic deficiency of VKOR may present with severecoagulopathy and/or skeletal defects (Oldenburg et al., 2000).
One group of vitamin K-dependent proteins comprises blood coagulation factors, including factors II(prothrombin), VII, IX and X, and the anticoagulant proteins C, S and Z. These proteins aresynthesised by the liver and the endothelial cells in inactive forms (with Glu residues), converted for apart to their active forms (with Gla residues) in the presence of vitamin K by GGCX found in theendoplasmic reticulum of the cells, and then secreted as both the inactive and active forms to theblood (Hansson and Stenflo, 2005). The protein induced by vitamin K absence or antagonism-II(PIVKA-II), the precursor of the active coagulation protein prothrombin, has 10 Glu residues that arecarboxylated to Gla residues, leading to the formation of prothrombin. After the formation of Glaresidues and in the presence of calcium ions, the clotting factors bind to phospholipids at the surfaceof the membrane of platelets, where they form membrane-bound complexes with other clottingcofactors, and these complexes are cleaved after coagulation is initiated in the plasma. This process issensitive to vitamin K availability in the cells for carboxylation of the blood coagulation factors.
Another important group of vitamin K-dependent proteins include, e.g. osteocalcin (OC), matrix c-carboxyglutamic acid protein (MGP) and growth arrest-specific protein 6 (GAS6), synthesised byosteoblasts or other tissues (e.g. vascular smooth muscle cells for GAS6 and MGP, chondrocytes forMGP), and Gla-rich protein (GRP). Osteocalcin, one of the most abundant non-collagenous proteins inbone, is involved in bone mineralisation (Ferland, 1998; Booth, 2009; Walther et al., 2013). Someauthors suggest that carboxylated forms of MGP, GAS6 and GRP may be involved in the control of softtissue calcification (Proudfoot and Shanahan, 2006; Bellido-Martin and de Frutos, 2008; Danziger,2008; Shiozawa et al., 2010; Viegas and Simes, 2016).
Data on in vitro and in vivo animal experiments also suggest that vitamin K is involved in the down-regulation of expression of genes involved in acute inflammatory response (Ohsaki et al., 2006). Theactivity of TAM receptors, that are a component of the immune system, is dependent on carboxylated
Dietary reference values for vitamin K
www.efsa.europa.eu/efsajournal 9 EFSA Journal 2017;15(5):4780

GAS6 and protein S in order to function (Lemke, 2013). However the precise mechanisms (Hanck andWeiser, 1983; Reddi et al., 1995; Li et al., 2003), the required level of carboxylation, and the relevanceof this possible role of vitamin K in humans (Juanola-Falgarona et al., 2013) are unclear.
MK-n have the same function as phylloquinone (c-carboxylation), but MK-7 may have a greaterbioactivity compared to phylloquinone in stimulating c-carboxylation. A cross-over study (n = 18),using equimolar doses of either phylloquinone or MK-7 (0.22 µmol/day4) as supplements consumedwith a meal for 6 weeks (with a wash-out period of 12 weeks) showed that MK-7 induced a higherratio of serum c-carboxylated OC/undercarboxylated OC (cOC/ucOC) compared to phylloquinone(Schurgers et al., 2007). Another cross-over study in the same paper (n = 12), which used thevitamin K c-carboxylation antagonist acenocoumarol with weekly-increasing oral doses of eitherphylloquinone or MK-7 as supplements (0–500 and 0–285 lg/day, respectively, with a wash-out periodof 2 weeks), showed that MK-7 was about 2.5 times more potent than phylloquinone to counter-actthe effect of acenocoumarol (i.e. 130 vs 315 lg/day, respectively, to obtain a comparable effect).
The Panel notes that dietary vitamin K (i.e. either phylloquinone or menaquinones) acts ascofactor of the enzymatic conversion of vitamin K-dependent proteins (Gla-proteins) into their activeform, by carboxylation of Glu residues to Gla residues in the amino-terminal domain. These proteinsare involved in different physiological processes, including blood coagulation, bone mineralisation andpossibly control of soft tissue calcification. The Panel also notes that MK-7 may have a greaterbioactivity compared to phylloquinone in stimulating c-carboxylation, but that the available data areinsufficient to set different activity coefficients for phylloquinone and menaquinones.
2.2.2. Health consequences of deficiency and excess
2.2.2.1. Deficiency
In adults, vitamin K deficiency is clinically characterised by a bleeding tendency in relation to a lowactivity of the blood coagulation factors. This can be demonstrated by a vitamin K-responsive increasein prothrombin time (PT) or partial thromboplastin time (PTT also called activated partialthromboplastin time, APTT). PT and PTT are indicators of the activity of the extrinsic and intrinsiccoagulation pathways, respectively, assessed by the time it takes for a fibrin clot to form. Moreinformation on the sensitivity of the PT test compared to other biomarkers, as well as other referencesdiscussing these tests, are provided in Section 2.4.
In 10 healthy subjects fed for 3 weeks a diet considered as free of vitamin K by the authors (andthat probably contained less than 10 lg/day vitamin K), there was an increase in average weekly PT(from 14.8 to 16 s, p < 0.05) (Udall, 1965). Other depletion/repletion studies, however, showed thathealthy adults fed diets containing 5–10 lg phylloquinone/day for 2 weeks showed no changein coagulation time, either measured by PT or PTT (Allison et al., 1987; Ferland et al., 1993) (n = 33and 32, respectively). A study in 10 adult patients with apoplexy unable to eat and with parenteraladministration of vitamins without vitamin K, showed after 21–28 days prolonged PTs (assessed by% Quick test) in seven patients treated with antibiotics (‘affecting the intestinal flora’) but not in thethree subjects not treated with antibiotics (Frick et al., 1967). This induced deficiency responded toincreasing phylloquinone doses administered intravenously, from which the authors concluded that theamount of phylloquinone needed to restore a normal Quick value is between 0.03 and 1.5 lg/kg bodyweight per day phylloquinone. The Panel notes that these studies suggest that symptomatic vitamin Kdeficiency and impairment of normal haemostatic control in healthy adults may take more than2–3 weeks to develop at ‘low’ phylloquinone intake (i.e. < 10 lg/day).
Exclusively breastfed infants are more susceptible to bleeding than formula-fed infants (Shearer,2009), due to the low phylloquinone content of human milk (Section 2.3.6.3) compared to infantformulae (Greer et al., 1991). Phylloquinone concentrations were undetectable in cord blood of infantsof unsupplemented mothers unless the pregnant women received phylloquinone intravenously beforedelivery (Shearer et al., 1982). Liver tissue contents of phylloquinone and of menaquinones inneonates are low (MK-n were undetectable until 14 days post-partum), although these low vitamin Kstores seem to be sufficient to maintain normal haemostasis during fetal life (von Kries et al., 1988)(Section 2.3.4.3). Incidence rates of vitamin K deficiency bleeding (VKDB) in infants not given vitaminK prophylaxis have been reviewed (Sutor et al., 1999; Zipursky, 1999; Shearer, 2009). Studies cited inthese reviews reported that the incidence of early VKDB (< 24 h of life) ranged from less than 6% to12% of births and that the incidence of classical VKDB (first week of life) ranged from 5.4/105 births to
4 99 and 143 µg/day, respectively.
Dietary reference values for vitamin K
www.efsa.europa.eu/efsajournal 10 EFSA Journal 2017;15(5):4780

1.7% of births in Western European countries, and between 25/105 births and 0.9% in Africa andSouth-East Asia. The incidence of late VKDB (after the first week of life, up to 6 months, with a peakat 3–8 weeks of life) was reported to range from 4.4 to 7.2/105 births in Western European countries,and from 10.5 to 72/105 births in South-East Asia (Japan and Thailand). The relative risk (RR) fordeveloping late VKDB is estimated to be 81 times greater for infants not given vitamin K prophylaxis(McNinch and Tripp, 1991). The incidence of VKDB declines at 12 weeks of age, and spontaneousbleeding beyond that age is rare and as a rule limited to lipid malabsorption syndromes.
Administration of phylloquinone at a pharmacological dose, either orally or by intramuscularinjection, is usual practice for prevention of haemorrhagic disease in newborn infants (Clarke et al.,2006; Busfield et al., 2007; Strehle et al., 2010; Mihatsch et al., 2016). Oral pharmacological doses ofMK-4 (2 mg at birth, and 4 mg at 1 week of age, n = 72,000) have been successfully used innewborns for prophylaxis of haemorrhagic diseases in Japan (Matsuzaka et al., 1987).
Studies have investigated possible relationships between ‘low’ vitamin K intake and abnormalcalcification including osteoporosis or arterial calcification (as reviewed in Kaneki et al. (2006) andVermeer and Braam (2001)) and possible associations between plasma phylloquinone and the risk ofosteoarthritis (Neogi et al., 2006). This is discussed further in Sections 2.4 and 5.2.
2.2.2.2. Excess
The SCF (2003b) reviewed data on phylloquinone and identified two studies in humans (Craciunet al., 1998; Booth et al., 1999b), which showed no evidence of adverse effects associated withsupplementation up to 10 mg/day for 1 month. The SCF considered that these limited human data aresupported by animal studies, which showed no adverse effect after daily administration of 2,000 mg/kgbody weight for 30 days. The SCF concluded that there was no appropriate evidence to derive a tolerableupper intake level (UL) for vitamin K. The Panel notes that revising the UL for vitamin K is not within thescope of the present Opinion.
A review showed that prophylactic vitamin K administration to newborns of supraphysiologicalparenteral doses (ranging from 0.2 mg/kg body weight to a 1 mg bolus dose) can induce mean/medianserum phylloquinone concentrations in the first week of life up to 1,000-fold higher than non-fastingadult ‘normal’ values (Clarke, 2010). However, in studies in term or preterm infants investigating differentdoses of parenteral vitamin K prophylaxis, the increase in production of vitamin K metabolites, of vitaminK recycling and of vitamin K catabolic pathways (Sections 2.2.1 and 2.3.5), showed that infants arecapable of metabolising large vitamin K doses (Clarke et al., 2006; Harrington et al., 2010). No adverseeffect has been reported with these high prophylactic doses.
2.3. Physiology and metabolism
The way dietary vitamin K is absorbed and transported in the body is complex (Figure 2).
Dietary reference values for vitamin K
www.efsa.europa.eu/efsajournal 11 EFSA Journal 2017;15(5):4780

2.3.1. Intestinal absorption
2.3.1.1. Intestinal absorption of phylloquinone
Phylloquinone is absorbed in the intestine, together with lipophilic compounds, and in the presenceof dietary fat in a process that includes bile salts and requires proper pancreatic function for uptake ofmixed micelles into the enterocytes and packaging with dietary lipids into nascent chylomicron particles(Blomstrand and Forsgren, 1968; Shearer et al., 1974, 2012). Absorption of phylloquinone depends onthe food/meal matrix, as shown by differences in absorption of 13C-labelled phylloquinone from asupplement consumed with different types of meals (Jones et al., 2009).
Studies investigating phylloquinone absorption in (usually small) samples of healthy adults, generallybased on measurements of phylloquinone concentration in blood, differ in design. They used a varietyof forms of phylloquinone (free or naturally present in various plant foods), of modes of preparation andadministration (foods either cooked or fresh, with or without fat, supplements consumed with orwithout a meal), of phylloquinone intakes, or of experimental methods (isotope-labelled or unlabelledphylloquinone, kinetic model, area-under-the-curve (AUC)).
Absorption of free phylloquinone from a supplement was 13 � 9% (mean � standarddeviation (SD), range 2–26%) or about 80% of the ingested dose in two studies. The lower value wascalculated from a kinetic study using labelled phylloquinone in oil and given as gelatine capsules withouta meal, and measuring plasma phylloquinone concentration (Jones et al., 2008) (Section 2.3.4). Thehigher value was obtained from the measurement of unchanged phylloquinone out of the total amountof radioactivity (unchanged form and metabolites) recovered from the faeces, after ingestion of labelledphylloquinone mixed with detergent solubilised phylloquinone and given as a supplement consumedwith a meal containing fat, as discussed in the review by Shearer et al. (1974).
Mean relative absorption of unlabelled phylloquinone naturally present in plant foods (broccoli,spinach or lettuce; fresh or cooked, with or without fat), assessed as plasma AUC, ranged fromapproximately 4% to about 60–64% of the absorption of free phylloquinone in three studies. Thesestudies used a variety of comparators (exogenous free phylloquinone added to the oil consumed witha baseline diet that also contained phylloquinone from foods, detergent-solubilised free phylloquinonesupplement or free phylloquinone from a tablet) that were all efficiently absorbed as indicated by theirrespective AUCs. The lower mean relative absorption of 4.1% referred to the absorption of 1 mg
Gut microbiota
UrineMetabolites
K1
MK-n
FaecesK1, MK-n
Metabolites
LymphK1
K1, MK-nK1
MK-n
% unabsorbed: unknown
Food
MK-n
Intes ne Blood TissuesK1, MK-n, metabolites
MK-4MK-4
MK-n
?
0.55 μg K1/kg body weight
- MKn concentra on unknown
rela ve % of K1 and MKn unclear
Liver K1 MK-n
MetabolitesBile - Metabolites
Metabolic losses:62% of body pool (for K1), unknown
for K2
K1: phylloquinone; K2: MK-n: menaquinones. Absorption of menaquinones synthesised from gut microbiota in thelarge intestine remains uncertain (hence the question mark in the figure) (Section 2.3.1).
Figure 2: Metabolism of vitamin K in adults
Dietary reference values for vitamin K
www.efsa.europa.eu/efsajournal 12 EFSA Journal 2017;15(5):4780
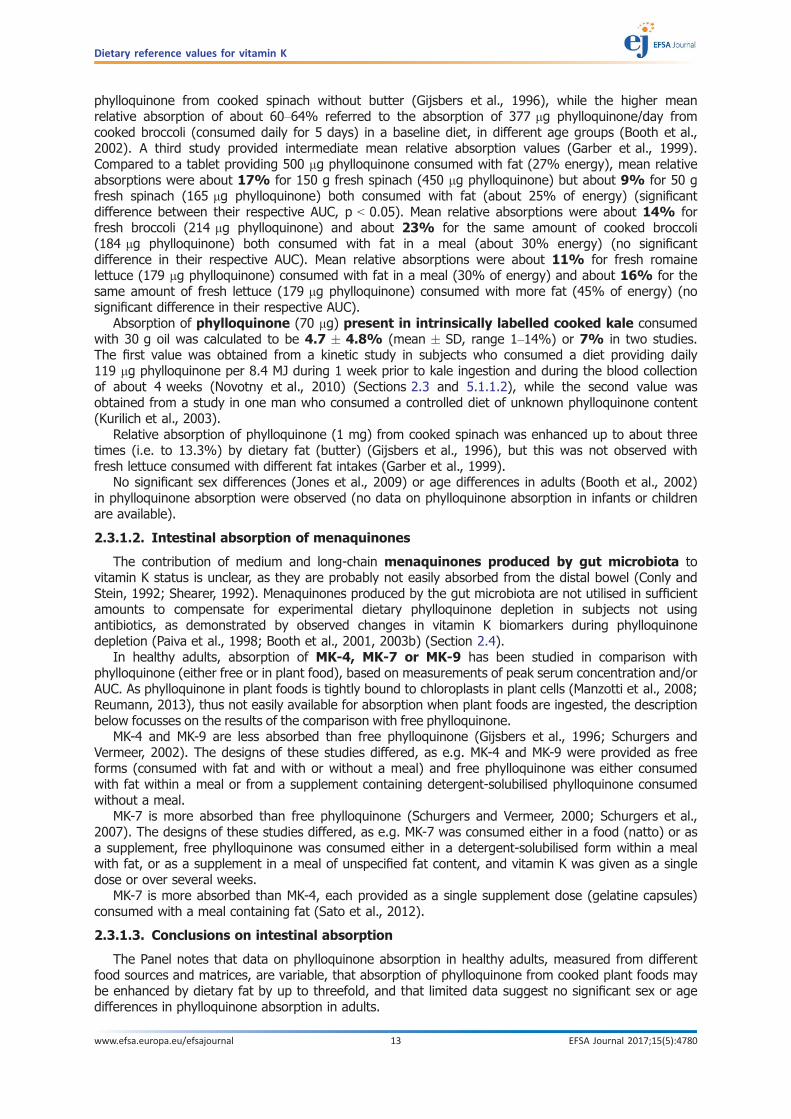
phylloquinone from cooked spinach without butter (Gijsbers et al., 1996), while the higher meanrelative absorption of about 60–64% referred to the absorption of 377 lg phylloquinone/day fromcooked broccoli (consumed daily for 5 days) in a baseline diet, in different age groups (Booth et al.,2002). A third study provided intermediate mean relative absorption values (Garber et al., 1999).Compared to a tablet providing 500 lg phylloquinone consumed with fat (27% energy), mean relativeabsorptions were about 17% for 150 g fresh spinach (450 lg phylloquinone) but about 9% for 50 gfresh spinach (165 lg phylloquinone) both consumed with fat (about 25% of energy) (significantdifference between their respective AUC, p < 0.05). Mean relative absorptions were about 14% forfresh broccoli (214 lg phylloquinone) and about 23% for the same amount of cooked broccoli(184 lg phylloquinone) both consumed with fat in a meal (about 30% energy) (no significantdifference in their respective AUC). Mean relative absorptions were about 11% for fresh romainelettuce (179 lg phylloquinone) consumed with fat in a meal (30% of energy) and about 16% for thesame amount of fresh lettuce (179 lg phylloquinone) consumed with more fat (45% of energy) (nosignificant difference in their respective AUC).
Absorption of phylloquinone (70 lg) present in intrinsically labelled cooked kale consumedwith 30 g oil was calculated to be 4.7 � 4.8% (mean � SD, range 1–14%) or 7% in two studies.The first value was obtained from a kinetic study in subjects who consumed a diet providing daily119 lg phylloquinone per 8.4 MJ during 1 week prior to kale ingestion and during the blood collectionof about 4 weeks (Novotny et al., 2010) (Sections 2.3 and 5.1.1.2), while the second value wasobtained from a study in one man who consumed a controlled diet of unknown phylloquinone content(Kurilich et al., 2003).
Relative absorption of phylloquinone (1 mg) from cooked spinach was enhanced up to about threetimes (i.e. to 13.3%) by dietary fat (butter) (Gijsbers et al., 1996), but this was not observed withfresh lettuce consumed with different fat intakes (Garber et al., 1999).
No significant sex differences (Jones et al., 2009) or age differences in adults (Booth et al., 2002)in phylloquinone absorption were observed (no data on phylloquinone absorption in infants or childrenare available).
2.3.1.2. Intestinal absorption of menaquinones
The contribution of medium and long-chain menaquinones produced by gut microbiota tovitamin K status is unclear, as they are probably not easily absorbed from the distal bowel (Conly andStein, 1992; Shearer, 1992). Menaquinones produced by the gut microbiota are not utilised in sufficientamounts to compensate for experimental dietary phylloquinone depletion in subjects not usingantibiotics, as demonstrated by observed changes in vitamin K biomarkers during phylloquinonedepletion (Paiva et al., 1998; Booth et al., 2001, 2003b) (Section 2.4).
In healthy adults, absorption of MK-4, MK-7 or MK-9 has been studied in comparison withphylloquinone (either free or in plant food), based on measurements of peak serum concentration and/orAUC. As phylloquinone in plant foods is tightly bound to chloroplasts in plant cells (Manzotti et al., 2008;Reumann, 2013), thus not easily available for absorption when plant foods are ingested, the descriptionbelow focusses on the results of the comparison with free phylloquinone.
MK-4 and MK-9 are less absorbed than free phylloquinone (Gijsbers et al., 1996; Schurgers andVermeer, 2002). The designs of these studies differed, as e.g. MK-4 and MK-9 were provided as freeforms (consumed with fat and with or without a meal) and free phylloquinone was either consumedwith fat within a meal or from a supplement containing detergent-solubilised phylloquinone consumedwithout a meal.
MK-7 is more absorbed than free phylloquinone (Schurgers and Vermeer, 2000; Schurgers et al.,2007). The designs of these studies differed, as e.g. MK-7 was consumed either in a food (natto) or asa supplement, free phylloquinone was consumed either in a detergent-solubilised form within a mealwith fat, or as a supplement in a meal of unspecified fat content, and vitamin K was given as a singledose or over several weeks.
MK-7 is more absorbed than MK-4, each provided as a single supplement dose (gelatine capsules)consumed with a meal containing fat (Sato et al., 2012).
2.3.1.3. Conclusions on intestinal absorption
The Panel notes that data on phylloquinone absorption in healthy adults, measured from differentfood sources and matrices, are variable, that absorption of phylloquinone from cooked plant foods maybe enhanced by dietary fat by up to threefold, and that limited data suggest no significant sex or agedifferences in phylloquinone absorption in adults.
Dietary reference values for vitamin K
www.efsa.europa.eu/efsajournal 13 EFSA Journal 2017;15(5):4780

The Panel notes that all the studies that used the AUC approach to assess relative absorption ofphylloquinone naturally present in cooked or fresh plant foods (with or without fat) had a sufficientduration of serum/plasma phylloquinone measurements to calculate the AUC (9–24 h) (Gijsbers et al.,1996; Garber et al., 1999; Booth et al., 2002). Assuming, as reference, 80% absorption for freephylloquinone (as a supplement consumed with fat (Shearer et al., 1974)), the Panel estimated fromthese three studies an absolute value of mean absorption of about 3–50%. The Panel also notes thatabsorption assessed by AUC of plasma concentration or assessed by the peak concentration can beunderestimated, as the peak concentration value is influenced not only by absorption, but also bydisposal and elimination rate. The Panel also notes that the results do not allow a direct measurementof an absolute value of phylloquinone absorption as no fractional absorption rate can be calculatedfrom these studies. Other data on intrinsically labelled cooked kale consumed with fat showed thatabsorption of phylloquinone from plant food was about 5–7% (Kurilich et al., 2003; Novotny et al.,2010). Mean absorption of free phylloquinone from a supplement ranges from 13% (provided in oil ina hydrophilic matrix, i.e. gelatin, without a meal (Jones et al., 2008)) to about 80% (mixed withdetergent solubilised phylloquinone and given as a supplement consumed with a meal containing fat(Shearer et al., 1974)).
The Panel notes that absorption of menaquinones produced by gut bacteria in the distal intestineremains uncertain, and therefore, the contribution of medium and long-chain menaquinones producedby gut microbiota to vitamin K status is unclear. For dietary menaquinones, the Panel considers thatavailable results indicate that MK-4 and MK-9 are less efficiently absorbed, and MK-7 is more efficientlyabsorbed, than synthetic free phylloquinone; however, MK-7 does not contribute much to MK-n intakein Europe (Section 3.2.2). The Panel notes that these results are based on studies using serumconcentrations (peak concentration or AUC) of menaquinones and phylloquinone that are known tohave different kinetics in plasma (Section 2.3.2), and that these results do not allow to directlyquantify MK-4, MK-7 or MK-9 absorption as, again, no fractional absorption rate can be calculated.
The Panel considers that it is not possible to estimate precisely an average absorption ofphylloquinone, menaquinones, and thus vitamin K from the diet.
2.3.2. Transport in blood
The predominant circulating form of vitamin K in blood is phylloquinone (Hodges et al., 1993a;Thijssen et al., 2002; Gentili et al., 2014), except in populations with high intakes of MK-7 as in Japan(Tsugawa et al., 2006).
After intestinal absorption, radiolabeled phylloquinone first appears in the lymph (Blomstrand andForsgren, 1968) and then enters the blood stream incorporated in chylomicrons (Shearer et al., 1970b).No specific carrier protein for phylloquinone in blood has been identified. Its main transporters duringthe post-prandial phase of absorption are triglyceride (TG)-rich lipoproteins (TRL) (about 75–90% ofplasma phylloquinone), primarily chylomicron remnants and very low-density lipoproteins (VLDL)(Kohlmeier et al., 1996; Lamon-Fava et al., 1998; Schurgers and Vermeer, 2000, 2002; Erkkila et al.,2004). The remainder is approximately equally distributed between low- and high-density lipoproteins(LDL and HDL), with lesser amounts in the intermediate-density lipoprotein (IDL) fraction.
Studies on ingestion of labelled or unlabelled phylloquinone show that it peaks in plasma/serum about4–10 h after ingestion and it peaks in the TRL fraction 3 h later than the TG present in the test meal(Shearer et al., 1970b; Lamon-Fava et al., 1998; Schurgers and Vermeer, 2000, 2002; Dolnikowski et al.,2002; Kurilich et al., 2003; Erkkila et al., 2004; Fu et al., 2009; Novotny et al., 2010). Phylloquinone half-life (t1/2) in plasma has been determined to range between 0.22 and 8.80 h, depending on studies, studydurations and methodologies (Shearer et al., 1972, 1974; Bjornsson et al., 1979; Schurgers andVermeer, 2000; Olson et al., 2002; Jones et al., 2008; Novotny et al., 2010) (Section 2.3.5).
After ingestion of equimolar doses (2 lmol5) of phylloquinone, MK-4 and MK-9, all dissolved in ameal containing fat, serum MK-4 peaked at 2 h at the same time as the peak of TGs from the testmeal, then was transferred to LDL and then to HDL (Schurgers and Vermeer, 2002). Serumphylloquinone and MK-9 peaked at 4 and 5 h, respectively. MK-9 was found only with LDL but not inHDL. Phylloquinone or MK-4 disappeared from the circulation overnight, while MK-9 serumconcentration after 24 h was still about 25% of the peak value and remained detectable until the last
5 i.e. 0.90 mg phylloquinone, 0.89 mg MK-4 and 1.57 mg MK-9.
Dietary reference values for vitamin K
www.efsa.europa.eu/efsajournal 14 EFSA Journal 2017;15(5):4780

measurement at 48 h (Schurgers and Vermeer, 2002). After ingestion of 3.1 lmoles of MK-7 in theform of natto compared to 3.5 lmoles phylloquinone in the form of spinach and consumed with fat,6
serum phylloquinone and MK-7 peaked at 6 h following consumption and a quick disappearance ofphylloquinone from serum was observed within 24 h while MK-7 showed complex (biphasic)pharmacokinetics in serum and remained detectable for at least 72 h (Schurgers and Vermeer, 2000).After ingestion of equal quantities of phylloquinone and MK-7 (1 mg of each) in oil within a mealcontaining fat, the peak values were seen at about 4 h after the meal, and serum phylloquinonedeclined by 86% in the following 4 h, while MK-7 showed a biphasic decline and was still present at96 h (Schurgers et al., 2007).
The Panel notes that the main transporters of phylloquinone are TRL, and that menaquinones arealso transported by lipoproteins. The Panel also notes that phylloquinone and individual menaquinoneshave different kinetics in serum/plasma, and that the clearance of MK-7 and MK-9 from serum/plasmais slower (48–96 h) than for phylloquinone.
2.3.3. Distribution to tissues
The liver is the primary organ that efficiently accumulates absorbed phylloquinone transported inchylomicrons (Section 2.3.4). The uptake of chylomicron remnants by the liver involves differentapolipoproteins and high-affinity lipoprotein receptors that mediate internalisation of the lipoproteinparticles (Cooper, 1997). There is no conclusive information on the mechanism of uptake ofmenaquinones by the liver.
Bone matrix contains several vitamin K-dependent proteins synthesised by the osteoblasts(Section 2.2.1), and vitamin K (phylloquinone and menaquinones) needs to be transported toosteoblasts for the c-glutamyl carboxylation of these proteins. Osteoblasts and osteoblast-like cells areable to internalise phylloquinone from various lipoprotein fractions, as shown with human cell lines(Newman et al., 2002; Niemeier et al., 2005) and reviewed by Kohlmeier et al. (1996). The mechanismof cellular uptake of phylloquinone associated with TRL in the bone is dependent on both heparansulfate proteoglycans (HSPG) and apolipoprotein E (ApoE) (Newman et al., 2002) and humanosteoblasts express several receptors: the LDL receptor, the LDL receptor-related protein 1, and to alesser degree the VLDL receptor (Niemeier et al., 2005). There is no information on the mechanism ofuptake of menaquinones by bones.
During pregnancy, only small quantities of phylloquinone cross the placenta from mother tofetus (Greer, 1995). Blood concentrations of phylloquinone in the full-term newborn are about half ofthat of the mothers and the phylloquinone concentration in cord blood is low (< 0.1 nmol/L) (Sheareret al., 1982; Pietersma-de Bruyn and van Haard, 1985; Greer et al., 1988; Mandelbrot et al., 1988).Little information is available on the amount of menaquinones crossing the placenta (Iioka et al.,1991).
2.3.4. Storage
2.3.4.1. Kinetic studies on the total body pool of phylloquinone
A kinetic study involved seven healthy US adults (3 women and 4 men; mean � SD:46 � 14 years, 71 � 8 kg mean body weight), who received a controlled diet providing daily 119 lgphylloquinone per 8.4 MJ (Novotny et al., 2010) (Section 2.3.1). Blood samples were taken on theintervention day and then for about 4 weeks. Intervention consisted of a single serving of labelled kale(equivalent to 70 lg unlabelled phylloquinone). A modelling of phylloquinone kinetics was developed,considering three compartments (for the gastrointestinal tract, the plasma and a body tissue pool).The authors used this compartmental modelling to determine the vitamin K utilisation rate and tissuestorage pool, considering US mean body weights of 86 and 74 kg, and plasma phylloquinoneconcentrations of 1.43 and 1.47 nmol/L for men and women respectively (as reported in Booth et al.(1997); McDowell et al. (2005)). The model indicated ‘tissue storage pools’ of 46 and 41 lgphylloquinone for men and women, respectively (or 0.53 and 0.55 lg/kg body weight, respectively).
In another kinetic study (Olson et al., 2002), seven healthy subjects (six men including fivefollowed as in-patients in a metabolic unit, and one woman, aged 22–49 years) consumed a diet(control period) providing a mean phylloquinone intake of 75 lg/day for 1–2 weeks. Then, they
6 i.e. about 1.6 mg phylloquinone and 2 mg MK-7.
Dietary reference values for vitamin K
www.efsa.europa.eu/efsajournal 15 EFSA Journal 2017;15(5):4780

consumed a ‘low-vitamin K’ diet providing a mean of 8 lg phylloquinone/day (n = 5 out of 7 subjects7)for 3 weeks (n = 2) to 8 weeks (n = 3, whose average body weight was about 72 kg (read onfigure)). Both diets provided a mean energy intake of about 8–12.8 MJ/day. Subjects received 0.3 lgisotopic-labelled phylloquinone administered intravenously at the end of each period, and providedblood, urine and faeces samples for 6 days after each injection (Section 2.3.6). Based on a two-compartment model, dilution of labelled phylloquinone indicated that the mean (� SD) total body poolof phylloquinone in the control or ‘low-vitamin K’ periods were 87.6 (� 55.6) lg and 44.7 (� 25.1) lg,respectively. However, according to the authors, plasma phylloquinone (used in the calculation of thebody pool) was overestimated8 due to the presence of an interference inherent to the analyticalmethod used (method of Ueno and Suttie (1983)). Taking into account the ‘lower’ values for plasmaphylloquinone, considered by the authors as more accurate, and the body weights of the participants(not reported for all), the authors calculated that the mean ‘exchangeable body pool size’ in subjectson the control diet would drop from 1.14 (SD 0.64) lg/kg to 0.57 (SD 0.32) lg/kg body weight. ThePanel notes that the results were similar to the results by Novotny et al. (2010) and that the study hasseveral limitations.
Ten healthy men and women (aged 22–31 years, mean body weight of 61 � 10.7 kg), consumed13C-labelled phylloquinone (three times 3 lg/day) with food (phylloquinone intake from food notprovided) for 6 days and then received a single intravenous dose of either 6 lg (n = 6) or 30 lg(n = 4) phylloquinone plus an oral dose of 4 lg 2H-labelled phylloquinone (Jones et al., 2008)(Section 2.3.1). Blood samples were collected the day before and on the day of the intravenousphylloquinone injection over 6 h post-dose. Phylloquinone in plasma was measured by high-performance liquid chromatography (HPLC) and isotope ratios by gas chromatography/massspectrometry (GC/MS). The use of a two-compartment model to calculate the total body pool size ofphylloquinone resulted in a mean of 2.3 lg (or 0.04 lg/kg body weight). The Panel notes the shorterlength of measurements (6 h post-dose) compared to the other studies, the different design, theabsence of information on phylloquinone intake from food, and that this ‘total body pool size’ ofphylloquinone appears to be underestimated.
Another study aimed to investigate, in four men receiving intravenous doses of radiolabelledphylloquinone, the potential interaction between clofibrate and warfarin on vitamin K disposition(Bjornsson et al., 1979). The authors indicate that the pool size of vitamin K in the body is ‘small’ butcould not be calculated for these subjects.
The Panel notes the uncertainties and methodological limitations of the studies by Jones et al.(2008) and Bjornsson et al. (1979), and considers that no conclusion can be drawn from these twostudies to assess the total body pool of phylloquinone.
2.3.4.2. Measurements of phylloquinone and menaquinones in the liver of adults
In livers obtained by autopsy (Rietz et al., 1970; Duello and Matschiner, 1972), MK-7, MK-8, MK-10and MK-11 were identified (as well as MK-4 and MK-9 in Duello and Matschiner (1972)). The authorsapproximated phylloquinone content to be about 50% of the total amount of vitamin K in the liver ona weight basis, visually from relative intensity of thin-layer chromatographic detection (Rietz et al.,1970) or ‘nearly one-half’ of vitamin K in the liver, i.e. about 60 ng/g of wet liver weight, as assessedby thin-layer chromatography and mass spectrometry (Duello and Matschiner, 1972). The Panel notesthat the method in these two studies does not allow a quantitative estimation of phylloquinone andmenaquinone concentrations in the liver.
In livers obtained by autopsy or donated for transplantation (thus with no information on previousintake), vitamin K concentration was assessed by HPLC in three studies. Concentration in ng/g, andthe ratio between phylloquinone and MK-n on a molar basis, were either reported or recalculated:
• The phylloquinone concentration in livers of 32 adults showed a wide range between1.1 and 21.3 ng/g wet liver weight, while the medians of 5.5 ng/g for men and 5.4 ng/g forwomen were quite similar (Shearer et al., 1988). The same authors also describe asemiquantitative analysis of menaquinones (i.e. by HPLC and comparison of peak area with thatof phylloquinone) of 10 liver samples of adults. Menaquinones accounted for (median, range)92% (75–97%) of the total amount of vitamin K in the liver on a molar basis. Chromatographicprofiles of 17 livers of adults showed MK-6, MK-7, and MK-8 to MK-11 to be present.
7 Two subjects dropped-out before the end of the phylloquinone restriction.8 Plasma phylloquinone concentration in the range of 0.82–3.33 nmol/L on the control diet.
Dietary reference values for vitamin K
www.efsa.europa.eu/efsajournal 16 EFSA Journal 2017;15(5):4780

• The mean concentration of phylloquinone in livers of three adults was 34 ng/g liver (range:about 8–83 ng/g) and that of menaquinones (MK-4 and MK-7 to MK-11 in most samples) was21 ng/g liver (range: about 12–36 ng/g) (Kayata et al., 1989). Phylloquinone accounted for(mean, range) 74% (33–90%) of the total amount of vitamin K in the liver on a molar basis.
• The mean concentration of phylloquinone in liver samples of three men and three women wasabout 7 ng/g wet liver weight (range: about 2–23 ng/g) (Thijssen and Drittij-Reijnders, 1996).The mean concentration of menaquinones (MK-4 and MK-6 to MK-11) was about 50 ng/g(range: about 21–87 ng/g wet liver). Phylloquinone accounted for (mean, range) about 21%(about 4–48%) of the total amount of vitamin K in the liver on a molar basis.
Fresh liver specimens (n = 15) were obtained by biopsy in patients who underwent gastrointestinalsurgery, with known phylloquinone and menaquinone intake (Usui et al., 1990). Seven patients hadbeen put on a standard diet (150–450 lg phylloquinone/day, < 2 lg/day each of MK-4 to MK-8), andeight on a low phylloquinone diet (per day 5 lg phylloquinone, 16 lg of MK-9, and MK-4, -5, -7, -8and -10 each about 1–3 lg), for 3 days before operation. Concentrations of phylloquinone andmenaquinones (MK-4 to MK-13) were measured by HPLC. The mean liver concentration ofphylloquinone was about 13 ng/g and 3 ng/g of wet liver weight with the standard and lowphylloquinone diets, respectively (significantly different, p < 0.01). Phylloquinone accounted for (mean,range) about 10% (about 9–12%) of the total amount of vitamin K in the liver on a molar basis withthe standard diet, while the mean percentage was 2.4% (about 2–4%) on the low phylloquinone diet.Total MK-n concentrations in the liver were not significantly different between the two groups, andwere (mean, range) about 205 ng/g (137–409 ng/g liver) on the standard diet and about 239 ng/g(166–321 ng/g) on the low phylloquinone diet. Mean total concentrations of vitamin K in the liver wereabout 217 ng/g with the standard diet and 242 ng/g with the low phylloquinone diet, which are higherthan the values reported by Thijssen and Drittij-Reijnders (1996) and Kayata et al. (1989). ThePanel notes that, while plasma phylloquinone was decreased by a low phylloquinone diet (and bypre-operative fasting) and liver phylloquinone was decreased by 3 days of a low phylloquinone diet,the total concentration of vitamin K in the liver was not. The Panel notes that this study conducted inpatients suggests that phylloquinone in the liver may be more rapidly depleted and catabolised thanMK-n.
The Panel notes that the mean/median phylloquinone concentration ranged between about 3 and34 ng/g of liver, that the mean concentration of menaquinones (MK-4 up to MK-13 according to thestudies considered) ranged from about 21 to 239 ng/g of liver, and that the mean/median percentageof phylloquinone in the total content of vitamin K of the liver ranged, on a molar basis, from 2.4% to74%. The Panel also notes that the range of the content of phylloquinone in the human liver is large,due to possible variability in phylloquinone intake and status, but also to possible conversion ofphylloquinone to MK-4 (Sections 2.1 and 2.3.5) and degradation of phylloquinone during tissuehandling and storage. The Panel notes that the reason for the high concentration of menaquinones inthe liver in the study by Usui et al. (1990) in view of their dietary intake remains unclear.
2.3.4.3. Measurements of phylloquinone and menaquinones in the liver of fetuses andnewborns
Phylloquinone concentration was in the range 0.4–3.7 ng/g in 21 fetal livers at 10–27 weeks ofgestation (median of 1.3 ng/g in n = 18 at 19–27 weeks of gestation), and in the range 0.1–8.8 ng/gliver for 10 term newborns (median 1.0 ng/g) (Shearer et al., 1988) (Section 2.3.4.2). Medianphylloquinone concentrations in the liver of fetuses and neonates did not significantly differ, but weresignificantly lower than those observed in adults in this study (p < 0.01). The authors could notidentify any menaquinones in livers of fetuses or neonates.
Liver samples from autopsies of full-term infants who died from sudden infant death syndrome,who were formula-fed and received a phylloquinone intramuscular injection at birth were also analysed(Kayata et al., 1989) (Section 2.3.4.2). Mean concentrations were 36 ng/g liver for phylloquinone and5.5 ng/g liver for menaquinones in infants aged less than 2 weeks (n = 2), and were 45 ng/g liver forphylloquinone and 36 ng/g liver for menaquinones (MK-4 and MK-7 to MK-10 in most samples) ininfants aged 2–4 months (n = 5). The statistical difference with adult values (mean of 34 ngphylloquinone/g liver, Section 2.3.4.2) was not tested.
The Panel notes that data are limited on phylloquinone concentration in the liver of fetuses,neonates and infants, and that these studies suggest that, at birth, the concentration of menaquinonesis low in the liver (compared to adults) and increases during the first year of life. This increase could
Dietary reference values for vitamin K
www.efsa.europa.eu/efsajournal 17 EFSA Journal 2017;15(5):4780

be related to the addition of complementary foods to the diet of infants and/or to the progressivecolonisation of the gut by MK-producing bacteria (Section 2.1).
2.3.4.4. Measurements of phylloquinone and menaquinones in extra-hepatic tissues
Phylloquinone and MK-n occur not only in liver and plasma, but data on tissue content in humansare limited. In tissue samples from autopsies (Thijssen and Drittij-Reijnders, 1996) (Section 2.3.4.2),apart from the liver, the concentrations of phylloquinone were highest in the heart and pancreas, andlowest in the lung, kidney and brain. In this study, MK-4 concentrations were highest in pancreas,kidney and brain and lowest in heart and lung. Molar ratios of MK4:phylloquinone showed that therewas more MK-4 than phylloquinone in the kidney and brain, similar amounts of both forms in pancreasand more phylloquinone than MK-4 in the heart. In a study on six men and women who had a hipreplacement (mean age: 69.7 � 8.8 years) (Hodges et al., 1993b), concentrations in cortical andtrabecular bone taken from the femoral neck ranged between 0.06 and 8.37 ng/g dry weight forphylloquinone and between 0.25 and 7.24 ng/g dry weight for MK-6 to MK-8.
2.3.4.5. Conclusions on storage
The total body pool of phylloquinone depends on phylloquinone intake, and is small, according tokinetic analyses. The Panel notes the limitations of available data from studies on total body pool ofphylloquinone in adults (Bjornsson et al., 1979; Olson et al., 2002; Jones et al., 2008) (Section 2.3.4.1).The Panel considers that the most accurate values of the body pool of phylloquinone come from acompartmental analysis of phylloquinone kinetics in women and men (Novotny et al., 2010), as it takesinto account the fast kinetics of phylloquinone. This study found ‘tissue storage pools’ of 46 and 41 lgfor men and women, respectively, or 0.53 and 0.55 lg/kg body weight. The Panel also notes that thestudy by Olson et al. (2002), when taking into account the value for plasma phylloquinone consideredas more accurate by the authors, provides a mean body pool of phylloquinone of 0.57 lg/kg bodyweight, a value which is close to the values of 0.53–0.55 lg/kg body weight obtained by Novotny et al.(2010). The Panel considers that a total body pool of phylloquinone of about 0.55 lg/kg bodyweight in healthy adults at steady state is associated with no signs of vitamin K deficiency.
The Panel notes that there is no data on the total body pool of menaquinones. Various organscontain phylloquinone and different menaquinones. The Panel notes that the liver is the organ thatcontains the highest concentration of vitamin K, as a mixture of phylloquinone and menaquinones (MK-4 up to MK-13 according to the studies considered), which contents are widely variable. The Panel alsonotes that relatively small amounts of vitamin K are reported in the liver of the newborn, in whichphylloquinone predominates over menaquinones.
2.3.5. Metabolism
The turnover of phylloquinone in the body proceeds through two phases. The first phase of fastturnover of phylloquinone has been associated with a plasma/serum half-life (t1/2) in the range of0.22–8.80 h (Section 2.3.2), and the second phase of slower turnover has been associated with atissue t1/2 in the range of 1.8–215 h, depending on studies and methodologies (Shearer et al., 1972,1974; Bjornsson et al., 1979; Schurgers and Vermeer, 2000; Olson et al., 2002; Erkkila et al., 2004;Jones et al., 2008; Novotny et al., 2010). The value of 215 h was obtained in the study of longestduration (3 weeks) (Novotny et al., 2010), but studies of shorter duration provided smaller values(Olson et al., 2002; Erkkila et al., 2004) or a few h in the remaining studies). In the kinetic study byOlson et al. (2002) (Sections 2.3.4 and 2.3.6), the mean turnover times were 39.7 and 36.1 h on thecontrol and low phylloquinone diets, respectively.
Phylloquinone is converted to menadione (Section 2.1) that is converted by cellular alkylation toMK-4, which is not commonly produced by bacteria in contrast to other MK-n (Section 2.1). Thistissue-specific conversion from phylloquinone has been observed in animals (e.g. rats, chicken),independently of gut bacteria since it occurs in germ-free rats (Will et al., 1992; Thijssen and Drittij-Reijnders, 1994; Davidson et al., 1998; Ronden et al., 1998; Al Rajabi et al., 2012). Data in humancells/humans are more limited and often refer to high doses of vitamin K. MK-4 epoxide accumulatedin human kidney cells incubated in the presence of 2.2 and 22 lmol/L of phylloquinone (Davidsonet al., 1998) and menadione was converted into MK-4 in cultures of several human cell lines (Thijssenet al., 2006). Authors believe the conversion of phylloquinone to menadione and MK-4 occurs also inhumans, during absorption in the intestinal mucosa and/or in other organs (Thijssen and Drittij-Reijnders, 1996; Thijssen et al., 2002, 2006). Urinary excretion of menadione increased following
Dietary reference values for vitamin K
www.efsa.europa.eu/efsajournal 18 EFSA Journal 2017;15(5):4780

single oral phylloquinone supplementation (10 mg) in healthy men, but not after a subcutaneousinjection (Thijssen et al., 2006). Urinary excretion of menadione was also stimulated by the intake ofsingle doses of MK-4 (15 mg), MK-7 (1 mg) or menadione (10 mg). The authors calculated that dailyurinary excretion of menadione corresponded on a molar basis to 1.6–5.6% of the phylloquinone oraldose and 1–2.5% of the MK-4 oral dose. In lactating women, the site of the conversion fromphylloquinone to MK-4 was suggested to be the mammary tissue, as MK-4 concentration in breast milkwas significantly correlated with phylloquinone concentration and increased with phylloquinonesupplementation of the mothers (0.8, 2 or 4 mg/day compared with an unsupplemented group)(Thijssen et al., 2002). The enzyme UbiA prenyltransferase domain-containing protein 1 (UBIAD1) hasbeen identified in humans and catalyses the initial side chain cleavage of phylloquinone to releasemenadione and the prenylation of menadione to form MK-4 (Nakagawa et al., 2010).
The hepatic and extra-hepatic metabolism of menadione has been assessed in isolated rat liversperfused with menadione (Losito et al., 1967) or in rats administered menadione orally (Hoskin et al.,1954; Losito et al., 1967; Thompson et al., 1972), but no data on menadione metabolism in humansare available.
Phylloquinone in the liver has a fast turnover and is catabolised to metabolites that are rapidlytransferred to plasma, urine and mainly bile, according to studies using radiolabelled tracer andunlabelled pharmacological doses of phylloquinone in humans (Shearer and Barkhan, 1973; Sheareret al., 1974; McBurney et al., 1980) (Section 2.3.6).
The catabolism of phylloquinone and menaquinones in the liver proceeds through a commondegradative pathway. The side chain is metabolised by an initial x-hydroxylation, followed by aprogressive side-chain shortening via the b-oxidation pathway (Shearer and Newman, 2014), until theside chain is shortened to two major metabolites with 7- and 5-carbon side chains. The 5C-metabolitehas the structure 2-methyl-3-(30-30-carboxymethylpropyl)-1,4-naphthoquinone and the 7C-metabolitehas the structure 2-methyl-3-(50-carboxy-30-methyl-20-pentenyl)-1,4-naphthoquinone (Figure 1 inSections 2.1 and 2.4). These two metabolites are conjugated with glucuronic acid and excreted in thebile (Shearer et al., 1972, 1974) and the urine (Shearer et al., 1970a, 1974; Shearer and Barkhan,1973; McBurney et al., 1980) (Section 2.3.6). The ingestion of a large single pharmacological dose ofphylloquinone (400 mg) by subjects treated with warfarin (Section 2.2.1) resulted in the isolation of athird aglycone metabolite in urine, identified as 2-methyl-3-(70-carboxy-30,70-dimethyl-20-heptenyl)-1,4-naphthoquinone (10C-metabolite) (McBurney et al., 1980).
The Panel notes that vitamin K has a fast turnover in the body. Phylloquinone can be convertedin humans to menadione and MK-4, independently of the gut microflora. In the liver, phylloquinoneand menaquinones are efficiently catabolised. The metabolism of phylloquinone and menaquinonesproduces the same metabolites, excreted in urine (5C, 7C or 10C) and bile (5C, 7C).
2.3.6. Elimination
2.3.6.1. Faeces
In the review by Shearer et al. (1974) (Section 2.3.1), in healthy subjects (n = 3) who ingested1 mg of radioactive phylloquinone with a meal, the radioactivity recovered from the faeces over aperiod of 3 days was 54–60% of the dose. From this, 15–23% was identified by the authors asunmodified, presumably unabsorbed phylloquinone and the remaining lipid-soluble radioactivityconsisted of more polar metabolites that were separated by thin-layer chromatography.
The radioactivity in faeces after 5 days from an intravenous dose of 1 mg radioactive phylloquinonerepresented 34% and 38% of the dose in two subjects, respectively (Shearer et al., 1972, 1974).No detectable faecal levels of radioactivity were present in a patient who also received this intravenousdose and whose total bile was collected for a period of 3 days, which indicates that the biliary route isthe major route by which vitamin K metabolites pass into the intestinal lumen and are excreted in thefaeces (Shearer et al., 1972). Shearer et al. (1974) also reported that, in one study in a subjectinjected with 45 lg radioactive phylloquinone, 51% of the dose was excreted in the faeces.
In the study by Olson et al. (2002) (Sections 2.3.4.1 and 2.3.5), in seven adults on the control dietproviding a mean intake of 75 lg phylloquinone/day and receiving 0.3 lg isotope-labelledphylloquinone administered intravenously, the total losses, measured by the excretion of radioactiveproducts of phylloquinone during 6 days following the injection, accounted for (mean � standard errorof the mean (SEM)) 61.8 � 2% of the isotopic dose, with 31.8 � 0.8% excreted in faeces throughthe bile. This decreased to a mean (� SEM) of 13.3 � 0.5% (p < 0.001) excreted in faeces when onthe low phylloquinone diet (providing 8 lg/day).
Dietary reference values for vitamin K
www.efsa.europa.eu/efsajournal 19 EFSA Journal 2017;15(5):4780
Both phylloquinone and menaquinones are more prevalent in the stools of formula-fed infantscompared to breastfed infants (Greer et al., 1988; Fujita et al., 1993).
2.3.6.2. Urine
After a 1 mg intravenous dose of tritiated phylloquinone, in three adults, the cumulative excretionwithin 3 days was 19–26% of the dose via the urine (Shearer et al., 1972). In healthy adults whoreceived an injection of 1 mg labelled phylloquinone with a meal, the urinary excretion of the ‘polarmetabolites’ was found to be virtually complete after 3 days, accounting for 8–26% of theadministered dose (mean of 19%) (Shearer et al., 1974). Shearer et al. (1974) also reported that, inone study in a subject injected with 45 lg radioactive phylloquinone, 18% of the dose was excretedin the urine. The major urinary metabolites are glucuronide conjugates.
In the study by Olson et al. (2002) (Sections 2.3.4.1, 2.3.5, and 2.3.6.1), in seven adultsconsuming the control diet providing 75 lg/day and receiving 0.3 lg isotope-labelled phylloquinoneadministered intravenously, losses of phylloquinone metabolites in urine, measured by the excretion ofradioactive products of phylloquinone (24 h urinary samples) during 6 days following the injection,were (mean � SEM) 30 � 1.8% of the isotopic dose. This value was 38.8 � 9.8% on the lowphylloquinone diet providing 8 lg/day. As plasma showed no detectable radioactivity after 6 days, theauthors hypothesised that the radioactivity unaccounted for in faeces (Section 2.3.6.1) and urineremained in the adipose tissue.
The 5C- and 7C-metabolites are common products of the metabolism of phylloquinone andmenaquinones (Figure 1 and Section 2.3.5). The 5C-metabolite was shown as the main urinary vitaminK metabolite in adults either unsupplemented or consuming various doses/intakes of phylloquinone,MK-4 or MK-7 (Harrington et al., 2005, 2007) (Section 2.4) and in term infants before or after vitaminK prophylaxis (Harrington et al., 2010). Urinary excretion of the 5C- and 7C-metabolites increases inadults also in response to supplementation with menadione and reflects the process of interconversionof menadione to MK-4 (Harrington et al., 2005).
In term infants, only 0.03% of a parenterally administered phylloquinone dose was excreted asurinary metabolites within the first 24 h post-prophylaxis (Harrington et al., 2010), which suggests thatthe rate of phylloquinone clearance to the urine in neonates is slower than in adults. This is supportedby the prolonged presence of phylloquinone in term neonate blood after its oral administration up to4 days (Schubiger et al., 1993, 1997).
2.3.6.3. Breast milk
The SCF (2003c) noted that breast milk contains ‘low’ concentrations of vitamin K (mostlyphylloquinone), between about 0.6 and 10 lg/L (von Kries et al., 1987a; Fomon, 2001). The SCF(2003c) also noted that the supply of vitamin K in breast milk is not sufficient to meet therequirements of all young infants. The SCF concluded that vitamin K supplementation is generallyrecommended in young infants in addition to the supply with breast milk. Based on data reported byIOM (2001), mean phylloquinone concentrations in breast milk around 2.5 lg/L, but varying from 0.85to 9.2 lg/L, were noted (EFSA NDA Panel, 2013a).
Phylloquinone concentrations in (mostly mature) breast milk of lactating women either notsupplemented or supplemented with phylloquinone, and menaquinone concentrations in mature breastmilk, in countries of the EU, the USA and Japan, are described in Appendix A, with details on stage oflactation.
In the EU, mean/median concentration of phylloquinone in breast milk of unsupplementedmothers of full-term infants was 1.2 lg/L in Germany (von Kries et al., 1987b), about 1.7 lg/L inAustria (Pietschnig et al., 1993), 2.1 lg/L in the UK (Haroon et al., 1982), about 2.2 lg/L in theNetherlands (Thijssen et al., 2002), and 9.18 lg/L in France (Fournier et al., 1987). The concentrationof phylloquinone in breast milk is affected by maternal oral supplementation (about 0.1–5 mgphylloquinone/day or up to 20 mg as one dose) in the EU and US studies, with mean concentrationreaching up to about 130 lg/L. When available, Appendix A reports on maternal vitamin K intake(Pietschnig et al., 1993) or status (Thijssen et al., 2002).
Limited data are available on menaquinone concentration in breast milk. In unsupplemented womenin the Netherlands (Thijssen et al., 2002), mean MK-4 concentration in breast milk was about 0.8–1 lg/Lat 16–19 days post-partum, and increased with phylloquinone supplementation (2 or 4 mg/day, p < 0.05compared with the unsupplemented group). Mean concentrations in breast milk in two Japanese studies(Kojima et al., 2004; Kamao et al., 2007a) were in the range of about 1.2–1.9 lg/L for MK-4 and about0.8–1.7 lg/L for MK-7.
Dietary reference values for vitamin K
www.efsa.europa.eu/efsajournal 20 EFSA Journal 2017;15(5):4780

2.3.6.4. Conclusions on elimination
The Panel notes that, with high oral doses of phylloquinone (e.g. 1 mg), non-absorbedphylloquinone plus phylloquinone metabolites excreted via the bile are eliminated via faeces in largeamounts, up to 60%. The Panel notes that the study by Olson et al. (2002), which measured lossesboth through collection of urine and faeces over 6 days, considered a lower intake (mean of 75 lgphylloquinone/day) that is closer to observed intake estimates (Section 3.2). Based on this study, thePanel considers that a mean of about 62% of injected phylloquinone is excreted as radioactivemetabolites in urine (mean of 30%) and faeces (mean of about 32%). No similar experiment wasavailable to assess losses of metabolites in urine and faeces after menaquinone ingestion. ThePanel also notes that the 5C-metabolite was the main urinary vitamin K metabolite in studies in adultsand term infants.
The Panel notes that breast milk of unsupplemented women in the EU contains ‘low’ mean/medianconcentration of phylloquinone, varying from about 1.2 to 9.2 lg/L. The concentration ofphylloquinone in breast milk is increased by maternal oral supplementation. Data on menaquinoneconcentration in breast milk in the EU are limited.
2.3.7. Interaction with other nutrients
Vitamin K intake is associated with changes in calcium balance that can positively influence bonecalcium content (EFSA NDA Panel, 2015b). The vitamin D metabolite 1,25(OH)2 D (together withvitamin K) is needed for the synthesis of osteocalcin in the osteoblasts, and it regulates the expressionof osteocalcin (EFSA NDA Panel, 2016).
Vitamin K and a-tocopherol (vitamin E) share common metabolic pathways, including bloodtransport via lipoproteins, catabolism and biliary excretion (Schmolz et al., 2016). Up-regulation ofthese pathways in response to increased a-tocopherol intake can increase the rate of vitamin Kcatabolism and/or urinary and faecal excretion (Traber, 2008). a-Tocopherol can also interfere with thevitamin K-activation of the pregnane X receptor, leading to modulation of the expression of oxidativeand conjugation enzymes (Landes et al., 2003). A cross-sectional study suggested that about 10% ofthe variation in plasma phylloquinone concentrations could be explained by plasma concentrations ofother fat-soluble vitamins, particularly a-tocopherol (Thane et al., 2006b). A competitive inhibition wasdescribed between tocopherol quinone and the phylloquinone hydroquinone for the vitamin K-dependent c-carboxylase (EFSA NDA Panel, 2015a). In its assessment of the UL for vitamin E, the SCF(2003a) concluded that ‘high’ intakes of ‘vitamin E’ in subjects with ‘low’ vitamin K status (caused bymalabsorption, impairment of the gut microbiota or therapy with anticoagulants) can cause impairmentof blood coagulation. The SCF indicated that this would be a result of a reduction of thecyclooxygenase pathway, therefore of the thromboxane synthesis, thus impairing the thromboxane-dependent blood coagulation and decreasing the coagulation factor II and VII. In healthy adults, ‘high’intake of a-tocopherol or a-tocopherol given intravenously can result in bleeding, prolonged PT,lowered vitamin K-dependent coagulation factors and appearance of undercarboxylated prothrombin inthe blood (Booth et al., 2004a). a-Tocopherol supplementation during 10 years had a mild anti-thrombotic effect (Glynn et al., 2007). Doses of RRR-a-tocopherol above the UL can result in anincrease in PIVKA-II in adults in blood with normal coagulation status (Booth et al., 2004a).
The Panel notes that ‘high’ intakes of a-tocopherol in subjects with ‘low’ vitamin K status cancause impairment of blood coagulation, and considers that data on interactions of vitamin K with othernutrients are limited.
2.4. Biomarkers
2.4.1. Prothrombin time (PT) test and partial thromboplastin time (PTT) test
The PT and PTT tests can reflect vitamin K deficiency (Section 2.2.2.1). PT has a usual range of10–16 s for infants and 11–14 s for adults; and PTT is 25.4–59.8 s in healthy full-term infants aged5 days and 26.6–40.3 s in adults, according to reviews (Andrew, 1997; Greer and Zachman, 1998).
The review by Suttie (1992) reports on an experiment in which ‘normal’ human plasma was mixedwith plasma from a warfarin-treated patient (25% of the ‘normal’ concentration of prothrombin) in
Dietary reference values for vitamin K
www.efsa.europa.eu/efsajournal 21 EFSA Journal 2017;15(5):4780

varying amounts. The curve of PT according to the percentage of ‘normal’ prothrombin shows that PTwas still ‘normal’9 in samples with only 50% of the ‘normal’ prothrombin, and that it increases only atlower percentages (Suttie, 1992; IOM, 2001), suggesting a low sensitivity of the PT test.
From patients with apoplexy fed parenterally without receiving vitamin K, some of them alsotreated with antibiotics (Frick et al., 1967) (Section 2.2.2.1), the authors estimated that the amount ofphylloquinone needed to recover a normal PT is between 0.03 and 1.5 lg/kg body weight per day inadults (body weight not given in the paper). The Panel notes that the results of this study showed alarge range of values (that may be explained by methodological limitations in measuring smalldifferences in phylloquinone concentrations).
Depletion/repletion studies in healthy individuals who consumed diets ‘low’ in phylloquinone, i.e.< 10 lg/day for 2–3 weeks, showed an increased coagulation time measured as PT in some subjects(Udall, 1965), but not in others (Allison et al., 1987; Ferland et al., 1993; Paiva et al., 1998), measuredeither as PT or PTT (Section 2.2.2.1). Dietary restriction of phylloquinone to 18 lg/day for 28 days(Booth et al., 2003b) or to about 35 lg/day for 40 days (Suttie et al., 1988)10 did not affect PT (Suttieet al., 1988) or PT and PTT (Booth et al., 2003b). Increasing phylloquinone intake from 100 lg/day toaround 400 lg/day did not induce any change in PT or PTT (Booth et al., 1999b).
PT and PTT cannot be considered as biomarkers of all the functions controlled by vitamin K(Section 2.2.1). A disturbed coagulation time (increase of PT or PTT) may also indicate hepaticdysfunction or haematological disease not related to vitamin K deficiency and several other acute orchronic conditions, as reviewed by Booth and Al Rajabi (2008). Thus, PT and the PTT are markers ofvitamin K status, but they are not specific.
The Panel considers that the PT and the PTT are not sensitive markers of vitamin K intake andstatus and non-specific indicators of vitamin K deficiency. PT and PTT cannot be considered as markersof all the functions controlled by vitamin K. The Panel also notes that depletion/repletion studies showthat vitamin K intakes sufficient for an adequate PT (e.g. equal or above 10 lg phylloquinone/day)may not be enough for the other functions controlled by vitamin K (as suggested by results on e.g.plasma phylloquinone, urinary Gla excretion, serum PIVKA-II, %ucOC) (Sections 2.4.2–2.4.7).
2.4.2. Plasma concentration and activity of blood coagulation factors
Among the vitamin K-dependent blood coagulation factors, i.e. factor II (prothrombin), VII, IX andX, synthesised by the liver as inactive forms (Section 2.2.1), factor VII (FVII) is the most frequentlyused, on the basis of its relatively short half-life (approximately 6 h) (Ferland et al., 1993; Kamaliet al., 2001). Normal laboratory ranges of FVII reported in studies in adults were about 70–130% of‘normal’ values, with 100% corresponding to the FVII value observed in normal pooled plasma, i.e.0.011 lM, or as Unit/mL (Allison et al., 1987; Andrew et al., 1988; Ferland et al., 1993). Authorsconsidered values of FVII less than 60% as abnormal (Allison et al., 1987).
The depletion study of Allison et al. (1987) (Sections 2.2.2.1 and 2.4.1) was undertaken in11 groups of three men each (aged 21–49 years, as inpatients in a ward) fed a diet containing lessthan 5 lg phylloquinone/day) for 2 weeks, with different antibiotics given orally or intravenouslyduring the last 10 days in 10 of these groups. FVII concentration decreased after antibiotics treatmentand was < 60% of ‘normal’ value on at least 1 day in 2/3 or 1/3 of treated subjects depending on thetype of antibiotic, but not in individuals without antibiotics. The Panel notes that, in the subjectswithout antibiotics, a phylloquinone intake of 5 lg/day for 2 weeks did not lead to a decrease in FVIIconcentration. The Panel also notes that it is unknown if the antibiotics tested, some being wellabsorbable or given intravenously, decreased menaquinone production by the gut microbiota.
In the depletion/repletion study of Ferland et al. (1993) (Sections 2.2.2.1, 2.4.1 and 4), 32 healthyadults aged 20–40 and 60–80 years, in a metabolic unit, not receiving antibiotics, were subjected to a4-day baseline diet, a 13-day depletion diet (about 10 lg phylloquinone/day) and a 16-day repletionperiod (additional phylloquinone of 5, 15, 25 and 45 lg/day). No statistically different changes in theproduction of FVII were observed during the study as mean FVII ‘functional activity’ remainedbetween 103% and 105%, while in both age-groups, PIVKA-II antigen concentration (Section 2.4.3)was increased significantly (p < 0.05) at the end of depletion compared to baseline.
Another depletion/repletion study was undertaken on nine younger (20–28 years) and nine older(55–75 years) men on their normal diet restricted in phylloquinone-rich foods and providing 83 lg
9 i.e. 10–11 s according to Suttie (1992).10 Used by the SCF to set DRVs for vitamin K, see Section 4.
Dietary reference values for vitamin K
www.efsa.europa.eu/efsajournal 22 EFSA Journal 2017;15(5):4780
phylloquinone/day (younger adults, about 1 lg/kg body weight per day) and 164 lg/day (older adults,‘about twice’ the amount consumed by younger adults) (Bach et al., 1996) (Section 4). Subjectsreceived after 3 days, and for 14 days, 1 mg/day warfarin (‘acquired vitamin K-deficiency’), andthereafter for 5 days 1 mg/day phylloquinone. Mean FVII activity was not affected by warfarintreatment whilst PIVKA-II concentrations (Section 2.4.3) increased by > 30% by day 10 of warfarintreatment (exact increase depending on analytical method used to assess PIVKA-II and age group),and while %ucOC (Section 2.4.3) increased continuously with time during depletion.
These studies in adults suggest that the depletion phase of about 2 weeks was too short for achange in FVII concentration/activity to occur. Both plasma concentration and functional activity ofblood coagulation factors (in particular FVII) have a low sensitivity as biomarkers of vitamin K intake.FVII activity can be modified by other causes than vitamin K deficiency, e.g. genetic or liver diseases(Green et al., 1976; Mariani et al., 2003), thus is not a specific marker of vitamin K status.
Prophylactic administration of phylloquinone to pregnant women (20 mg/day orally for at least3 days, during the second trimester or at birth) led to total prothrombin (factor II) activity in thefetuses (n = 41) or full-term neonates (n = 33) that were comparable to that of fetuses or neonatesfrom unsupplemented mothers. The values were lower than ‘normal’ adult values (pool of 30 healthydonors) (difference not tested) (Mandelbrot et al., 1988). Thus, phylloquinone administered to themother does not change factor II activity in newborns. At day 1 in full-term infants who all received1 mg intramuscular ‘vitamin K’ at birth (n = 59–61 depending on the clotting factor), factor II, VII, IX,and X average activities were about 40–60% of adult values (n = 29) (Andrew et al., 1987). Theauthors report that the activity of these four factors at 6 months were in the adult range.
The Panel notes that FVII concentration/activity is not a sensitive biomarker of phylloquinoneintake: for a change in FVII concentration/activity, the depletion phase of about 2 weeks in availablestudies may have been too short. The Panel also notes that FVII concentration/activity is not a specificmarker of vitamin K status. FVII concentration/activity does not represent all functions that arecontrolled by vitamin K (as shown in studies indicating no change in FVII activity during depletionwhile PIVKA-II concentration increased).
2.4.3. Circulating concentration of the undercarboxylated form of vitaminK-dependent proteins
Insufficient availability of vitamin K results in the secretion into plasma of biologically inactiveundercarboxylated vitamin K-dependent proteins (Ferland et al., 1993; Booth et al., 2000b, 2003b)(Section 2.2.1). Their concentrations have been proposed as biomarkers of vitamin K status/stores forcertain tissues (liver, bone, vessels (vascular calcification)) (Liska and Suttie, 1988; Szulc et al., 1993;Rennenberg et al., 2010; Schurgers et al., 2010).
2.4.3.1. Protein induced by vitamin K absence or antagonism-II (PIVKA-II) and S:E ratio
Normal blood concentration of PIVKA-II (Section 2.2.1) has been defined as ≤ 2 lg/L (Booth et al.,2000b, 2001, 2003b). A review by Shea and Booth (2016) indicates that commercially available PIVKA-II assays have low sensitivity for detecting variation in usual vitamin K intakes in healthy populations.The result of the assay for plasma concentration of functionally active prothrombin is also expressed asthe Simplastin:Ecarin (S:E) ratio, which compares the amount of prothrombin generated in the testsample by action of a commercial thromboplastin preparation (Simplastin) with that generated with aprotease (Ecarin) derived from the venom of the snake Echis carinatus.
PIVKA-II blood concentration changes according to vitamin K intake. In metabolic11 depletion/repletion studies in adults (Section 2.4.1), it increases significantly in response to dietary restriction ofphylloquinone (restriction to 10–18 lg/day) (Ferland et al., 1993; Booth et al., 2001, 2003b) anddecreases significantly in response to dietary repletion with phylloquinone (Booth et al., 2000b, 2001,2003b).
In particular, PIVKA-II significantly dropped between end of depletion (at 10–11 lg phylloquinone/day) and end of repletion (at 200 lg/day for 10 days), and was restored to a value of ≤ 2 lg/L (Boothet al., 2000b, 2001). In the study by Booth et al. (2003b) in post-menopausal women, that compriseda baseline diet (90 lg phylloquinone/day for 14 days) followed by a dietary depletion phase (18 lg/dayfor 28 days), mean PIVKA-II decreased during the three consecutive phases of repletion (86, 200 and450 lg phylloquinone/day for 14 days each) compared to the end of depletion. The decrease was not
11 Well-controlled studies in which participants were housed in a metabolic unit are termed metabolic studies.
Dietary reference values for vitamin K
www.efsa.europa.eu/efsajournal 23 EFSA Journal 2017;15(5):4780
statistically significant with 86 lg phylloquinone/day (concentration above 2 lg/L) but becamesignificant with 200 lg/day (concentration below 2 lg/L), until it attained the baseline value with450 lg/day (concentration of about 1.4 lg/L, read on figure). The Panel notes the discrepancy in theresults of this study, in that PIVKA-II concentration did not return to normal with an intake of 86 lgphylloquinone/day for 14 days, while it was normal with the baseline diet corresponding to a similarintake of 90 lg/day for 14 days that is a finding indicating vitamin K sufficiency.
In the depletion/repletion study by Suttie et al. (1988) (Section 2.4.1), used by the SCF to setDRVs for vitamin K (Section 4), 10 young men (mean � SD: 72 � 9 kg body weight) followed a‘normal’ diet with an intake of 82 lg phylloquinone/day for 7 days and continued with a restricted dietfor 21 days. Median phylloquinone intake at day 9 and 27 was 40 and 32 lg/day, respectively,analytically measured in duplicate portions of all foods and beverages consumed. Subjects were thensupplemented with either 50 or 500 lg phylloquinone/day from day 29 to 40 in addition to the samerestricted diet, then with 1 mg/day from day 41 to 47. The mean S:E ratio was significantly lower(p < 0.01) at the end of the restriction period compared with the ‘normal’ diet (0.9111 vs 1.024,respectively), and was restored to normal with either 50 or 500 lg/day supplementation.
Most infants with vitamin K deficiency have ‘high’ PIVKA-II concentrations, although it is notnecessarily a predictor of haemorrhagic disease. Detection rates of PIVKA-II in cord blood ranged fromabout 10–30% of full-term infants (Motohara et al., 1985, 1990; von Kries et al., 1992; Bovill et al.,1993). In full-term newborns (n = 156 enrolled), 47% of cord blood samples had PIVKA-II bloodconcentrations ≥ 0.1 AU/mL (Greer et al., 1998).
2.4.3.2. Undercarboxylated osteocalcin (OC) and matrix c-carboxyglutamic acid protein(MGP)
The serum concentrations or proportions of ucOC or desphospho-uncarboxylated MGP (dp-ucMGP)(Sections 2.2.1 and 2.3.3) expressed as percentage of the total form (e.g. %ucOC), have beenproposed as biomarkers for the extra-hepatic vitamin K status. The Panel notes that this expressionas percentage is more precise, because of the variability in the concentration of the total form. Therelationship between vitamin K supplementation (phylloquinone or MK-4 or MK-7) and absoluteconcentration of dp-ucMGP has been investigated (Cranenburg et al., 2010; Shea et al., 2011;Dalmeijer et al., 2012), showing a decrease in its concentration in the supplemented subjectscompared to placebo. In addition, concentration or % ucOC in serum have been proposed as abiomarker of bone vitamin K status, as described below.
A randomised cross-over metabolic depletion/repletion study compared the effects of phylloquinoneor dihydrophylloquinone (dK) on a number of markers in 15 healthy adults (20–40 years) (Booth et al.,2001) (Section 2.4.3.1). The two residency periods of 30 days each, separated by at least 4 weeks,consisted of: (1) a 5-day control diet (mean: 93.1 lg phylloquinone/day, no dK), (2) a 15–daydepletion diet (mean: 11.0 lg phylloquinone/day, no dK) and (3) a 10-day repletion diet (mean:206 lg phylloquinone/day with no dK, or 240 lg dK/day with 11.0 lg phylloquinone/day). Mean %uOC was about 28–29% during the control diet, significantly increased (p < 0.01) after the depletionperiod (to about 42–47%), then significantly decreased (p < 0.01) during the phylloquinone repletion(to about 20%, not significantly different from the control diet), but not during thedihydrophylloquinone repletion. The Panel notes that this study showed not significantly differentmean %ucOC with the daily intakes of about 90 lg and about 200 lg phylloquinone.
In the randomised cross-over metabolic study by Booth et al. (1999b) (Section 2.4.1) with threeresidency periods of 15 days each, 36 healthy younger and older adults (20–40 and 60–80 years)consumed a mixed diet containing 100 lg phylloquinone/day or the same diet supplemented for days6–10 with broccoli or fortified oil, thus providing 377 or 417 lg phylloquinone/day, respectively.Younger adults had significantly higher %ucOC than older adults on a mixed diet (p = 0.001, about23% vs about 18% (read on figures), respectively), but there was no difference between sexes. Inboth age-groups, mean %ucOC significantly decreased 5 days after the start of the supplementeddiets (no difference between supplemented diets), while it did not significantly change on the mixeddiet (i.e. about 20% (older adults) or 25% (younger adults) over the 15 days (read on figure)).
In a cross-sectional study in 396 healthy Japanese women (30–88 years) with high nattoconsumption (phylloquinone or menaquinone intake not reported), women older than 70 years(n = 136) had significantly higher (p < 0.003) %ucOC in blood than women < 70 years (Tsugawaet al., 2006). This is in contrast to the previous study by Booth et al. (1999b).
In randomised controlled trials (RCTs) (Binkley et al., 2002; Bolton-Smith et al., 2007; Kanellakiset al., 2012), in adult populations with mean baseline phylloquinone intake in the range of about 80–
Dietary reference values for vitamin K
www.efsa.europa.eu/efsajournal 24 EFSA Journal 2017;15(5):4780
120 lg/day, different high doses of phylloquinone (100–1,000 lg/day, from supplements or fortifiedfoods) compared to placebo/control significantly decreased mean % ucOC.
In a prospective cohort study of 245 healthy girls aged 3–16 years (Kalkwarf et al., 2004)(Section 5.2), baseline median phylloquinone intake (assessed by 3-day food records, from food andsupplements) was 45 lg/day (range: 6–275 lg/day). There was no association between phylloquinoneintake and %uOC after adjustment for energy intake or energy intake and age.
Cross-sectional analyses on 766 men and 925 women, either premenopausal or post-menopausalwith or without current oestrogen use (all groups having similar vitamin K intake), showed that post-menopausal women not using hormonal replacement therapy had higher mean %ucOC in blood(23.5%) compared to the other groups (14–16%, difference not tested) (Booth et al., 2004b).Untreated early post-menopausal women (n = 19, 40–52 years), also had significantly higher mean %ucOC than premenopausal women (n = 40 women aged 20–30 or 40–52 years) (21.9 vs 17.4%,p = 0.02) (Lukacs et al., 2006). These authors note that whether oestrogen directly modulatescarboxylation of OC remains unclear. In addition to vitamin K intake, %ucOC is influenced by non-genetic factors such as TG and smoking status (Shea et al., 2009).
A number of RCTs designed to investigate bone health (Section 5.2) have been done in Japaneseor European adult populations using MK-4 or MK-7 supplementation (Schurgers et al., 2007; Koitayaet al., 2009; Emaus et al., 2010; Bruge et al., 2011; Kanellakis et al., 2012; Nakamura et al., 2014;Inaba et al., 2015), and using MK-7 in children (van Summeren et al., 2009). The Panel notes theobserved changes in the ratio between carboxylated and ucOC according to menaquinone intake.However, doses used were much higher (45–360 lg/day for MK-7, 300–1,500 lg/day for MK-4) thanthe limited habitual intake of MK-4 or MK-7 in European populations (Section 3), and baseline vitaminK intake was not always reported (Schurgers et al., 2007; Emaus et al., 2010; Bruge et al., 2011;Nakamura et al., 2014). The Panel considers that these data are not relevant to conclude on therelationship of this biomarker with usual dietary menaquinone intake in European populations, thus,that no conclusion can be drawn from these studies for setting DRVs for vitamin K.
Based on data that used the same assay for %ucOC (Booth et al., 1999b, 2001), a cut-off of 20% hasbeen proposed by McKeown et al. (2002) as the %ucOC above which the risk for dietary vitamin Kinsufficiency (defined in relation to US DRVs for phylloquinone, see Section 4) increases. In thisobservational study (Section 2.4.4), the lowest quintile of phylloquinone intake (i.e. median of 64 lg/dayin women, 54 lg/day in men) was associated with a significantly higher risk of having a %ucOC above orequal to 20% (odds ratio (OR) (95% confidence interval (CI)): 2.51 (1.23–5.11), p = 0.01 in women;2.75 (1.29–5.87), p = 0.009 in men), compared to the highest quintile (median of 307 lg/day in womenand of 254 lg/day in men) (McKeown et al., 2002). However, the Panel notes that there is noreference level of c-carboxylation that can be considered as optimal related to functions controlled byvitamin K status. The Panel also notes that the relationship between %ucOC and bone mineral density(BMD) or risk of hip fracture has been investigated (Szulc et al., 1993, 1994; Schaafsma et al., 2000;Booth et al., 2004b), but the relevance of the 20% cut-off for %ucOC with regard to these outcomesremains to be established.
Observational studies evaluated the association between circulating concentration of dp-ucMGP orucOC and the risk of hip fracture (Szulc et al., 1996; Vergnaud et al., 1997), risk of elevated aorticpulse wave velocities (Pivin et al., 2015; Mayer et al., 2016), risk of fatal or non-fatal cardiovasculardisease (van den Heuvel et al., 2014), cardiovascular mortality or the risk of coronary events (Liuet al., 2015), extent of coronary artery calcification (Dalmeijer et al., 2013), estimated glomerularfiltration and risk of chronic kidney disease (Wei et al., 2016) and the risk of metabolic syndrome (Damet al., 2015). The Panel notes that there were only one or a few observational study (studies) for eachhealth outcome investigated and that vitamin K intake was not reported. The Panel also notes that theheterogeneity of these studies does not allow identifying a cut-off for dp-ucMGP or ucOC that isgenerally associated with adverse health outcomes. Overall, the Panel considers that the available dataon the relationship between circulating concentration of dp-ucMGP or ucOC and health outcomescannot be used to derive an adequate vitamin K status.
2.4.3.3. Conclusions on circulating concentration of the undercarboxylated form ofvitamin K-dependent proteins
The Panel notes that concentrations of circulating undercarboxylated forms of vitaminK-dependent proteins (in particular PIVKA-II and ucOC) have been proposed as biomarkers of vitaminK status/stores for certain tissues (in particular liver and bone). They are sensitive to phylloquinoneover a certain range of intake. Data on concentrations of circulating ucOC and menaquinone intake
Dietary reference values for vitamin K
www.efsa.europa.eu/efsajournal 25 EFSA Journal 2017;15(5):4780
(MK-4 or MK-7) have been obtained with doses much higher than the limited observed intake data ofMK-4 or MK-7 in Europe.
Normal blood concentration of PIVKA-II has been defined as ≤ 2 lg/L but commercially availablePIVKA-II assays have low sensitivity for detecting variation in usual vitamin K intakes in healthypopulations. The Panel notes that oestrogen status may be one determinant of vitamin K statusassessed as %ucOC independent of the diet in women, while the limited data on the influence of ageon %ucOC in adults are contradictory. The Panel notes that dietary intakes of phylloquinone ormenaquinones required for full c-carboxylation of PIVKA-II or OC or MGP have not been determinedand that the ‘optimal’ extent of carboxylation is not known.
2.4.4. Circulating concentration of vitamin K
Most of the data on plasma vitamin K concentration are related to phylloquinone, and data oncirculating menaquinone concentration (MK-4, MK-5 and MK-7) are limited, as reviewed by Shea andBooth (2016). This review reports that 31 English post-menopausal women (48–84 years) had a meanvalue of MK-7 of 1.44 nmol/L (commented in Kaneki et al. (2001)) and 62 Italian healthy subjects(53–61 years) had mean values of 0.41 nmol/L for MK-4, 0.58 nmol/L for MK-5, 0.50 nmol/L for MK-6and 0.88 nmol/L for MK-7 (Fusaro et al., 2012).
Because of the fast turnover of vitamin K (Section 2.3.4), plasma phylloquinone concentrationreflects recent intake of phylloquinone, and responds to an increase in phylloquinone intake within24 h (Sokoll et al., 1997) or to phylloquinone depletion within 3 days (Allison et al., 1987). In adults,circadian variation in the circulating mean vitamin K concentration (mainly phylloquinone) showsminimal and maximal levels at 10:00 and 22:00 h, respectively (Kamali et al., 2001), and plasma TGmirrored changes in plasma vitamin K concentration. In healthy adults, fasting plasma phylloquinoneconcentrations (not adjusted for TG) have a higher intra-individual than interindividual variability(Booth et al., 1997).
Circulating phylloquinone concentration decreased with phylloquinone restriction and increased withphylloquinone supplementation (doses up to 1,000 lg/day) (Ferland et al., 1993; Booth et al., 2000b,2003b; Binkley et al., 2002; Bolton-Smith et al., 2007). Considering phylloquinone absorption andtransport, and the correlation observed between plasma phylloquinone and TG concentration (Boothet al., 2004b; Tsugawa et al., 2006; Azharuddin et al., 2007), plasma phylloquinone concentrationshould be adjusted for TGs (nmol phylloquinone/mmol TG) (Shea and Booth, 2016). This is often notthe case in available studies (Ferland et al., 1993; Booth et al., 1999b, 2000b, 2003b; Binkley et al.,2002; Bolton-Smith et al., 2007).
• After phylloquinone restriction (18 lg/day for 28 days or 10 lg/day for about 2 weeks)(Sections 2.4.1, 2.4.2 and 2.4.3) (Ferland et al., 1993; Booth et al., 2003b), plasmaphylloquinone concentration significantly increased after repletion with 450 lg phylloquinone/dayfor 2 weeks (but not with 86 or 200 lg/day), although it did not return to initial levels (Boothet al., 2003b). However, in the other study (Ferland et al., 1993), it started to increase slightlyonly within the last repletion phase (additional 45 lg phylloquinone/day for 4 days) withoutreaching baseline values.
• Mean plasma phylloquinone not adjusted for TGs was significantly higher in older than in youngeradults (Ferland et al., 1993; Booth et al., 1999b) (Sections 2.4.2 and 2.4.3.2). However, in anobservational study, plasma phylloquinone concentrations adjusted for TGs were significantlylower in older adults (65–92 years, n = 195) compared to younger adults (20–49 years,n = 131) (Sadowski et al., 1989). In younger and older adults (Booth et al., 2002)(Section 2.3.1), whose plasma phylloquinone was measured for 24 h, and who consumed dietsproviding on average 100, 377 or 417 lg phylloquinone/day, there was a significant overall ageeffect when comparing plasma phylloquinone concentration, either unadjusted or adjusted forTG, at 0 and 24 h, although there were no age differences in the 24 h-AUC for plasmaphylloquinone adjusted for TGs.
A significant positive relationship between phylloquinone intake (from food or food andsupplements) and phylloquinone plasma concentration was also observed in large observational studiesin adults, over a large range of intake (5–1,000 lg/day measured by seven-day food record (Thaneet al., 2006b); 50–200 lg/day measured by a food frequency questionnaire (FFQ) (McKeown et al.,2002)).
Dietary reference values for vitamin K
www.efsa.europa.eu/efsajournal 26 EFSA Journal 2017;15(5):4780
In full-term infants (Greer et al., 1991), mean plasma phylloquinone concentrations were lower inexclusively breastfed compared to formula-fed infants (range: 0.29–0.53 nmol/L in 23 breastfed infantsbetween 6 and 26 weeks, vs 9.8–13.3 nmol/L in 11 formula-fed infants), in relation to their differentphylloquinone intake.12
The Panel notes that the circulating concentration of phylloquinone in blood is a biomarker ofshort-term phylloquinone intake in adults. Circulating phylloquinone decreases during phylloquinonedietary depletion and increases with phylloquinone supplementation. Plasma phylloquinoneconcentration needs to be adjusted for TG concentration, which is often not done in available data.The exact dose-response relationship is unclear. Data on circulating menaquinone concentrations arelimited. The Panel also notes that no cut-off value of plasma phylloquinone or menaquinoneconcentration has been set to define vitamin K adequacy (Shea and Booth, 2016).
2.4.5. Urinary concentration of c-carboxyglutamic acid (Gla) residues
In protein catabolism, Gla residues contained in the vitamin K-dependent proteins are not furthermetabolised and are excreted in the urine (Shea and Booth, 2016). As a result, urinary Gla excretionhas been used as an indicator of vitamin K status in adults. Urinary Gla excretion is a measure of theoverall body content of vitamin K-dependent proteins, including proteins whose functions are notrelated to haemostasis but have not been clearly established, as reviewed by Ferland (1998).
In the randomised cross-over metabolic depletion/repletion study in young men and women byBooth et al. (2001) (Section 2.4.3), mean urinary Gla concentration (measured in 24 h urine samples)significantly decreased during phylloquinone depletion (about 10 lg/day for 15 days) compared withthe control diet (about 100 lg phylloquinone/day for 5 days), then significantly increased withphylloquinone repletion (about 200 lg/day for 10 days) without returning to baseline values within thetime frame of repletion (and it did not react to dK supplementation). In the depletion/repletion studyin young adults by Suttie et al. (1988) (Sections 2.4.1 and 2.4.3), urinary Gla concentration wasmeasured in 3-day composite urine samples and expressed as a percentage of the ‘normal’ diet period(i.e. a diet with a median intake of 82 lg phylloquinone/day). Mean urinary Gla excretion at the end ofthe phylloquinone depletion period was significantly decreased (i.e. about 78% of the value of thenormal diet period, p < 0.01), then significantly increased with phylloquinone supplementation (50 or500 lg/day) compared to the depletion phase (p < 0.01, to reach about 97% of the value of the‘normal’ diet, the two supplemented groups were combined as not significantly different).
In the depletion-repletion metabolic study in younger and older adults (Ferland et al., 1993)(Sections 2.2.2.1, 2.4.1, 2.4.2 and 4), mean urinary Gla concentration (measured in 24 h urinesamples) significantly decreased in response to dietary phylloquinone depletion (~ 10 lg/day for13 days) in young adults compared to baseline (100 lg phylloquinone/day for 4 days). This was notobserved in the older adults (significant difference between age group, p < 0.03). Urinary Glaconcentration increased after phylloquinone supplementation (with additional 15, 25 and 45 lg/day,days 22–33, but not with additional 5 lg/day during days 18–21) in adults, respectively, with urinaryGla excretion reaching 96% of baseline values in young adults even with the supplementation at 45 lgphylloquinone/day (i.e. about 55 lg/day in total for 4 days). Twenty-four hours urine concentrations(lM, mean � SEM) at baseline, at end of depletion and at end of repletion were 38.5 � 1.5,35.2 � 1.4, and 36.7 � 1.1 for the young adults and 38.2 � 2.6, 38.0 � 2.4, and 39.4 � 2.7 for theolder adults, respectively.
In the randomised cross-over study by Booth et al. (1999b) (Sections 2.4.1 and 2.4.3), urinary Glaconcentration (measured in 24-h urine samples) did not change significantly during the 15-day mixed-diet period (100 lg/day) in younger and older adults. Urinary Gla concentration was expressed aspercentage of baseline and the mixed diet was compared with the supplemented diets (377 or 417 lgphylloquinone/day from days 6 to 10): there was no significant difference in urinary Gla concentrationbetween the three diets on day 10 (i.e. mean of about 101% of baseline values for each diet). As well,in the metabolic depletion/repletion study in post-menopausal women by Booth et al. (2003b)(Sections 2.4.1 and 2.4.3), mean urinary Gla concentration (measured in 24-h urine samples) wassignificantly lower (p < 0.05) at the end of the dietary depletion phase (18 lg/day for 28 days)compared to the start of the baseline diet (90 lg/day for 14 days), but did not significantly change
12 Mean at 6, 12 and 26 weeks: 0.07–0.12 µg/kg body weight per day in breastfed infants, and 7–9.3 µg/kg body weight perday in formula-fed infants.
Dietary reference values for vitamin K
www.efsa.europa.eu/efsajournal 27 EFSA Journal 2017;15(5):4780

during the three consecutive phases of dietary repletion (86, 200 and 450 lg phylloquinone/day for14 days each).
The Panel notes that urinary concentration of Gla residues, that is a measure of the overall bodycontent of vitamin K-dependent proteins, is sensitive to phylloquinone dietary depletion and may besensitive to phylloquinone supplementation over several days in studies in adults, but data on apossible relationship between urinary Gla concentration and phylloquinone supplementation areconflicting. Thus, a dose–response relationship between urinary concentrations of Gla residues withphylloquinone intake cannot be precisely established. The Panel is not aware of any data on therelationship between urinary Gla concentration and menaquinone intake in the range of observedintake in Europe (Section 3). The Panel notes that dietary intakes of phylloquinone or menaquinonesrequired for maximal or ‘optimal’ urinary Gla excretion have not been determined. The Panel alsonotes that there are no agreed cut-offs values for urinary Gla concentration that would indicatevitamin K adequacy. The available data suggest that the response of urinary Gla excretion to thesedietary changes is age-specific.
2.4.6. Urinary concentration of vitamin K metabolites 5C and 7C
The measurement of the urinary concentrations of the 5C- and 7C-metabolites, common to themetabolism of both phylloquinone and menaquinones (Sections 2.3.5 and 2.3.6), has also beenproposed as a marker of the total body pool of vitamin K in adults, as reviewed by Card et al. (2014).The 5C- and 7C-metabolites have been measured in 24 h or spot urine samples in unsupplementedhealthy adults on two consecutive days, and these concentrations respond to high-dosesupplementation with phylloquinone (2 or 50 mg), MK-4 (45 mg), MK-7 (1 mg) or menadione (20 mg)in adults or in neonates (intramuscular phylloquinone, 1 mg) (Harrington et al., 2005).
In a randomised cross-over study in nine adults residing in a metabolic unit for two 30-day-periods(separated by at least 4 weeks), subjects consumed a control diet (93 lg phylloquinone/day for5 days), then a phylloquinone-restricted diet (11 lg/day for 15 days), then a repletion diet with either206 lg phylloquinone/day or 240 lg dK/day for 10 days in separate residency periods (Harringtonet al., 2007). Urinary 5C- and 7C- metabolites concentrations, measured in 24-h urine samples,13
reacted differently to phylloquinone restriction. The urinary 5C-metabolite concentration significantlydecreased (p = 0.001) after phylloquinone restriction while the urinary 7C-metabolite concentration didnot. Both significantly increased after phylloquinone repletion to reach a plateau after 4 days.14 ThePanel notes that only one level of intake of phylloquinone was investigated during repletion.
The Panel notes that urinary concentrations of the 5C- and 7C-metabolites, which have beenproposed as biomarkers of total vitamin K status, are sensitive to phylloquinone or menaquinonesupplementation, but limited data showed that only the urinary 5C-metabolite concentration decreasedduring phylloquinone dietary depletion. The usefulness of the measurement of urinary concentrationsof the 5C- and 7C-metabolites to assess vitamin K status is limited by the proportion of thesemetabolites also excreted in the bile (Sections 2.3.5 and 2.3.6). The Panel considers that the dose–response relationship with vitamin K intake (phylloquinone or menaquinones) is not established, andnotes that no agreed cut-off for vitamin K adequacy has been identified.
2.4.7. Conclusions on biomarkers
Vitamin K deficiency leads to an increased PT, which is the only vitamin K biomarker that has beenassociated with adverse clinical symptoms. Symptomatic vitamin K deficiency and impairment ofnormal haemostatic control in healthy adults may take more than 2–3 weeks to develop at ‘low’phylloquinone intake (i.e. < 10 lg/day) (Section 2.2.1).
The other biomarkers (concentration/activity of blood coagulation factors, blood concentrations ofundercarboxylated forms of vitamin-K dependent proteins or of vitamin K, urinary concentrations ofGla residues or of vitamin K metabolites 5C and 7C) may change according to vitamin K dietary intake(biomarker of intake). In the available studies, dietary vitamin K restriction results in lowerphylloquinone plasma concentration, higher plasma concentration of undercarboxylated vitamin Kdependent proteins, lower urinary Gla excretion, and mostly not in PT increase (possibly in relation tothe short study duration). The Panel concludes that there are no biomarkers for which a dose-
13 Mean of 3.55 and 1.33 µg/day after the control period, respectively.14 5-C: mean of 2.89 µg/day at the end of depletion and of 8.48 µg/day at the end of repletion; 7-C: mean of 1.10 µg/day at
the end of depletion, and of 2.71 µg/day at the end of repletion.
Dietary reference values for vitamin K
www.efsa.europa.eu/efsajournal 28 EFSA Journal 2017;15(5):4780
response relationship with phylloquinone intake has been established. The available studies generallyassessed whether the biomarkers returned to baseline values with phylloquinone supplementation/dietary repletion after phylloquinone depletion. However, for these biomarkers, no cut-off value todefine adequate vitamin K status is available, so these changes in biomarkers are difficult to interpret.Studies investigating the relationship between biomarkers and intake of individual menaquinones oftenused doses much higher than the limited observed intake data of these individual menaquinones inEurope (Section 3). There is no reference level of c-carboxylation that can be considered as ‘optimal’related to functions controlled by vitamin K status and the dietary intakes of phylloquinone ormenaquinones required for maximal or ‘optimal’ urinary Gla excretion have not been determined.Thus, the Panel considers that none of these biomarkers is suitable by itself to assess vitamin Kadequacy. The Panel also considers that data on the effect of age and sex on vitamin K status inadults are insufficient for deriving the requirement for vitamin K according to sex or for ‘younger’ and‘older’ adults.
2.5. Effects of genotypes
The response of biomarkers to vitamin K intake varies among healthy individuals (Shea and Booth,2016). Meta-analysis of genome-wide association studies for single nucleotide polymorphisms (SNPs)associated with circulating phylloquinone concentrations identified multiple candidate genes related tolipoprotein and phylloquinone metabolism (Dashti et al., 2014).
A common polymorphism of the gene for the enzyme GGCX (Section 2.2.1) in human populationshas been associated with transcriptional activity and sensitivity to warfarin (Shikata et al., 2004;Wadelius et al., 2005; Vecsler et al., 2006). The GGCX rs699664 SNP induces an increased carboxylaseactivity (Kinoshita et al., 2007). In community-dwelling older adults, significant cross-sectionalassociation was observed between plasma phylloquinone concentration and/or plasma %ucOC andpolymorphisms of GGCX (Crosier et al., 2009). In an observational study investigating GGCXpolymorphism (974G>A) in healthy young Japanese subjects (Haraikawa et al., 2013), there was astatistically significant negative correlation between the ratio of ucOC to cOC and the intake of totalvitamin K in GG-type homozygotes (r2 = 0.294, p < 0.001) and heterozygotes (GA-type, r2 = 0.160,p < 0.001), but not in AA-type homozygotes.
In the VKOR protein structure (Section 2.2.1), the VKOR complex subunit 1 (VKORC1) is involvedin enzymatic activity (Goodstadt and Ponting, 2004) and common polymorphisms of the VKORC1 geneare associated with variability in the effect of warfarin (Li et al., 2006; Montes et al., 2006; Obayashiet al., 2006; Rettie and Tai, 2006; Garcia and Reitsma, 2008; Owen et al., 2010). In community-dwelling older adults, significant cross-sectional association was observed between plasmaphylloquinone concentration and/or plasma %ucOC and polymorphisms of VKORC1 (Crosier et al.,2009). In a Chinese cohort, SNPs and haplotypes within the VKORC1 locus were significantlyassociated with ucOC and PIVKA-II concentrations (Wang et al., 2006). Genetic polymorphisms in thecoagulation factor FVII (F7-323Ins10) and VKORC1 were found to have an impact on the coagulationprofile and the risk to develop intraventricular haemorrhage in a cohort (n = 90) of preterm infants(Schreiner et al., 2014).
Among the three common alleles of the gene encoding ApoE (i.e. E2, E3 and E4), the ability toclear intestinal lipoproteins rich in vitamin K from the blood is greatest with E4 and lowest with E2(Kohlmeier et al., 1995; Newman et al., 2002). However, the magnitude of the effect of ApoEgenotype on vitamin K status remains unclear, because in some studies, the highest frequency of E4allele was associated with lower %ucOC in blood but also with higher or no different plasmaphylloquinone concentration (Beavan et al., 2005; Yan et al., 2005).
Cytochrome P450 4F2 (CYP4F2) is involved in the hydroxylation of tocopherols and acts as aphylloquinone oxidase to produce the phylloquinone metabolite x-hydroxyvitamin K1 (McDonald et al.,2009). A CYP4F2 DNA variant (rs2108622; V433M) is present with a minor allele frequency of 5.8–26.7% in different ethnic groups (American, Chinese, Japanese and African subjects) (Caldwell et al.,2008). Carriers of this polymorphism need an increased warfarin dose for the anticoagulation activity(Caldwell et al., 2008), have lower CYP4F2 protein concentrations in liver and a reduced capacity tometabolise phylloquinone and may require lower dietary intakes of vitamin K compared to non-carriersto maintain an equivalent vitamin K status (McDonald et al., 2009).
The Panel notes that potential genetic determinants of vitamin K status include polymorphisms inthe genes involved in the activity, transport, uptake, metabolism, tissue-specific availability and
Dietary reference values for vitamin K
www.efsa.europa.eu/efsajournal 29 EFSA Journal 2017;15(5):4780

recycling of vitamin K, but considers that data on the effect of genotypes are insufficient to be usedfor deriving the requirement for vitamin K according to genotype variants.
3. Dietary sources and intake data
3.1. Dietary sources
Phylloquinone, present in all photosynthetic plants (Gross et al., 2006), is the predominantdietary form of vitamin K in the human diet. The primary sources of phylloquinone include dark greenleafy vegetables (e.g. spinach, lettuce and other salad plants) and Brassica (flowering, head or leafy),with contents of about 60–365 lg and about 80–585 lg/100 g, respectively, according to the Nutrientcomposition database (Section 3.2.1) of EFSA. Other sources of phylloquinone include some seed oils,spreadable vegetable fats and blended fats/oils (Piironen et al., 1997; Peterson et al., 2002), withcontent of about 25–60 lg/100 g, based on this EFSA database.
For (total or individual) menaquinones, food composition data are limited in the EU (Schurgerset al., 1999; Koivu-Tikkanen et al., 2000; Schurgers and Vermeer, 2000; Anses/CIQUAL, 2013;Manoury et al., 2013), in the US (Elder et al., 2006; Ferreira et al., 2006; USDA, 2015; Fu et al., 2016)and in Japan (Hirauchi et al., 1989; Kamao et al., 2007b).
Menaquinones are found in animal-based foods, in particular in liver products: mostly MK-4 in therange 0.3–369 lg/100 g in the EU, MK-9 to MK-11 in the range 0.4–492 lg/100 g in the USA, and MK-6 to MK-14 in the range 0.03–44 lg/100 g in Japan. Menaquinones are also found in meat and meatproducts (mostly MK-4, in the range 0.1–42 lg/100 g in the available data), and in poultry productsthat are particularly rich in MK-4, as poultry feed is a rich source of menadione, subsequently convertedto MK-4 in certain tissues of the poultry (in the range 5.8–60 lg/100 g in the EU, and 9–39 lg/100 g inthe USA and Japan). Menaquinones are also present in some cheese and other dairy products: EU dataon MK-4 to MK-10 (in particular MK-9) are in the range 0.1–94 lg/100 g, while US and Japanese data,mainly on MK-4, are in the range 1–21 lg/100 g. In natto, the most abundant menaquinone is MK-7,in the range of about 850–1,000 lg/100 g (EU and Japanese data). Limited data on menaquinones arealso available in a number of other products: in eggs (in particular in egg yolk) the most abundantmenaquinone is MK-4, in the range 10–30 lg/100 g in the EU, or 9–64 lg/100 g according to Japaneseand US data, in fish, spices, chocolate, oil or bread, pies and pie crusts, fast food compositedishes (MK-4 to MK-8 and total menaquinones in EU and US data).
For dihydrophylloquinone (Section 2.1), the highest contents (about 60–165 lg/100 g) arereported in products such as some shortenings, some margarines, some snacks and crackers, somepie crusts and some pop-corns (USDA, 2015).
Currently, phylloquinone (phytomenadione) and menaquinone (menaquinone occurring principallyas MK-7 and, to a minor extent, MK-6) may be added to foods15 and food supplements.16 Thevitamin K content of infant and follow-on formulae and of processed cereal-based foods and babyfoods for infants and children is regulated.17
3.2. Dietary intake in Europe
The Panel aimed at presenting in this Section observed intakes of vitamin K (both forms) or ofphylloquinone or (total or individual) menaquinones in Europe estimated using the EFSAComprehensive European Food Consumption Database (EFSA, 2011b) and the EFSA Nutrientcomposition database compiled during a procurement project (Roe et al., 2013) involving severalnational food database compiler organisations. However, the EFSA Nutrient composition database didnot contain data on phylloquinone or menaquinones, most of the involved national food compositiondatabases did not contain any vitamin K data and the estimates for ‘total vitamin K’ also havelimitations as described below (Section 3.2.1). In view of these limitations, the Panel also collectedpublished data on estimated intake of phylloquinone and menaquinones (Section 3.2.2).
15 Regulation (EC) No 1925/2006 of the European Parliament and of the Council of 20 December 2006 on the addition ofvitamins and minerals and of certain other substances to foods. OJ L 404, 30.12.2006, p. 26.
16 Directive 2002/46/EC of the European Parliament and of the Council of 10 June 2002 on the approximation of the laws of theMember States relating to food supplements. OJ L 183, 12.7.2002, p. 51.
17 Commission Directive 2006/141/EC of 22 December 2006 on infant formulae and follow-on formulae and amending Directive1999/21/EC, OJ L 401, 30.12.2006, p. 1. and Commission Directive 2006/125/EC of 5 December 2006 on processed cereal-based foods and baby foods for infants and young children, OJ L 339, 6.12.2006, p. 16–35.
Dietary reference values for vitamin K
www.efsa.europa.eu/efsajournal 30 EFSA Journal 2017;15(5):4780

3.2.1. Dietary intake of ‘total vitamin K’ estimated by EFSA
3.2.1.1. Methodology
The Panel presents in this Section observed ‘total vitamin K’ intakes in Europe, estimated by EFSAusing the EFSA Comprehensive European Food Consumption Database and the EFSA Nutrientcomposition database. Data presented as ‘total vitamin K’ in the EFSA Nutrient composition databasewere available originally only from three countries (Denmark, Germany and Sweden). Involved fooddatabase compiler organisations were allowed to borrow food composition data from other countries incase no original composition data were available in their own national database. As a result, Germanyand Sweden borrowed, respectively, 2.5% and 30% of the ‘total vitamin K’ values they reported in thecomposition database, while Finland, Italy, the UK, the Netherlands and France borrowed 100% of thevalues reported. In addition, further research on the websites of the Danish,18 German19 andSwedish20 food composition databases suggests that only the data originally provided by Sweden maycorrespond to amounts of both phylloquinone and menaquinones, while data originally provided byDenmark and Germany concern phylloquinone only. This means that phylloquinone data and vitamin Kdata (i.e. phylloquinone and menaquinones) may have been listed under the term ‘total vitamin K’ inthe composition data provided to EFSA. For intake estimates of Ireland and Latvia, food compositiondata from the UK and Germany, respectively, were used by EFSA, because no specific compositiondata from these countries were available. The Panel notes that these methodological limitationsinduce considerable uncertainty in the ‘total vitamin K’ intake estimates for the included Europeancountries.
This assessment includes food consumption data from 13 dietary surveys (Appendix B) from ninecountries (Finland, France, Germany, Ireland, Italy, Latvia, the Netherlands, Sweden and the UK).Individual data from these nationally representative surveys (except for the Finnish surveys in children)undertaken between 2000 and 2012 were available to EFSA, and classified according to the FoodEx2food classification system (EFSA, 2011a). Intake calculations were performed only on subjects with atleast two reporting days. For EFSA’s assessment, it was assumed that the best intake estimate wouldbe obtained when both the consumption data and the composition data are provided to EFSA for thesame country. EFSA intake estimates are based on consumption of foods, either fortified or not, butwithout taking dietary supplements into account.
The data covers all age groups from infants to adults. Data on infants 1–11 months old wereavailable from Finland, Germany, Italy and the UK. The proportions of breastfed infants were between21% and 58% according to the survey considered and most breastfed infants were partially breastfed(see table footnotes of Appendices C–D). The Panel notes the limitations in the methods used forassessing breast milk consumption in infants (table footnotes of Appendices C–D) and relateduncertainties in the intake estimates for infants.
3.2.1.2. Results
Taking into account the uncertainties mentioned above, ‘total vitamin K’ intake mean estimatesranged between 23 and 61 lg/day in infants (< 1 year), between 36 and 53 lg/day in children aged1 to < 3 years, between 42 and 93 lg/day in children aged 3 to < 10 years, between 68 and 143 lg/dayin children aged 10 to < 18 years (Appendices C–D). ‘Total vitamin K’ intake mean estimates rangedbetween 72 and 196 lg/day in adults (≥ 18 years). The main food group contributing to ‘total vitamin K’intakes was vegetables and vegetable products (Appendices E–F). Leafy vegetables followed by Brassicavegetables were the most important contributors to ‘total vitamin K’ intakes for all age classes apart frominfants, for whom the group ‘food products for young population’ was the main source of ‘total vitamin K’.Also, composite dishes were contributors to ‘total vitamin K’ intakes, probably at least partly due tovegetable-based ingredients in the dishes, as well as (to a lower extent) the groups ‘animal andvegetable fats and oils’ and ‘legumes, nuts, oilseeds and spices’.
Mean intake estimates in adults for two countries (Italy, the Netherlands) were generally higherthan the others (and higher than about 150 lg/day) in the different age ranges investigated in adults(Section 3.2.2 for other published Dutch intake data). This may be explained by a particular highcontribution of leafy vegetables and aromatic herbs (Italy) and Brassica vegetables (the Netherlands)
18 http://www.foodcomp.dk/v7/fcdb_aboutfooddata_vitamins.asp#Vitaminand http://frida.fooddata.dk/CntList.php19 https://www.blsdb.de/assets/uploads/BLS_Variablen_3.02.pdf20 http://www.livsmedelsverket.se/livsmedel-och-innehall/naringsamne/vitaminer-och-antioxidanter/vitamin-k/
Dietary reference values for vitamin K
www.efsa.europa.eu/efsajournal 31 EFSA Journal 2017;15(5):4780

compared to the other countries, while composition data for these food categories were generally inline among countries.
3.2.1.3. Discussion
EFSA intake estimates were compared with published intake estimates from the same includednational surveys. Published data were available for comparison only in Finland, i.e. for children aged10 to < 18 years (Hoppu et al., 2010) and adults (FINDIET 2012 ( Helld�an et al., 2013)), and inGermany for children aged 3 to < 18 years (Mensink et al., 2007)).
EFSA mean intake estimates for Finnish adults differed by about 5–12% from the published values(Helld�an et al., 2013). The comparison of EFSA intake estimates with the published intake estimates ofFinnish children (Hoppu et al., 2010) (i.e. different by 12–14%) have inherent limitations as they werefor two consecutive days of dietary recall, while EFSA data comprised 2 9 48-h dietary recall. Thesources of ‘total vitamin K’ in the diet were not presented in this publication, and therefore could notbe compared with EFSA’s estimates. Considering the uncertainties of this intake assessment by EFSA(discussed above), a difference of up to 14% can be considered acceptable.
Difference between the ‘total vitamin K’ intake calculated by EFSA and the published estimates forGerman children (Mensink et al., 2007) (different by 63–65%, EFSA estimates being lower than thepublished values) is large. The published intake estimates for children are high even in comparisonwith intakes reported for older age classes in a different study in Germany (DGE, 2012) (Appendix G).One possible explanation could be a different version of the German Nutrient composition databaseused for this last publication and for the publication on children, which was confirmed by a personalcommunication.21 This communication indicated that phylloquinone intake data in children werecalculated on the basis of version II.3 of the German Nutrient composition database(Bundeslebensmittelschl€ussel (BLS)) of the Max Rubner Institut (MRI),22 and were higher than adultdata, calculated with the newer version of the BLS (3.02). The EFSA Nutrient composition databasecontained German data that were also from an earlier version (BLS 3.01), but these vitamin K datawere identical to the current BLS version 3.02. In the newer version of the BLS (3.02), 120 morerecent and better data have been introduced. With the introduction of the new data, 77 items had74% lower phylloquinone content, and 43 items had 67% higher phylloquinone content. In conclusion,the ‘older’ data are too high, but, on the other hand, the new data have flaws and may yield someunderestimation, due to the lack of data source (thus the values were considered as ‘missing’ by thenational food database compiler and ‘0’ for intake calculations).
Uncertainties on the nature of the ‘total vitamin K’ composition data (i.e. phylloquinone only or thesum of phylloquinone and menaquinones) and on the assessment of the intake data in infants (seetable footnotes of Appendices C–D) have been discussed above. In addition, uncertainties in theestimates of all countries may be caused by inaccuracies in mapping food consumption data accordingto the FoodEx2 classification, analytical errors or errors in estimating ‘total vitamin K’ composition forthe food composition table, due to the use of borrowed ‘total vitamin K’ values from other countriesand the replacement of missing ‘total vitamin K’ values by values of similar foods or food groups in theintake estimation process. These uncertainties may, in principle cause both too high and too lowestimates of ‘total vitamin K’ intake.
3.2.2. Dietary intake of phylloquinone and menaquinones as reported in theliterature
The Panel performed an additional literature search on vitamin K intake estimates (i.e.phylloquinone, total or individual menaquinones) in observational studies/surveys undertaken inEurope, mainly in adults (Appendix G). Appendix G reports estimated dietary intakes as reported in theliterature (national cross-sectional surveys, large prospective cohorts and one case control study), withavailable information on, e.g. the number of subjects, the intake assessment method (FFQ, foodrecords on several days, several 24-h dietary recalls) or the source of the composition data forvitamin K. Comparison of EFSA’s ‘total vitamin K’ intake estimates in EU countries with the publishedintakes of vitamin K from studies undertaken outside Europe (Korea, USA and Japan) (Booth et al.,1996b, 2003a; Feskanich et al., 1999; Kamao et al., 2007b; Kim et al., 2013) was not undertaken, asconsumption patterns are significantly different.
21 From a member of the team in charge of the German Nutrient composition database (BLS) at the Max Rubner Institute.22 https://www.blsdb.de/
Dietary reference values for vitamin K
www.efsa.europa.eu/efsajournal 32 EFSA Journal 2017;15(5):4780

Published studies on intake of phylloquinone or menaquinones used different designs, dietaryintake assessments and food composition data, which limit direct comparisons between them(Appendix G). However, the intake estimates of ‘vitamin K’ or phylloquinone of these publications arevariable and not completely in line with EFSA’s calculations (Section 3.2.1). This can be explained bydifference in the methods to assess intake (dietary recalls or record for at least two reporting days forEFSA’s calculations, vs e.g. dietary history or FFQ), the methods of statistical analysis, the sources ofcomposition data, the adjustments of intake values, or the size and characteristics of the samples ofsubjects that were smaller and/or not nationally representative. These differences make thesepublished values not directly comparable with EFSA’s intake estimates.
Six studies estimated the intake of phylloquinone and menaquinones separately using FFQs,including one (Geleijnse et al., 2004) being on subjects from the same Dutch prospective cohort as inanother study (Schurgers et al., 1999) but considering more publications on composition data; andother Dutch, Norwegian and German prospective cohorts (Appendix G). The individual menaquinonesinvestigated in these studies were not all the same. Estimated median intake of total menaquinones inGermany (34.7 lg/day) (Nimptsch et al., 2008) and Norway (10.8 and 11.9 lg/day in men andwomen respectively) (Apalset et al., 2011) represented about 30% and about 15%, respectively,of estimated median phylloquinone intake (93.6 lg/day in Germany and 67 and 78.4 lg/day in menand women in Norway, respectively). Estimated mean total menaquinone intake (about 27–31 lg/day)was about 10–13% of the sum of the mean intake of phylloquinone and the mean intake ofmenaquinone in the Netherlands (about 230–288 lg/day according to sex and study) (Schurgerset al., 1999; Geleijnse et al., 2004; Gast et al., 2009; Vissers et al., 2013).
Among individual menaquinones, MK-4, MK-8 and MK-9 had the highest contributions to totalmenaquinone intakes in one Dutch and one German studies in adults (Nimptsch et al., 2008; Gastet al., 2009). MK-7 is used in the EU for fortification and supplementation (Section 3.2.1) but no datawere available to EFSA to assess its intake via these sources.
In addition, personal communication23 suggested that ‘older’ published vitamin K intake data fromthe Netherlands, like the German data for phylloquinone intake calculated with the older version of theBLS (II.3) (Sections 3.2.1.3), are an overestimate of the actual vitamin K intake. This may be due tothe fact that both Germany and the Netherlands used the same ‘old’ composition data from Schurgers(in both cases the intakes were 200 lg/day or more), that the current analytical methods may bemore precise than in the past, and that different food consumption measurements have been used(FFQ in the Dutch studies mentioned above, vs 2 9 24-h recall in the recent Dutch food consumptionsurvey). Personal communication also confirmed that the Dutch National Food Composition tables forvitamin K (phylloquinone and MK-4 to MK-10) are being updated, with analytical values from Dutchanalysis and new literature values are used (e.g. from the database of the US Department ofAgriculture USDA) whenever possible. Vitamin K intake data estimated from the Dutch National FoodConsumption Survey 2007–2010 were calculated with partially updated composition data from 2013,which cover the most relevant sources of vitamin K but are not complete. This may lead to a possibleunderestimation of the vitamin K intake. In a recently published memo on this Dutch NationalSurvey,24 the median (mean, IQR) intake estimates for vitamin K (phylloquinone and MK-n) forchildren are 62 (70, 43–89) and 72 (80, 51–99) lg/day for girls (n = 857) and boys (n = 856) aged7–18 years, respectively. For adults aged 19–69 years, these values were 100 (111, 70–140) and 117(128, 85–159) lg/day in women (n = 1,051) and men (n = 1,055), respectively. Of note, according tothe German National Nutrition Survey II (DGE, 2012) using a recently updated version of theGerman Nutrient composition database (BLS 3.02, MRI, Section 3.2.1.3), median phylloquinoneintake, assessed by 2 9 24-h recall, was 76 lg/day (95% CI: 75–77) for subjects aged 15–80 years(n = 6,160) (mean intake was not reported).
3.2.3. Conclusions on dietary intake in Europe
The Panel notes that ‘total vitamin K’ mean intake estimated by EFSA for nine EU countries rangedbetween 72 and 196 lg/day in adults (≥ 18 years). The Panel notes the uncertainties in this intakeassessment, in particular with regard to the nature of the ‘total vitamin K’ composition data (i.e.phylloquinone only or the sum of phylloquinone and menaquinones) and on the assessment of the
23 From members of the National Institute for Public Health and the Environment in the Netherlands, and a member of the teamin charge of the German Nutrient composition database (BLS) at the Max Rubner Institute as mentioned in Section 3.2.1.3.
24 http://www.rivm.nl/dsresource?objectid=b96a6448-882a-41c1-bb72-6ece306bc4b2&type=org&disposition=inline
Dietary reference values for vitamin K
www.efsa.europa.eu/efsajournal 33 EFSA Journal 2017;15(5):4780

intake data in infants, and that intake of phylloquinone or menaquinones in these countries could notbe estimated by EFSA with the available databases.
Published data on intake of phylloquinone and menaquinones in Europe show that phylloquinone isthe major form consumed although the exact proportion of phylloquinone in vitamin K intake remainsuncertain, and suggest that MK-4, MK-8 and MK-9 have the highest contributions to the intake of totalmenaquinones.
The Panel also notes the updated food composition database and intake estimates for theNetherlands (vitamin K, i.e. phylloquinone and menaquinones, in children and adults) and for Germany(phylloquinone, in adults). These updated median intake estimates are in line with the lower bound ofthe range of mean intakes in adults in nine EU countries estimated by EFSA, mentioned above.
4. Overview of Dietary Reference Values and recommendations
4.1. Adults
D-A-CH (2015) derived an adequate intake (AI) for vitamin K of 1 lg/kg body weight per dayfor adults, based on the influence of vitamin K (phylloquinone) on blood coagulation (Frick et al.,1967; National Research Council, 1989; Suttie, 1996).25 Expressed in lg/day, the AIs were 70 and60 lg/day for men and women aged 19–50 years, respectively. As a precaution, the AIs for olderadults were increased, i.e. 80 lg/day for men and 65 lg/day for women, to take into account possiblemalabsorption and medication at that age.
For the NNR 2012, due to a lack of additional evidence, the NCM (2014) kept the provisionalrecommended intake of 1 lg/kg body weight per day previously set for adults, taking into accountthat phylloquinone intakes of about 60–80 lg/day (i.e. 1 lg/kg body weight per day) are adequate toprevent vitamin K deficiency in healthy subjects (Suttie et al., 1988; National Research Council, 1989;Jones et al., 1991; Bach et al., 1996). The Council considered that the available evidence on therelationship between intake of phylloquinone or menaquinones and health consequences (bone health,atherosclerosis and other health outcomes) could not be used to set reference values for vitamin K. TheCouncil noted the low prevalence of vitamin K deficiency in the general population, the impossibility toinduce deficiency symptoms with a vitamin K depleted diet, and the insufficient bacterial synthesis ofvitamin K in the intestine to maintain serum concentrations of vitamin K. The Council considered thatdata on biomarkers (concentration of coagulation factors, plasma/serum concentrations ofphylloquinone, degree of carboxylation of vitamin K-dependent proteins, urinary vitamin K metabolites)(Suttie et al., 1988; Ferland et al., 1993; Booth and Suttie, 1998; Booth et al., 2001, 2003b; Binkleyet al., 2002; Bugel et al., 2007; Harrington et al., 2007; Schurgers et al., 2007; Booth, 2009; McCannand Ames, 2009) were insufficient to change the previously set reference value.
The World Health Organization WHO/FAO (2004) derived a Recommended Nutrient Intake (RNI) of1 lg/kg body weight per day of phylloquinone, corresponding to 55 lg/day for adult womenand 65 lg/day for adult men. WHO/FAO (2004) set this value considering the function of vitamin K inblood coagulation and the average intakes (mainly of phylloquinone) in adults that are close to UK andUS reference values of this period (National Research Council, 1989; DH, 1991; Suttie, 1992; Boothet al., 1996a). WHO/FAO (2004) considered that available data on c-carboxylation of OC could not beused to set reference values (Sokoll et al., 1997).
The US Institute of Medicine (IOM, 2001) considered that data on biomarkers of vitamin K status,including PT, FVII activity, plasma/serum concentrations of phylloquinone, the degree of carboxylationof vitamin K-dependent proteins (prothrombin, OC) and urinary vitamin K metabolite concentrationscould not be used to assess the requirements for vitamin K. The IOM considered that only PT hasbeen associated with adverse clinical effects and that the significance of changes observed in the otherbiomarkers following changes in vitamin K intake is unclear. The IOM considered that data on therelationship between vitamin K intake and chronic diseases (osteoporosis, atherosclerosis) could not beused as well. The IOM reported on data showing abnormal PIVKA-II concentrations for intakes(phylloquinone) below 40–60 lg/day and lack of signs of deficiency to intakes above 80 lg/day (Suttieet al., 1988; Jones et al., 1991; Ferland et al., 1993; Bach et al., 1996). IOM (2001) took into accountthe lack of sufficient dose–response data between vitamin K intake and biomarkers of status, theuncertainty surrounding the interpretation of these biomarkers and the low prevalence of vitamin K
25 The conclusion of the NRC (1989) was mainly based on Frick et al. (1967) and Suttie et al. (1988), which both dealt withphylloquinone.
Dietary reference values for vitamin K
www.efsa.europa.eu/efsajournal 34 EFSA Journal 2017;15(5):4780
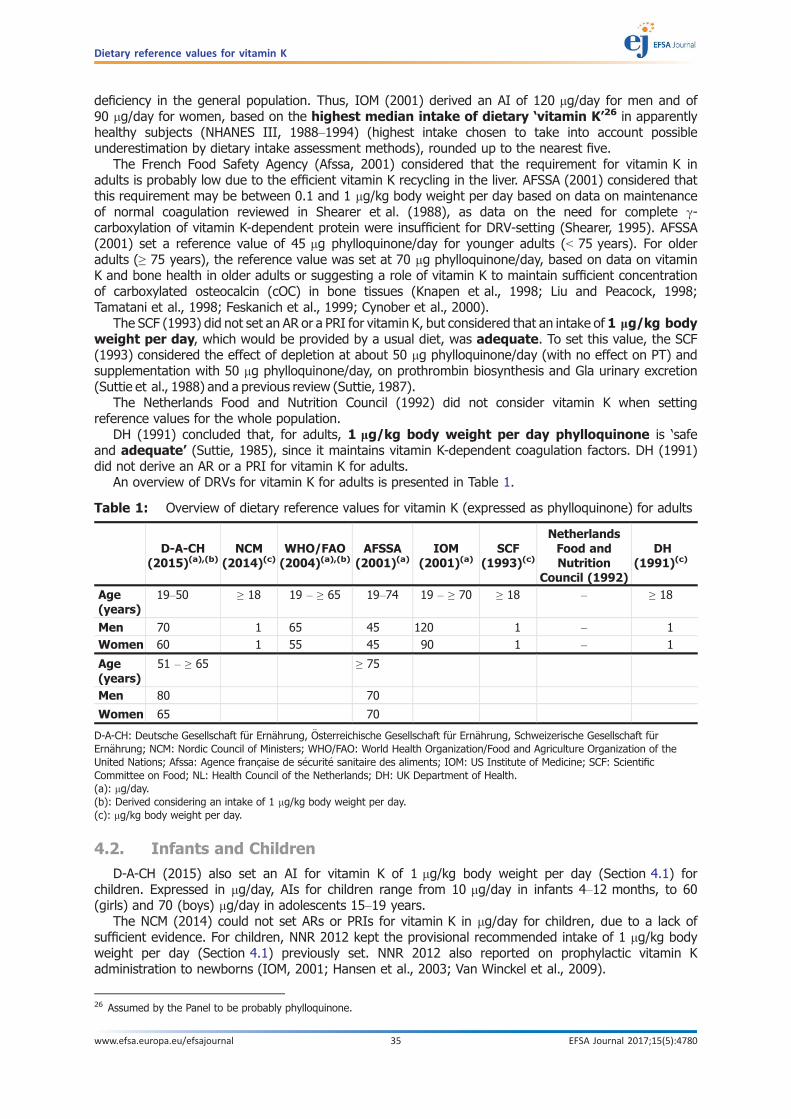
deficiency in the general population. Thus, IOM (2001) derived an AI of 120 lg/day for men and of90 lg/day for women, based on the highest median intake of dietary ‘vitamin K’26 in apparentlyhealthy subjects (NHANES III, 1988–1994) (highest intake chosen to take into account possibleunderestimation by dietary intake assessment methods), rounded up to the nearest five.
The French Food Safety Agency (Afssa, 2001) considered that the requirement for vitamin K inadults is probably low due to the efficient vitamin K recycling in the liver. AFSSA (2001) considered thatthis requirement may be between 0.1 and 1 lg/kg body weight per day based on data on maintenanceof normal coagulation reviewed in Shearer et al. (1988), as data on the need for complete c-carboxylation of vitamin K-dependent protein were insufficient for DRV-setting (Shearer, 1995). AFSSA(2001) set a reference value of 45 lg phylloquinone/day for younger adults (< 75 years). For olderadults (≥ 75 years), the reference value was set at 70 lg phylloquinone/day, based on data on vitaminK and bone health in older adults or suggesting a role of vitamin K to maintain sufficient concentrationof carboxylated osteocalcin (cOC) in bone tissues (Knapen et al., 1998; Liu and Peacock, 1998;Tamatani et al., 1998; Feskanich et al., 1999; Cynober et al., 2000).
The SCF (1993) did not set an AR or a PRI for vitamin K, but considered that an intake of 1 lg/kg bodyweight per day, which would be provided by a usual diet, was adequate. To set this value, the SCF(1993) considered the effect of depletion at about 50 lg phylloquinone/day (with no effect on PT) andsupplementation with 50 lg phylloquinone/day, on prothrombin biosynthesis and Gla urinary excretion(Suttie et al., 1988) and a previous review (Suttie, 1987).
The Netherlands Food and Nutrition Council (1992) did not consider vitamin K when settingreference values for the whole population.
DH (1991) concluded that, for adults, 1 lg/kg body weight per day phylloquinone is ‘safeand adequate’ (Suttie, 1985), since it maintains vitamin K-dependent coagulation factors. DH (1991)did not derive an AR or a PRI for vitamin K for adults.
An overview of DRVs for vitamin K for adults is presented in Table 1.
4.2. Infants and Children
D-A-CH (2015) also set an AI for vitamin K of 1 lg/kg body weight per day (Section 4.1) forchildren. Expressed in lg/day, AIs for children range from 10 lg/day in infants 4–12 months, to 60(girls) and 70 (boys) lg/day in adolescents 15–19 years.
The NCM (2014) could not set ARs or PRIs for vitamin K in lg/day for children, due to a lack ofsufficient evidence. For children, NNR 2012 kept the provisional recommended intake of 1 lg/kg bodyweight per day (Section 4.1) previously set. NNR 2012 also reported on prophylactic vitamin Kadministration to newborns (IOM, 2001; Hansen et al., 2003; Van Winckel et al., 2009).
Table 1: Overview of dietary reference values for vitamin K (expressed as phylloquinone) for adults
D-A-CH(2015)(a),(b)
NCM(2014)(c)
WHO/FAO(2004)(a),(b)
AFSSA(2001)(a)
IOM(2001)(a)
SCF(1993)(c)
NetherlandsFood andNutrition
Council (1992)
DH(1991)(c)
Age(years)
19–50 ≥ 18 19 – ≥ 65 19–74 19 – ≥ 70 ≥ 18 – ≥ 18
Men 70 1 65 45 120 1 – 1Women 60 1 55 45 90 1 – 1
Age(years)
51 – ≥ 65 ≥ 75
Men 80 70
Women 65 70
D-A-CH: Deutsche Gesellschaft f€ur Ern€ahrung, €Osterreichische Gesellschaft f€ur Ern€ahrung, Schweizerische Gesellschaft f€urErn€ahrung; NCM: Nordic Council of Ministers; WHO/FAO: World Health Organization/Food and Agriculture Organization of theUnited Nations; Afssa: Agence franc�aise de s�ecurit�e sanitaire des aliments; IOM: US Institute of Medicine; SCF: ScientificCommittee on Food; NL: Health Council of the Netherlands; DH: UK Department of Health.(a): lg/day.(b): Derived considering an intake of 1 lg/kg body weight per day.(c): lg/kg body weight per day.
26 Assumed by the Panel to be probably phylloquinone.
Dietary reference values for vitamin K
www.efsa.europa.eu/efsajournal 35 EFSA Journal 2017;15(5):4780
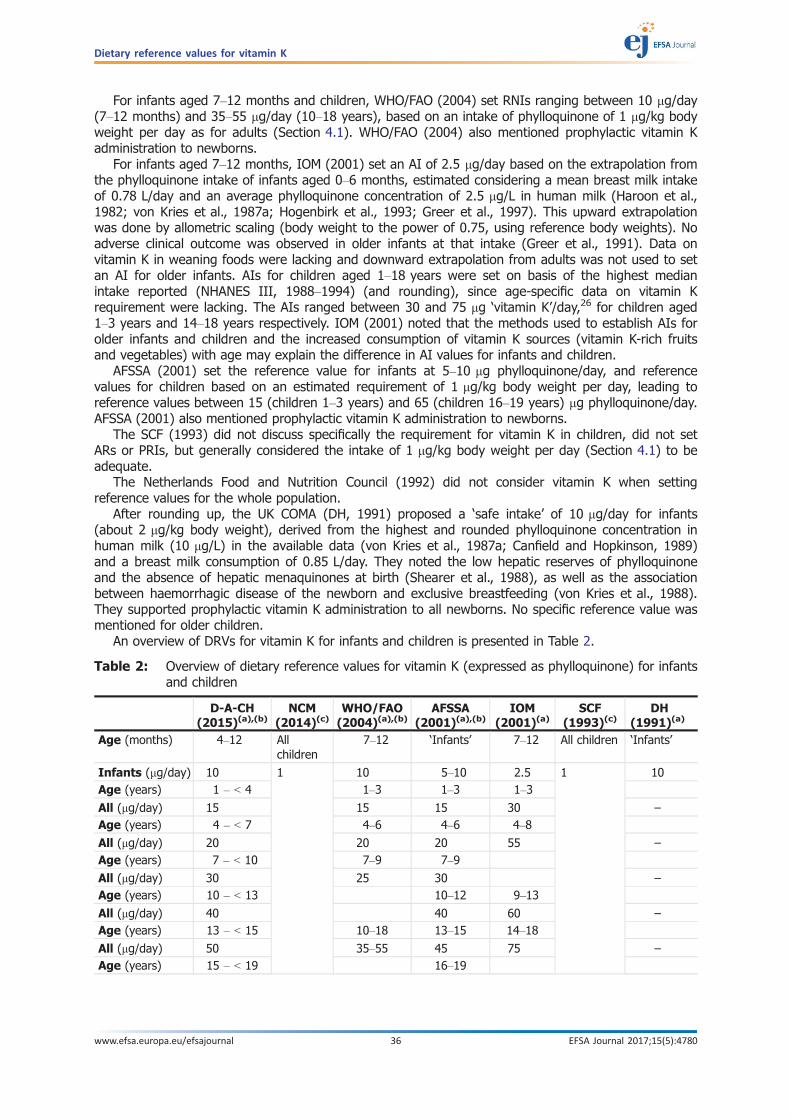
For infants aged 7–12 months and children, WHO/FAO (2004) set RNIs ranging between 10 lg/day(7–12 months) and 35–55 lg/day (10–18 years), based on an intake of phylloquinone of 1 lg/kg bodyweight per day as for adults (Section 4.1). WHO/FAO (2004) also mentioned prophylactic vitamin Kadministration to newborns.
For infants aged 7–12 months, IOM (2001) set an AI of 2.5 lg/day based on the extrapolation fromthe phylloquinone intake of infants aged 0–6 months, estimated considering a mean breast milk intakeof 0.78 L/day and an average phylloquinone concentration of 2.5 lg/L in human milk (Haroon et al.,1982; von Kries et al., 1987a; Hogenbirk et al., 1993; Greer et al., 1997). This upward extrapolationwas done by allometric scaling (body weight to the power of 0.75, using reference body weights). Noadverse clinical outcome was observed in older infants at that intake (Greer et al., 1991). Data onvitamin K in weaning foods were lacking and downward extrapolation from adults was not used to setan AI for older infants. AIs for children aged 1–18 years were set on basis of the highest medianintake reported (NHANES III, 1988–1994) (and rounding), since age-specific data on vitamin Krequirement were lacking. The AIs ranged between 30 and 75 lg ‘vitamin K’/day,26 for children aged1–3 years and 14–18 years respectively. IOM (2001) noted that the methods used to establish AIs forolder infants and children and the increased consumption of vitamin K sources (vitamin K-rich fruitsand vegetables) with age may explain the difference in AI values for infants and children.
AFSSA (2001) set the reference value for infants at 5–10 lg phylloquinone/day, and referencevalues for children based on an estimated requirement of 1 lg/kg body weight per day, leading toreference values between 15 (children 1–3 years) and 65 (children 16–19 years) lg phylloquinone/day.AFSSA (2001) also mentioned prophylactic vitamin K administration to newborns.
The SCF (1993) did not discuss specifically the requirement for vitamin K in children, did not setARs or PRIs, but generally considered the intake of 1 lg/kg body weight per day (Section 4.1) to beadequate.
The Netherlands Food and Nutrition Council (1992) did not consider vitamin K when settingreference values for the whole population.
After rounding up, the UK COMA (DH, 1991) proposed a ‘safe intake’ of 10 lg/day for infants(about 2 lg/kg body weight), derived from the highest and rounded phylloquinone concentration inhuman milk (10 lg/L) in the available data (von Kries et al., 1987a; Canfield and Hopkinson, 1989)and a breast milk consumption of 0.85 L/day. They noted the low hepatic reserves of phylloquinoneand the absence of hepatic menaquinones at birth (Shearer et al., 1988), as well as the associationbetween haemorrhagic disease of the newborn and exclusive breastfeeding (von Kries et al., 1988).They supported prophylactic vitamin K administration to all newborns. No specific reference value wasmentioned for older children.
An overview of DRVs for vitamin K for infants and children is presented in Table 2.
Table 2: Overview of dietary reference values for vitamin K (expressed as phylloquinone) for infantsand children
D-A-CH(2015)(a),(b)
NCM(2014)(c)
WHO/FAO(2004)(a),(b)
AFSSA(2001)(a),(b)
IOM(2001)(a)
SCF(1993)(c)
DH(1991)(a)
Age (months) 4–12 Allchildren
7–12 ‘Infants’ 7–12 All children ‘Infants’
Infants (lg/day) 10 1 10 5–10 2.5 1 10Age (years) 1 – < 4 1–3 1–3 1–3
All (lg/day) 15 15 15 30 –Age (years) 4 – < 7 4–6 4–6 4–8
All (lg/day) 20 20 20 55 –Age (years) 7 – < 10 7–9 7–9
All (lg/day) 30 25 30 –Age (years) 10 – < 13 10–12 9–13
All (lg/day) 40 40 60 –Age (years) 13 – < 15 10–18 13–15 14–18
All (lg/day) 50 35–55 45 75 –Age (years) 15 – < 19 16–19
Dietary reference values for vitamin K
www.efsa.europa.eu/efsajournal 36 EFSA Journal 2017;15(5):4780

4.3. Pregnancy and lactation
D-A-CH (2015) set the same AI for vitamin K for healthy pregnant or lactating women as for otherwomen, as it is unknown whether pregnant women need additional vitamin K and as the possibly smalladditional need in lactation is fully covered by a healthy and balanced diet. WHO/FAO (2004) andAFSSA (2001) also proposed for pregnant or lactating women the same reference value as for otherwomen (Section 4.1).
The NCM (2014), SCF (1993) and DH (1991) mentioned no specific information or reference valuesfor vitamin K for pregnant or lactating women. The Netherlands Food and Nutrition Council (1992) didnot consider vitamin K when setting reference values for the whole population.
IOM (2001) noted that studies on pregnant women reported no signs of vitamin K deficiency andcomparable blood vitamin K concentrations to those of non-pregnant women (Mandelbrot et al., 1988;von Kries et al., 1992). There was no data on vitamin K content of fetal tissue, and studies onvitamin K supplementation in pregnant women (Morales et al., 1988; Kazzi et al., 1990; Anai et al.,1993; Dickson et al., 1994) could not be used for establishing additional requirements duringpregnancy. Median intakes in pregnant or non-pregnant women ((NHANES III, 1988–1994), Total DietStudy (TDS) 1991–1997) and Booth et al. (1999a)) were noted. IOM (2001) set the same AI forpregnant adolescent or women as for other adolescent girls or women, based on median intakes26 innon-pregnant female subjects. Data suggested comparable phylloquinone intake in lactating or non-lactating women and no significant correlation between phylloquinone intake from a usual diet andbreast milk concentration (NHANES III, 1988–1994; Greer et al., 1991). As vitamin K concentration inhuman milk is low, the AI was the same as for non-pregnant women.
An overview of DRVs for vitamin K for pregnant or lactating women is presented in Table 3.
D-A-CH(2015)(a),(b)
NCM(2014)(c)
WHO/FAO(2004)(a),(b)
AFSSA(2001)(a),(b)
IOM(2001)(a)
SCF(1993)(c)
DH(1991)(a)
Boys (lg/day) 70 65 –
Girls (lg/day) 60
D-A-CH: Deutsche Gesellschaft f€ur Ern€ahrung, €Osterreichische Gesellschaft f€ur Ern€ahrung, Schweizerische Gesellschaft f€urErn€ahrung; NCM: Nordic Council of Ministers; WHO/FAO: World Health Organization/Food and Agriculture Organization of theUnited Nations; Afssa: Agence franc�aise de s�ecurit�e sanitaire des aliments; IOM: US Institute of Medicine; SCF: ScientificCommittee on Food; DH: UK Department of Health.(a): lg/day.(b): Derived considering an intake of 1 lg/kg body weight per day.(c): lg/kg body weight per day.
Table 3: Overview of dietary reference values for vitamin K (expressed as phylloquinone) forpregnant and lactating women
D-A-CH(2015)(a)
NCM(2014)
WHO/FAO(2004)(a)
AFSSA(2001)(a)
IOM(2001)(a)
SCF(1993)
DH(1991)
Pregnant women(lg/day)
75(b)
60 – 55 45 90(c) – –
Lactating women(lg/day)
75(b)
60 – 55 45 90(c) – –
D-A-CH: Deutsche Gesellschaft f€ur Ern€ahrung, €Osterreichische Gesellschaft f€ur Ern€ahrung, Schweizerische Gesellschaft f€urErn€ahrung; NCM: Nordic Council of Ministers; WHO/FAO: World Health Organization/Food and Agriculture Organization of theUnited Nations; Afssa: Agence franc�aise de s�ecurit�e sanitaire des aliments; IOM: US Institute of Medicine; SCF: ScientificCommittee on Food; DH: UK Department of Health.(a): Derived considering an intake of 1 lg/kg body weight per day.(b): Girls aged 14–18 years.(c): Adults.
Dietary reference values for vitamin K
www.efsa.europa.eu/efsajournal 37 EFSA Journal 2017;15(5):4780

5. Criteria (endpoints) on which to base Dietary Reference Values
5.1. Indicators of vitamin K requirement
5.1.1. Adults
5.1.1.1. Use of biomarkers
As discussed in Sections 2.2.2.1 and 2.4, vitamin K deficiency leads to an increased PT andeventually associated adverse clinical symptoms. However, PT and the PTT are not sensitive markers ofvitamin K intake and status and non-specific indicators of vitamin K deficiency, and symptomaticvitamin K deficiency and impairment of normal haemostatic control in healthy adults may take morethan 2–3 weeks to develop at ‘low’ phylloquinone intake (i.e. < 10 lg/day) (Sections 2.2.2.1 and 2.4).
For the other biomarkers investigated (Section 2.4), even if they may change with changes invitamin K (phylloquinone or menaquinone) dietary intake, no dose–response relationship has beenestablished with intake of phylloquinone or of individual menaquinones within the dietary range inEurope. The available metabolic studies generally assessed whether the biomarkers returned tobaseline values with phylloquinone supplementation/dietary repletion after phylloquinone depletion.However, for these biomarkers, no cut-off value to define adequate vitamin K status is available, sothese changes in biomarkers are difficult to interpret. The Panel considers that none of thesebiomarkers is suitable by itself to assess vitamin K adequacy (Section 2.4).
The SCF (1993) considered that an intake of phylloquinone of 1 lg/kg body weight per day wasadequate, mainly based on the depletion/repletion study in young men (mean � SD: 72 � 9 kg bodyweight) by Suttie et al. (1988), which showed that supplementation with 50 lg phylloquinone/day inaddition to a restricted diet (median of about 32–40 lg phylloquinone/day) restored the S:E ratio(a measure of functionally active prothrombin) and urinary Gla concentration to their baseline values(Section 2.4). The Panel notes that phylloquinone intake from the diet was analytically measured induplicate portions of all foods and beverages consumed (and not estimated using a food compositiondatabase). The Panel also notes that this study was previously used to support a reference value of1 lg/kg per body weight, based on a mean body weight of subjects that is slightly higher than thereference body weight for adult men for this Opinion (68.1 kg, Section 6). The Panel however considersthat the physiological relevance of the changes in biomarkers observed in this study is unclear.
The Panel notes that the SCF (1993) set a reference value of 1 lg/kg per day based on data onbiomarkers from Suttie et al. (1988). The Panel considers that none of the new data on thebiomarkers reviewed (Section 2.4) are suitable as such to derive DRVs for vitamin K.
5.1.1.2. Factorial approach
The maintenance of an adequate body pool of phylloquinone can be considered as a criterion forestablishing the requirement for vitamin K, assuming that it is associated with fulfilling the function ofvitamin K as cofactor of GGCX in the different target tissues (Section 2.2.1).
As explained in Section 2.3.4, there is no data on the total body pool of menaquinones and thePanel considers the most accurate values for the total body pool of phylloquinone, obtained from acompartmental analysis of phylloquinone kinetics in adults (46 and 41 lg for men and women)(Novotny et al., 2010), and that can be expressed as 0.53 and 0.55 lg/kg body weight, respectively.The Panel also notes that the study of Olson et al. (2002), when taking into account the value forplasma phylloquinone considered as most accurate by the authors, identifies a body pool ofphylloquinone of 0.57 lg/kg body weight, which is a value close to the values obtained from the studyby Novotny et al. (2010). The Panel thus considers a body pool of phylloquinone of about 0.55 lg/kgbody weight in healthy adults at steady state not to be associated with signs of vitamin K deficiency(Section 2.3.4). The Panel considers this value as a desirable body pool size for phylloquinone.
Turnover of phylloquinone can be determined from kinetic studies. Based on the 6-day kinetic studyby Olson et al. (2002) on seven adults (six men and one woman) consuming 75 lg/day and receiving0.3 lg isotope-labelled phylloquinone administered intravenously, the authors found that a mean ofabout 62% of injected phylloquinone is catabolised and excreted as radioactive metabolites in urine(mean of 30%) and faeces through the bile (mean of 31.8%) (Section 2.3.6).
In view of the fast turnover of phylloquinone in the body (Section 2.3.5), the Panel applied thesepercentages to the desirable body pool size of phylloquinone calculated above. Thus, assuming a totalbody pool of phylloquinone of 0.55 lg/kg body weight in adults, the Panel estimates that 0.340 lg
Dietary reference values for vitamin K
www.efsa.europa.eu/efsajournal 38 EFSA Journal 2017;15(5):4780

phylloquinone/kg body weight would be excreted in the form of phylloquinone metabolites in urine(30% of 0.55 lg/kg body weight, i.e. 0.165 lg/kg) and in bile (31.8% of 0.55 lg/kg body weight, i.e.0.175 lg/kg body weight). The Panel assumes that 0.340 lg phylloquinone/kg body weight could beconsidered as the daily losses via faeces and urine. The Panel notes that the daily losses ofmenaquinones cannot be estimated.
The Panel considered to estimate the daily dietary intake of phylloquinone required to balance totalphylloquinone losses through urine and faeces (bile) and to maintain an adequate body pool ofphylloquinone (factorial approach). This approach to derive DRVs for vitamin K would require taking intoaccount phylloquinone absorption. However, as explained in Section 2.3.1, the Panel considers that dataon phylloquinone absorption in healthy adults, measured from different food sources and matrices,consumed with or without fat, are widely variable. The Panel also considers that it is not possible fromthe available data in healthy adults to estimate precisely an average absorption of phylloquinone,menaquinones, and thus vitamin K from the diet that would be valid for all dietary conditions.
The Panel noted in Section 2.3.1 the limitations of the available studies and that the observedmean phylloquinone absorption ranged between about 3–80%. In particular, taking into account thereported absolute value of absorption of phylloquinone from kale and assuming, as reference,maximum reported absorption of 80% for free phylloquinone (as a supplement consumed with fat) toconvert the relative absorption observed for other plant foods into absolute values, the range of meanabsorption from spinach, kale, broccoli or romaine lettuce (fresh or cooked, with or without fat) wouldbe equivalent to about 3–50%.
On the assumption that absorption of phylloquinone from the European diet would be about 35%and that the assumed metabolic losses of phylloquinone mentioned above would be 0.340 lgphylloquinone/kg body weight, an intake of phylloquinone of 1 lg/kg body weight per day wouldbalance the losses.
Although this value agrees with the AI set by the SCF, in view of the limitations associated withderiving the figures for absorption and losses, the Panel considers that the factorial approach cannotbe used as such to set DRVs.
5.1.1.3. Intake data
The Panel considers that average/median intakes of vitamin K could be used to estimate an AI.Available data for vitamin K intake mean estimates in adults vary considerably among EU countries(between 72 and 196 lg/day) and suffer from limitations and uncertainties of food composition datawith regard to both phylloquinone and menaquinones (Section 3.2.1). Although two national surveysapplied partially updated food composition data, the impact of the remaining uncertainty in thecomposition data on the results median intake estimates for adults for vitamin K (phylloquinone andmenaquinones) of 100–117 lg/day (Dutch National Survey) and for phylloquinone of 76 lg/day forsubjects aged 15–80 years (German National Nutrition Survey II) (Section 3.2.2) is still not entirely clear.
5.1.1.4. Conclusions on indicators of vitamin K requirement for adults
The Panel concludes that available data on biomarkers do not allow to estimate an averagerequirement (AR) for either phylloquinone or vitamin K.
The Panel also concludes that, due to the limitations of the data on absorption and excretion ofphylloquinone and menaquinone, it is not possible to use the factorial approach to derive DRVs forvitamin K.
Due to the uncertainty associated with available data on average daily level of intake in Europe, thePanel concludes that an AI established from these data cannot be sufficiently reliable.
5.1.2. Infants and children
The Panel considers that there are no studies in infants aged 7–11 months and children that can beused for deriving the requirement for vitamin K in infants and children.
5.1.3. Pregnant or lactating women
During pregnancy, only small quantities of phylloquinone cross the placenta from mother to fetus,and there is no correlation between maternal and cord blood concentrations (Section 2.3.3). Littleinformation is available in relation to placental transfer of menaquinones (Section 2.3.3). Studies onphylloquinone supplementation in pregnant women cannot be used to set DRVs (Morales et al., 1988;Kazzi et al., 1990; Dickson et al., 1994) (Section 4.3). Human milk contains ‘low’ concentrations of
Dietary reference values for vitamin K
www.efsa.europa.eu/efsajournal 39 EFSA Journal 2017;15(5):4780
vitamin K (mostly phylloquinone) but the concentration of phylloquinone in human milk is affected bymaternal oral supplementation of phylloquinone (Section 2.3.6.3).
The Panel considers that there are no studies that can be used for deriving the requirement forvitamin K in pregnant or lactating women and that would suggest that the requirement for vitamin Kin pregnant or lactating women is different from non-pregnant non-lactating adults.
5.2. Vitamin K intake and health consequences
The relationship between intake of vitamin K (phylloquinone and/or menaquinones) and chronicdisease outcomes has been investigated in RCTs, and also in observational studies where associationsbetween intake and disease outcomes may be confounded by uncertainties inherent to themethodology used for the assessment of vitamin K intake and by the effect of dietary, lifestyle or otherundefined factors on the disease outcomes investigated. RCTs, as well as prospective cohort studies inpopulations free of the investigated health outcome/disease(s) at baseline, are discussed in thisSection. Taking into account the uncertainty about the relationship between vitamin K intake andbiomarkers (Section 2.4), the Panel only considered studies that include either one or longitudinalassessment of vitamin K intake, whereas studies on the relationship of levels of vitamin K biomarkersand health outcomes with no quantitative data on vitamin K intake are not considered.
A comprehensive search of the literature published between 1990 and 2011 was performed aspreparatory work to this assessment in order to identify data on relevant health outcomes upon whichDRVs for vitamin K may potentially be based (Heinonen et al., 2012). This provided individual studiesthat are described below. An additional literature search (in PubMed) was performed to identify morerecent data published until 2016 on vitamin K intake and health outcomes.
Since the reports by SCF (1993), more data have become available on the relationship betweenphylloquinone or menaquinone intake and diabetes mellitus (one observational study (Beulens et al.,2010)), metabolic syndrome (one observational study (Dam et al., 2015)), cancer (Nimptsch et al.,2008, 2010)), all-cause-mortality, cardiovascular-related outcomes or bone health. The Panel considersthat evidence from only one observational study on a particular outcome is not sufficient to providestrong evidence of a relationship and thus cannot be used for setting DRVs for vitamin K. ThePanel thus considers that available data on phylloquinone or menaquinones intake and the risk ofdiabetes mellitus, metabolic syndrome, various types of cancer cannot be used to derive DRVs forvitamin K. The Panel also noted three studies that investigated the relationship between intake ofphylloquinone, menaquinones or both and the risk of all-cause mortality (Geleijnse et al., 2004;Juanola-Falgarona et al., 2014; Zwakenberg et al., 2016) with inconsistent results and therefore arenot considered to derive DRVs for vitamin K. In this Section, the Panel does not report on studies(Cockayne et al., 2006; Knapen et al., 2007, 2013, 2015; Emaus et al., 2010; Ronn et al., 2016) usingdoses of phylloquinone, MK-4 or MK-7 much higher (1–10 mg/day phylloquinone, 45 mg/day MK-4,15–45 lg/day MK–4, 180–375 lg/day MK-7) than the observed dietary intakes of phylloquinone, MK-4or MK-7 in Europe (Section 3.2).
5.2.1. Cardiovascular-related outcomes
The seven prospective cohort studies below assessed the association between several cardiovascular-related outcomes and vitamin K intake from food only or from food and supplements as assessed by anFFQ administered mostly solely at baseline, or also repeatedly during follow-up. These studies wereundertaken in men and women or in one sex only, mostly included large populations (about 4,800–73,000 subjects) and with a mean follow-up ranging between 7.2 and 16 years, except for one smallerstudy (Villines et al., 2005) that investigated 807 active-duty army members with a shorter follow-up(less than 1.5 year). Results after adjustments for potential confounders are described below.
In one study, the risk of coronary heart disease (CHD) events (total CHD, non-fatal myocardialinfarction (MI), or fatal CHD) was not significantly associated with quintiles of phylloquinone intake,even when comparing quintile Q5 ≥ 249 lg/day to Q1 ≤ 107 lg/day (Erkkila et al., 2007). In anotherstudy, the risks of total CHD and of non-fatal MI were significantly lower only in quintiles Q2 and Q4 ofphylloquinone intake compared to Q1 (Q2: 110–144 lg/day, e.g. for total CHD, RR: 0.83 (95% CI:0.71–0.97); Q4: 183–241 lg/day, e.g. for total CHD, RR 0.82 (95% CI: 0.69–0.96), but p for trendwas not statistically significant (Erkkila et al., 2005). In the same study, the risk of fatal CHD was notassociated with quintiles of phylloquinone intake. In a third study, the risk of coronary events (incidentCHD, non-fatal MI, CHD mortality) was not associated with energy-adjusted tertiles of phylloquinoneintake even when comparing the highest tertile > 278 lg/day to the lowest < 200 lg/day (Geleijnse
Dietary reference values for vitamin K
www.efsa.europa.eu/efsajournal 40 EFSA Journal 2017;15(5):4780

et al., 2004). In a fourth study, the risk of CHD was not significantly associated with phylloquinoneintake (per 10 lg/day increment in intake) (Gast et al., 2009).
In a study mentioned above (Geleijnse et al., 2004), only in the upper tertile of energy-adjustedintake of menaquinone (MK-4 to MK-10) (> 32.7 lg/day) compared to the lower one (< 21.6 lg/day),there was a significantly reduced risk of incident CHD (RR 0.59, 95% CI: 0.40–0.86) and CHD mortality(RR 0.43, 95% CI: 0.24–0.77), p trend 0.007 and 0.005, respectively, but no significant association wasobserved for non-fatal MI. In another study mentioned above (Gast et al., 2009), the risk of CHD was notsignificantly associated with menaquinone intake (MK-4 to MK-9) (per 10 lg/day increment in intake).
Thus, there was no significant (linear or non-linear) association with phylloquinone intake and therisk of CHD events (four studies); while either a significant non-linear or no significant linearassociation was reported between menaquinone intake and the risk of CHD events (two studies).
In one study mentioned above (Erkkila et al., 2007), the risk of strokes (total or ischaemic) was notsignificantly associated with quintiles of phylloquinone intake, even when comparing Q5 ≥ 249 lg/dayto Q1 ≤ 107 lg/day. In another study (Vissers et al., 2013), there was no association between riskof stroke and energy-adjusted phylloquinone or menaquinone intake (MK-4 to MK-10), either per50 lg/day increment in intake or comparing the highest to the lowest quartiles (mean phylloquinoneintake: 96.6 lg/day (q1), 332.7 lg/day (q4); mean MK-n intake: 15.6 lg/day (q1), 49.3 lg/day (q4).These results did not change when analysing separately haemorrhagic and ischemic stroke, or separatelytotal vitamin K or MK-4 through MK-6 and MK-7 through MK-10.
Thus, intakes of phylloquinone (two studies) or menaquinones (one study) were not significantlyassociated (linearly or non-linearly) with the risk of stroke.
The risk of peripheral arterial disease (PAD) (e.g. atherosclerosis, arterial embolism and thrombosis,aortic aneurysm) was not significantly associated with energy-adjusted phylloquinone intake, eitherper 50 lg increment in intake or comparing the highest to the lowest quartiles (mean: 97 lg/day in q1,333 lg/day in q4) (Vissers et al., 2016). In this study, there was a significant (linear) inverse associationbetween the risk of PAD and intake of menaquinones (per 10 lg increment in intake of MK-4 to 10)(hazard ratio (HR), 0.92, 95% CI: 0.85–0.99, p = 0.03). The risk of PAD was also significantly reducedwhen comparing the highest to the lowest quartiles of energy-adjusted intake of menaquinones, (HR0.71, 95% CI: 0.53–0.95 (mean: 15.5 lg/day in q1, 49.2 lg/day in q4), but p for trend (0.06) was notsignificant. Such relationships were not observed among participants without hypertension.
Thus, there was no significant (linear or non-linear) association between intake of phylloquinone ormenaquinones and the risk of PAD in subjects without hypertension (one study).
In one study, there was no significant association between the presence of coronary arterycalcification (CAC) (assessed by computed tomography) and phylloquinone intake (either per lg/dayincrement in intake or comparing quartile q4 > 143.5 lg/day phylloquinone to q1 < 69.5 lg/dayphylloquinone) (Villines et al., 2005). In this study, there was no significant linear association ofphylloquinone intake with severity of CAC in a bivariate analysis. In another study mentioned above,there was no significant association between energy-adjusted tertiles of phylloquinone intake andmoderate or severe aortic calcification (assessed by a lateral radiography) (Geleijnse et al., 2004).
In the same study, there was no association between energy-adjusted tertiles of intake ofmenaquinones (MK-4 to MK-10) and moderate aortic calcification, but an association was observedfor severe calcification when comparing the highest to the lowest tertiles of intake (OR: 0.48, 95% CI:0.32–0.71, p trend < 0.001) (Geleijnse et al., 2004).
Thus, there was no significant (linear or non-linear) association between phylloquinone intake andaortic/coronary calcification (two studies), while a significant (non-linear) association wasobserved between menaquinone intake and severe (but not moderate) calcification (one study).
The Panel considers that the available data from these prospective cohort studies onassociations between the intake of phylloquinone or menaquinones and the risk of cardiovascular-related outcomes cannot be used to derive DRVs for vitamin K.
5.2.2. Bone health
Results of two available RCTs and of eight prospective observational studies after adjustments forpotential confounders, are described below. These observational studies generally assessed vitamin K(from food only or from food and supplements) through a FFQ at baseline, whereas a few amongthem assessed intake at different time points or used other methods (three, four or seven-day foodrecords). They were all in adults except one in children (Kalkwarf et al., 2004), with follow-up between2 and 10 years and population size between 200 and about 72,000 subjects.
Dietary reference values for vitamin K
www.efsa.europa.eu/efsajournal 41 EFSA Journal 2017;15(5):4780

A 12-months RCT on 173 healthy women (mean age 62 years) investigated the effect on BMD ofthe intake of phylloquinone or MK-7,27 calcium and vitamin D through fortified milk or yogurt(Kanellakis et al., 2012). The subjects received either 800 mg/day of calcium and 10 lg/day ofvitamin D3 (n = 38), or the same amounts of these nutrients with 100 lg/day of phylloquinone(n = 38) or MK-7 (n = 39), or continued with their usual diet during the study (control group, n = 39).BMD of total body and lumbar spine (LS) were measured at baseline and follow-up with dual-emissionX-ray absorptiometry (DXA), the BMD of other regional skeletal sites was extracted from the total bodyscans and data analysis was done on the subjects with compliance of at least 75% (n = 115). Baselinemean phylloquinone intake, assessed by three 24-h recalls, was between 80.2 and 121.2 lg/dayamong groups (not statistically different). After adjustments for 25(OH)D concentrations, dietarycalcium intake and physical activity, changes (increases) in total-body BMD in the interventiongroups were not significantly different from that (decrease) in the control group. However, there wasan increase in BMD of the LS in the vitamin K-supplemented groups, which was still significantlydifferent, after adjustments, from the change (decrease) observed in control group (p = 0.002).
In a 2-year double-blind RCT of the effect of phylloquinone on BMD, 244 healthy women aged≥ 60 years (Bolton-Smith et al., 2007) were allocated to: (1) placebo, (2) 200 lg/day phylloquinone,(3) 1,000 mg calcium plus 10 lg/day vitamin D3, or (4) combined supplementation with the threenutrients at the levels in groups 2 and 3. Baseline mean phylloquinone intake (from food andsupplements) assessed by FFQ was about 82–87 lg/day among the 209 completers. Bone mineralcontent (BMC) and BMD were measured by DXA of the femur and radius every 6 months. Afteradjustments for potential confounders, there was no significant difference of the two-year changesin BMD or BMC between groups at any site.
Thus, two available RCTs with phylloquinone intake at levels comparable to the observed dietaryintakes in Europe do not provide consistent results on the effect of phylloquinone intake on BMD and/or BMC in post-menopausal women (Bolton-Smith et al., 2007; Kanellakis et al., 2012).
In one observational study, in either men or women aged 65 years and older, there was nosignificant association between risk of hip fracture (assessed from hospital records) and energy-adjusted log-transformed phylloquinone intake (per SD increment in intake) (Chan et al., 2012). In asecond study (Booth et al., 2000a), the risk of hip fracture (assessed from hospital records including X-rays) was also not significantly associated with phylloquinone intake, even when comparing the highestto the lowest quartiles (median intake according to sexes: 60–64 lg/day in q1 and 234–268 lg/day inq4). In the largest observational study (Feskanich et al., 1999) undertaken among women (nurses), onlywomen in quintile Q3 of baseline phylloquinone intake (146–183 lg/day) had a significantly lower RR ofhip fractures (self-reported), i.e. 0.67 (95% CI: 0.46–0.99), compared to those in Q1 (< 109 lg/day),and p for trend (= 0.32) was not significant. In this study, the RR of hip fracture was significantly lower inQ2–Q5 combined of baseline phylloquinone intake (109 to > 242 lg/day) compared to Q1, with a RR(95% CI) of 0.70 (0.53, 0.93), but this result did not remain statistically significant when using updateddietary data during follow-up (secondary analyses). In a fourth study (Apalset et al., 2011), the risk ofhip fracture (assessed from hospital records) was significantly higher in the lowest quartile ofphylloquinone intake when compared to the highest quartile (q1 < 42.2 (women) or 52.9 (men) lg/day;q4 > 108.7 (women) or 113.9 (men) lg/day; HR 1.63, 95% CI: 1.06–2.49, p for trend: 0.015), butfindings were not significant for the intermediate quartiles. In this study, the HR of hip fractures was 0.98(95% CI: 0.95–1.00, p = 0.030) per 10 lg/day increment in phylloquinone intake.
In the same study (Apalset et al., 2011), the risk of hip fractures was not significantly associatedwith intake of menaquinones (forms not specified), either per 1 lg increment in intake or comparingthe lowest to the highest quartiles (q1 < 7.2 (women) or 8.5 (men) lg/day, q4 > 14.5 (women) or16.2 (men) lg/day).
Thus, the results on the association between phylloquinone intake and the risk of hip fractures,are inconsistent (four studies), while there was no significant (linear or non-linear) association withmenaquinone intake (one study).
In either men or women aged 65 years and older from a study mentioned above, there was nosignificant association between risk of non-vertebral fracture and energy-adjusted log-transformedphylloquinone intake (per SD increment in intake) (Chan et al., 2012). In perimenopausal women(nested case–control study), receiving or not hormonal replacement therapy and some having already
27 In view of the high dose investigated (100 µg/day MK-7) much higher than observed intakes of MK-7 in Europe (Section 3.2),the results for MK-7 are not discussed.
Dietary reference values for vitamin K
www.efsa.europa.eu/efsajournal 42 EFSA Journal 2017;15(5):4780

sustained a fracture at baseline, there was no significant association between the risk of vertebralfracture (assessed from hospital records and X-rays) and phylloquinone intake, even whencomparing the highest to the lowest quartiles (> 105 vs < 25 lg/day) or the 95th to the 5thpercentiles (> 210 vs < 25 lg/day) (Rejnmark et al., 2006).
Thus, there was no association between phylloquinone intake, and the risk of eithernon-vertebral (one study) or vertebral fractures (one study).
In a study mentioned above (Rejnmark et al., 2006), changes in BMD of the LS or femoral neck(FN) (measured by DXA) were not significantly associated with phylloquinone intake expressedeither continuously or categorically (in quartiles). In another study mentioned above (Booth et al.,2000a), there was also no significant difference in changes in BMD at any site (hip, FN, trochanter, Ward’sarea, LS and arm, measured by different methods28) across quartiles of phylloquinone intake, for eithermen or women (median intake according to sexes of 60–64 lg/day in q1 and 234–268 lg/day in q4). Ina third study (Macdonald et al., 2008), in which phylloquinone intake data was available for 898women at baseline and final visits and 2,340 only at final visit only, there was again no significantdifference in the yearly change in BMD at the FN or LS between quartiles of energy-adjustedphylloquinone at visit 2 (mean intake: 64 (q1) and 181 lg/day (q4)). In this study, energy-adjustedintake of phylloquinone assessed as a continuous variable was not a significant predictor of BMD at LSor FN. In a fourth study (Bullo et al., 2011), 362 participants of the larger PREDIMED trial wereenrolled in a parallel study on bone metabolism. At baseline, participants provided a FFQ. After 2 yearsof follow-up, 200 participants provided a second dietary assessment and quantitative ultrasound bone-related assessments. The study investigated the relationship between change in phylloquinone intake(between beginning and end of follow-up) and change in BMD or bone structure quality (speed ofsound (SOS)), broadband ultrasound attenuation (BUA) and quantitative ultrasound index (QUI)assessed by quantitative ultrasound at the calcaneus. The mean (� SE) phylloquinone intake atbaseline was 333.6 � 17.3 lg/day in men (n = 162) and 299.8 � 11.6 lg/day in women (n = 200).After two years follow-up, those who increased their phylloquinone intake (mean change � SD:+104.1 � 10.9 lg/day, n = 74) had a statistically significant lower loss of BMD (mean change � SD:–0.009 � 0.006 g/cm2) compared to those who decreased their phylloquinone intake (meanchange � SD: �155.8 � 17.57 lg/day, n = 126) during the follow-up (mean change in BMD � SD:–0.023 � 0.004 g/cm2), p = 0.049. There was no significantly different change in BUA, SOS and QUI.No information was provided on why subjects changed their phylloquinone intake during follow-up.
Thus, the results on the association between phylloquinone intake and changes in BMD areinconsistent (four studies). For most of the sites investigated, however, the (linear or non-linear)associations were not significant.
In 245 healthy girls aged 3–16 years at baseline (median 9.8 years) (Kalkwarf et al., 2004)(Section 2.4), BMC (total body, total body minus head, LS, hip, assessed by DXA) was not significantlyassociated with phylloquinone intake, except for the hip (1.0% decrease when increasing from the10th percentile of phylloquinone intake i.e. 21 lg/day to the 90th percentile i.e. 89 lg/day, p < 0.01).
Thus, there was no significant association between phylloquinone intake and BMC for most of thesites investigated (one study in children). Menaquinone intake was not investigated.
The Panel considers that the available data on intake of phylloquinone or menaquinones andbone-related health outcomes cannot be used to derive DRVs for vitamin K.
5.2.3. Conclusions on vitamin K intake and health consequences
The Panel considers that the available data on intake of phylloquinone or menaquinones and healthoutcomes cannot be used to derive DRVs for vitamin K.
6. Data on which to base Dietary Reference Values
The Panel reviewed the recent information on vitamin K (phylloquinone and menaquinones) with theaim of updating the DRV of 1 lg/kg body weight per day of phylloquinone that was previously set by SCF(1993) (Section 4) based on data on biomarkers and phylloquinone intake (Suttie et al., 1988). ThePanel came to the conclusion that the uncertainties pointed out by SCF (1993) have not been resolved.
The Panel considers that all possible approaches investigated to set DRVs (biomarker, factorialapproach, intake data) have considerable uncertainties (Sections 5.1.1.1–5.1.1.4). The Panel considersthat there is no scientific evidence to update the previous reference value. The Panel notes that there
28 Dual-photon absorptiometry, single-photon absorptiometry and DXA.
Dietary reference values for vitamin K
www.efsa.europa.eu/efsajournal 43 EFSA Journal 2017;15(5):4780

is no indication that 1 lg/kg body weight per day phylloquinone would be associated with a risk ofdeficiency in the general population and is above the intake at which an increase in PT has beenobserved in healthy subjects (Sections 2.2.2.1 and 2.4).
In view of the uncertainties and limited data, the Panel considers that an AR and PRI cannot be setfor vitamin K, but instead set an adequate intake (AI), at 1 lg/kg body weight per day phylloquinone.
The Panel tried to take menaquinones into account in setting DRVs for vitamin K, as this vitamin isdefined as phylloquinone and menaquinones (Section 2.1). The Panel however came to the conclusionthat the knowledge on MK-n, i.e. their intake (Section 3.2), absorption (Section 2.3.1), function(Sections 2.2.1 and 2.4) and content in the body or organs (Section 2.3.4), is limited and contradictory.It is not established that when the requirement for phylloquinone is met, there is still a requirement formenaquinones. It has not been proven that menaquinones have effects that are unrelated tophylloquinone intake. From the available data, it is not possible to conclude on specific activities/effectsof menaquinones compared to phylloquinone. Phylloquinone and menaquinones act as a cofactor ofGGCX for carboxylation of the same proteins (Section 2.2.1 and 2.4). Thus, the Panel considers that, atpresent, there are not enough data to take menaquinones into account to set DRVs for vitamin K. Thereis also no data that would justify to set a separate AI for total or individual MK-n.
The Panel also considers that the available data on intake of phylloquinone or menaquinones andhealth outcomes cannot be used to derive DRVs for vitamin K (Section 5.2).
6.1. Adults
The reference body weights of 18- to 79-year-old men and women were calculated by themeasured body heights of 16,500 men and 19,969 women in 13 EU Member States and assuming abody mass index (BMI) of 22 kg/m2 (see Appendix 11 in EFSA NDA Panel (2013b)). Considering thesereference body weights and the AI of 1 lg/kg body weight per day of phylloquinone, the dailyphylloquinone intake would be 68.1 lg for men and 58.5 lg for women, rounded up to 70 lg/day forall adults.
The Panel notes that the proposed AI is close to the median phylloquinone intake of 76 lg/day (forsubjects aged 15–80 years, n = 6,160) in the German National Nutrition Survey II that used updatedphylloquinone composition data (Section 3.2.2, mean intake not reported). The Panel also considersthat there was no evidence of different vitamin K absorption and different losses according to age inadults, thus, sets the same AI for ‘younger’ and ‘older’ adults.
6.2. Infants aged 7–11 months
The Panel decided to use for infants aged 7–11 months the same AI of 1 lg/kg body weight perday of phylloquinone obtained in adults. Considering the uncertainties associated with the setting ofthis value, and the small size of the body pool of phylloquinone, the Panel decided not to use growthfactors (calculated in EFSA NDA Panel (2014)), considering that the requirement for growth would becovered by such an intake of 1 lg/kg body weight per day.
The Panel calculated averages of the median body weights of male and female infants, aged9 months (8.6 kg) from the WHO Growth Standards (WHO Multicentre Growth Reference Study Group,2006). Considering a reference body weight of 8.6 kg for infants aged 7–11 months and the AI of1 lg/kg body weight per day phylloquinone, the daily phylloquinone intake would be 8.6 lg/day,rounded up to 10 lg/day.
The Panel notes that low vitamin K stores at birth may predispose to haemorrhages in healthyneonates and young infants (EFSA NDA Panel, 2013a). The Panel also notes that European Society forPaediatric Gastroenterology, Hepatology and Nutrition (ESPGHAN) Committee on Nutrition (Mihatschet al., 2016) recommends supplementation with phylloquinone of healthy newborn infants, accordingto national recommendations on the regimen, which may differ between countries.
6.3. Children
As for infants, the Panel decided not to use growth factors, considering that the requirement forgrowth would be covered by an intake of 1 lg/kg body weight per day. Considering median bodyweights of boys and girls, the daily phylloquinone intake in children is indicated in Table 4.
The Panel notes that the median (mean, IQR) intake estimates for vitamin K (phylloquinone andMK–n) for children are 62 (70, 43–89) and 72 (80, 51–99) lg/day for girls (n = 857) and boys
Dietary reference values for vitamin K
www.efsa.europa.eu/efsajournal 44 EFSA Journal 2017;15(5):4780

(n = 856) aged 7–18 years, in the Dutch National Survey that used updated composition data forphylloquinone and menaquinones (Section 3.2).
6.4. Pregnancy
The Panel notes that, during pregnancy, only small quantities of phylloquinone cross the placentafrom mother to fetus, that there is no correlation between maternal and cord blood phylloquinoneconcentrations, and that little information is available in relation to placental transfer of menaquinones(Section 2.3.3). The Panel considers that the AI of 1 lg/kg body weight per day of phylloquinone setfor non-pregnant women also applies to pregnant women.
A mean gestational increase in body weight of 12 kg, for women with a singleton pregnancy and apre-pregnancy BMI in the range between 18.5 and 24.9 kg/m2, was also previously considered (EFSANDA Panel, 2013b). In view of the increase in blood volume during pregnancy, and considering amean gestational increase in body weight of 12 kg to the reference body weight of 58.5 kg fornon-pregnant women, the daily phylloquinone intake in pregnant women would be 70.5 lg/day.
As the Panel set an AI of 70 lg/day for all adults after rounding (Section 6.1), the Panel concludesthat there is no need for a specific AI for vitamin K for pregnant women. The AI for pregnant womenis thus the same as for non-pregnant women (i.e. 70 lg phylloquinone/day)
6.5. Lactation
The Panel considers that the AI of 1 lg/kg body weight per day of phylloquinone set for non-lactating women covers the small excretion of vitamin K (mainly phylloquinone) in breast milk, thusthat no compensation for this excretion is required in setting DRVs for lactating women. The AI forlactating women is thus the same as for non-lactating women (i.e. 70 lg phylloquinone/day).
Conclusions
The Panel considers vitamin K as phylloquinone and menaquinones. The Panel concludes that noneof the biomarkers of vitamin K intake or status is suitable by itself to derive DRVs for vitamin K andthat available data on intake of phylloquinone or menaquinones and health outcomes cannot be usedto derive DRVs for vitamin K. The Panel concludes that ARs and PRIs for vitamin K cannot be derivedfor adults, infants and children, and therefore sets AIs. The Panel also concludes that availableevidence on intake, absorption, function and content in the body or organs of menaquinones isinsufficient, thus sets AIs for phylloquinone only.
After having considered several possible approaches, based on biomarkers, intake data and thefactorial approach, which all are associated with considerable uncertainties, the reference valueproposed by the SCF in 1993 is maintained. The same AI for phylloquinone of 1 lg/kg body weightper day is set for all age and sex population groups. For infants and children, the Panel decided not touse growth factors, considering that the requirement for growth would be covered by such an intake.The Panel considers the respective reference body weights for adults, infants and children to set AIsfor phylloquinone expressed in lg/day. The Panel notes that the proposed AI in adults (70 lg/day) isclose to the median phylloquinone intake of 76 lg/day in the German National Nutrition Survey II that
Table 4: Daily phylloquinone intake in boys and girls based on an AI of 1 lg/kg body weight perday and reference body weights
Boys GirlsAIs for both sexes(rounded value)
1–3 years 12.2(a) 11.5(a) 12
4–6 years 19.2(b) 18.7(b) 207–10 years 29.0(c) 28.4(c) 30
11–14 years 44.0(d) 45.1(d) 45
15–17 years 64.1(e) 56.4(e) 65
(a): Average of the median weight-for-age of male or female children aged 24 months according to the WHO Growth Standards(WHO Multicentre Growth Reference Study Group, 2006).
(b): Average of the median weight of male or female children aged 5 years (van Buuren et al., 2012).(c): Average of the median weight of male or female children aged 8.5 years (van Buuren et al., 2012).(d): Average of the median weight of male or female children aged 12.5 years (van Buuren et al., 2012).(e): Average of the median weight of male or female children aged 16 years (van Buuren et al., 2012).
Dietary reference values for vitamin K
www.efsa.europa.eu/efsajournal 45 EFSA Journal 2017;15(5):4780

used updated phylloquinone composition data. The mean gestational increase in body weight and thereference body weight of non-pregnant women were taken into account by the Panel in itscalculations, but the AI set for pregnant women is finally the same as for non-pregnant womenobtained after rounding. In view of the small excretion of vitamin K in breast milk, the AI set forlactating women is the same as the one for non-lactating women obtained after rounding (Table 5).
Recommendations for research
The Panel suggests to undertake further research on:
• more extensive and precise analytical data for phylloquinone and menaquinones in food.• the measurement of absorption of phylloquinone and menaquinones, including the absorption
of menaquinones produced by gut bacteria, and the influence of foods and the diet on theseprocesses.
• the intake of menaquinones and phylloquinone in Europe and their metabolism, storage andfunctions, including during pregnancy.
• the specific activity of different menaquinones in relation to phylloquinone functions.• cut-off values for biomarkers for vitamin K status to derive DRVs for vitamin K for infants,
children, adults, pregnant and lactating women, through studies specifically designed for thispurpose
• vitamin K and long-term health outcomes.• the influence of sex and genotype on vitamin K requirement.
ReferencesAFSSA (Agence franc�aise de s�ecurit�e sanitaire des aliments), 2001. Apports nutritionnels conseill�es pour la
population franc�aise. Editions Tec & Doc, Paris, France. 605 pp.Al Rajabi A, Booth SL, Peterson JW, Choi SW, Suttie JW, Shea MK, Miao B, Grusak MA and Fu X, 2012. Deuterium-
labeled phylloquinone has tissue-specific conversion to menaquinone-4 among Fischer 344 male rats. Journalof Nutrition, 142, 841–845.
Allison PM, Mummah-Schendel LL, Kindberg CG, Harms CS, Bang NU and Suttie JW, 1987. Effects of a vitamin K-deficient diet and antibiotics in normal human volunteers. Journal of Laboratory and Clinical Medicine, 110, 180–188.
Anai T, Hirota Y, Yoshimatsu J, Oga M and Miyakawa I, 1993. Can prenatal vitamin K1 (phylloquinone)supplementation replace prophylaxis at birth? Obstetrics and Gynecology, 81, 251–254.
Andrew M, Paes B, Milner R, Johnston M, Mitchell L, Tollefsen DM and Powers P, 1987. Development of the humancoagulation system in the full-term infant. Blood, 70, 165–172.
Andrew M, Paes B, Milner R, Johnston M, Mitchell L, Tollefsen DM, Castle V and Powers P, 1988. Development ofthe human coagulation system in the healthy premature infant. Blood, 72, 1651–1657.
Andrew M, 1997. The relevance of developmental hemostasis to hemorrhagic disorders of newborns. Seminars inPerinatology, 21, 70–85.
Anses/CIQUAL (Agence nationale de s�ecurit�e sanitaire de l’alimentation, de l’environnement et du travail/Centred’information sur la qualit�e des aliments), 2013. French food composition table version 2013. Available online:https://pro.anses.fr/TableCIQUAL/
Apalset E, Gjesdal C, Eide G, Johansen A-M, Drevon C and Tell G, 2010. Dietary vitamin K and K2 and bonemineral density: The Hordaland Health Study. Archives of Osteoporosis, 5, 73–81.
Apalset EM, Gjesdal CG, Eide GE and Tell GS, 2011. Intake of vitamin K1 and K2 and risk of hip fractures: TheHordaland Health Study. Bone, 49, 990–995.
Table 5: Summary of Dietary Reference Values for vitamin K (based on phylloquinone only)
Age AI (lg/day)7–11 months 10
1–3 years 124–6 years 20
7–10 years 3011–14 years 45
15–17 years 65
≥ 18 years(a) 70
(a): Including pregnancy and lactation.
Dietary reference values for vitamin K
www.efsa.europa.eu/efsajournal 46 EFSA Journal 2017;15(5):4780

Azharuddin MK, O’Reilly DS, Gray A and Talwar D, 2007. HPLC method for plasma vitamin K1: effect of plasmatriglyceride and acute-phase response on circulating concentrations. Clinical Chemistry, 53, 1706–1713.
Bach AU, Anderson SA, Foley AL, Williams EC and Suttie JW, 1996. Assessment of vitamin K status in humansubjects administered “minidose” warfarin. American Journal of Clinical Nutrition, 64, 894–902.
Beavan SR, Prentice A, Stirling DM, Dibba B, Yan L, Harrington DJ and Shearer MJ, 2005. Ethnic differences inosteocalcin gamma-carboxylation, plasma phylloquinone (vitamin K1) and apolipoprotein E genotype. EuropeanJournal of Clinical Nutrition, 59, 72–81.
Bellido-Martin L and de Frutos PG, 2008. Vitamin K-dependent actions of Gas6. Vitamins and Hormones, 78, 185–209.Beulens JW, van der ADL, Grobbee DE, Sluijs I, Spijkerman AM and van der Schouw YT, 2010. Dietary
phylloquinone and menaquinones intakes and risk of type 2 diabetes. Diabetes Care, 33, 1699–1705.Binkley NC, Krueger DC, Kawahara TN, Engelke JA, Chappell RJ and Suttie JW, 2002. A high phylloquinone intake
is required to achieve maximal osteocalcin gamma-carboxylation. American Journal of Clinical Nutrition, 76,1055–1060.
Bjornsson TD, Meffin PJ, Swezey SE and Blaschke TF, 1979. Effects of clofibrate and warfarin alone and incombination on the disposition of vitamin K1. Journal of Pharmacology and Experimental Therapeutics, 210,322–326.
Blomstrand R and Forsgren L, 1968. Vitamin K1-3H in man. Its intestinal absorption and transport in the thoracicduct lymph. Internationale Zeitschrift f€ur Vitaminforschung, 38, 45–64.
Bolton-Smith C, Price RJ, Fenton ST, Harrington DJ and Shearer MJ, 2000. Compilation of a provisional UKdatabase for the phylloquinone (vitamin K1) content of foods. British Journal of Nutrition, 83, 389–399.
Bolton-Smith C, McMurdo ME, Paterson CR, Mole PA, Harvey JM, Fenton ST, Prynne CJ, Mishra GD and ShearerMJ, 2007. Two-year randomized controlled trial of vitamin K1 (phylloquinone) and vitamin D3 plus calcium onthe bone health of older women. Journal of Bone and Mineral Research, 22, 509–519.
Booth SL, Madabushi HT, Davidson KW and Sadowski JA, 1995. Tea and coffee brews are not dietary sources ofvitamin K-1 (phylloquinone). Journal of the American Dietetic Association, 95, 82–83.
Booth SL, Pennington JA and Sadowski JA, 1996a. Food sources and dietary intakes of vitamin K-1 (phylloquinone)in the American diet: data from the FDA Total Diet Study. Journal of the American Dietetic Association, 96,149–154.
Booth SL, Pennington JA and Sadowski JA, 1996b. Dihydro-vitamin K1: primary food sources and estimateddietary intakes in the American diet. Lipids, 31, 715–720.
Booth SL, Tucker KL, McKeown NM, Davidson KW, Dallal GE and Sadowski JA, 1997. Relationships between dietaryintakes and fasting plasma concentrations of fat-soluble vitamins in humans. Journal of Nutrition, 127, 587–592.
Booth SL and Suttie JW, 1998. Dietary intake and adequacy of vitamin K. Journal of Nutrition, 128, 785–788.Booth SL, Sadowski JA, Weihrauch JL and Ferland G, 1993. Vitamin K1 (phylloquinone) content of foods: a
provisional table. Journal of Food Composition and Analysis, 6, 109–120.Booth SL, Webb DR and Peters JC, 1999a. Assessment of phylloquinone and dihydrophylloquinone dietary intakes
among a nationally representative sample of US consumers using 14-day food diaries. Journal of the AmericanDietetic Association, 99, 1072–1076.
Booth SL, O’Brien-Morse ME, Dallal GE, Davidson KW and Gundberg CM, 1999b. Response of vitamin K status todifferent intakes and sources of phylloquinone-rich foods: comparison of younger and older adults. AmericanJournal of Clinical Nutrition, 70, 368–377.
Booth SL, Tucker KL, Chen H, Hannan MT, Gagnon DR, Cupples LA, Wilson PW, Ordovas J, Schaefer EJ, Dawson-Hughes B and Kiel DP, 2000a. Dietary vitamin K intakes are associated with hip fracture but not with bonemineral density in elderly men and women. American Journal of Clinical Nutrition, 71, 1201–1208.
Booth SL, McKeown NM, Lichtenstein AH, Morse MO, Davidson KW, Wood RJ and Gundberg C, 2000b. Ahydrogenated form of vitamin K: its relative bioavailability and presence in the food supply. Journal of FoodComposition and Analysis, 13, 311–317.
Booth SL and Al Rajabi A, 2008. Determinants of vitamin K status in humans. Vitamins and Hormones, 78, 1–22.Booth SL, 2009. Roles for vitamin K beyond coagulation. Annual Review of Nutrition, 29, 89–110.Booth SL, Lichtenstein AH, O’BrienMorse M, McKeown NM, Wood RJ, Saltzman E and Gundberg CM, 2001. Effects
of a hydrogenated form of vitamin K on bone formation and resorption. American Journal of Clinical Nutrition,74, 783–790.
Booth SL, Lichtenstein AH and Dallal GE, 2002. Phylloquinone absorption from phylloquinone-fortified oil is greaterthan from a vegetable in younger and older men and women. Journal of Nutrition, 132, 2609–2612.
Booth SL, Broe KE, Gagnon DR, Tucker KL, Hannan MT, McLean RR, Dawson-Hughes B, Wilson PW, Cupples LAand Kiel DP, 2003a. Vitamin K intake and bone mineral density in women and men. American Journal of ClinicalNutrition, 77, 512–516.
Booth SL, Martini L, Peterson JW, Saltzman E, Dallal GE and Wood RJ, 2003b. Dietary phylloquinone depletion andrepletion in older women. Journal of Nutrition, 133, 2565–2569.
Booth SL, Golly I, Sacheck JM, Roubenoff R, Dallal GE, Hamada K and Blumberg JB, 2004a. Effect of vitamin Esupplementation on vitamin K status in adults with normal coagulation status. American Journal of ClinicalNutrition, 80, 143–148.
Dietary reference values for vitamin K
www.efsa.europa.eu/efsajournal 47 EFSA Journal 2017;15(5):4780

Booth SL, Broe KE, Peterson JW, Cheng DM, Dawson-Hughes B, Gundberg CM, Cupples LA, Wilson PW and KielDP, 2004b. Associations between vitamin K biochemical measures and bone mineral density in men andwomen. Journal of Clinical Endocrinology and Metabolism, 89, 4904–4909.
Bovill EG, Soll RF, Lynch M, Bhushan F, Landesman M, Freije M, Church W, McAuliffe T, Davidson K and Sadowski J,1993. Vitamin K1 metabolism and the production of des-carboxy prothrombin and protein C in the term andpremature neonate. Blood, 81, 77–83.
Bruge F, Bacchetti T, Principi F, Littarru GP and Tiano L, 2011. Olive oil supplemented with menaquinone-7significantly affects osteocalcin carboxylation. British Journal of Nutrition, 106, 1058–1062.
Bugel S, Sorensen AD, Hels O, Kristensen M, Vermeer C, Jakobsen J, Flynn A, Molgaard C and Cashman KD, 2007.Effect of phylloquinone supplementation on biochemical markers of vitamin K status and bone turnover inpostmenopausal women. British Journal of Nutrition, 97, 373–380.
Bullo M, Estruch R and Salas-Salvado J, 2011. Dietary vitamin K intake is associated with bone quantitativeultrasound measurements but not with bone peripheral biochemical markers in elderly men and women. Bone,48, 1313–1318.
Busfield A, McNinch A and Tripp J, 2007. Neonatal vitamin K prophylaxis in Great Britain and Ireland: the impact ofperceived risk and product licensing on effectiveness. Archives of Disease in Childhood, 92, 754–758.
Caldwell MD, Awad T, Johnson JA, Gage BF, Falkowski M, Gardina P, Hubbard J, Turpaz Y, Langaee TY, Eby C, KingCR, Brower A, Schmelzer JR, Glurich I, Vidaillet HJ, Yale SH, Qi Zhang K, Berg RL and Burmester JK, 2008.CYP4F2 genetic variant alters required warfarin dose. Blood, 111, 4106–4112.
Canfield LM and Hopkinson JM, 1989. State of the art vitamin K in human milk. Journal of PediatricGastroenterology and Nutrition, 8, 430–441.
Canfield LM, Hopkinson JM, Lima AF, Martin GS, Sugimoto K, Burr J, Clark L and McGee DL, 1990. Quantitation ofvitamin K in human milk. Lipids, 25, 406–411.
Canfield LM, Hopkinson JM, Lima AF, Silva B and Garza C, 1991. Vitamin K in colostrum and mature human milkover the lactation period–a cross-sectional study. American Journal of Clinical Nutrition, 53, 730–735.
Card DJ, Gorska R, Cutler J and Harrington DJ, 2014. Vitamin K metabolism: current knowledge and futureresearch. Molecular Nutrition and Food Research, 58, 1590–1600.
Chan R, Leung J and Woo J, 2012. No association between dietary vitamin K intake and fracture risk in Chinesecommunity-dwelling older men and women: a prospective study. Calcified Tissue International, 90, 396–403.
Clarke P, 2010. Vitamin K prophylaxis for preterm infants. Early Human Development, 86(Suppl 1), 17–20.Clarke P, Mitchell SJ, Wynn R, Sundaram S, Speed V, Gardener E, Roeves D and Shearer MJ, 2006. Vitamin K
prophylaxis for preterm infants: a randomized, controlled trial of 3 regimens. Pediatrics, 118, e1657–e1666.Cockayne S, Adamson J, Lanham-New S, Shearer MJ, Gilbody S and Torgerson DJ, 2006. Vitamin K and the
prevention of fractures: systematic review and meta-analysis of randomized controlled trials. Archives ofInternal Medicine, 166, 1256–1261.
Conly JM and Stein K, 1992. The production of menaquinones (vitamin K2) by intestinal bacteria and their role inmaintaining coagulation homeostasis. Progress in Food and Nutrition Science, 16, 307–343.
Cooper AD, 1997. Hepatic uptake of chylomicron remnants. Journal of Lipid Research, 38, 2173–2192.Craciun AM, Wolf J, Knapen MH, Brouns F and Vermeer C, 1998. Improved bone metabolism in female elite
athletes after vitamin K supplementation. International Journal of Sports Medicine, 19, 479–484.Cranenburg EC, Koos R, Schurgers LJ, Magdeleyns EJ, Schoonbrood TH, Landewe RB, Brandenburg VM, Bekers O
and Vermeer C, 2010. Characterisation and potential diagnostic value of circulating matrix Gla protein (MGP)species. Thrombosis and Haemostasis, 104, 811–822.
Crosier MD, Peter I, Booth SL, Bennett G, Dawson-Hughes B and Ordovas JM, 2009. Association of sequencevariations in vitamin K epoxide reductase and gamma-glutamyl carboxylase genes with biochemical measuresof vitamin K status. Journal of Nutritional Science and Vitaminology, 55, 112–119.
Cynober L, Alix E, Arnaud-Battandier F, Bonnefoy M, Brocker P, Cals MJ, Cherbut C, Coplo C, Ferry M, Ghisolfi-Marque A, Kravtchenko T, Lesourd B, Mignot C and Mirand PP, 2000. Apports nutritionnels conseill�es chez lapersonne ag�ee. Nutrition Clinique et M�etabolisme, 14(Supplement 1), 3–60.
D-A-CH (Deutsche Gesellschaft f€ur Ern€ahrung, €Osterreichische Gesellschaft f€ur Ern€ahrung, SchweizerischeGesellschaft f€ur Ern€ahrung), 2015. Referenzwerte f€ur die N€ahrstoffzufuhr. 2. Auflage, 1. Ausgabe. DGE, Bonn,Germany.
Dalmeijer GW, van der Schouw YT, Magdeleyns E, Ahmed N, Vermeer C and Beulens JW, 2012. The effect ofmenaquinone-7 supplementation on circulating species of matrix Gla protein. Atherosclerosis, 225, 397–402.
Dalmeijer GW, van der Schouw YT, Vermeer C, Magdeleyns EJ, Schurgers LJ and Beulens JW, 2013. Circulatingmatrix Gla protein is associated with coronary artery calcification and vitamin K status in healthy women.Journal of Nutritional Biochemistry, 24, 624–628.
Dam V, Dalmeijer GW, Vermeer C, Drummen NE, Knapen MH, van der Schouw YT and Beulens JW, 2015.Association between vitamin K and the metabolic syndrome: a 10-year follow-up study in adults. Journal ofClinical Endocrinology and Metabolism, 100, 2472–2479.
Danziger J, 2008. Vitamin K-dependent proteins, warfarin, and vascular calcification. Clinical Journal of theAmerican Society of Nephrology, 3, 1504–1510.
Dietary reference values for vitamin K
www.efsa.europa.eu/efsajournal 48 EFSA Journal 2017;15(5):4780

Dashti HS, Shea MK, Smith CE, Tanaka T, Hruby A, Richardson K, Wang TJ, Nalls MA, Guo X, Liu Y, Yao J, Li D,Johnson WC, Benjamin EJ, Kritchevsky SB, Siscovick DS, Ordovas JM and Booth SL, 2014. Meta-analysis ofgenome-wide association studies for circulating phylloquinone concentrations. American Journal of ClinicalNutrition, 100, 1462–1469.
Davidson RT, Foley AL, Engelke JA and Suttie JW, 1998. Conversion of dietary phylloquinone to tissuemenaquinone-4 in rats is not dependent on gut bacteria. Journal of Nutrition, 128, 220–223.
DGE (Deutsche Gesellschaft f€ur Ern€ahrung e. V.), 2012. Ern€ahrungsbericht 2012. Bonn, Germany. 432 pp.DH (Department of Health), 1991. Dietary Reference Values for food energy and nutrients for the United Kingdom.
Report of the Panel on Dietary Reference Values of the Committee on Medical Aspects of Food Policy. HMSO,London, UK, 212 pp.
Dickson RC, Stubbs TM and Lazarchick J, 1994. Antenatal vitamin K therapy of the low-birth-weight infant.American Journal of Obstetrics and Gynecology, 170, 85–89.
Dolnikowski GG, Sun Z, Grusak MA, Peterson JW and Booth SL, 2002. HPLC and GC/MS determination ofdeuterated vitamin K (phylloquinone) in human serum after ingestion of deuterium-labeled broccoli. Journal ofNutritional Biochemistry, 13, 168–174.
Duello TJ and Matschiner JT, 1972. Characterization of vitamin K from human liver. Journal of Nutrition, 102, 331–335.EFSA (European Food Safety Authority), 2011a. Report on the development of a food classification and description
system for exposure assessment and guidance on its implementation and use. EFSA Journal 2011;9(12):2489,84 pp. https://doi.org/10.2903/j.efsa.2011.2489
EFSA (European Food Safety Authority), 2011b. Use of the EFSA Comprehensive European Food ConsumptionDatabase in exposure assessment. EFSA Journal 2011;9(3):2097, 34 pp. https://doi.org/10.2903/j.efsa.2011.2097
EFSA NDA Panel (EFSA Panel on Dietetic Products, Nutrition and Allergies), 2013a. Scientific Opinion on nutrientrequirements and dietary intakes of infants and young children in the European Union. EFSA Journal 2013;11(10):3408, 103 pp. https://doi.org/10.2903/j.efsa.2013.3408
EFSA NDA Panel (EFSA Panel on Dietetic Products Nutrition and Allergies), 2013b. Scientific Opinion on DietaryReference Values for energy. EFSA Journal 2013;11(1):3005, 112 pp. https://doi.org/10.2903/j.efsa.2013.3005
EFSA NDA Panel (EFSA Panel on Dietetic Products, Nutrition and Allergies), 2014. Scientific Opinion on DietaryReference Values for selenium. EFSA Journal 2014;12(10):3846, 66 pp. https://doi.org/10.2903/j.efsa.2014.3846
EFSA NDA Panel (EFSA Panel on Dietetic Products, Nutrition and Allergies), 2015a. Scientific Opinion on DietaryReference Values for vitamin E as a-tocopherol. EFSA Journal 2015;13(7):4149, 72 pp. https://doi.org/10.2903/j.efsa.2015.4149
EFSA NDA Panel (EFSA Panel on Dietetic Products, Nutrition and Allergies), 2015b. Scientific Opinion on DietaryReference Values for calcium. EFSA Journal 2015;13(5):4101, 82 pp. https://doi.org/10.2903/j.efsa.2015.4101
EFSA NDA Panel (EFSA Panel on Dietetic Products, Nutrition and Allergies), 2016. Scientific Opinion on DietaryReference Values for vitamin D. EFSA Journal 2016;14(10):4547, 145 pp. https://doi.org/10.2903/j.efsa.2016.4547
Elder SJ, Haytowitz DB, Howe J, Peterson JW and Booth SL, 2006. Vitamin k contents of meat, dairy, and fast foodin the U.S. Diet. Journal of Agricultural and Food Chemistry, 54, 463–467.
Elmadfa I, Godina-Zarfl B, Dichtl M and K€onig JS, 1994. The Austrian Study on nutritional status of 6- to 18-year-old pupils. Bibliotheca Nutritio et Dieta, 62–67.
Elmadfa I, Hasenegger V, Wagner K, Putz P, Weidl NM, Wottawa D, Kuen T, Seiringer G, Meyer AL, Sturtzel B,Kiefer I, Zilberszac A, Sgarabottolo V, Meidlinger B and Rieder A, 2012. €Osterreichischer Ern€ahrungsbericht2012. Institut f€ur Ern€ahrungswissenschaften, Universit€at Wien, Bundesministerium f€ur Gesundheit,€Osterreichischer Agentur f€ur Gesundheit und Ern€ahrungssicherheit GmbH (AGES), 412 pp.
Emaus N, Gjesdal CG, Almas B, Christensen M, Grimsgaard AS, Berntsen GK, Salomonsen L and Fonnebo V, 2010.Vitamin K2 supplementation does not influence bone loss in early menopausal women: a randomised double-blind placebo-controlled trial. Osteoporosis International, 21, 1731–1740.
Erkkila AT, Lichtenstein AH, Dolnikowski GG, Grusak MA, Jalbert SM, Aquino KA, Peterson JW and Booth SL, 2004.Plasma transport of vitamin K in men using deuterium-labeled collard greens. Metabolism: Clinical andExperimental, 53, 215–221.
Erkkila AT, Booth SL, Hu FB, Jacques PF, Manson JE, Rexrode KM, Stampfer MJ and Lichtenstein AH, 2005.Phylloquinone intake as a marker for coronary heart disease risk but not stroke in women. European Journal ofClinical Nutrition, 59, 196–204.
Erkkila AT, Booth SL, Hu FB, Jacques PF and Lichtenstein AH, 2007. Phylloquinone intake and risk of cardiovasculardiseases in men. Nutrition Metabolism and Cardiovascular Diseases, 17, 58–62.
Ferland G and Sadowski JA, 1992. Vitamin K1 (phylloquinone) content of edible oils: effects of heating and lightexposure. Journal of Agricultural and Food Chemistry, 40, 1869–1873.
Ferland G, MacDonald DL and Sadowski JA, 1992. Development of a diet low in vitamin K-1 (phylloquinone).Journal of the American Dietetic Association, 92, 593–597.
Ferland G, Sadowski JA and O’Brien ME, 1993. Dietary induced subclinical vitamin K deficiency in normal humansubjects. Journal of Clinical Investigation, 91, 1761–1768.
Ferland G, 1998. The vitamin K-dependent proteins: an update. Nutrition Reviews, 56, 223–230.Ferreira DW, Haytowitz DB, Tassinari MA, Peterson JW and Booth SL, 2006. Vitamin K contents of grains, cereals,
fast-food breakfasts, and baked goods. Journal of Food Science, 71, S66–S70.
Dietary reference values for vitamin K
www.efsa.europa.eu/efsajournal 49 EFSA Journal 2017;15(5):4780

Feskanich D, Weber P, Willett WC, Rockett H, Booth SL and Colditz GA, 1999. Vitamin K intake and hip fractures inwomen: a prospective study. American Journal of Clinical Nutrition, 69, 74–79.
Fomon SJ, 2001. Feeding normal infants: rationale for recommendations. Journal of the American DieteticAssociation, 101, 1002–1005.
Fournier B, Sann L, Guillaumont M and Leclercq M, 1987. Variations of phylloquinone concentration in human milkat various stages of lactation and in cow’s milk at various seasons. American Journal of Clinical Nutrition, 45,551–558.
Frick PG, Riedler G and Brogli H, 1967. Dose response and minimal daily requirement for vitamin K in man. Journalof Applied Physiology, 23, 387–389.
FSA (Food Standards Agency), 2002. McCance & Widdowson’s the composition of foods. 6th summary Edition.Royal Society of Chemistry, Cambridge, UK, 568 pp.
Fu X, Peterson JW, Hdeib M, Booth SL, Grusak MA, Lichtenstein AH and Dolnikowski GG, 2009. Measurement ofdeuterium-labeled phylloquinone in plasma by high-performance liquid chromatography/mass spectrometry.Analytical Chemistry, 81, 5421–5425.
Fu X, Shen X, Finnan EG, Haytowitz DB and Booth SL, 2016. Measurement of multiple vitamin K forms inprocessed and fresh-cut pork products in the U.S. food supply. Journal of Agricultural and Food Chemistry, 64,4531–4535.
Fujita K, Kakuya F and Ito S, 1993. Vitamin K1 and K2 status and faecal flora in breast fed and formula fed 1-month-old infants. European Journal of Pediatrics, 152, 852–855.
Furie B, Bouchard BA and Furie BC, 1999. Vitamin K-dependent biosynthesis of gamma-carboxyglutamic acid.Blood, 93, 1798–1808.
Fusaro M, Noale M, Viola V, Galli F, Tripepi G, Vajente N, Plebani M, Zaninotto M, Guglielmi G, Miotto D, DalleCarbonare L, D’Angelo A, Naso A, Grimaldi C, Miozzo D, Giannini S, Gallieni M and Investigators VIKIDS, 2012.Vitamin K, vertebral fractures, vascular calcifications, and mortality: VItamin K Italian (VIKI) dialysis study.Journal of Bone and Mineral Research, 27, 2271–2278.
Garber AK, Binkley NC, Krueger DC and Suttie JW, 1999. Comparison of phylloquinone bioavailability from foodsources or a supplement in human subjects. Journal of Nutrition, 129, 1201–1203.
Garcia AA and Reitsma PH, 2008. VKORC1 and the vitamin K cycle. Vitamins and Hormones, 78, 23–33.Gast GC, de Roos NM, Sluijs I, Bots ML, Beulens JW, Geleijnse JM, Witteman JC, Grobbee DE, Peeters PH and van
der Schouw YT, 2009. A high menaquinone intake reduces the incidence of coronary heart disease. NutritionMetabolism and Cardiovascular Diseases, 19, 504–510.
Geleijnse JM, Vermeer C, Grobbee DE, Schurgers LJ, Knapen MH, van der Meer IM, Hofman A and Witteman JC,2004. Dietary intake of menaquinone is associated with a reduced risk of coronary heart disease: theRotterdam Study. Journal of Nutrition, 134, 3100–3105.
Gentili A, Cafolla A, Gasperi T, Bellante S, Caretti F, Curini R and Fernandez VP, 2014. Rapid, high performancemethod for the determination of vitamin K(1), menaquinone-4 and vitamin K(1) 2,3-epoxide in human serumand plasma using liquid chromatography-hybrid quadrupole linear ion trap mass spectrometry. Journal ofChromatography A, 1338, 102–110.
Gijsbers BL, Jie KS and Vermeer C, 1996. Effect of food composition on vitamin K absorption in human volunteers.British Journal of Nutrition, 76, 223–229.
Glynn RJ, Ridker PM, Goldhaber SZ, Zee RY and Buring JE, 2007. Effects of random allocation to vitamin Esupplementation on the occurrence of venous thromboembolism: report from the Women’s Health Study.Circulation, 116, 1497–1503.
Goodstadt L and Ponting CP, 2004. Vitamin K epoxide reductase: homology, active site and catalytic mechanism.Trends in Biochemical Sciences, 29, 289–292.
Green G, Poller L, Thomson JM and Dymock IW, 1976. Factor VII as a marker of hepatocellular synthetic functionin liver disease. Journal of Clinical Pathology, 29, 971–975.
Greer FR, Mummah-Schendel LL, Marshall S and Suttie JW, 1988. Vitamin K1 (phylloquinone) and vitamin K2(menaquinone) status in newborns during the first week of life. Pediatrics, 81, 137–140.
Greer FR and Zachman RD, 1998. Neonatal vitamin metabolism: fat soluble. In: Cowett RM (ed.). Principles ofPerinatal-Neonatal Metabolism. Springer–Verlag, New York, USA. pp. 943–975.
Greer FR, 2010. Vitamin K the basics–what’s new? Early Human Development, 86(Suppl 1), 43–47.Greer FR, Marshall S, Cherry J and Suttie JW, 1991. Vitamin K status of lactating mothers, human milk, and
breast-feeding infants. Pediatrics, 88, 751–756.Greer FR, 1995. The importance of vitamin K as a nutrient during the first year of life. Nutrition Research, 15,
289–310.Greer FR, Marshall SP, Foley AL and Suttie JW, 1997. Improving the vitamin K status of breastfeeding infants with
maternal vitamin K supplements. Pediatrics, 99, 88–92.Greer FR, Marshall SP, Severson RR, Smith DA, Shearer MJ, Pace DG and Joubert PH, 1998. A new mixed micellar
preparation for oral vitamin K prophylaxis: randomised controlled comparison with an intramuscular formulationin breast fed infants. Archives of Disease in Childhood, 79, 300–305.
Dietary reference values for vitamin K
www.efsa.europa.eu/efsajournal 50 EFSA Journal 2017;15(5):4780

Gross J, Cho WK, Lezhneva L, Falk J, Krupinska K, Shinozaki K, Seki M, Herrmann RG and Meurer J, 2006. A plantlocus essential for phylloquinone (vitamin K1) biosynthesis originated from a fusion of four eubacterial genes.Journal of Biological Chemistry, 281, 17189–17196.
Hanck A and Weiser H, 1983. Physiological and pharmacological effects of vitamin K. International Journal forVitamin and Nutrition Research, Supplement, 24, 155–170.
Hansen KN, Minousis M and Ebbesen F, 2003. Weekly oral vitamin K prophylaxis in Denmark. Acta Paediatrica, 92,802–805.
Hansson K and Stenflo J, 2005. Post-translational modifications in proteins involved in blood coagulation. Journalof Thrombosis and Haemostasis, 3, 2633–2648.
Haraikawa M, Tsugawa N, Sogabe N, Tanabe R, Kawamura Y, Okano T, Hosoi T and Goseki-Sone M, 2013. Effects ofgamma-glutamyl carboxylase gene polymorphism (R325Q) on the association between dietary vitamin K intakeand gamma-carboxylation of osteocalcin in young adults. Asia Pacific Journal of Clinical Nutrition, 22, 646–654.
Haroon Y, Shearer MJ, Rahim S, Gunn WG, McEnery G and Barkhan P, 1982. The content of phylloquinone(vitamin K1) in human milk, cows’ milk and infant formula foods determined by high-performance liquidchromatography. Journal of Nutrition, 112, 1105–1117.
Harrington DJ, Soper R, Edwards C, Savidge GF, Hodges SJ and Shearer MJ, 2005. Determination of the urinaryaglycone metabolites of vitamin K by HPLC with redox-mode electrochemical detection. Journal of LipidResearch, 46, 1053–1060.
Harrington DJ, Booth SL, Card DJ and Shearer MJ, 2007. Excretion of the urinary 5C- and 7C-aglycone metabolitesof vitamin K by young adults responds to changes in dietary phylloquinone and dihydrophylloquinone intakes.Journal of Nutrition, 137, 1763–1768.
Harrington DJ, Clarke P, Card DJ, Mitchell SJ and Shearer MJ, 2010. Urinary excretion of vitamin K metabolites interm and preterm infants: relationship to vitamin K status and prophylaxis. Pediatric Research, 68, 508–512.
Hayes A, Hennessy A, Walton J, McNulty BA, Lucey AJ, Kiely M, Flynn A and Cashman KD, 2016. Phylloquinoneintakes and food sources and vitamin K status in a nationally representative sample of Irish adults. Journal ofNutrition, 146, 2274–2280.
Heinonen M, K€arkk€ainen M, Riuttam€aki MA, Piironen V, Lampi AM, Ollilainen V and Lamberg-Allardt C, 2012.Literature search and review related to specific preparatory work in the establishment of Dietary ReferenceValues. Preparation of an evidence report identifying health outcomes upon which Dietary Reference Valuescould potentially be based for vitamins A, C, E, and K. Project developed on the procurement project CT/EFSA/NDA/2010/02. EFSA Supporting publication 2012:EN-256, 331 pp.
Helld�an A, Raulio S, Kosola M, Tapanainen H, Ovaskainen ML and Virtanen S, 2013. Finravinto 2012 - tutkimus -The National FINDIET 2012 Survey. THL. Raportti 16/2013, 217 pp.
Hirauchi K, Sakano T, Notsumoto S, Nagaoka T, Morimoto A, Fujimoto K, Masuda S and Suzuki Y, 1989.Measurement of K vitamins in animal tissues by high-performance liquid chromatography with fluorimetricdetection. Journal of Chromatography, 497, 131–137.
Hodges SJ, Akesson K, Vergnaud P, Obrant K and Delmas PD, 1993a. Circulating levels of vitamins K1 and K2decreased in elderly women with hip fracture. Journal of Bone and Mineral Research, 8, 1241–1245.
Hodges SJ, Bejui J, Leclercq M and Delmas PD, 1993b. Detection and measurement of vitamins K1 and K2 inhuman cortical and trabecular bone. Journal of Bone and Mineral Research, 8, 1005–1008.
Hogenbirk K, Peters M, Bouman P, Sturk A and Buller HA, 1993. The effect of formula versus breast feeding andexogenous vitamin K1 supplementation on circulating levels of vitamin K1 and vitamin K-dependent clottingfactors in newborns. European Journal of Pediatrics, 152, 72–74.
Hoppu U, Lehtisalo J, Kujala J, Keso T, Garam S, Tapanainen H, Uutela A, Laatikainen T, Rauramo U and PietinenP, 2010. The diet of adolescents can be improved by school intervention. Public Health Nutrition, 13, 973–979.
Hoskin FC, Spinks JW and Jaques LB, 1954. Urinary excretion products of menadione (vitamin K3). CanadianJournal of Biochemistry and Physiology, 32, 240–250.
Iioka H, Moriyama IS, Morimoto K, Akada S, Hisanaga H, Ishihara Y and Ichijo M, 1991. Pharmacokinetics ofvitamin K in mothers and children in the perinatal period: transplacental transport of vitamin K2 (MK-4). Asia-Oceania Journal of Obstetrics and Gynaecology, 17, 97–100.
Inaba N, Sato T and Yamashita T, 2015. Low-dose daily intake of vitamin K(2) (menaquinone-7) improvesosteocalcin gamma-carboxylation: a double-blind, randomized controlled trials. Journal of Nutritional Scienceand Vitaminology, 61, 471–480.
IOM (Institute of Medicine), 2001. Dietary reference intakes for Vitamin A, Vitamin K, Arsenic, Boron, Chromium,Copper, Iodine, Iron, Manganese, Molybdenum, Nickel, Silicon, Vanadium, and Zinc. National Academy Press,Washington, DC, USA. 773 pp.
Jakob E and Elmadfa I, 1996. Application of a simplified HPLC assay for the determination of phylloquinone(vitamin K1) in animal and plant food items. Food Chemistry, 56, 87–91.
Jie KS, Bots ML, Vermeer C, Witteman JC and Grobbee DE, 1995. Vitamin K intake and osteocalcin levels inwomen with and without aortic atherosclerosis: a population-based study. Atherosclerosis, 116, 117–123.
Jones DY, Koonsvitsky BP, Ebert ML, Jones MB, Lin PY, Will BH and Suttie JW, 1991. Vitamin K status of free-livingsubjects consuming olestra. American Journal of Clinical Nutrition, 53, 943–946.
Dietary reference values for vitamin K
www.efsa.europa.eu/efsajournal 51 EFSA Journal 2017;15(5):4780

Jones KS, Bluck LJ, Wang LY and Coward WA, 2008. A stable isotope method for the simultaneous measurementof vitamin K1 (phylloquinone) kinetics and absorption. European Journal of Clinical Nutrition, 62, 1273–1281.
Jones KS, Bluck LJ, Wang LY, Stephen AM, Prynne CJ and Coward WA, 2009. The effect of different meals on theabsorption of stable isotope-labelled phylloquinone. British Journal of Nutrition, 102, 1195–1202.
Juanola-Falgarona M, Salas-Salvado J, Estruch R, Portillo MP, Casas R, Miranda J, Martinez-Gonzalez MA andBullo M, 2013. Association between dietary phylloquinone intake and peripheral metabolic risk markersrelated to insulin resistance and diabetes in elderly subjects at high cardiovascular risk. CardiovascularDiabetology, 12, 7.
Juanola-Falgarona M, Salas-Salvado J, Martinez-Gonzalez MA, Corella D, Estruch R, Ros E, Fito M, Aros F, Gomez-Gracia E, Fiol M, Lapetra J, Basora J, Lamuela-Raventos RM, Serra-Majem L, Pinto X, Munoz MA, Ruiz-GutierrezV, Fernandez-Ballart J and Bullo M, 2014. Dietary intake of vitamin K is inversely associated with mortality risk.Journal of Nutrition, 144, 743–750.
Kalkwarf HJ, Khoury JC, Bean J and Elliot JG, 2004. Vitamin K, bone turnover, and bone mass in girls. AmericanJournal of Clinical Nutrition, 80, 1075–1080.
Kamali F, Edwards C, Wood P, Wynne HA and Kesteven P, 2001. Temporal variations in plasma vitamin K and lipidconcentrations and clotting factor activity in humans. American Journal of Hematology, 68, 159–163.
Kamao M, Tsugawa N, Suhara Y, Wada A, Mori T, Murata K, Nishino R, Ukita T, Uenishi K, Tanaka K and Okano T,2007a. Quantification of fat-soluble vitamins in human breast milk by liquid chromatography-tandem massspectrometry. Journal of Chromatography B, Analytical Technologies in the Biomedical and Life Sciences, 859,192–200.
Kamao M, Suhara Y, Tsugawa N, Uwano M, Yamaguchi N, Uenishi K, Ishida H, Sasaki S and Okano T, 2007b.Vitamin K content of foods and dietary vitamin K intake in Japanese young women. Journal of NutritionalScience and Vitaminology, 53, 464–470.
Kaneki M, Hodges SJ, Hosoi T, Fujiwara S, Lyons A, Crean SJ, Ishida N, Nakagawa M, Takechi M, Sano Y, Mizuno Y,Hoshino S, Miyao M, Inoue S, Horiki K, Shiraki M, Ouchi Y and Orimo H, 2001. Japanese fermented soybeanfood as the major determinant of the large geographic difference in circulating levels of vitamin K2: possibleimplications for hip-fracture risk. Nutrition, 17, 315–321.
Kaneki M, Hosoi T, Ouchi Y and Orimo H, 2006. Pleiotropic actions of vitamin K: protector of bone health andbeyond? Nutrition, 22, 845–852.
Kanellakis S, Moschonis G, Tenta R, Schaafsma A, van den Heuvel EG, Papaioannou N, Lyritis G and Manios Y, 2012.Changes in parameters of bone metabolism in postmenopausal women following a 12-month intervention periodusing dairy products enriched with calcium, vitamin D, and phylloquinone (vitamin K(1)) or menaquinone-7(vitamin K (2)): the Postmenopausal Health Study II. Calcified Tissue International, 90, 251–262.
Kayata S, Kindberg C, Greer FR and Suttie JW, 1989. Vitamin K1 and K2 in infant human liver. Journal of PediatricGastroenterology and Nutrition, 8, 304–307.
Kazzi NJ, Ilagan NB, Liang KC, Kazzi GM, Grietsell LA and Brans YW, 1990. Placental transfer of vitamin K1 inpreterm pregnancy. Obstetrics and Gynecology, 75, 334–337.
Kersting M and Clausen K, 2003. Ern€ahrungsphysiologische Auswertung einer repr€asentativen Verzehrsstudie beiS€auglingen und Kleinkindern VELS mit dem Instrumentarium der DONALD Studie. Forschungsinstitut f€urKinderern€ahrung Dortmund, 103 pp.
Kim ES, Kim MS, Na WR and Sohn CM, 2013. Estimation of vitamin K intake in Koreans and determination of theprimary vitamin K-containing food sources based on the fifth Korean National Health and Nutrition ExaminationSurvey (2010–2011). Nutrition Research and Practice, 7, 503–509.
Kinoshita H, Nakagawa K, Narusawa K, Goseki-Sone M, Fukushi-Irie M, Mizoi L, Yoshida H, Okano T, Nakamura T,Suzuki T, Inoue S, Orimo H, Ouchi Y and Hosoi T, 2007. A functional single nucleotide polymorphism in thevitamin-K-dependent gamma-glutamyl carboxylase gene (Arg325Gln) is associated with bone mineral density inelderly Japanese women. Bone, 40, 451–456.
Knapen MH, Nieuwenhuijzen Kruseman AC, Wouters RS and Vermeer C, 1998. Correlation of serum osteocalcinfractions with bone mineral density in women during the first 10 years after menopause. Calcified TissueInternational, 63, 375–379.
Knapen MH, Schurgers LJ and Vermeer C, 2007. Vitamin K2 supplementation improves hip bone geometry andbone strength indices in postmenopausal women. Osteoporosis International, 18, 963–972.
Knapen MH, Drummen NE, Smit E, Vermeer C and Theuwissen E, 2013. Three-year low-dose menaquinone-7supplementation helps decrease bone loss in healthy postmenopausal women. Osteoporosis International, 24,2499–2507.
Knapen MH, Braam LA, Drummen NE, Bekers O, Hoeks AP and Vermeer C, 2015. Menaquinone-7 supplementationimproves arterial stiffness in healthy postmenopausal women. A double-blind randomised clinical trial.Thrombosis and Haemostasis, 113, 1135–1144.
Kohlmeier M, Saupe J, Drossel HJ and Shearer MJ, 1995. Variation of phylloquinone (vitamin K1) concentrations inhemodialysis patients. Thrombosis and Haemostasis, 74, 1252–1254.
Kohlmeier M, Salomon A, Saupe J and Shearer MJ, 1996. Transport of vitamin K to bone in humans. Journal ofNutrition, 126, 1192S–1196S.
Dietary reference values for vitamin K
www.efsa.europa.eu/efsajournal 52 EFSA Journal 2017;15(5):4780

Koitaya N, Ezaki J, Nishimuta M, Yamauchi J, Hashizume E, Morishita K, Miyachi M, Sasaki S and Ishimi Y, 2009.Effect of low dose vitamin K2 (MK-4) supplementation on bio-indices in postmenopausal Japanese women.Journal of Nutritional Science and Vitaminology, 55, 15–21.
Koivu-Tikkanen TJ, Ollilainen V and Piironen VI, 2000. Determination of phylloquinone and menaquinones in animalproducts with fluorescence detection after postcolumn reduction with metallic zinc. Journal of Agricultural andFood Chemistry, 48, 6325–6331.
Kojima T, Asoh M, Yamawaki N, Kanno T, Hasegawa H and Yonekubo A, 2004. Vitamin K concentrations in thematernal milk of Japanese women. Acta Paediatrica, 93, 457–463.
Kurilich AC, Britz SJ, Clevidence BA and Novotny JA, 2003. Isotopic labeling and LC-APCI-MS quantification forinvestigating absorption of carotenoids and phylloquinone from kale (Brassica oleracea). Journal of Agriculturaland Food Chemistry, 51, 4877–4883.
Lamon-Fava S, Sadowski JA, Davidson KW, O’Brien ME, McNamara JR and Schaefer EJ, 1998. Plasma lipoproteinsas carriers of phylloquinone (vitamin K1) in humans. American Journal of Clinical Nutrition, 67, 1226–1231.
Landes N, Pfluger P, Kluth D, Birringer M, Ruhl R, Bol GF, Glatt H and Brigelius-Flohe R, 2003. Vitamin E activatesgene expression via the pregnane X receptor. Biochemical Pharmacology, 65, 269–273.
Lemke G, 2013. Biology of the TAM receptors. Cold Spring Harbor Perspectives in Biology, 5, a009076.Li J, Lin JC, Wang H, Peterson JW, Furie BC, Furie B, Booth SL, Volpe JJ and Rosenberg PA, 2003. Novel role of
vitamin k in preventing oxidative injury to developing oligodendrocytes and neurons. Journal of Neuroscience,23, 5816–5826.
Li T, Lange LA, Li X, Susswein L, Bryant B, Malone R, Lange EM, Huang TY, Stafford DW and Evans JP, 2006.Polymorphisms in the VKORC1 gene are strongly associated with warfarin dosage requirements in patientsreceiving anticoagulation. Journal of Medical Genetics, 43, 740–744.
Liska DJ and Suttie JW, 1988. Location of gamma-carboxyglutamyl residues in partially carboxylated prothrombinpreparations. Biochemistry, 27, 8636–8641.
Litwack G, 2008. Vitamin K. Vitamins and hormones. Academic Press, Elsevier, New York, NY, USA. 300 pp.Liu G and Peacock M, 1998. Age-related changes in serum undercarboxylated osteocalcin and its relationships with
bone density, bone quality, and hip fracture. Calcified Tissue International, 62, 286–289.Liu YP, Gu YM, Thijs L, Knapen MH, Salvi E, Citterio L, Petit T, Carpini SD, Zhang Z, Jacobs L, Jin Y, Barlassina C,
Manunta P, Kuznetsova T, Verhamme P, Struijker-Boudier HA, Cusi D, Vermeer C and Staessen JA, 2015.Inactive matrix Gla protein is causally related to adverse health outcomes: a Mendelian randomization study ina Flemish population. Hypertension, 65, 463–470.
Losito R, Owen Jr CA and Flock EV, 1967. Metabolism of [14C]menadione. Biochemistry, 6, 62–68.Lukacs JL, Booth S, Kleerekoper M, Ansbacher R, Rock CL and Reame NE, 2006. Differential associations for
menopause and age in measures of vitamin K, osteocalcin, and bone density: a cross-sectional exploratorystudy in healthy volunteers. Menopause, 13, 799–808.
Macdonald HM, McGuigan FE, Lanham-New SA, Fraser WD, Ralston SH and Reid DM, 2008. Vitamin K1 intake isassociated with higher bone mineral density and reduced bone resorption in early postmenopausal Scottishwomen: no evidence of gene-nutrient interaction with apolipoprotein E polymorphisms. American Journal ofClinical Nutrition, 87, 1513–1520.
Mandelbrot L, Guillaumont M, Leclercq M, Lefrere JJ, Gozin D, Daffos F and Forestier F, 1988. Placental transfer ofvitamin K1 and its implications in fetal hemostasis. Thrombosis and Haemostasis, 60, 39–43.
Manoury E, Jourdon K, Boyaval P and Fourcassie P, 2013. Quantitative measurement of vitamin K2(menaquinones) in various fermented dairy products using a reliable high-performance liquid chromatographymethod. Journal of Dairy Science, 96, 1335–1346.
Manzotti P, De Nisi P and Zocchi G, 2008. Vitamin K in plants. Functional Plant Science and Biotechnology, 2, 29–35.Mariani G, Herrmann FH, Schulman S, Batorova A, Wulff K, Etro D, Dolce A, Auerswald G, Astermark J, Schved JF,
Ingerslev J and Bernardi F and International Factor VIIDSG, 2003. Thrombosis in inherited factor VIIdeficiency. Journal of Thrombosis and Haemostasis, 1, 2153–2158.
Matsuzaka T, Yoshinaga M and Tsuji Y, 1987. Prophylaxis of intracranial hemorrhage due to vitamin K deficiency ininfants. Brain and Development, 9, 305–308.
Mayer Jr O, Seidlerova J, Wohlfahrt P, Filipovsky J, Vanek J, Cifkova R, Windrichova J, Topolcan O, Knapen MH,Drummen NE and Vermeer C, 2016. Desphospho-uncarboxylated matrix Gla protein is associated withincreased aortic stiffness in a general population. Journal of Human Hypertension, 30, 418–423.
McBurney A, Shearer MJ and Barkhan P, 1980. Preparative isolation and characterization of the urinary aglyconesof vitamin K1 (phylloquinone) in man. Biochemical Medicine, 24, 250–267.
McCann JC and Ames BN, 2009. Vitamin K, an example of triage theory: is micronutrient inadequacy linked todiseases of aging? American Journal of Clinical Nutrition, 90, 889–907.
McDonald MG, Rieder MJ, Nakano M, Hsia CK and Rettie AE, 2009. CYP4F2 is a vitamin K1 oxidase: an explanationfor altered warfarin dose in carriers of the V433M variant. Molecular Pharmacology, 75, 1337–1346.
McDowell MA, Fryar CD, Hirsch R and Ogden CL, 2005. Anthropometric reference data for children and adults:U.S. population, 1999–2002. Advance Data, 1–5.
Dietary reference values for vitamin K
www.efsa.europa.eu/efsajournal 53 EFSA Journal 2017;15(5):4780
McKeown NM, Jacques PF, Gundberg CM, Peterson JW, Tucker KL, Kiel DP, Wilson PW and Booth SL, 2002. Dietaryand nondietary determinants of vitamin K biochemical measures in men and women. Journal of Nutrition, 132,1329–1334.
McNinch AW and Tripp JH, 1991. Haemorrhagic disease of the newborn in the British Isles: two year prospectivestudy. BMJ (Clinical Research Edition), 303, 1105–1109.
Mensink GB, Heseker H, Richter A, Stahl A and Vohmann C (Robert Koch-Institut & Universit€at Paderborn), 2007.Ern€ahrungsstudie als KIGGS-Modul (EsKiMo). 143 pp.
Mihatsch WA, Braegger C, Bronsky J, Campoy C, Domell€of M, Fewtrell M, Mis NF, Hojsak I, Hulst J, Indrio F,Lapillonne A, Mlgaard C, Embleton N, van Goudoever J, ESPGHAN Committee on Nutrition, 2016. Prevention ofvitamin K deficiency bleeding in newborn infants: a position paper by the ESPGHAN Committee on Nutrition.Journal of Pediatric Gastroenterology and Nutrition, 63, 123–129.
Moller A, 1989. Food composition tables. Publication No. SC3. The Danish National Food Agency, Copenhagen.Montes R, Ruiz de Gaona E, Martinez-Gonzalez MA, Alberca I and Hermida J, 2006. The c.-1639G > A
polymorphism of the VKORC1 gene is a major determinant of the response to acenocoumarol in anticoagulatedpatients. British Journal of Haematology, 133, 183–187.
Morales WJ, Angel JL, O’Brien WF, Knuppel RA and Marsalisi F, 1988. The use of antenatal vitamin K in theprevention of early neonatal intraventricular hemorrhage. American Journal of Obstetrics and Gynecology, 159,774–779.
Motohara K, Endo F and Matsuda I, 1985. Effect of vitamin K administration on acarboxy prothrombin (PIVKA-II)levels in newborns. Lancet, 2, 242–244.
Motohara K, Takagi S, Endo F, Kiyota Y and Matsuda I, 1990. Oral supplementation of vitamin K for pregnantwomen and effects on levels of plasma vitamin K and PIVKA-II in the neonate. Journal of PediatricGastroenterology and Nutrition, 11, 32–36.
Nakagawa K, Hirota Y, Sawada N, Yuge N, Watanabe M, Uchino Y, Okuda N, Shimomura Y, Suhara Y and Okano T,2010. Identification of UBIAD1 as a novel human menaquinone-4 biosynthetic enzyme. Nature, 468, 117–121.
Nakamura E, Aoki M, Watanabe F and Kamimura A, 2014. Low-dose menaquinone-4 improves gamma-carboxylation of osteocalcin in young males: a non-placebo-controlled dose-response study. Nutrition Journal,13, 85.
National Institute for Health and Welfare, 2009. Fineli. Finnish food composition database. Release 9. Helsinki.Nutrition Unit. Available online: http://www.fineli.fi/index.php
NRC (National Research Council), 1989. Recommended Dietary Allowances: 10th Edition. Subcommittee on theTenth Edition of the RDAs Food and Nutrition Board Commission on Life Sciences National Research Council.National Academy Press, Washington, DC, USA, 302 pp.
NCM (Nordic Council of Ministers), 2014. Nordic Nutrition Recommendations 2012. Integrating nutrition andphysical activity, Copenhagen, Denmark. 627 pp.
Neogi T, Booth SL, Zhang YQ, Jacques PF, Terkeltaub R, Aliabadi P and Felson DT, 2006. Low vitamin K status isassociated with osteoarthritis in the hand and knee. Arthritis and Rheumatism, 54, 1255–1261.
Netherlands Food and Nutrition Council, 1992. Recommended Dietary Allowances 1989 in the Netherlands. 115 pp.Newman P, Bonello F, Wierzbicki AS, Lumb P, Savidge GF and Shearer MJ, 2002. The uptake of lipoprotein-borne
phylloquinone (vitamin K1) by osteoblasts and osteoblast-like cells: role of heparan sulfate proteoglycans andapolipoprotein E. Journal of Bone and Mineral Research, 17, 426–433.
NHANES III, 1988–1994. Vitamin and mineral supplements data file documentation. Third National Health andNutrition Examination Survey, 87 pp.
Niemeier A, Kassem M, Toedter K, Wendt D, Ruether W, Beisiegel U and Heeren J, 2005. Expression of LRP1 byhuman osteoblasts: a mechanism for the delivery of lipoproteins and vitamin K1 to bone. Journal of Bone andMineral Research, 20, 283–293.
Nimptsch K, Rohrmann S and Linseisen J, 2008. Dietary intake of vitamin K and risk of prostate cancer in theHeidelberg cohort of the European Prospective Investigation into Cancer and Nutrition (EPIC-Heidelberg).American Journal of Clinical Nutrition, 87, 985–992.
Nimptsch K, Rohrmann S, Kaaks R and Linseisen J, 2010. Dietary vitamin K intake in relation to cancer incidenceand mortality: results from the Heidelberg cohort of the European Prospective Investigation into Cancer andNutrition (EPIC-Heidelberg). American Journal of Clinical Nutrition, 91, 1348–1358.
Novotny JA, Kurilich AC, Britz SJ, Baer DJ and Clevidence BA, 2010. Vitamin K absorption and kinetics in humansubjects after consumption of 13C-labelled phylloquinone from kale. British Journal of Nutrition, 104, 858–862.
Obayashi K, Nakamura K, Kawana J, Ogata H, Hanada K, Kurabayashi M, Hasegawa A, Yamamoto K and HoriuchiR, 2006. VKORC1 gene variations are the major contributors of variation in warfarin dose in Japanese patients.Clinical Pharmacology and Therapeutics, 80, 169–178.
Ohsaki Y, Shirakawa H, Hiwatashi K, Furukawa Y, Mizutani T and Komai M, 2006. Vitamin K suppresseslipopolysaccharide-induced inflammation in the rat. Bioscience, Biotechnology, and Biochemistry, 70, 926–932.
Oldenburg J, von Brederlow B, Fregin A, Rost S, Wolz W, Eberl W, Eber S, Lenz E, Schwaab R, Brackmann HH,Effenberger W, Harbrecht U, Schurgers LJ, Vermeer C and Muller CR, 2000. Congenital deficiency of vitamin Kdependent coagulation factors in two families presents as a genetic defect of the vitamin K-epoxide-reductase-complex. Thrombosis and Haemostasis, 84, 937–941.
Dietary reference values for vitamin K
www.efsa.europa.eu/efsajournal 54 EFSA Journal 2017;15(5):4780
Oldenburg J, Marinova M, Muller-Reible C and Watzka M, 2008. The vitamin K cycle. Vitamins and Hormones, 78,35–62.
Olson RE, 1994. Vitamin K. In: Shils ME, Olson JA, Shilke M (eds.). Modern Nutrition in Health and Disease. Vol. I.Lea & Febiger, Malvern, PA, USA. pp. 342–347.
Olson RE, Chao J, Graham D, Bates MW and Lewis JH, 2002. Total body phylloquinone and its turnover in humansubjects at two levels of vitamin K intake. British Journal of Nutrition, 87, 543–553.
Ortega RM, Requejo AM, Navia B and L�opez-Sobaler AM, 2010. Tablas de composici�on de alimentos por raci�onmedia y tama~no de raciones medias. In: Ortega RM, L�opez-Sobaler AM, Requejo AM, Andr�es P (eds.). Lacomposici�on de los alimentos. Herramienta b�asica para la valoraci�on nutricional. Complutense, Madrid, Spain.pp. 50–81.
Ortega Anta RM, Gonz�alez-Rodr�ıguez LG, Navia Lomb�an B and L�opez-Sobaler AM, 2014. [Vitamin K adequacy in arepresentative sample of Spanish adults. Dietary determinants]. Nutrici�on Hospitalaria, 29, 187–195.
Owen RP, Gong L, Sagreiya H, Klein TE and Altman RB, 2010. VKORC1 pharmacogenomics summary.Pharmacogenetics and Genomics, 20, 642–644.
Paiva SA, Sepe TE, Booth SL, Camilo ME, O’Brien ME, Davidson KW, Sadowski JA and Russell RM, 1998.Interaction between vitamin K nutriture and bacterial overgrowth in hypochlorhydria induced by omeprazole.American Journal of Clinical Nutrition, 68, 699–704.
Paul AA, Black AE, Evans J, Cole TJ and Whitehead RG, 1988. Breastmilk intake and growth from two to tenmonths. Journal of Human Nutrition and Dietetics, 1, 437–450.
Peterson JW, Muzzey KL, Haytowitz D, Exler J, Lemar L and Booth SL, 2002. Phylloquinone (vitamin K1) anddihydrophylloquinone content of fats and oils. Journal of the American Oil Chemists Society, 79, 641–646.
Pietersma-de Bruyn AL and van Haard PM, 1985. Vitamin K1 in the newborn. Clinica Chimica Acta, 150, 95–101.Pietschnig B, Haschke F, Vanura H, Shearer M, Veitl V, Kellner S and Schuster E, 1993. Vitamin K in breast milk: no
influence of maternal dietary intake. European Journal of Clinical Nutrition, 47, 209–215.Piironen V, Koivu T, Tammisalo O and Mattila P, 1997. Determination of phylloquinone in oils, margarines and butter
by high-performance liquid chromatography with electrochemical detection. Food Chemistry, 59, 473–480.Pivin E, Ponte B, Pruijm M, Ackermann D, Guessous I, Ehret G, Liu YP, Drummen NE, Knapen MH, Pechere-
Bertschi A, Paccaud F, Mohaupt M, Vermeer C, Staessen JA, Vogt B, Martin PY, Burnier M and Bochud M, 2015.Inactive matrix Gla-protein is associated with arterial stiffness in an adult population-based study.Hypertension, 66, 85–92.
Proudfoot D and Shanahan CM, 2006. Molecular mechanisms mediating vascular calcification: role of matrix Glaprotein. Nephrology (Carlton), 11, 455–461.
Prynne CJ, Paul AA, Mishra GD, Greenberg DC and Wadsworth ME, 2005. Changes in intake of key nutrients over17 years during adult life of a British birth cohort. British Journal of Nutrition, 94, 368–376.
Reddi K, Henderson B, Meghji S, Wilson M, Poole S, Hopper C, Harris M and Hodges SJ, 1995. Interleukin 6production by lipopolysaccharide-stimulated human fibroblasts is potently inhibited by naphthoquinone (vitaminK) compounds. Cytokine, 7, 287–290.
Rejnmark L, Vestergaard P, Charles P, Hermann AP, Brot C, Eiken P and Mosekilde L, 2006. No effect of vitamin K1intake on bone mineral density and fracture risk in perimenopausal women. Osteoporosis International, 17,1122–1132.
Rennenberg RJ, van Varik BJ, Schurgers LJ, Hamulyak K, Ten Cate H, Leiner T, Vermeer C, de Leeuw PW andKroon AA, 2010. Chronic coumarin treatment is associated with increased extracoronary arterial calcification inhumans. Blood, 115, 5121–5123.
Rettie AE and Tai G, 2006. The pharmocogenomics of warfarin: closing in on personalized medicine. MolecularInterventions, 6, 223–227.
Reumann S, 2013. Biosynthesis of vitamin K1 (phylloquinone) by plant peroxisomes and its integration intosignaling molecule synthesis pathways. Sub-Cellular Biochemistry, 69, 213–229.
Rietz P, Gloor U and Wiss O, 1970. Menaquinones from human liver and sludge. Internationale Zeitschrift f€urVitaminforschung, 40, 351–362.
Roe MA, Bell S, Oseredczuk M, Christensen T, Westenbrink S, Pakkala H, Presser K and Finglas PM, 2013. Updatedfood composition database for nutrient intake. Project developed on the procurement project CFT/EFSA/DCM/2011/03. EFSA Supporting publication 2013:EN-355, 21 pp.
Ronden JE, Drittij-Reijnders MJ, Vermeer C and Thijssen HH, 1998. Intestinal flora is not an intermediate in thephylloquinone-menaquinone-4 conversion in the rat. Biochimica et Biophysica Acta, 1379, 69–75.
Ronn SH, Harslof T, Pedersen SB and Langdahl BL, 2016. Vitamin K2 (menaquinone-7) prevents age-relateddeterioration of trabecular bone microarchitecture at the tibia in postmenopausal women. European Journal ofEndocrinology, 175, 541–549.
Sadowski JA, Hood SJ, Dallal GE and Garry PJ, 1989. Phylloquinone in plasma from elderly and young adults:factors influencing its concentration. American Journal of Clinical Nutrition, 50, 100–108.
Sato T, Schurgers LJ and Uenishi K, 2012. Comparison of menaquinone-4 and menaquinone-7 bioavailability inhealthy women. Nutrition Journal, 11, 93.
Dietary reference values for vitamin K
www.efsa.europa.eu/efsajournal 55 EFSA Journal 2017;15(5):4780

SCF (Scientific Committee on Food), , 1993. Nutrient and energy intakes for the European Community. Reports ofthe Scientific Committee for Food, 31st Series. Food - Science and Technique, European Commission,Luxembourg. 248 pp.
SCF (Scientific Committee on Food), 2003a. Opinion of the Scientific Committee on Food on the Tolerable UpperIntake Levels of vitamin E. SCF/CS/NUT/UPPLEV/39 Final, 20 pp.
SCF (Scientific Committee on Food), 2003b. Opinion of the Scientific Committee on Food on the Tolerable UpperIntake Level of Vitamin K. SCF/CS/NUT/UPPLEV/32 Final, 12 pp.
SCF (Scientific Committee on Food), 2003c. Report of the Scientific Committee on Food on the revision of essentialrequirements of infant formulae and follow-on formulae. SCF/CS/NUT/IF/65 Final, 211 pp.
Schaafsma A, Muskiet FA, Storm H, Hofstede GJ, Pakan I and Van der Veer E, 2000. Vitamin D(3) and vitamin K(1) supplementation of Dutch postmenopausal women with normal and low bone mineral densities: effects onserum 25-hydroxyvitamin D and carboxylated osteocalcin. European Journal of Clinical Nutrition, 54, 626–631.
Schmolz L, Birringer M, Lorkowski S and Wallert M, 2016. Complexity of vitamin E metabolism. World Journal ofBiological Chemistry, 7, 14–43.
Schreiner C, Suter S, Watzka M, Hertfelder HJ, Schreiner F, Oldenburg J, Bartmann P and Heep A, 2014. Geneticvariants of the vitamin K dependent coagulation system and intraventricular hemorrhage in preterm infants.BMC Pediatrics, 14, 219.
Schubiger G, Tonz O, Gruter J and Shearer MJ, 1993. Vitamin K1 concentration in breast-fed neonates after oral orintramuscular administration of a single dose of a new mixed-micellar preparation of phylloquinone. Journal ofPediatric Gastroenterology and Nutrition, 16, 435–439.
Schubiger G, Gruter J and Shearer MJ, 1997. Plasma vitamin K1 and PIVKA-II after oral administration of mixed-micellar or cremophor EL-solubilized preparations of vitamin K1 to normal breast-fed newborns. Journal ofPediatric Gastroenterology and Nutrition, 24, 280–284.
Schurgers LJ, Geleijnse JM, Grobbee DE, Pols HAP, Hofman A, Witteman JCM and Vermeer C, 1999. Nutritionalintake of vitamins K1 (phylloquinone) and K2 (menaquinone) in The Netherlands. Journal of Nutritional andEnvironmental Medicine, 9, 115–122.
Schurgers LJ and Vermeer C, 2000. Determination of phylloquinone and menaquinones in food. Effect of foodmatrix on circulating vitamin K concentrations. Haemostasis, 30, 298–307.
Schurgers LJ and Vermeer C, 2002. Differential lipoprotein transport pathways of K-vitamins in healthy subjects.Biochimica et Biophysica Acta, 1570, 27–32.
Schurgers LJ, Teunissen KJ, Hamulyak K, Knapen MH, Vik H and Vermeer C, 2007. Vitamin K-containing dietarysupplements: comparison of synthetic vitamin K1 and natto-derived menaquinone-7. Blood, 109, 3279–3283.
Schurgers LJ, Barreto DV, Barreto FC, Liabeuf S, Renard C, Magdeleyns EJ, Vermeer C, Choukroun G and Massy ZA,2010. The circulating inactive form of matrix gla protein is a surrogate marker for vascular calcification in chronickidney disease: a preliminary report. Clinical Journal of the American Society of Nephrology, 5, 568–575.
Shea MK, Benjamin EJ, Dupuis J, Massaro JM, Jacques PF, D’Agostino RB Sr, Ordovas JM, O’Donnell CJ, Dawson-Hughes B, Vasan RS and Booth SL, 2009. Genetic and non-genetic correlates of vitamins K and D. EuropeanJournal of Clinical Nutrition, 63, 458–464.
Shea MK, O’Donnell CJ, Vermeer C, Magdeleyns EJ, Crosier MD, Gundberg CM, Ordovas JM, Kritchevsky SB andBooth SL, 2011. Circulating uncarboxylated matrix gla protein is associated with vitamin K nutritional status,but not coronary artery calcium, in older adults. Journal of Nutrition, 141, 1529–1534.
Shea MK and Booth SL, 2016. Concepts and controversies in evaluating vitamin K status in population-basedstudies. Nutrients, 8, 8.
Shearer MJ and Barkhan P, 1973. Studies on the metabolites of phylloquinone (vitamin K1) in the urine of man.Biochimica et Biophysica Acta, 297, 300–312.
Shearer MJ, 1992. Vitamin K metabolism and nutriture. Blood Reviews, 6, 92–104.Shearer MJ, 1995. Vitamin K. Lancet, 345, 229–234.Shearer MJ, Rahim S, Barkhan P and Stimmler L, 1982. Plasma vitamin K1 in mothers and their newborn babies.
Lancet, 2, 460–463.Shearer MJ, McCathy PT, Crampton OE and Mattock MB, 1988. The assessment of human vitamin K status from
tissue measurements. In: Suttie JW (ed.). Current advances in vitamin K research. New York, NY, USA. pp.437–452.
Shearer MJ and Newman P, 2014. Recent trends in the metabolism and cell biology of vitamin K with specialreference to vitamin K cycling and MK-4 biosynthesis. Journal of Lipid Research, 55, 345–362.
Shearer MJ, Barkhan P and Webster GR, 1970a. Absorption and excretion of an oral dose of tritiated vitamin K1 inman. British Journal of Haematology, 18, 297–308.
Shearer MJ, Mallinson CN, Webster GR and Barkhan P, 1970b. Absorption of tritiated vitamin K1 in patients withfat malabsorption. Gut, 11, 1063–1064.
Shearer MJ, Mallinson CN, Webster GR and Barkhan P, 1972. Clearance from plasma and excretion in urine, faecesand bile of an intravenous dose of tritiated vitamin K 1 in man. British Journal of Haematology, 22, 579–588.
Shearer MJ, McBurney A and Barkhan P, 1974. Studies on the absorption and metabolism of phylloquinone(vitamin K1) in man. Vitamins and Hormones, 32, 513–542.
Dietary reference values for vitamin K
www.efsa.europa.eu/efsajournal 56 EFSA Journal 2017;15(5):4780
Shearer MJ, Allan V, Haroon Y and Barkhan P, 1980. Nutritional aspects of vitamin K in the human. In: Suttie JW(ed.). Vitamin K metabolism and vitamin K-dependent protein. University Park Press, Baltimore, MD, USA. pp.317–327.
Shearer MJ, Bach A and Kohlmeier M, 1996. Chemistry, nutritional sources, tissue distribution and metabolism ofvitamin K with special reference to bone health. Journal of Nutrition, 126, 1181S–1186S.
Shearer MJ, 2009. Vitamin K deficiency bleeding (VKDB) in early infancy. Blood Reviews, 23, 49–59.Shearer MJ, Fu X and Booth SL, 2012. Vitamin K nutrition, metabolism, and requirements: current concepts and
future research. Advances in Nutrition, 3, 182–195.Shikata E, Ieiri I, Ishiguro S, Aono H, Inoue K, Koide T, Ohgi S and Otsubo K, 2004. Association of
pharmacokinetic (CYP2C9) and pharmacodynamic (factors II, VII, IX, and X; proteins S and C; and gamma-glutamyl carboxylase) gene variants with warfarin sensitivity. Blood, 103, 2630–2635.
Shiozawa Y, Pedersen EA, Patel LR, Ziegler AM, Havens AM, Jung Y, Wang J, Zalucha S, Loberg RD, Pienta KJ andTaichman RS, 2010. GAS6/AXL axis regulates prostate cancer invasion, proliferation, and survival in the bonemarrow niche. Neoplasia, 12, 116–127.
Sokoll LJ, Booth SL, O’Brien ME, Davidson KW, Tsaioun KI and Sadowski JA, 1997. Changes in serum osteocalcin,plasma phylloquinone, and urinary gamma-carboxyglutamic acid in response to altered intakes of dietaryphylloquinone in human subjects. American Journal of Clinical Nutrition, 65, 779–784.
Stafford DW, 2005. The vitamin K cycle. Journal of Thrombosis and Haemostasis, 3, 1873–1878.Strehle EM, Howey C and Jones R, 2010. Evaluation of the acceptability of a new oral vitamin K prophylaxis for
breastfed infants. Acta Paediatrica, 99, 379–383.Sutor AH, von Kries R, Cornelissen EA, McNinch AW and Andrew M, 1999. Vitamin K deficiency bleeding (VKDB) in
infancy. ISTH Pediatric/Perinatal Subcommittee. International Society on Thrombosis and Haemostasis.Thrombosis and Haemostasis, 81, 456–461.
Suttie JW, 1985. Vitamin K. In: Diplock AT (ed.). Fat-Soluble Vitamins: Their Biochemistry and Applications.Heinemann, London, UK. pp. 225–311.
Suttie JW, 1987. Recent advances in hepatic vitamin K metabolism and function. Hepatology, 7, 367–376.Suttie JW, Mummah-Schendel LL, Shah DV, Lyle BJ and Greger JL, 1988. Vitamin K deficiency from dietary vitamin
K restriction in humans. American Journal of Clinical Nutrition, 47, 475–480.Suttie JW, 1992. Vitamin K and human nutrition. Journal of the American Dietetic Association, 92, 585–590.Suttie JW, 1996. Vitamin K. In: Ziegler EE and Filer LJ (eds.). Present Knowledge of Nutrition. ILSI Press,
Washington DC, USA. pp. 137–145.Szulc P, Chapuy MC, Meunier PJ and Delmas PD, 1993. Serum undercarboxylated osteocalcin is a marker of the
risk of hip fracture in elderly women. Journal of Clinical Investigation, 91, 1769–1774.Szulc P, Arlot M, Chapuy MC, Duboeuf F, Meunier PJ and Delmas PD, 1994. Serum undercarboxylated osteocalcin
correlates with hip bone mineral density in elderly women. Journal of Bone and Mineral Research, 9, 1591–1595.Szulc P, Chapuy MC, Meunier PJ and Delmas PD, 1996. Serum undercarboxylated osteocalcin is a marker of the
risk of hip fracture: a three year follow-up study. Bone, 18, 487–488.Tamatani M, Morimoto S, Nakajima M, Fukuo K, Onishi T, Kitano S, Niinobu T and Ogihara T, 1998. Decreased
circulating levels of vitamin K and 25-hydroxyvitamin D in osteopenic elderly men. Metabolism: Clinical andExperimental, 47, 195–199.
Thane CW, Bolton-Smith C and Coward WA, 2006a. Comparative dietary intake and sources of phylloquinone(vitamin K1) among British adults in 1986-7 and 2000-1. British Journal of Nutrition, 96, 1105–1115.
Thane CW, Wang LY and Coward WA, 2006b. Plasma phylloquinone (vitamin K1) concentration and its relationshipto intake in British adults aged 19–64 years. British Journal of Nutrition, 96, 1116–1124.
Thijssen HH and Drittij-Reijnders MJ, 1994. Vitamin K distribution in rat tissues: dietary phylloquinone is a sourceof tissue menaquinone-4. British Journal of Nutrition, 72, 415–425.
Thijssen HH and Drittij-Reijnders MJ, 1996. Vitamin K status in human tissues: tissue-specific accumulation ofphylloquinone and menaquinone-4. British Journal of Nutrition, 75, 121–127.
Thijssen HH, Drittij MJ, Vermeer C and Schoffelen E, 2002. Menaquinone-4 in breast milk is derived from dietaryphylloquinone. British Journal of Nutrition, 87, 219–226.
Thijssen HH, Vervoort LM, Schurgers LJ and Shearer MJ, 2006. Menadione is a metabolite of oral vitamin K. BritishJournal of Nutrition, 95, 260–266.
Thompson RM, Gerber N, Seibert RA and Desiderio DM, 1972. Identification of 2-methyl-1,4-naphthohydroguinonemonoglucuronide as a metabolite of 2-methyl-1,4-naphthoquinone (menadione) in rat bile. ResearchCommunications in Chemical Pathology and Pharmacology, 4, 543–552.
Tie JK, Nicchitta C, von Heijne G and Stafford DW, 2005. Membrane topology mapping of vitamin K epoxidereductase by in vitro translation/cotranslocation. Journal of Biological Chemistry, 280, 16410–16416.
Tie JK and Stafford DW, 2008. Structure and function of vitamin K epoxide reductase. Vitamins and Hormones, 78,103–130.
Traber MG, 2008. Vitamin E and K interactions–a 50-year-old problem. Nutrition Reviews, 66, 624–629.Tsugawa N, Shiraki M, Suhara Y, Kamao M, Tanaka K and Okano T, 2006. Vitamin K status of healthy Japanese
women: age-related vitamin K requirement for gamma-carboxylation of osteocalcin. American Journal ofClinical Nutrition, 83, 380–386.
Dietary reference values for vitamin K
www.efsa.europa.eu/efsajournal 57 EFSA Journal 2017;15(5):4780
Udall JA, 1965. Human sources and absorption of vitamin K in relation to anticoagulation stability. Journal of theAmerican Medical Association, 194, 127–129.
Ueno T and Suttie JW, 1983. High-pressure liquid chromatographic-reductive electrochemical detection analysis ofserum trans-phylloquinone. Analytical Biochemistry, 133, 62–67.
USDA (US Department of Agriculture), 2007. USDA National Nutrient Database for Standard Reference, Release21. Agricultural Research Service. Available online: https://www.ars.usda.gov/northeast-area/beltsville-md/beltsville-human-nutrition-research-center/nutrient-data-laboratory/docs/sr21-home-page/
USDA (US Department of Agriculture), 2009. USDA National Nutrient Database for Standard Reference, Release22. Agricultural Research Service. Available online: https://www.ars.usda.gov/northeast-area/beltsville-md/beltsville-human-nutrition-research-center/nutrient-data-laboratory/docs/sr22-home-page/
USDA (US Department of Agriculture), 2015. USDA National Nutrient Database for Standard Reference, Release28. Agricultural Research Service. Available online: https://ndb.nal.usda.gov/ndb/
Usui Y, Tanimura H, Nishimura N, Kobayashi N, Okanoue T and Ozawa K, 1990. Vitamin K concentrations in theplasma and liver of surgical patients. American Journal of Clinical Nutrition, 51, 846–852.
van Buuren S, Sch€onbeck Y and van Dommelen P, 2012. Collection, collation and analysis of data in relation toreference heights and reference weights for female and male children and adolescents (0-18 years) in the EU,as well as in relation to the age of onset of puberty and the age at which different stages of puberty arereached in adolescents in the EU. Project developed on the procurement project CT/EFSA/NDA/2010/01. EFSASupporting publication 2012:EN-255, 59 pp.
van den Heuvel EG, van Schoor NM, Lips P, Magdeleyns EJ, Deeg DJ, Vermeer C and den Heijer M, 2014.Circulating uncarboxylated matrix Gla protein, a marker of vitamin K status, as a risk factor of cardiovasculardisease. Maturitas, 77, 137–141.
van Summeren MJ, Braam LA, Lilien MR, Schurgers LJ, Kuis W and Vermeer C, 2009. The effect of menaquinone-7(vitamin K2) supplementation on osteocalcin carboxylation in healthy prepubertal children. British Journal ofNutrition, 102, 1171–1178.
Van Winckel M, De Bruyne R, Van De Velde S and Van Biervliet S, 2009. Vitamin K, an update for thepaediatrician. European Journal of Pediatrics, 168, 127–134.
Vecsler M, Loebstein R, Almog S, Kurnik D, Goldman B, Halkin H and Gak E, 2006. Combined genetic profiles ofcomponents and regulators of the vitamin K-dependent gamma-carboxylation system affect individualsensitivity to warfarin. Thrombosis and Haemostasis, 95, 205–211.
Vergnaud P, Garnero P, Meunier PJ, Breart G, Kamihagi K and Delmas PD, 1997. Undercarboxylated osteocalcinmeasured with a specific immunoassay predicts hip fracture in elderly women: the EPIDOS Study. Journal ofClinical Endocrinology and Metabolism, 82, 719–724.
Vermeer C and Braam L, 2001. Role of K vitamins in the regulation of tissue calcification. Journal of Bone andMineral Metabolism, 19, 201–206.
Viegas CSB and Simes DC, 2016. Gla-rich protein (GRP): a new player in the burden of vascular calcification.Journal of Cardiovascular Diseases and Diagnosis, 4, 245.
Villines TC, Hatzigeorgiou C, Feuerstein IM, O’Malley PG and Taylor AJ, 2005. Vitamin K1 intake and coronarycalcification. Coronary Artery Disease, 16, 199–203.
Vissers LE, Dalmeijer GW, Boer JM, Monique Verschuren WM, van der Schouw YT and Beulens JW, 2013. Intake ofdietary phylloquinone and menaquinones and risk of stroke. Journal of American Heart Association, 2,e000455.
Vissers LE, Dalmeijer GW, Boer JM, Verschuren WM, van der Schouw YT and Beulens JW, 2016. The relationshipbetween vitamin K and peripheral arterial disease. Atherosclerosis, 252, 15–20.
von Kries R, Kreppel S, Becker A, Tangermann R and G€obel U, 1987a. Acarboxyprothrombin activity after oralprophylactic vitamin K. Archives of Disease in Childhood, 62, 938–940.
von Kries R, Shearer M, McCarthy PT, Haug M, Harzer G and Gobel U, 1987b. Vitamin K1 content of maternal milk:influence of the stage of lactation, lipid composition, and vitamin K1 supplements given to the mother. PediatricResearch, 22, 513–517.
von Kries R, Shearer MJ and Gobel U, 1988. Vitamin K in infancy. European Journal of Pediatrics, 147, 106–112.von Kries R, Shearer MJ, Widdershoven J, Motohara K, Umbach G and Gobel U, 1992. Des-gamma-
carboxyprothrombin (PIVKA II) and plasma vitamin K1 in newborns and their mothers. Thrombosis andHaemostasis, 68, 383–387.
Wadelius M, Chen LY, Downes K, Ghori J, Hunt S, Eriksson N, Wallerman O, Melhus H, Wadelius C, Bentley D andDeloukas P, 2005. Common VKORC1 and GGCX polymorphisms associated with warfarin dose.Pharmacogenomics Journal, 5, 262–270.
Walther B, Karl JP, Booth SL and Boyaval P, 2013. Menaquinones, bacteria, and the food supply: the relevance ofdairy and fermented food products to vitamin K requirements. Advances in Nutrition, 4, 463–473.
Wang Y, Zhang W, Zhang Y, Yang Y, Sun L, Hu S, Chen J, Zhang C, Zheng Y, Zhen Y, Sun K, Fu C, Yang T, Wang J,Sun J, Wu H, Glasgow WC and Hui R, 2006. VKORC1 haplotypes are associated with arterial vascular diseases(stroke, coronary heart disease, and aortic dissection). Circulation, 113, 1615–1621.
Dietary reference values for vitamin K
www.efsa.europa.eu/efsajournal 58 EFSA Journal 2017;15(5):4780

Weber KS, Raab J, Haupt F, Aschemeier B, Wosch A, Ried C, Kordonouri O, Ziegler AG and Winkler C, 2014.Evaluating the diet of children at increased risk for type 1 diabetes: first results from the TEENDIAB study.Public Health Nutrition, 18, 50–58.
Wei FF, Drummen NE, Schutte AE, Thijs L, Jacobs L, Petit T, Yang WY, Smith W, Zhang ZY, Gu YM, Kuznetsova T,Verhamme P, Allegaert K, Schutte R, Lerut E, Evenepoel P, Vermeer C and Staessen JA, 2016. Vitamin Kdependent protection of renal function in multi-ethnic population studies. EBioMedicine, 4, 162–169.
WHO Multicentre Growth Reference Study Group (World Health Organization), 2006. WHO Child GrowthStandards: Length/height-for-age, weight-for-age, weight-for-length, weight-for-height and body mass index-for-age: Methods and development. 312 pp.
WHO/FAO (World Health Organization/Food and Agriculture Organization of the United Nations), 2004. Vitaminand mineral requirements in human nutrition: report of a joint FAO/WHO expert consultation, Bangkok,Thailand, 21–30 September 1998. 341 pp.
Will BH, Usui Y and Suttie JW, 1992. Comparative metabolism and requirement of vitamin K in chicks and rats.Journal of Nutrition, 122, 2354–2360.
Wu S, Liu S, Davis CH, Stafford DW, Kulman JD and Pedersen LG, 2011. A hetero-dimer model for concertedaction of vitamin K carboxylase and vitamin K reductase in vitamin K cycle. Journal of Theoretical Biology, 279,143–149.
Yan L, Zhou B, Nigdikar S, Wang X, Bennett J and Prentice A, 2005. Effect of apolipoprotein E genotype onvitamin K status in healthy older adults from China and the UK. British Journal of Nutrition, 94, 956–961.
Zipursky A, 1999. Prevention of vitamin K deficiency bleeding in newborns. British Journal of Haematology, 104,430–437.
Zwakenberg SR, den Braver NR, Engelen AI, Feskens EJ, Vermeer C, Boer JM, Verschuren WM, van der SchouwYT and Beulens JW, 2016. Vitamin K intake and all-cause and cause specific mortality. Clinical Nutrition, Aug 30pii: S0261-5614(0216)30216-30213. 30210.31016/j.clnu.32016.30208.30017 [Epub ahead of print].
Abbreviations
1,25(OH)2D 1,25-hydroxyvitamin D25(OH)D 25-hydroxyvitamin D%ucOC percentage of undercarboxylated osteocalcinAfssa Agence franc�aise de s�ecurit�e sanitaire des alimentsAI adequate intakeApoE apolipoprotein EAPTT activated partial thromboplastin timeAR average requirementAU arbitrary unitAUC area under the curveBLS Bundeslebensmittelschl€usselBMC bone mineral contentBMD bone mineral densityBMI body mass indexBUA broadband ultrasound attenuationCAC coronary artery calcificationCHD coronary heart diseaseCI confidence intervalcOC carboxylated osteocalcinCOMA Committee on Medical Aspects of Food PolicyCYP4F2 cytochrome P450 4F2D-A-CH Deutschland-Austria-Confoederatio HelveticaDH UK Department of HealthDIPP Type 1 Diabetes Prediction and Prevention surveydK dihydrophylloquinoneDNFCS Dutch National Food Consumption SurveyDNSIYC Diet and Nutrition Survey of Infants and Young ChildrenDRV dietary reference valuesdp-ucMGP desphospho-uncarboxylated MGPDXA dual-emission X-ray absorptiometryEsKiMo Ern€ahrungsstudie als KIGGS-ModulESPGHAN European Society for Paediatric Gastroenterology, Hepatology and NutritionFAO Food and Agriculture Organization
Dietary reference values for vitamin K
www.efsa.europa.eu/efsajournal 59 EFSA Journal 2017;15(5):4780
FC_PREGNANTWOMEN Food consumption of pregnant women in LatviaFFQ food frequency questionnaireFINDIET National dietary survey of FinlandFN femoral neckFVII factor VIIGAS6 growth arrest-specific protein 6GC/MS gas chromatography/mass spectrometryGGCX c-glutamyl carboxylaseGla c-carboxyglutamic acidGlu glutamic acidHDL high-density lipoproteinsHPLC high performance liquid chromatographyHR hazard ratioHSPG heparan sulfate proteoglycansIDL intermediate-density lipoproteinINCA �Etude Individuelle Nationale des Consommations AlimentairesINRAN-SCAI Istituto Nazionale di Ricerca per gli Alimenti e la Nutrizione – Studio sui
Consumi Alimentari in ItaliaIOM US Institute of Medicine of the National Academy of SciencesIQR interquartile rangeIU international unitsLDL low-density lipoproteinsLS lumbar spineMGP matrix Gla-protein or matrix c-carboxyglutamic proteinMI myocardial infarctionMK menaquinoneMRI Max Rubner InstitutNANS National Adult Nutrition SurveyNDNS National Diet and Nutrition SurveyNHANES National Health and Nutrition Examination SurveyNNR Nordic Nutrition RecommendationsNWSSP Nutrition and Wellbeing of Secondary School PupilsOC osteocalcinOR odds ratioPAD peripheral arterial diseasePIVKA-II protein induced by vitamin K absence or antagonism-IIPRI population reference intakePT prothrombin timePTT partial thromboplastin timeQ quintileq quartileQUI quantitative ultrasound indexRCT randomised controlled trialRNI recommended nutrient intakeRR relative riskSCF Scientific Committee for FoodSD standard deviationS:E Simplastin:EcarinSEM standard error of the meanSNP single nucleotide polymorphismSOS speed of soundTAM receptors Tyro3, Axl and Mer receptorsTDS Total Diet StudyTG triglycerideTRL triglyceride-rich lipoproteinsUBIAD1 enzyme UbiA prenyltransferase domain-containing protein 1ucOC undercarboxylated osteocalcin
Dietary reference values for vitamin K
www.efsa.europa.eu/efsajournal 60 EFSA Journal 2017;15(5):4780
UL tolerable upper intake levelUSDA United States Department of AgricultureVELS Verzehrsstudie zur Ermittlung der Lebensmittelaufnahme von S€auglingen
und Kleinkindern f€ur die Absch€atzung eines akuten Toxizit€atsrisikos durchR€uckst€ande von Pflanzenschutzmitteln
VKDB vitamin K deficiency bleedingVKOR vitamin K epoxide reductaseVKORC1 vitamin K epoxide reductase complex subunit 1VLDL very low-density lipoproteinsWHO World Health Organization
Dietary reference values for vitamin K
www.efsa.europa.eu/efsajournal 61 EFSA Journal 2017;15(5):4780

Appen
dix
A–Conce
ntrationsofphylloquinonean
dmen
aquinones
inbre
astmilk
ofhea
lthymoth
ers
Refer
ence
Number
of
women
(number
of
samples)
Country
Mater
nal
dietary
intake
(mea
n�
SD)
Mater
nal
seru
m/
plasm
a(p
hylloquinone/
men
aquinone)
conce
ntration
yes/
n.a.
Stageof
lactation
Phylloquinone
conce
ntrationin
bre
astmilk
(lg/L
)(m
ean
�SD)
Men
aquinone
conce
ntrationin
bre
astmilk
(lg/L
)(m
ean
�SD)
Commen
ts
Haroo
net
al.
(198
2)
20(unsup
plem
ented)
1(sup
plem
ented)
UK
n.a.
20mg(one
dose)
n.a.
n.a.
n.a.
~6mon
ths
post-partum
2.1(1.1–6
.5)
140
n.a.
n.a.
Noinform
ationwas
give
nas
towhe
ther
infantswerefull-term
orno
t
Fournier
etal.
(198
7)
10FR
n.a.
n.a.
21da
yspo
st-
partum
9.18
(4.85–
12.76)
(med
ian(ran
ge))
n.a.
Full-term
infants
vonKries
etal.
(198
7b)
9(unsup
plem
ented)
1(sup
plem
ented)
DE
n.a.
100lg
(one
dose)
a. n.a.
8–36
days
post-
partum
1.2(m
edian)
4.9
n.a.
n.a.
Full-term
infants
Theau
thorsconsidered
tran
sitio
nal(da
ys8–
15)an
dmature(day
s22
–36)
milk
ason
egrou
p(day
s8–
36)as
there
wereno
sign
ificant
differen
ces
inph
ylloqu
inon
econc
entration
Brea
stmilk
phylloqu
inon
econc
entrationof
the
supp
lemen
tedwom
anat
baseline(before
supp
lemen
tatio
n)was
2.5lg
/LBrea
stmilk
phylloqu
inon
econc
entrationisgive
nforon
esupp
lemen
tedmothe
rforwho
mph
ylloqu
inon
ead
ministration
andmilk
samplingtech
niqu
eswerestan
dardised
Canfi
eld
etal.
(199
0)
7(16)
15
US
n.a.
n.a.
1mon
thpo
st-
partum
2.94
�1.94
(poo
led
samples)
3.15
�2.87
(mea
nof
individu
als)
n.a.
Infantsweregrow
ingwith
inno
rmal
limits
andfree
ofillne
ssNoex
plicitinform
ationwas
give
nas
towhe
ther
infants
werefull-term
orno
t
Dietary
reference
values
forvitamin
K
www.efsa.eu
ropa.eu
/efsajournal
62EFSA
Journal
2017;15(5):478
0
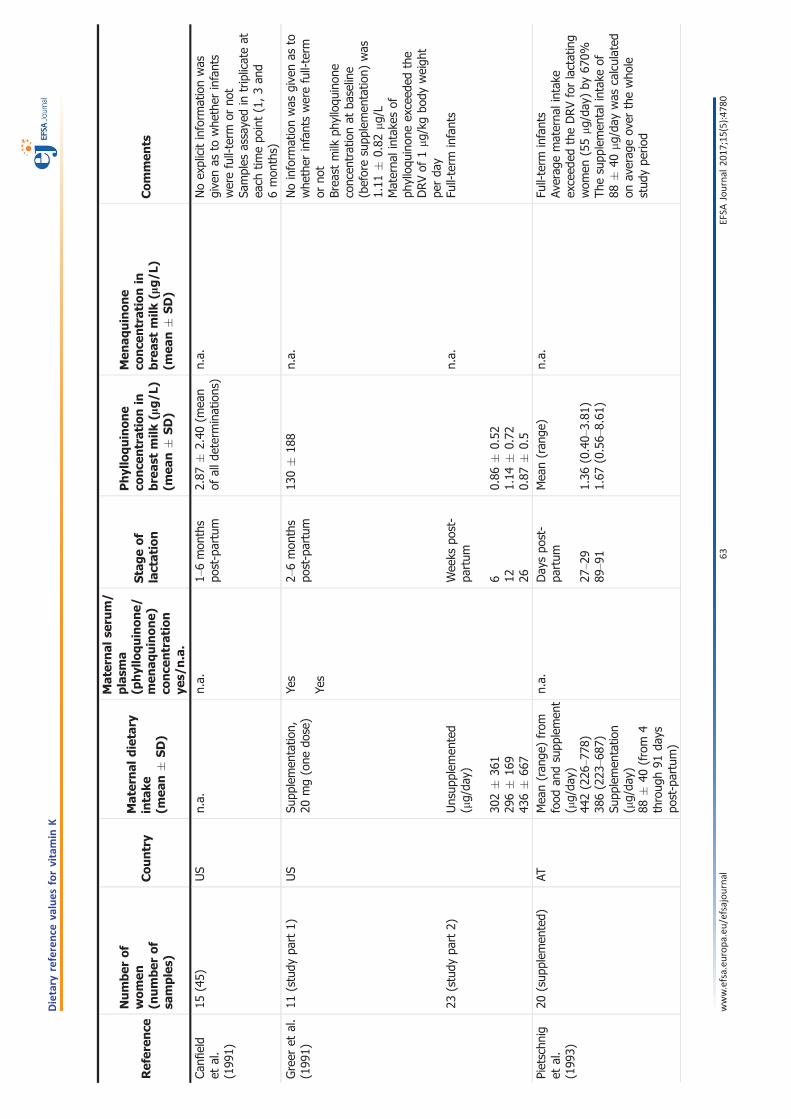
Refer
ence
Number
of
women
(number
of
samples)
Country
Mater
nal
dietary
intake
(mea
n�
SD)
Mater
nal
seru
m/
plasm
a(p
hylloquinone/
men
aquinone)
conce
ntration
yes/
n.a.
Stageof
lactation
Phylloquinone
conce
ntrationin
bre
astmilk
(lg/L
)(m
ean
�SD)
Men
aquinone
conce
ntrationin
bre
astmilk
(lg/L
)(m
ean
�SD)
Commen
ts
Canfi
eld
etal.
(199
1)
15(45)
US
n.a.
n.a.
1–6mon
ths
post-partum
2.87
�2.40
(mea
nof
alld
eterminations)
n.a.
Noex
plicitinform
ationwas
give
nas
towhe
ther
infants
werefull-term
orno
tSa
mples
assaye
din
triplicateat
each
timepo
int(1,3an
d6mon
ths)
Greer
etal.
(199
1)11
(study
part
1)
23(study
part
2)
US
Supp
lemen
tatio
n,20
mg(one
dose)
Unsup
plem
ented
(lg/da
y)
302�
361
296�
169
436�
667
Yes
Yes
2–6mon
ths
post-partum
Wee
kspo
st-
partum
6 12 26
130�
188
0.86
�0.52
1.14
�0.72
0.87
�0.5
n.a.
n.a.
Noinform
ationwas
give
nas
towhe
ther
infantswerefull-term
orno
tBrea
stmilk
phylloqu
inon
econc
entrationat
baseline
(beforesupp
lemen
tatio
n)was
1.11
�0.82
lg/L
Materna
lintak
esof
phylloqu
inon
eex
ceed
edthe
DRVof
1l g
/kgbo
dyweigh
tpe
rda
yFu
ll-term
infants
Pietschn
iget
al.
(199
3)
20(sup
plem
ented)
ATMea
n(ran
ge)from
food
andsupp
lemen
t(lg/da
y)44
2(226
–778
)38
6(223
–687
)Su
pplemen
tatio
n(lg/da
y)88
�40
(from
4throug
h91
days
post-partum)
n.a.
Day
spo
st-
partum
27–2
989
–91
Mea
n(ran
ge)
1.36
(0.40–
3.81
)1.67
(0.56–
8.61
)
n.a.
Full-term
infants
Averag
ematerna
lintak
eex
ceed
edtheDRVforlactating
wom
en(55lg/da
y)by
670%
Thesupp
lemen
talintak
eof
88�
40lg/da
ywas
calculated
onav
erag
eov
erthewho
lestud
ype
riod
www.efsa.eu
ropa.eu
/efsajournal
63EFSA
Journal
2017;15(5):478
0
Dietary
reference
values
forvitamin
K
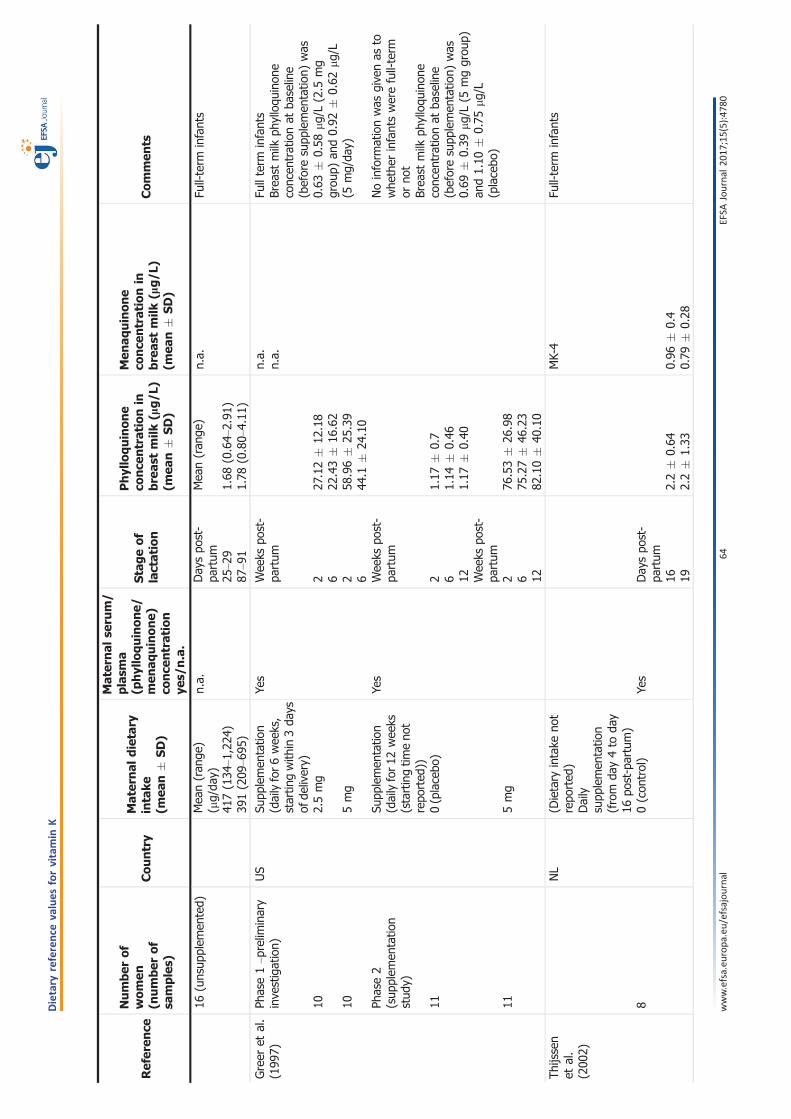
Refer
ence
Number
of
women
(number
of
samples)
Country
Mater
nal
dietary
intake
(mea
n�
SD)
Mater
nal
seru
m/
plasm
a(p
hylloquinone/
men
aquinone)
conce
ntration
yes/
n.a.
Stageof
lactation
Phylloquinone
conce
ntrationin
bre
astmilk
(lg/L
)(m
ean
�SD)
Men
aquinone
conce
ntrationin
bre
astmilk
(lg/L
)(m
ean
�SD)
Commen
ts
16(unsup
plem
ented)
Mea
n(ran
ge)
(lg/da
y)41
7(134
–1,224
)39
1(209
–695
)
n.a.
Day
spo
st-
partum
25–2
987
–91
Mea
n(ran
ge)
1.68
(0.64–
2.91
)1.78
(0.80–
4.11
)
n.a.
Full-term
infants
Greer
etal.
(199
7)Ph
ase1–p
relim
inary
inve
stigation)
10 10 Phase2
(sup
plem
entatio
nstud
y)
11 11
US
Supp
lemen
tatio
n(dailyfor6
wee
ks,
startin
gwith
in3da
ysof
delivery)
2.5mg
5mg
Supp
lemen
tatio
n(dailyfor1
2wee
ks(startingtim
eno
trepo
rted
))0(placebo
)
5mg
Yes
Yes
Wee
kspo
st-
partum
2 6 2 6 Wee
kspo
st-
partum
2 6 12 Wee
kspo
st-
partum
2 6 12
27.12�
12.18
22.43�
16.62
58.96�
25.39
44.1
�24
.10
1.17
�0.7
1.14
�0.46
1.17
�0.40
76.53�
26.98
75.27�
46.23
82.10�
40.10
n.a.
n.a.
Fullterm
infants
Brea
stmilk
phylloqu
inon
econc
entrationat
baseline
(beforesupp
lemen
tatio
n)was
0.63
�0.58
lg/L(2.5
mg
grou
p)an
d0.92
�0.62
lg/L
(5mg/da
y)
Noinform
ationwas
give
nas
towhe
ther
infantswerefull-term
orno
tBrea
stmilk
phylloqu
inon
econc
entrationat
baseline
(beforesupp
lemen
tatio
n)was
0.69
�0.39
lg/L(5
mggrou
p)an
d1.10
�0.75
lg/L
(placebo
)
Thijssen
etal.
(200
2)
8
NL
(Dietary
intake
not
repo
rted
)Daily
supp
lemen
tatio
n(from
day4to
day
16po
st-partum)
0(con
trol)
Yes
Day
spo
st-
partum
16 192.2�
0.64
2.2�
1.33
MK-4
0.96
�0.4
0.79
�0.28
Full-term
infants
www.efsa.eu
ropa.eu
/efsajournal
64EFSA
Journal
2017;15(5):478
0
Dietary
reference
values
forvitamin
K

Refer
ence
Number
of
women
(number
of
samples)
Country
Mater
nal
dietary
intake
(mea
n�
SD)
Mater
nal
seru
m/
plasm
a(p
hylloquinone/
men
aquinone)
conce
ntration
yes/
n.a.
Stageof
lactation
Phylloquinone
conce
ntrationin
bre
astmilk
(lg/L
)(m
ean
�SD)
Men
aquinone
conce
ntrationin
bre
astmilk
(lg/L
)(m
ean
�SD)
Commen
ts
8 8 7
0.8mg
2mg
4mg
Yes
Yes
Yes
Day
spo
st-
partum
16 19 Day
spo
st-
partum
16 19 Day
spo
st-
partum
16 19
11.05�
4.57
5.57
�5.64
27.33�
14.24
5.44
�2.09
62.93�
20.66
20.23�
17.95
1.55
�1.15
1.44
�1.14
2.46
�1.5
1.34
�0.6
7.33
�4.07
4.40
�2.30
Kojim
aet
al.
(200
4)
(416
)JP
n.a.
n.a.
Day
spo
st-
partum
21–8
990
–179
180–
365
1.95
�0.88
2.21
�4.29
1.55
�0.88
MK-4
1.85
�0.41
1.35
�0.35
1.28
�0.31
Noex
plicitinform
ationwas
give
nas
towhe
ther
infants
werefull-term
orno
tInfantswith
birthweigh
thigh
erthan
2.5kg
Kamao
etal.
(200
7a)
43 18 8 5
JPn.a.
n.a.
Day
spo
st-
partum
11–3
031
–90
91–1
8018
1–27
0
3.94
�2.45
3.53
�1.45
2.30
�1.22
3.41
�1.46
MK-4
1.80
�0.66
1.78
�0.55
1.19
�0.34
1.51
�0.42
MK-7
1.67
�2.73
0.80
�0.75
1.36
�1.29
0.92
�0.92
Noinform
ationon
thehe
alth
status
oftheinfantsor
ifthey
werebo
rnat
term
orno
t
AT:Au
stria
;DE:
German
y;DRV:
dietaryreferenc
eva
lue;
FR:Fran
ce;JP:Japa
n;MK:
men
aquino
ne;n.a.:no
tap
plicab
le;NL:
theNethe
rland
s;SD
:stan
dard
deviation;
UK:
UnitedKing
dom;US:
UnitedStates.
Molecular
masses:
phylloqu
inon
e:45
0.7g/mol;MK-4:
444.7g/mol;MK-7:
648.9g/mol.
www.efsa.eu
ropa.eu
/efsajournal
65EFSA
Journal
2017;15(5):478
0
Dietary
reference
values
forvitamin
K

Appen
dix
B–Dietary
survey
sin
theEFS
ACompre
hen
sive
Euro
pea
nFo
odConsu
mptionDatab
aseincluded
inEFS
A’s
nutrientintake
calculationfor‘totalvitamin
K’
Country
Dietary
survey
(yea
r)Yea
rMethod
Day
sAge
Number
ofsu
bjects
(yea
rs)
Infants
(a)
<1ye
arChild
ren
1–<3ye
ars
Child
ren
3–<10
year
sAdolesc
ents
10
–<18
year
sAdults
18
–<65
year
sAdults
65
–<75
year
sAdults
≥75
year
s
Finlan
d/1
NWSS
P20
07–2
008
48-h
dietary
recall(b)
29
2(b)
13–1
530
6
Finlan
d/2
FINDIET2
012
2012
48-h
dietary
recall(b)
2(b)
25–7
41,29
541
3
Finlan
d/3
DIPP
2000
–201
0Dietary
record
30.5–
649
950
075
0Fran
ceIN
CA2
2006
–200
7Dietary
record
73–
7948
297
32,27
626
484
German
y/1
EsKiMo
2006
Dietary
record
36–
1183
539
3German
y/2
VELS
2001
–200
2Dietary
record
6<1–
415
834
8(c)
296(
c)
Irelan
dNAN
S20
08–2
010
Dietary
record
418
–90
1,27
414
977
Italy
INRAN
-SCA
I20
05–0
620
05–2
006
Dietary
record
3<1–
9816
(d)
36(d)
193
247
2,31
329
022
8
Latvia
FC_P
REG
NAN
TWOMEN
2011
2011
24-h
dietaryrecall
215
–45
12(d)
991(
c)
Nethe
rland
sDNFC
S200
7_20
1020
07–2
010
24-h
dietaryrecall
27–
6944
71,14
22,05
717
3
Swed
enRISKM
ATEN
2010
–201
1Dietary
records
(Web
)(e)
418
–80
1,43
029
572
UK/1
DNSIYC
-201
120
11Dietary
record
40.3–
1.5
1,36
91,31
4
UK/2
NDNSRolling
Prog
ramme
(Yea
rs1–
3)
2008
–201
1Dietary
record
41–
9418
565
166
61,26
616
613
9
DIPP:
type
1Diabe
tesPred
ictio
nan
dPrev
entio
nsurvey
;DNFC
S:Dutch
Nationa
lFoo
dCo
nsum
ptionSu
rvey
;DNSIYC
:Dietan
dNutritionSu
rvey
ofInfantsan
dYo
ungCh
ildren;
EsKiMo:
Ern€ a
hrun
gsstud
iealsKIGGS-Mod
ul;
FC_P
REG
NAN
TWOMEN
:food
consum
ptionof
preg
nant
wom
enin
Latvia;FINDIET:
thena
tiona
ldietary
survey
ofFinlan
d;IN
CA:� etud
eIndividu
elle
Nationa
lede
sCo
nsom
mations
Alim
entaire
s;IN
RAN
-SCA
I:IstitutoNaziona
ledi
Ricerca
pergliA
limen
tiela
Nutriz
ione
–Stud
iosuiC
onsumiA
limen
tariin
Italia;NAN
S:Nationa
lAdu
ltNutritionSu
rvey
;NDNS:
Nationa
lDietan
dNutritionSu
rvey
;NWSS
P:Nutritionan
dWellbeing
ofSe
cond
arySc
hool
Pupils;VE
LS:
Verzeh
rsstud
iezurErmittlung
derLe
bensmittelau
fnah
mevo
nS€ a
uglinge
nun
dKleink
inde
rnf€ urdieAb
sch€ a
tzun
geine
sak
uten
Toxizit€ atsris
ikos
durchR€ uckst€ and
evo
nPfl
anzensch
utzm
itteln.
(a):
Infants1–
11mon
thsof
age.
(b):
A48
-hdietaryrecallcomprisingtw
oconsecutiveda
ys.
(c):
Four
childrenfrom
theVE
LSstud
y(one
aged
1–<3an
dthreeag
ed3–
<10
years)
andon
ead
ultfrom
theLa
tvianstud
ywereno
tconsidered
intheassessmen
tas
only
one24
-hdietaryrecallda
ywas
available.
(d):
5thor
95th
percen
tileintake
scalculated
from
fewer
than
60subjects
requ
irecautious
interpretatio
nas
theresults
may
notbe
statistic
ally
robu
st(EFS
A,20
11b)
and,
therefore,
forthesedietarysurvey
s/ag
eclasses,
the5than
d95
thpe
rcen
tileestim
ates
areno
tpresen
tedin
theintake
results.
(e):
TheSw
edishdietaryrecordswereintrod
uced
throug
htheInternet.
www.efsa.eu
ropa.eu
/efsajournal
66EFSA
Journal
2017;15(5):478
0
Dietary
reference
values
forvitamin
K

Appen
dix
C–‘Totalvitamin
K’intake
sin
males
indiffere
ntsu
rvey
s,es
timated
byEFS
Aac
cord
ingto
ageclas
san
dco
untry
Ageclas
sCountry
Survey
Intake
s(b)ex
pre
ssed
inlg
per
day
Intake
s(b)ex
pre
ssed
inlg
per
MJ
n(c)
Ave
rage
Med
ian
P5
P95
Ave
rage
Med
ian
P5
P95
<1ye
ar(a)
Finlan
dDIPP
247
3435
467
18(d)
16(d)
7(d)
34(d)
German
yVE
LS84
4339
711
113
122
34Italy
INRAN
_SCA
I_20
05_0
69
2314
–(b)
–(b)
84
–(b)
–(b)
UnitedKing
dom
DNSIYC
_201
169
961
5620
116
1817
631
1–<3ye
ars
Finlan
dDIPP
245
4239
1574
1211
420
German
yVE
LS17
451
3612
137
118
330
Italy
INRAN
_SCA
I_20
05_0
620
5141
–(b)
–(b)
119
–(b)
–(b)
UnitedKing
dom
NDNS-Rolling
Prog
rammeYe
ars1–
310
751
4519
106
1211
421
UnitedKing
dom
DNSIYC
_201
166
353
4318
106
1110
525
3–<10
years
Finlan
dDIPP
381
4540
2181
87
413
Fran
ceIN
CA2
239
6252
1713
910
83
26
German
yEsKiMo
426
6751
2115
79
63
21German
yVE
LS14
647
3616
122
96
321
Italy
INRAN
_SCA
I_20
05_0
694
9168
3023
513
94
37Nethe
rland
sDNFC
S200
723
193
5419
364
116
339
UnitedKing
dom
NDNS-Rolling
Prog
rammeYe
ars1–
332
668
6020
144
119
426
10–<
18ye
ars
Finlan
dNWSS
P07_
0813
673
7029
129
98
415
Fran
ceIN
CA2
449
8062
2218
310
83
24German
yEsKiMo
197
6955
2117
19
73
21
Italy
INRAN
_SCA
I_20
05_0
610
814
385
4336
716
94
45Nethe
rland
sDNFC
S200
756
611
269
2837
711
63
35
UnitedKing
dom
NDNS-Rolling
Prog
rammeYe
ars1–
334
080
6626
178
108
422
18–<
65ye
ars
Finlan
dFINDIET2
012
585
9281
3018
010
93
22
Fran
ceIN
CA2
936
103
8928
228
1210
427
Irelan
dNAN
S_20
1263
484
7126
182
97
319
Italy
INRAN
_SCA
I_20
05_0
61,06
816
111
540
440
1813
553
www.efsa.eu
ropa.eu
/efsajournal
67EFSA
Journal
2017;15(5):478
0
Dietary
reference
values
forvitamin
K

Ageclas
sCountry
Survey
Intake
s(b)ex
pre
ssed
inlg
per
day
Intake
s(b)ex
pre
ssed
inlg
per
MJ
n(c)
Ave
rage
Med
ian
P5
P95
Ave
rage
Med
ian
P5
P95
Nethe
rland
sDNFC
S200
71,02
315
793
3563
714
83
56
Swed
enRiksm
aten
2010
623
9177
3118
49
84
20UnitedKing
dom
NDNS-Rolling
Prog
rammeYe
ars1–
356
010
384
3224
412
94
28
65–<
75ye
ars
Finlan
dFINDIET2
012
210
9481
3220
012
104
26Fran
ceIN
CA2
111
130
116
4224
016
145
30
Irelan
dNAN
S_20
1272
9684
2321
211
94
24Italy
INRAN
_SCA
I_20
05_0
613
319
615
252
531
2415
774
Nethe
rland
sDNFC
S200
791
155
8943
553
1711
453
Swed
enRiksm
aten
2010
127
9280
3716
711
105
19
UnitedKing
dom
NDNS-Rolling
Prog
rammeYe
ars1–
375
119
104
3923
015
135
26
≥75
years
Fran
ceIN
CA2
4013
510
4–(
b)
–(b)
1816
–(b)
–(b)
Irelan
dNAN
S_20
1234
7257
–(b)
–(b)
99
–(b)
–(b)
Italy
INRAN
_SCA
I_20
05_0
669
157
110
5236
018
135
42
Swed
enRiksm
aten
2010
4210
487
–(b)
–(b)
1210
–(b)
–(b)
UnitedKing
dom
NDNS-Rolling
Prog
rammeYe
ars1–
356
8882
–(b)
–(b)
1211
–(b)
–(b)
DIPP:
type
1Diabe
tesPred
ictio
nan
dPrev
entio
nsurvey
;DNFC
S:Dutch
Nationa
lFoo
dCo
nsum
ptionSu
rvey
;DNSIYC
:Dietan
dNutritionSu
rvey
ofInfantsan
dYo
ungCh
ildren;
EsKiMo:
Ern€ a
hrun
gsstud
iealsKIGGS-Mod
ul;FC
_PREG
NAN
TWOMEN
:food
consum
ptionof
preg
nant
wom
enin
Latvia;FINDIET:
thena
tiona
ldietary
survey
ofFinlan
d;IN
CA:� etud
eIndividu
elle
Nationa
lede
sCo
nsom
mations
Alim
entaire
s;IN
RAN
-SCA
I:IstitutoNaziona
ledi
Ricerca
pergliA
limen
tiela
Nutriz
ione
–Stud
iosuiC
onsumiA
limen
tariin
Italia;NAN
S:Nationa
lAdu
ltNutritionSu
rvey
;NDNS:
Nationa
lDietan
dNutritionSu
rvey
;NWSS
P:Nutritionan
dWellbeing
ofSe
cond
arySc
hool
Pupils;VE
LS:Ve
rzeh
rsstud
iezurErmittlung
derLe
bensmittelau
fnah
mevo
nS€ a
uglinge
nun
dKleink
inde
rnf€ ur
dieAb
sch€ a
tzun
geine
sak
uten
Toxizit€ atsris
ikos
durchR€ uckst€ and
evo
nPfl
anzensch
utzm
itteln.
(a):
Infantsbe
twee
n1an
d11
mon
ths.
Theprop
ortio
nsof
brea
stfedinfantswere58
%in
theFinn
ishsurvey,40
%in
theGerman
survey,44
%in
theItaliansurvey,an
d21
%in
theUKsurvey.Most
infantswerepa
rtially
brea
stfed.
Theconsum
ptionof
brea
stmilk
was
take
ninto
accoun
tiftheconsum
ptionwas
repo
rted
ashu
man
milk
(Italiansurvey
)or
ifthenu
mbe
rof
brea
stmilk
consum
ptionev
ents
was
repo
rted
(German
andUKsurvey
s).Fo
rtheGerman
stud
y,thetotala
mou
ntof
brea
stmilk
was
calculated
basedon
theob
servations
byPa
ulet
al.(198
8)on
brea
stmilk
consum
ptiondu
ringon
eea
tingoccasion
atdifferen
tag
egrou
ps:theam
ount
ofbrea
stmilk
consum
edon
oneea
tingoccasion
was
setto
135g/ea
tingoccasion
forinfantsbe
twee
n6an
d7mon
thsof
agean
dto
100g/ea
tingoccasion
forinfantsbe
twee
n8–
12mon
thsof
age(Kerstingan
dClau
sen,
2003
).Fo
rtheUKsurvey,theam
ount
ofbrea
stmilk
consum
edwas
either
directly
quan
tified
bythemothe
r(exp
ressed
brea
stmilk)or
extrap
olated
from
thedu
ratio
nof
each
brea
stfeed
ingev
ent.As
noinform
ationon
thebrea
stfeed
ingev
ents
wererepo
rted
inthe
Finn
ishsurvey,brea
stmilk
intake
was
nottake
ninto
considerationin
theintake
estim
ates
ofFinn
ishinfants.
(b):
5thor
95th
percen
tileintake
scalculated
from
fewer
than
60subjects
requ
irecautious
interpretatio
nas
theresults
may
notbe
statistic
ally
robu
st(EFS
A,20
11b)
and,
therefore,
forthese
dietarysurvey
s/ag
eclasses,
the5than
d95
thpe
rcen
tileestim
ates
areno
tpresen
tedin
theintake
results.
(c):
n:nu
mbe
rof
subjects.
(d):
Theintake
expressedas
lg/M
Jisreferringto
245malesubjects
oftheFinn
ishDIPPstud
yas
energy
intake
was
notrepo
rted
fortw
osubjects.
www.efsa.eu
ropa.eu
/efsajournal
68EFSA
Journal
2017;15(5):478
0
Dietary
reference
values
forvitamin
K

Appen
dix
D–‘Totalvitamin
K’intake
sin
females
indiffere
ntsu
rvey
s,es
timated
byEFS
Aac
cord
ingto
ageclas
san
dco
untry
Ageclas
sCountry
Survey
Intake
s(b)ex
pre
ssed
inlg
/day
Intake
s(b)ex
pre
ssed
inlg
/MJ
n(c)
Ave
rage
Med
ian
P5
P95
Ave
rage
Med
ian
P5
P95
<1ye
ar(a)
Finlan
dDIPP
253
3332
569
22(e)
17(e)
8(e)
45(e)
German
yVE
LS75
3633
1077
1212
324
Italy
INRAN
_SCA
I_20
05_0
67
3132
–(b)
–(b)
109
–(b)
–(b)
UnitedKing
dom
DNSIYC
_201
167
053
5011
100
1717
431
1–<3ye
ars
Finlan
dDIPP
255
3634
1272
1110
420
German
yVE
LS17
446
3712
120
118
329
Italy
INRAN
_SCA
I_20
05_0
616
5037
–(b)
–(b)
107
–(b)
–(b)
UnitedKing
dom
NDNS-RollingProg
rammeYe
ars1–
378
5247
1810
312
115
22
UnitedKing
dom
DNSIYC
_201
165
150
4416
102
1311
426
3–<10
years
Finlan
dDIPP
369
4237
1984
87
415
Fran
ceIN
CA2
243
6350
1916
011
94
28German
yEsKiMo
409
6550
1916
610
73
23
German
yVE
LS14
750
3714
137
107
328
Italy
INRAN
_SCA
I_20
05_0
699
8565
2022
312
93
30
Nethe
rland
sDNFC
S200
721
670
4922
164
96
321
UnitedKing
dom
NDNS-RollingProg
rammeYe
ars1–
332
565
5722
139
1110
423
10–<
18ye
ars
Finlan
dNWSS
P07_
0817
071
6834
115
1110
618
Fran
ceIN
CA2
524
7057
1917
812
93
30
German
yEsKiMo
196
7456
2020
010
83
29Italy
INRAN
_SCA
I_20
05_0
613
911
179
3032
215
104
51
Latvia(d)
FC_P
REG
NAN
TWOMEN
_201
112
8867
–(b)
–(b)
97
–(b)
–(b)
Nethe
rland
sDNFC
S200
757
695
6026
336
127
342
UnitedKing
dom
NDNS-RollingProg
rammeYe
ars1–
332
668
5724
140
109
422
18–<
65ye
ars
Finlan
dFINDIET2
012
710
9080
2717
613
114
28
Fran
ceIN
CA2
1,34
010
586
2724
417
145
41Irelan
dNAN
S_20
1264
081
6825
187
119
425
Italy
INRAN
_SCA
I_20
05_0
61,24
515
711
440
432
2315
664
Latvia(d)
FC_P
REG
NAN
TWOMEN
_201
199
088
7632
171
119
420
Nethe
rland
sDNFC
S200
71,03
413
578
2651
617
103
60
www.efsa.eu
ropa.eu
/efsajournal
69EFSA
Journal
2017;15(5):478
0
Dietary
reference
values
forvitamin
K

Ageclas
sCountry
Survey
Intake
s(b)ex
pre
ssed
inlg
/day
Intake
s(b)ex
pre
ssed
inlg
/MJ
n(c)
Ave
rage
Med
ian
P5
P95
Ave
rage
Med
ian
P5
P95
Swed
enRiksm
aten
2010
807
9882
3321
313
115
28
UnitedKing
dom
NDNS-RollingProg
rammeYe
ars1–
370
610
186
2721
816
135
3665
–<75
years
Finlan
dFINDIET2
012
8375
3215
414
126
2583
Fran
ceIN
CA2
125
105
4426
821
179
4312
5Irelan
dNAN
S_20
1296
8124
200
1512
433
96
Italy
INRAN
_SCA
I_20
05_0
616
912
038
392
2517
762
169
Nethe
rland
sVC
PBasis_A
VL20
07_2
010
151
8222
505
2312
466
151
Swed
enRiksm
aten
2010
8975
3918
613
126
2589
UnitedKing
dom
NDNS-RollingProg
rammeYe
ars1–
310
797
2824
018
155
4210
7
≥75
years
Fran
ceIN
CA2
4412
010
2–(
b)
–(b)
2017
–(b)
–(b)
Irelan
dNAN
S_20
1243
8976
–(b)
–(b)
1412
–(b)
–(b)
Italy
INRAN
_SCA
I_20
05_0
615
916
412
133
466
2516
674
Swed
enRiksm
aten
2010
3011
110
8–(
b)
–(b)
1616
–(b)
–(b)
UnitedKing
dom
NDNS-RollingProg
rammeYe
ars1–
383
8879
3217
715
136
31
DIPP:
type
1Diabe
tesPred
ictio
nan
dPrev
entio
nsurvey
;DNFC
S:Dutch
Nationa
lFoo
dCo
nsum
ptionSu
rvey
;DNSIYC
:Dietan
dNutritionSu
rvey
ofInfantsan
dYo
ungCh
ildren;
EsKiMo:
Ern€ a
hrun
gsstud
iealsKIGGS-Mod
ul;FC
_PREG
NAN
TWOMEN
:food
consum
ptionof
preg
nant
wom
enin
Latvia;FINDIET:
thena
tiona
ldietary
survey
ofFinlan
d;IN
CA:� etud
eIndividu
elle
Nationa
lede
sCo
nsom
mations
Alim
entaire
s;IN
RAN
-SCA
I:IstitutoNaziona
ledi
Ricerca
pergliA
limen
tiela
Nutriz
ione
–Stud
iosuiC
onsumiA
limen
tariin
Italia;NAN
S:Nationa
lAdu
ltNutritionSu
rvey
;NDNS:
Nationa
lDietan
dNutritionSu
rvey
;NWSS
P:Nutritionan
dWellbeing
ofSe
cond
arySc
hool
Pupils;VE
LS:Ve
rzeh
rsstud
iezurErmittlung
derLe
bensmittelau
fnah
mevo
nS€ a
uglinge
nun
dKleink
inde
rnf€ ur
dieAb
sch€ a
tzun
geine
sak
uten
Toxizit€ atsris
ikos
durchR€ uckst€ and
evo
nPfl
anzensch
utzm
itteln.
(a):
Infantsbe
twee
n1an
d11
mon
ths.
Theprop
ortio
nsof
brea
stfedinfantswere58
%in
theFinn
ishsurvey,40
%in
theGerman
survey,44
%in
theItaliansurvey
and21
%in
theUKsurvey.Most
brea
stfedinfantswerepa
rtially
brea
stfed.
Theconsum
ptionof
brea
stmilk
was
take
ninto
accoun
tiftheconsum
ptionwas
repo
rted
ashu
man
milk
(Italiansurvey
)or
ifthenu
mbe
rof
brea
stmilk
consum
ptionev
ents
was
repo
rted
(German
andUKsurvey
s).Fo
rtheGerman
stud
y,thetotala
mou
ntof
brea
stmilk
was
calculated
basedon
theob
servations
byPa
ulet
al.(198
8)on
brea
stmilk
consum
ptiondu
ringon
eea
tingoccasion
atdifferen
tag
egrou
ps:theam
ount
ofbrea
stmilk
consum
edon
oneea
tingoccasion
was
setto
135g/ea
tingoccasion
forinfantsbe
twee
n6an
d7mon
thsof
agean
dto
100g/ea
tingoccasion
forinfantsbe
twee
n8an
d12
mon
thsof
age(Kerstingan
dClau
sen,
2003
).Fo
rtheUKsurvey,theam
ount
ofbrea
stmilk
consum
edwas
either
directly
quan
tified
bythemothe
r(exp
ressed
brea
stmilk)or
extrap
olated
from
thedu
ratio
nof
each
brea
stfeed
ingev
ent.As
noinform
ationon
thebrea
stfeed
ingev
ents
wererepo
rted
intheFinn
ishsurvey,brea
stmilk
intake
was
nottake
ninto
considerationin
theintake
estim
ates
ofFinn
ishinfants.
(b):
5thor
95th
percen
tileintake
scalculated
from
fewer
than
60subjects
requ
irecautious
interpretatio
nas
theresults
may
notbe
statistic
ally
robu
st(EFS
A,20
11b)
and,
therefore,
forthese
dietarysurvey
s/ag
eclasses,
the5than
d95
thpe
rcen
tileestim
ates
areno
tpresen
tedin
theintake
results.
(c):
n:nu
mbe
rof
subjects.
(d):
Preg
nant
wom
enon
ly.
(e):
Theintake
expressedas
lg/MJisreferringto
251femalesubjects
oftheFinn
ishDIPPstud
yas
energy
intake
was
notrepo
rted
fortw
osubjects.
www.efsa.eu
ropa.eu
/efsajournal
70EFSA
Journal
2017;15(5):478
0
Dietary
reference
values
forvitamin
K

Appen
dix
E–Minim
um
andmax
imum
per
centageco
ntributionsofdiffere
ntfoodgro
ups(F
oodEx2leve
l1)to
‘totalvitamin
K’intake
estimates
inmales
Foodgro
ups
Age
<1ye
ar1–<3
year
s3
–<10
year
s10
–<18
year
s18
–<65
year
s65
–<75
year
s≥75
year
s
Additiv
es,fla
vours,
baking
andprocessing
aids
00
00
00
0
Alcoho
licbe
verage
s0
00
00
00
Anim
alan
dve
getablefats
andoils
1–12
3–15
5–31
5–36
5–26
6–28
5–13
Coffee
,cocoa,
teaan
dinfusion
s0
0<1
<1
<1
<1
<1
Compo
site
dishes
<1–
6<1–
10<1–
10<1–
13<1–
34<1–
34<1–
34
Eggs
andeg
gprod
ucts
<1
<1–
1<1–
1<1–
2<1–
4<1–
5<1–
4Fish,seafoo
d,am
phibians,reptilesan
dinve
rteb
rates
0<1
<1
<1
<1–
2<1–
3<1–
2
Food
prod
ucts
foryo
ungpo
pulatio
n48
–62
5–30
<1–
1<1
<1
––
Fruitan
dfruitprod
ucts
3–14
5–12
4–10
3–9
2–6
3–8
3–8
Fruitan
dve
getablejuices
andne
ctars
<1–
1<1–
21–
4<1–
3<1–
2<1–
1<1–
1Grainsan
dgrain-ba
sedprod
ucts
<1–
33–
83–
92–
91–
121–
131–
18
Hum
anmilk
00
––
––
–
Legu
mes,nu
ts,oilsee
dsan
dspices
<1–
62–
241–
231–
211–
182–
133–
15
Mea
tan
dmea
tprod
ucts
0–1
<1–
2<1–
51–
51–
41–
31–
3Milk
andda
iryprod
ucts
<1–
21–
62–
41–
3<1–
3<1–
21–
2
Prod
ucts
forno
n-stan
dard
diets,
food
imita
tes
andfood
supp
lemen
tsor
fortify
ingag
ents
00
0<1
<1
00
Season
ing,
sauc
esan
dcond
imen
ts0
0–2
<1–
2<1–
3<1–
7<1–
2<1–
2
Starch
yrootsor
tube
rsan
dprod
ucts
thereo
f,suga
rplan
ts<1–
21–
41–
51–
71–
51–
41–
4
Suga
r,confectio
nery
andwater-based
swee
tde
sserts
0<1–
1<1–
1<1–
1<1
<1
<1
Vege
tables
andve
getableprod
ucts
12–3
725
–62
32–6
431
–71
25–7
522
–77
23–7
3
Water
andwater-based
beve
rage
s0
00–
1<1–
1<1
00
‘–’m
eans
that
therewas
noconsum
ptionev
entof
thefood
grou
pfortheag
ean
dsexgrou
pconsidered
,while
‘0’m
eans
that
thereweresomeconsum
ptionev
ents,bu
tthat
thefood
grou
pdo
esno
tcontrib
uteto
theintake
ofthenu
trient
considered
,fortheag
ean
dsexgrou
pconsidered
.
www.efsa.eu
ropa.eu
/efsajournal
71EFSA
Journal
2017;15(5):478
0
Dietary
reference
values
forvitamin
K
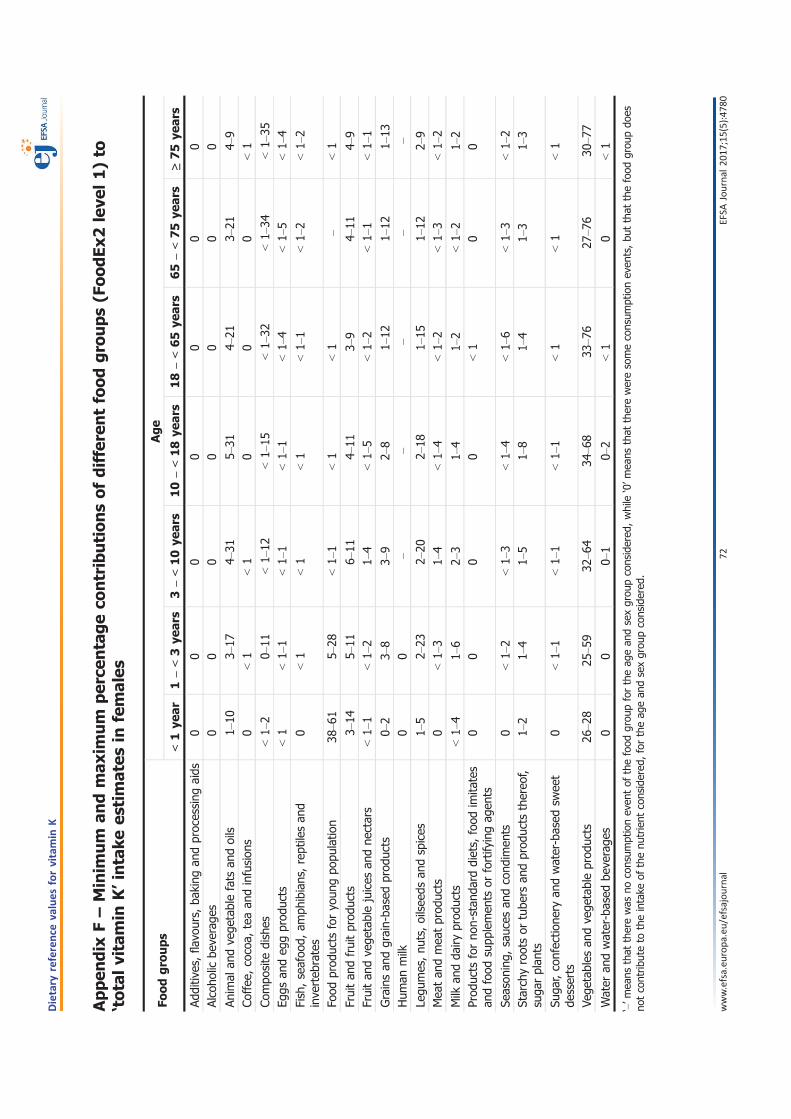
Appen
dix
F–Minim
um
andmax
imum
per
centageco
ntributionsofdiffere
ntfoodgro
ups(F
oodEx2leve
l1)to
‘totalvitamin
K’intake
estimates
infemales
Foodgro
ups
Age
<1ye
ar1–<3
year
s3
–<10
year
s10
–<18
year
s18
–<65
year
s65
–<75
year
s≥75
year
s
Additiv
es,fla
vours,
baking
andprocessing
aids
00
00
00
0Alcoho
licbe
verage
s0
00
00
00
Anim
alan
dve
getablefats
andoils
1–10
3–17
4–31
5–31
4–21
3–21
4–9
Coffee
,cocoa,
teaan
dinfusion
s0
<1
<1
00
0<1
Compo
site
dishes
<1–
20–
11<1–
12<1–
15<1–
32<1–
34<1–
35Eg
gsan
deg
gprod
ucts
<1
<1–
1<1–
1<1–
1<1–
4<1–
5<1–
4
Fish,seafoo
d,am
phibians,reptilesan
dinve
rteb
rates
0<1
<1
<1
<1–
1<1–
2<1–
2
Food
prod
ucts
foryo
ungpo
pulatio
n38
–61
5–28
<1–
1<1
<1
–<1
Fruitan
dfruitprod
ucts
3–14
5–11
6–11
4–11
3–9
4–11
4–9
Fruitan
dve
getablejuices
andne
ctars
<1–
1<1–
21–
4<1–
5<1–
2<1–
1<1–
1
Grainsan
dgrain-ba
sedprod
ucts
0–2
3–8
3–9
2–8
1–12
1–12
1–13
Hum
anmilk
00
––
––
–
Legu
mes,nu
ts,oilsee
dsan
dspices
1–5
2–23
2–20
2–18
1–15
1–12
2–9
Mea
tan
dmea
tprod
ucts
0<1–
31–
4<1–
4<1–
2<1–
3<1–
2
Milk
andda
iryprod
ucts
<1–
41–
62–
31–
41–
2<1–
21–
2Prod
ucts
forno
n-stan
dard
diets,
food
imita
tes
andfood
supp
lemen
tsor
fortify
ingag
ents
00
00
<1
00
Season
ing,
sauc
esan
dcond
imen
ts0
<1–
2<1–
3<1–
4<1–
6<1–
3<1–
2Starch
yrootsor
tube
rsan
dprod
ucts
thereo
f,suga
rplan
ts1–
21–
41–
51–
81–
41–
31–
3
Suga
r,confectio
nery
andwater-based
swee
tde
sserts
0<1–
1<1–
1<1–
1<1
<1
<1
Vege
tables
andve
getableprod
ucts
26–2
825
–59
32–6
434
–68
33–7
627
–76
30–7
7
Water
andwater-based
beve
rage
s0
00–
10–
2<1
0<1
‘–’m
eans
that
therewas
noconsum
ptionev
entof
thefood
grou
pfortheag
ean
dsexgrou
pconsidered
,while
‘0’m
eans
that
thereweresomeconsum
ptionev
ents,bu
tthat
thefood
grou
pdo
esno
tcontrib
uteto
theintake
ofthenu
trient
considered
,fortheag
ean
dsexgrou
pconsidered
.
www.efsa.eu
ropa.eu
/efsajournal
72EFSA
Journal
2017;15(5):478
0
Dietary
reference
values
forvitamin
K
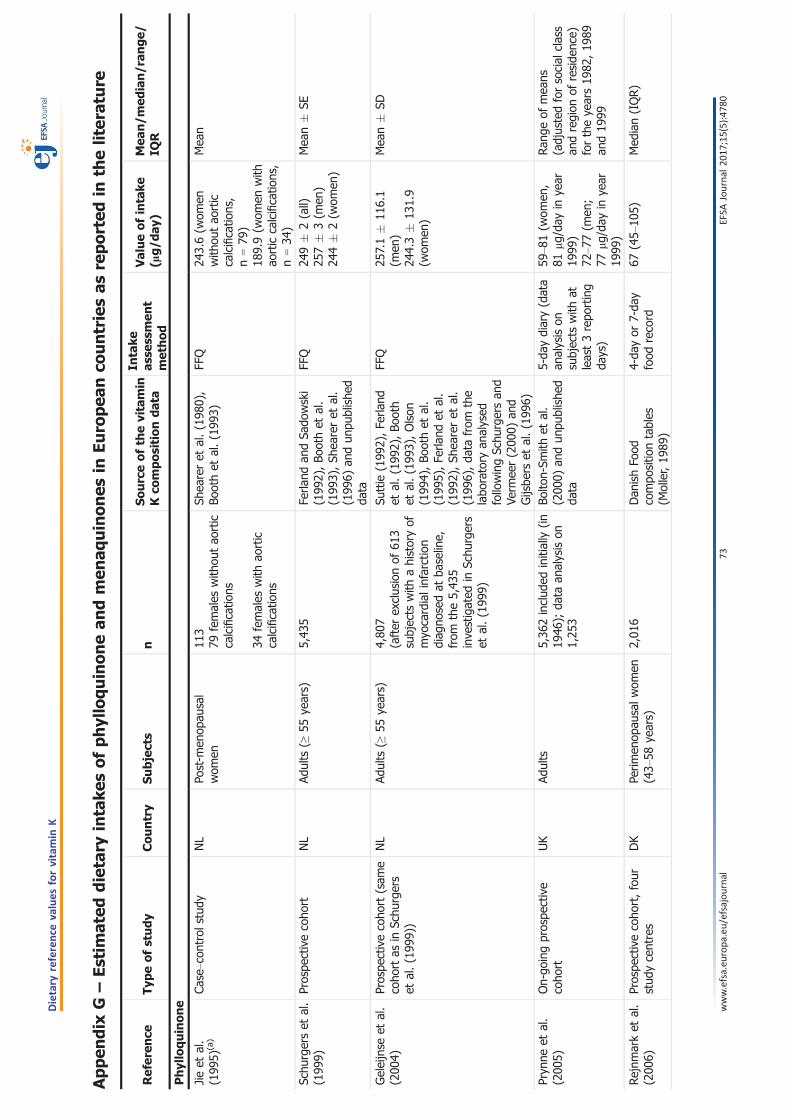
Appen
dix
G–Estim
ated
dietary
intake
sofphylloquinonean
dmen
aquinones
inEuro
pea
nco
untriesas
reported
inth
eliter
ature
Refer
ence
Typ
eofstudy
Country
Subjects
nSourceofth
evitamin
Kco
mpositiondata
Intake
asse
ssmen
tmethod
Valueofintake
(lg/d
ay)
Mea
n/m
edian/ran
ge/
IQR
Phylloquinone
Jieet
al.
(199
5)(a)
Case–con
trol
stud
yNL
Post-m
enop
ausal
wom
en11
379
females
with
outao
rtic
calcificatio
ns
34females
with
aortic
calcificatio
ns
Shea
reret
al.(198
0),
Boothet
al.(199
3)FF
Q24
3.6(w
omen
with
outao
rtic
calcificatio
ns,
n=79
)18
9.9(w
omen
with
aortic
calcificatio
ns,
n=34
)
Mea
n
Schu
rgerset
al.
(199
9)Prospe
ctivecoho
rtNL
Adults
(≥55
years)
5,43
5Fe
rland
andSa
dowski
(199
2),Bo
othet
al.
(199
3),Sh
eareret
al.
(199
6)an
dun
publishe
dda
ta
FFQ
249�
2(all)
257�
3(m
en)
244�
2(w
omen
)
Mea
n�
SE
Geleijnse
etal.
(200
4)Prospe
ctivecoho
rt(sam
ecoho
rtas
inSc
hurgers
etal.(199
9))
NL
Adults
(≥55
years)
4,80
7(after
exclusionof
613
subjects
with
ahistoryof
myo
cardialinfarction
diag
nosedat
baseline,
from
the5,43
5inve
stigated
inSc
hurgers
etal.(199
9)
Suttie
(199
2),Fe
rland
etal.(199
2),Bo
oth
etal.(199
3),Olson
(199
4),Bo
othet
al.
(199
5),Fe
rland
etal.
(199
2),Sh
eareret
al.
(199
6),da
tafrom
the
labo
ratory
analysed
followingSc
hurgersan
dVe
rmee
r(200
0)an
dGijsbe
rset
al.(199
6)
FFQ
257.1�
116.1
(men
)24
4.3�
131.9
(wom
en)
Mea
n�
SD
Pryn
neet
al.
(200
5)On-go
ingprospe
ctive
coho
rtUK
Adults
5,36
2includ
edinitially
(in19
46);
data
analysison
1,25
3
Bolto
n-Sm
ithet
al.
(200
0)an
dun
publishe
dda
ta
5-da
ydiary(data
analysison
subjects
with
atleast3repo
rting
days)
59–8
1(w
omen
,81
l g/day
inye
ar19
99)
72–7
7(m
en;
77lg
/day
inye
ar19
99)
Ran
geof
mea
ns(adjustedforsocial
class
andregion
ofreside
nce)
fortheye
ars19
82,19
89an
d19
99
Rejnm
arket
al.
(200
6)Prospe
ctivecoho
rt,four
stud
ycentres
DK
Perim
enop
ausalw
omen
(43–
58ye
ars)
2,01
6Dan
ishFo
odcompo
sitio
ntables
(Moller,19
89)
4-da
yor
7-da
yfood
record
67(45–
105)
Med
ian(IQR)
www.efsa.eu
ropa.eu
/efsajournal
73EFSA
Journal
2017;15(5):478
0
Dietary
reference
values
forvitamin
K

Refer
ence
Typ
eofstudy
Country
Subjects
nSourceofth
evitamin
Kco
mpositiondata
Intake
asse
ssmen
tmethod
Valueofintake
(lg/d
ay)
Mea
n/m
edian/ran
ge/
IQR
Than
eet
al.
(200
6a)
Nationa
llyrepresen
tativ
esample
UK
Adults
(19–
64ye
ars)
1,42
3Bo
lton-Sm
ithet
al.
(200
0),FS
A(200
2)an
dun
publishe
dda
ta(M
JSh
eareran
dCBo
lton-
Smith
)
7-da
y-weigh
edfood
record
67(65–
69)(b)
Geo
metric
mea
n(95%
CI)
Nim
ptschet
al.
(200
8)Prospe
ctivecoho
rtDE
Men
(40–
65ye
ars)
11,319
Bolto
n-Sm
ithet
al.
(200
0)an
dun
publishe
dda
ta
Semiqua
ntita
tive
FFQ
93.6
(70.9–
123.5)
Med
ian(IQR)
Macdo
nald
etal.(200
8)Prospe
ctivecoho
rtUK
Wom
en(49–
54ye
ars)
3,19
9UKda
taba
se,compiled
byBo
lton-Sm
ithet
al.
(200
0)
FFQ
109�
55(c)
Mea
n�
SD
Gastet
al.
(200
9)Prospe
ctivecoho
rtNL
Post-m
enop
ausal
wom
en(49–
70ye
ars)
16,057
MainlySc
hurgersan
dVe
rmee
r(200
0),also:
Ferla
ndan
dSa
dowski
(199
2),Su
ttie
(199
2),
Boothet
al.(199
3),
Boothet
al.(199
5),
Shea
reret
al.(199
6)
FFQ
211.7�
100.3
(9.1
�99
1.1)
Mea
n�
SD
Apalsetet
al.
(201
1)Prospe
ctivecoho
rtNO
Adults
(71–
73ye
ars)
2,58
2Described
inAp
alset
etal.(201
0):(Koivu
-Tikkan
enet
al.,20
00;
Schu
rgersan
dVe
rmee
r,20
00);
Finn
ishfood
compo
sitio
nda
taba
se(N
ationa
lInstitutefor
Hea
lthan
dWelfare,
2009
)Sw
edishfood
compo
sitio
nda
taba
se(d) ,
andUSD
A(200
7)
FFQ
67.0
�66
.6(w
omen
with
nohip
fracture)
78.4
�61
.7(m
enwith
nohip
fracture)
57.9
�64
.3(w
omen
with
hip
fracture)
65.2
�46
.1(m
enwith
hipfracture)
Med
ian(IQR)
Bullo
etal.
(201
1)Prospe
ctivecoho
rtES
Adults
(55–
80ye
ars)
200
USD
A(200
9)Se
miqua
ntita
tive
FFQ
333.6�
17.3
(men
)29
9.8�
11.6
(wom
en)
Mea
n�
SE
DGE(201
2)Nationa
lsurve
y,Cross-
sectiona
lDE
Adults
(15–
80ye
ars)
6,16
0German
food
compo
sitio
nda
taba
se(BLS
3.02
)(M
RI)
Two24
-hrecalls
76Med
ian
www.efsa.eu
ropa.eu
/efsajournal
74EFSA
Journal
2017;15(5):478
0
Dietary
reference
values
forvitamin
K

Refer
ence
Typ
eofstudy
Country
Subjects
nSourceofth
evitamin
Kco
mpositiondata
Intake
asse
ssmen
tmethod
Valueofintake
(lg/d
ay)
Mea
n/m
edian/ran
ge/
IQR
Elmad
faet
al.
(201
2)Nationa
lsurve
y,cross-
sectiona
lAT
Children(7–1
4ye
ars)
332(children)
Elmad
faet
al.(199
4)(using
theGerman
food
compo
sitio
nda
taba
seBL
S2.1.
(MRI)
completed
with
food
compo
sitio
ntables
oftypicalA
ustriandishes
andnu
trient-enriche
dfood
s)
3-da
ydietary
record
59–7
5(children)
Ran
geof
mea
nsde
pend
ingon
sexan
dag
erang
e
Adults
(18–
80ye
ars)
380(18–
64ye
ars)
176(65–
80ye
ars)
Jako
ban
dElmad
fa(199
6)Tw
o24
-hrecalls
89–1
17(adu
lts)
Ran
geof
mea
nsde
pend
ingon
sexan
dag
erang
e
Visserset
al.
(201
3)Prospe
ctivecoho
rtNL
Adults
(49�
12ye
ars),
includ
ingthecoho
rtof
wom
eninve
stigated
byGastet
al.(200
9)
35,476
MainlySc
hurgersan
dVe
rmee
r(200
0),also:
Ferla
ndan
dSa
dowski
(199
2),Su
ttie
(199
2),
Boothet
al.(199
3),
Boothet
al.(199
5),
Shea
reret
al.(199
6)
FFQ
199�
97.8
Mea
n�
SD
Orteg
aAn
taet
al.(201
4)(e)
Cross-sectiona
l,na
tiona
llyrepresen
tativ
esample
ESMostly
adults
(17–
60ye
ars)
1,06
8Sp
anishda
taba
se:
Orteg
aet
al.(201
0)3-da
yfood
record
174.2(m
ales),
166.4(fem
ales)
170.2(all)
Mea
n(adjustedfor
energy
intake
)
Web
eret
al.
(201
4)(f)
Prospe
ctivecoho
rtDE
Children(8–1
2ye
ars)
268
German
food
compo
sitio
nda
taba
seBL
SII.3
(MRI)
Dietary
history
over
4wee
ks29
2.3
Med
ian
Hay
eset
al.
(201
6)Nationa
lsurve
y,cross-
sectiona
lIE
Adults
(18–
90ye
ars)
1,50
0MainlyUKfood
compo
sitio
ntable(FSA
,20
02),
which
vitamin
Kda
taarelargelyba
sed
onBo
lton-Sm
ithet
al.
(200
0),an
dda
tafrom
theprev
ious
versionof
theUKtable;
also
recipe
calculations,an
dUSD
A(201
5)
4-da
ysemiweigh
ted
food
diary
85.2
�59
.1(all)
86.0
�57
.4(m
en)
84.4
�60
.7(w
omen
)
Mea
n�
SD
www.efsa.eu
ropa.eu
/efsajournal
75EFSA
Journal
2017;15(5):478
0
Dietary
reference
values
forvitamin
K

Refer
ence
Typ
eofstudy
Country
Subjects
nSourceofth
evitamin
Kco
mpositiondata
Intake
asse
ssmen
tmethod
Valueofintake
(lg/d
ay)
Mea
n/m
edian/ran
ge/
IQR
Men
aquinones
Schu
rgerset
al.
(199
9)Prospe
ctivecoho
rtNL
Adults
(≥55
years)
5,43
5Unp
ublishe
dda
taFF
QTotal
men
aquinones
(MK-4
toMK-1
0)
28.4
(all)
MK-4
6.8�
0.04
(all)
7.5�
0.1(m
en)
6.3�
0.1(w
omen
)MK-5
toMK-1
021
.6�
0.2(all)
22.9
�0.3(m
en)
20.6
�0.3
(wom
en)
Mea
nMea
n�
SE
Mea
n�
SE
Geleijnse
etal.
(200
4)Prospe
ctivecoho
rtNL
Adults
(≥55
years)
4,80
7Datafrom
the
labo
ratory
analysed
followingSc
hurgersan
dVe
rmee
r(200
0)an
dGijsbe
rset
al.(199
6)
FFQ
Total
men
aquinones
(MK-4
toMK-1
0)
30.8
�18
(men
)27
�15
.1(w
omen
)MK-4
7.7�
3.4(m
en)
6.3�
2.8(w
omen
)MK-5
toMK-1
023
.1�
16.3
(men
)20
.7�
13.8
(wom
en)
Mea
n�
SD
Mea
n�
SD
Mea
n�
SD
Nim
ptschet
al.
(200
8)Prospe
ctivecoho
rtDE
Men
(40–
65ye
ars)
11,319
Hira
uchi
etal.(198
9),
Schu
rgersan
dVe
rmee
r(200
0)
FFQ
Total
men
aquinones
(MK-4
toMK-1
4)
34.7
(25.7–
45.7)
MK-4
14.4
(10.9–
18.7)
MK-5
0.3(0.2–0
.5)
MK-6
0.3(0.2–0
.5)
Med
ian(IQR)
www.efsa.eu
ropa.eu
/efsajournal
76EFSA
Journal
2017;15(5):478
0
Dietary
reference
values
forvitamin
K
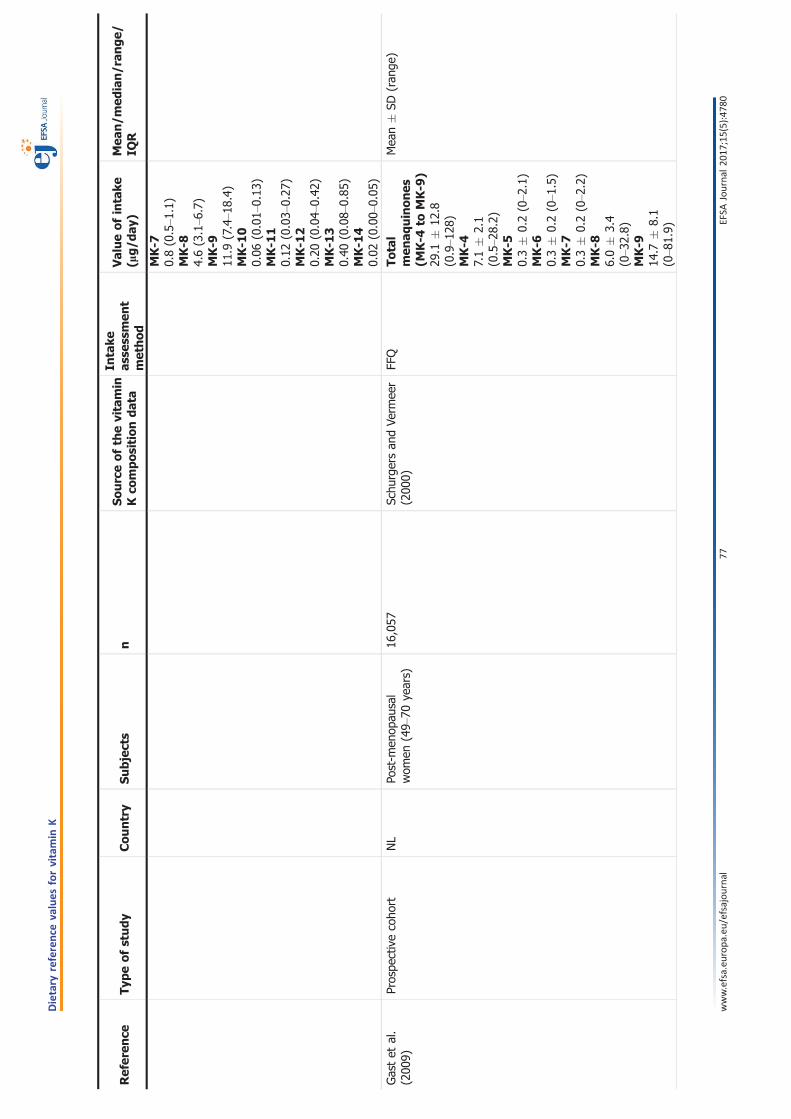
Refer
ence
Typ
eofstudy
Country
Subjects
nSourceofth
evitamin
Kco
mpositiondata
Intake
asse
ssmen
tmethod
Valueofintake
(lg/d
ay)
Mea
n/m
edian/ran
ge/
IQR
MK-7
0.8(0.5–1
.1)
MK-8
4.6(3.1–6
.7)
MK-9
11.9
(7.4–1
8.4)
MK-1
00.06
(0.01–
0.13
)MK-1
10.12
(0.03–
0.27
)MK-1
20.20
(0.04–
0.42
)MK-1
30.40
(0.08–
0.85
)MK-1
40.02
(0.00–
0.05
)
Gastet
al.
(200
9)Prospe
ctivecoho
rtNL
Post-m
enop
ausal
wom
en(49–
70ye
ars)
16,057
Schu
rgersan
dVe
rmee
r(200
0)FF
QTotal
men
aquinones
(MK-4
toMK-9
)29
.1�
12.8
(0.9–1
28)
MK-4
7.1�
2.1
(0.5–2
8.2)
MK-5
0.3�
0.2(0–2
.1)
MK-6
0.3�
0.2(0–1
.5)
MK-7
0.3�
0.2(0–2
.2)
MK-8
6.0�
3.4
(0–3
2.8)
MK-9
14.7
�8.1
(0–8
1.9)
Mea
n�
SD(ran
ge)
www.efsa.eu
ropa.eu
/efsajournal
77EFSA
Journal
2017;15(5):478
0
Dietary
reference
values
forvitamin
K
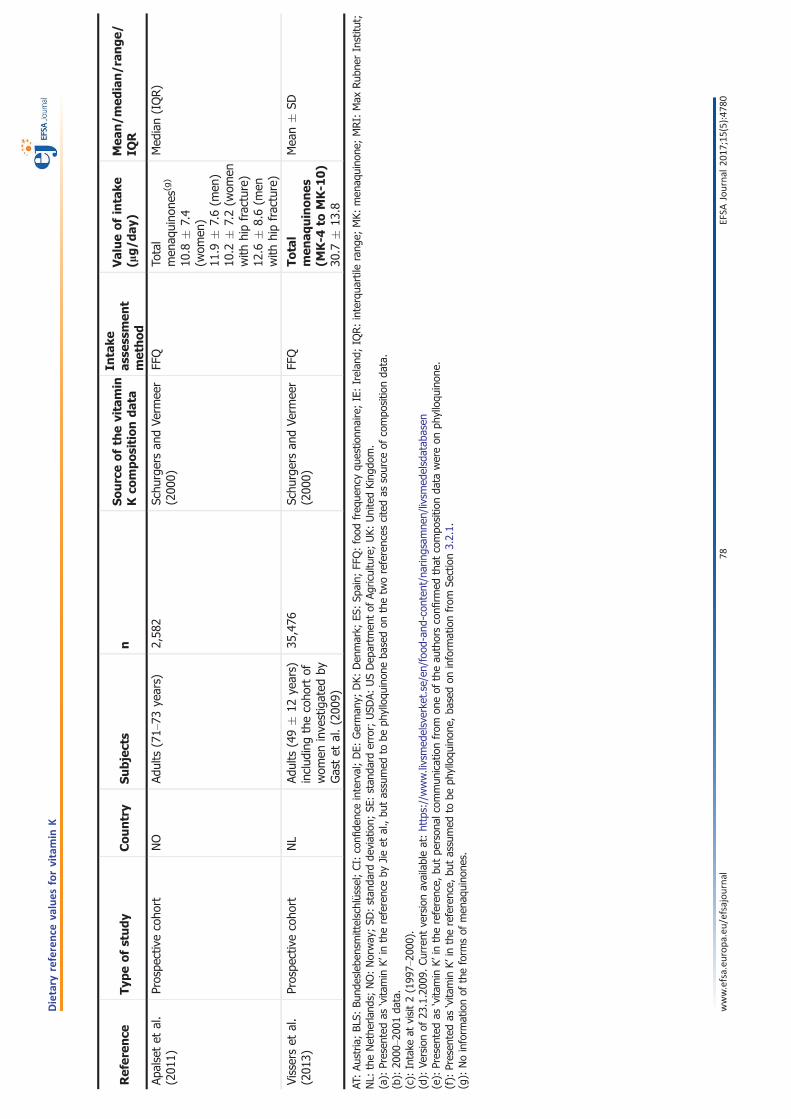
Refer
ence
Typ
eofstudy
Country
Subjects
nSourceofth
evitamin
Kco
mpositiondata
Intake
asse
ssmen
tmethod
Valueofintake
(lg/d
ay)
Mea
n/m
edian/ran
ge/
IQR
Apalsetet
al.
(201
1)Prospe
ctivecoho
rtNO
Adults
(71–
73ye
ars)
2,58
2Sc
hurgersan
dVe
rmee
r(200
0)FF
QTo
tal
men
aquino
nes(g)
10.8
�7.4
(wom
en)
11.9
�7.6(m
en)
10.2
�7.2(w
omen
with
hipfracture)
12.6
�8.6(m
enwith
hipfracture)
Med
ian(IQR)
Visserset
al.
(201
3)Prospe
ctivecoho
rtNL
Adults
(49�
12ye
ars)
includ
ingthecoho
rtof
wom
eninve
stigated
byGastet
al.(200
9)
35,476
Schu
rgersan
dVe
rmee
r(200
0)FF
QTotal
men
aquinones
(MK-4
toMK-1
0)
30.7
�13
.8
Mea
n�
SD
AT:Au
stria
;BL
S:Bu
ndeslebe
nsmittelschl€ ussel;CI:confi
denc
einterval;DE:
German
y;DK:
Den
mark;
ES:Sp
ain;
FFQ:food
freq
uenc
yqu
estio
nnaire;IE:Irelan
d;IQ
R:interqua
rtile
rang
e;MK:
men
aquino
ne;MRI:
Max
Rub
nerInstitu
t;NL:
theNethe
rland
s;NO:Norway
;SD
:stan
dard
deviation;
SE:stan
dard
error;
USD
A:USDep
artm
entof
Agric
ulture;UK:
UnitedKing
dom.
(a):
Presen
tedas
‘vita
min
K’in
thereferenc
eby
Jieet
al.,bu
tassumed
tobe
phylloqu
inon
eba
sedon
thetw
oreferenc
escitedas
source
ofcompo
sitio
nda
ta.
(b):
2000
–200
1da
ta.
(c):
Intake
atvisit2(199
7–20
00).
(d):
Versionof
23.1.200
9.Cu
rren
tve
rsionavailableat:https://www.livsmed
elsverke
t.se/en/food
-and
-con
tent/naringsam
nen/livsm
edelsdatab
asen
(e):
Presen
tedas
‘vita
min
K’in
thereferenc
e,bu
tpe
rson
alcommun
icationfrom
oneof
theau
thorsconfi
rmed
that
compo
sitio
nda
tawereon
phylloqu
inon
e.(f):
Presen
tedas
‘vita
min
K’in
thereferenc
e,bu
tassumed
tobe
phylloqu
inon
e,ba
sedon
inform
ationfrom
Section3.2.1.
(g):
Noinform
ationof
theform
sof
men
aquino
nes.
www.efsa.eu
ropa.eu
/efsajournal
78EFSA
Journal
2017;15(5):478
0
Dietary
reference
values
forvitamin
K