Assessment of the dietary intake of total flavan-3-ols, monomeric flavan-3-ols, proanthocyanidins...
11
Assessment of the dietary intake of total flavan-3-ols, monomeric flavan-3-ols, proanthocyanidins and theaflavins in the European Union Anna Vogiatzoglou 1 , Angela A. Mulligan 2 , Robert N. Luben 2 , Marleen A. H. Lentjes 2 , Christian Heiss 3 , Malte Kelm 3 , Marc W. Merx 3 , Jeremy P. E. Spencer 1 , Hagen Schroeter 4 and Gunter G. C. Kuhnle 1,2 * 1 Department of Food & Nutritional Sciences, University of Reading, Reading RG6 6AP, UK 2 Department of Public Health and Primary Care, University of Cambridge, Cambridge, UK 3 Division of Cardiology, Pulmonology and Vascular Medicine, Medical Faculty, University of Du ¨ sseldorf, Du ¨ sseldorf, Germany 4 Mars, Inc., McLean, VA 22101, USA (Submitted 11 June 2013 – Final revision received 16 October 2013 – Accepted 29 October 2013) Abstract Dietary interventions with flavan-3-ols have shown beneficial effects on vascular function. The translation of these findings into the context of the health of the general public requires detailed information on habitual dietary intake. However, only limited data are currently available for European populations. Therefore, in the present study, we assessed the habitual intake of flavan-3-ol monomers, proantho- cyanidins (PA) and theaflavins in the European Union (EU) and determined their main food sources using the EFSA (European Food Safety Authority) Comprehensive European Food Consumption Database. Data for adults aged 18–64 years were available from fourteen Euro- pean countries, and intake was determined using the FLAVIOLA Flavanol Food Composition Database, developed for the present study and based on the latest US Department of Agriculture and Phenol-Explorer databases. The mean habitual intake of flavan-3-ol monomers, thea- flavins and PA ranged from 181 mg/d (Czech Republic) to 793 mg/d (Ireland). The highest intakes of flavan-3-ol monomers and theaflavins were observed in Ireland (191/505 mg/d) and the lowest intakes in Spain (24/9 mg/d). In contrast, the daily intake of PA was highest in Spain (175 mg/d) and lowest in The Netherlands (96 mg/d). Main sources were tea (62 %), pome fruits (11 %), berries (3 %) and cocoa pro- ducts (3 %). Tea was the major single contributor to monomer intake (75 %), followed by pome fruits (6 %). Pome fruits were also the main source of PA (28%). The present study provides important data on the population-based intake of flavanols in the EU and demonstrates that dietary intake amounts for flavan-3-ol monomers, PA and theaflavins vary significantly across European countries. The average habit- ual intake of flavan-3-ols is considerably below the amounts used in most dietary intervention studies. Key words: Flavanols: Flavan-3-ol monomers: Procyanidins: Theaflavins: Dietary intake: European Food Safety Authority Flavanols are a structurally complex subclass of flavonoids that are present in a number of foods such as pome fruits (e.g. apples and pears), legumes, cocoa, tea and wine. Dietary intervention studies have shown that flavanols can have a beneficial effect on vascular function and could, therefore, reduce the risk of CVD (1–3) ; indeed, the European Food Safety Authority (EFSA) has recently approved a health claim for flavanols (4) . However, flavanols are a complex group of phytonutrients, often considered to include free and gallated flavan-3-ol monomers and oligomeric and polymeric com- pounds known as proanthocyanidins (PA), as well as other derivatives, such as theaflavins and thearubigins (5) . These compounds differ considerably not only in their structural and functional properties, but also in their metabolism and bioavailability (5,6) . While dietary intervention studies have been able to show beneficial effects, results from observational studies have been more ambiguous and inconsistent (7,8) . This can be explained not only by lower intake values in observational studies, but also by differences in the types of flavanols used. Dietary intervention studies have used mainly flavanols derived from specific foods, such as cocoa and grape seed extracts (9) , and have, therefore, focused on very specific com- pounds. Conversely, in observational studies, the intake of flavan-3-ols has often been calculated as that of all flavan-3- ols, even though the main contributor to total flavan-3-ol * Corresponding author: G. G. C. Kuhnle, fax þ 44 118 378 7708, email [email protected] Abbreviations: DP, degree of polymerisation; EFSA, European Food Safety Authority; EPIC, European Prospective Investigation into Cancer and Nutrition; EU, European Union; PA, proanthocyanidin. British Journal of Nutrition, page 1 of 11 doi:10.1017/S0007114513003930 q The Authors 2013 British Journal of Nutrition
-
Upload
uni-duesseldorf -
Category
Documents
-
view
1 -
download
0
Transcript of Assessment of the dietary intake of total flavan-3-ols, monomeric flavan-3-ols, proanthocyanidins...
Assessment of the dietary intake of total flavan-3-ols, monomericflavan-3-ols, proanthocyanidins and theaflavins in the European Union
Anna Vogiatzoglou1, Angela A. Mulligan2, Robert N. Luben2, Marleen A. H. Lentjes2, Christian Heiss3,Malte Kelm3, Marc W. Merx3, Jeremy P. E. Spencer1, Hagen Schroeter4 and Gunter G. C. Kuhnle1,2*1Department of Food & Nutritional Sciences, University of Reading, Reading RG6 6AP, UK2Department of Public Health and Primary Care, University of Cambridge, Cambridge, UK3Division of Cardiology, Pulmonology and Vascular Medicine, Medical Faculty, University of Dusseldorf,
Dusseldorf, Germany4Mars, Inc., McLean, VA 22101, USA
(Submitted 11 June 2013 – Final revision received 16 October 2013 – Accepted 29 October 2013)
Abstract
Dietary interventions with flavan-3-ols have shown beneficial effects on vascular function. The translation of these findings into the context
of the health of the general public requires detailed information on habitual dietary intake. However, only limited data are currently
available for European populations. Therefore, in the present study, we assessed the habitual intake of flavan-3-ol monomers, proantho-
cyanidins (PA) and theaflavins in the European Union (EU) and determined their main food sources using the EFSA (European Food Safety
Authority) Comprehensive European Food Consumption Database. Data for adults aged 18–64 years were available from fourteen Euro-
pean countries, and intake was determined using the FLAVIOLA Flavanol Food Composition Database, developed for the present study and
based on the latest US Department of Agriculture and Phenol-Explorer databases. The mean habitual intake of flavan-3-ol monomers, thea-
flavins and PA ranged from 181 mg/d (Czech Republic) to 793 mg/d (Ireland). The highest intakes of flavan-3-ol monomers and theaflavins
were observed in Ireland (191/505 mg/d) and the lowest intakes in Spain (24/9 mg/d). In contrast, the daily intake of PA was highest in
Spain (175 mg/d) and lowest in The Netherlands (96 mg/d). Main sources were tea (62 %), pome fruits (11 %), berries (3 %) and cocoa pro-
ducts (3 %). Tea was the major single contributor to monomer intake (75 %), followed by pome fruits (6 %). Pome fruits were also the main
source of PA (28 %). The present study provides important data on the population-based intake of flavanols in the EU and demonstrates
that dietary intake amounts for flavan-3-ol monomers, PA and theaflavins vary significantly across European countries. The average habit-
ual intake of flavan-3-ols is considerably below the amounts used in most dietary intervention studies.
Key words: Flavanols: Flavan-3-ol monomers: Procyanidins: Theaflavins: Dietary intake: European Food Safety Authority
Flavanols are a structurally complex subclass of flavonoids
that are present in a number of foods such as pome fruits
(e.g. apples and pears), legumes, cocoa, tea and wine. Dietary
intervention studies have shown that flavanols can have a
beneficial effect on vascular function and could, therefore,
reduce the risk of CVD(1–3); indeed, the European Food
Safety Authority (EFSA) has recently approved a health claim
for flavanols(4). However, flavanols are a complex group of
phytonutrients, often considered to include free and gallated
flavan-3-ol monomers and oligomeric and polymeric com-
pounds known as proanthocyanidins (PA), as well as other
derivatives, such as theaflavins and thearubigins(5). These
compounds differ considerably not only in their structural
and functional properties, but also in their metabolism and
bioavailability(5,6).
While dietary intervention studies have been able to show
beneficial effects, results from observational studies have
been more ambiguous and inconsistent(7,8). This can be
explained not only by lower intake values in observational
studies, but also by differences in the types of flavanols
used. Dietary intervention studies have used mainly flavanols
derived from specific foods, such as cocoa and grape seed
extracts(9), and have, therefore, focused on very specific com-
pounds. Conversely, in observational studies, the intake of
flavan-3-ols has often been calculated as that of all flavan-3-
ols, even though the main contributor to total flavan-3-ol
*Corresponding author: G. G. C. Kuhnle, fax þ44 118 378 7708, email [email protected]
Abbreviations: DP, degree of polymerisation; EFSA, European Food Safety Authority; EPIC, European Prospective Investigation into Cancer and Nutrition;
EU, European Union; PA, proanthocyanidin.
British Journal of Nutrition, page 1 of 11 doi:10.1017/S0007114513003930q The Authors 2013
British
Journal
ofNutrition

intake in the general public, theaflavins, is found neither in
cocoa powder nor in grape seeds.
To investigate the potential health effects of flavanols in
the general public and to determine whether results from
intervention studies could be translated into dietary rec-
ommendations, it is important to obtain accurate information
on habitual intake and main dietary sources. However,
the information currently available(10–15) is limited, as it is
mainly based on observational studies, which are often not
representative of the general public(7,14,16–23). Furthermore,
differences in the interpretation of flavan-3-ols in the nomen-
clature make comparisons difficult. Thus, currently available
information on the estimated dietary intake of flavanols
varies widely and there is a paucity of reliable information
on intake in the general public. Indeed, comprehensive data
on flavan-3-ol intake in a representative sample of the Euro-
pean population are currently not available.
New food composition databases on flavonoids developed
recently(24–26) have opened a new approach for the esti-
mation of dietary flavanol intake and the assessment of
potential health benefits. In the present study, we used
these databases to develop the FLAVIOLA Flavanol Food Com-
position Database, containing information on the flavanol
content of more than 3000 different foods. Using this database
and the recently published Comprehensive European Food
Consumption Database, we determined the habitual dietary
intake of flavanols in a representative sample of European
adults in fourteen European countries.
Subjects and methods
The EFSA Comprehensive European Food Consumption Data-
base is a unique tool that has been built from existing national
information on food consumption. Food consumption data for
adults aged 18–64 years from twenty-one surveys (approxi-
mately 30 000 individuals) are available for fourteen
countries(27). Information concerning the methodologies
used in each survey is given in Table S1 (available online).
Food consumption statistics are reported in g/d and for
chronic consumption. For each country, consumption data
are given according to the first (twenty categories) and
second (140 categories) levels of the FoodEx system and for
the total population(28). The hierarchical food classification
system ‘FoodEx’, developed by the EFSA, was used to codify
all the food items.
To estimate the intake of flavan-3-ols in Europe, we devel-
oped the FLAVIOLA Flavanol Food Composition Database
containing food composition data for approximately 3000
food items. (More information on the database can be found
on the website of the FLAVIOLA project, http://www.flaviola.
org) The mean values of each flavan-3-ol compound are
reported as mg/100 g of fresh weight of edible portion of
food. This database is based on the USDA (US Department of
Agriculture) Database for the Flavonoid Content of Selected
Foods(26) and the PA Content of Selected Foods(25), expanded
with values from the Phenol-Explorer, a comprehensive database
on the polyphenol content of foods(24). These databases are the
most up-to-date databases on flavonoids and polyphenols and
include information on 500, 205 and 456 food items for
flavonoids(26), PA(25) and polyphenols(24), respectively.
We expanded and completed the FLAVIOLA Flavanol Food
Composition Database using DINER (Data Into Nutrients for
Epidemiological Research), a food database created for the
EPIC (European Prospective Investigation into Cancer and
Nutrition)-Norfolk study(29). The EPIC-Norfolk database was
used for the calculation of the estimated flavan-3-ol content of
approximately 2500 food items (82 % of the 3000 total foods).
The flavan-3-ol content of food preparations was calculated
using approximately 800 recipes; retention and cooking factors
for approximately 500 food items were used to estimate the
effect of processing (e.g. frying, boiling and roasting)(30–32).
When information on the ingredients of commercial food
products was provided by the manufacturers, their flavan-3-ol
content was also calculated; where no information was
available, products were matched to similar ones if possible.
Food items thought not to contain significant levels of flavanols
(fish, meat and eggs) were treated as logical zeros and omitted
from the database. Dietary intake was estimated for three major
Table 1. Estimated mean and median flavan-3-ol intakes (mg/d) for adults in the EFSA (European Food Safety Authority) ComprehensiveEuropean Food Consumption Database
Total flavan-3-ols Flavan-3-ol monomers Proanthocyanidins Theaflavins
Mean Median Mean Median Mean Median Mean Median
Belgium 229 5·2 44·6 1 109·3 4·2 75·1 0Czech Republic 180·8 69·4 30·9 15·4 106·6 20·8 43·3 33·2Denmark 318·9 48·5 68·1 9·5 116 38·9 134·9 0Finland 276·6 6·2 56·1 3 115·2 3·2 105·3 0France 289·9 23·8 53 4 143·9 19·8 93 0Germany 503·5 5·7 111·3 1·1 143·5 4·6 248·7 0Hungary 355 187·2 68·4 38·5 141·5 65·4 145·1 83·3Ireland 792·9 701·5 190·7 174·5 97·5 45·8 504·7 481·2Italy 223·7 40·6 28·8 5·4 161·4 35·2 33·5 0Latvia 348·5 182·6 72·2 45·1 112·5 12·5 163·8 125The Netherlands 581·3 321·7 138·5 79·9 96 19·6 346·8 222·2Spain 208 43·6 24 7·4 174·7 36·2 9·2 0Sweden 252·2 72·4 52·4 14·2 100·4 34·4 99·4 23·8UK 600·3 408·1 139·8 100 108·7 36·6 351·8 271·5
A. Vogiatzoglou et al.2
British
Journal
ofNutrition

flavan-3-ol subgroups (flavan-3-ol monomers, PA and
theaflavins) and their seventeen component flavanols: flavan-
3-ol monomers ((2)-epicatechin, (2)-epicatechin-30-gallate,
(þ)-catechin, (2)-epigallocatechin, (2)-epigallocatechin-
30-gallate, (þ)-gallocatechin and (þ)-catechin-30-gallate);
theaflavins (theaflavin, thearubigins, theaflavin-3,30-digallate,
theaflavin-30-gallate and theaflavin-3-gallate); PA (dimers,
trimers, tetramers–hexamers, heptamers–decamers and
. decamers).
The intake of flavan-3-ols was calculated based on the con-
sumption data for each of the 140 categories of the second
level of the FoodEx system. As many categories contain
800 (a) (b)
(c) (d)
100
200
Pro
anth
ocy
anid
ins
(mg
/d)
90
200
20
600
Th
ealf
avin
s (m
g/d
)Fl
avan
-3-o
l mo
no
mer
s (m
g/d
)
To
tal f
lava
n-3
-ols
(m
g/d
)
0
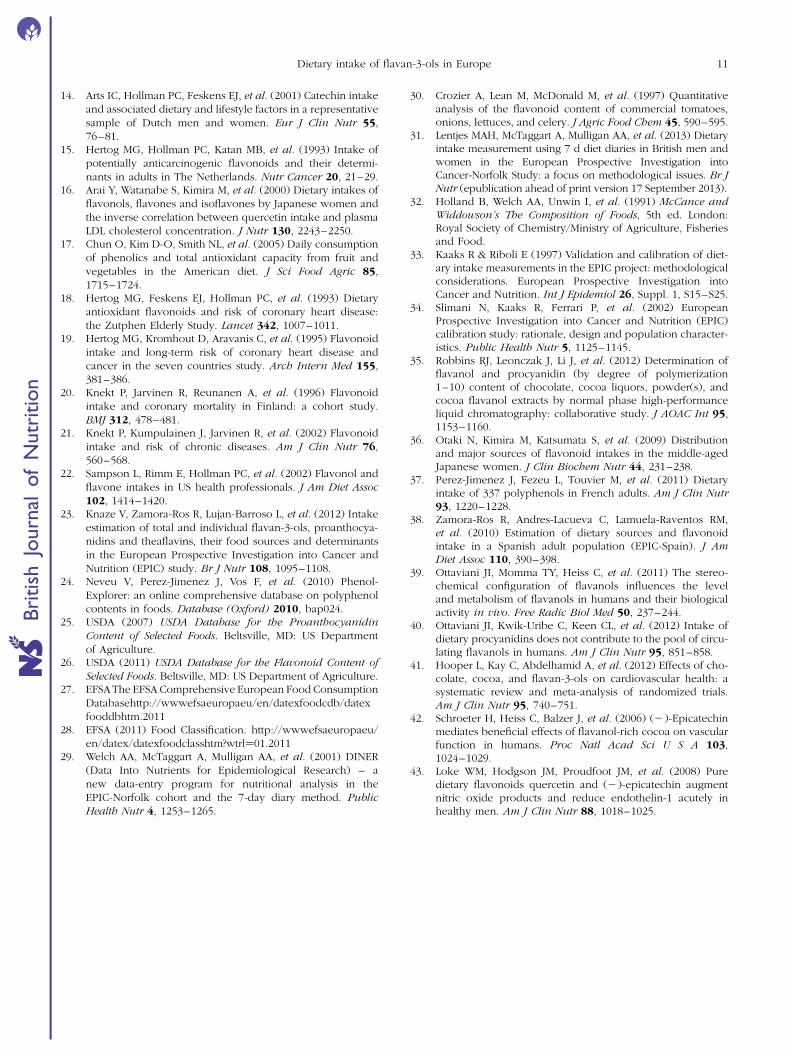
Fig. 1. Estimated intakes (mg/d) of (a) total flavan-3-ols, (b) flavan-3-ol monomers, (c) proanthocyanidins and (d) theaflavins in the European Union.
Table 2. Estimated mean and median flavan-3-ol intakes (mg/d) for adults in the three Europeanregions in the EFSA (European Food Safety Authority) Comprehensive European Food ConsumptionDatabase*
Flavan-3-olsFlavan-3-olmonomers
Proantho-cyanidins Theaflavins
Region Mean Median Mean Median Mean Median Mean Median
Southern 240·5 36 35·2 5·6 160 30·4 45·3 0Central 448·9 235·2 99·5 56·9 114·5 26·2 234·9 152Northern 282·6 42·3 58·8 8·9 110·5 25·5 113·2 7·9
* Southern: Spain, France and Italy; Central: Belgium, Czech Republic, Germany, Hungary, Ireland, Latvia, The Nether-lands and UK; Northern: Denmark, Finland and Sweden.
Dietary intake of flavan-3-ols in Europe 3
British
Journal
ofNutrition

more than one flavan-3-ol-containing food, a weighted aver-
age was used to determine the flavan-3-ol content in each of
these categories. Using a weighted average was necessary,
because rarely consumed foods with high flavan-3-ol-content,
for example, some berries, in a category could result in
an overestimation of intake. The weighing factors were
determined using the FAO food balance sheets for the year
of the survey and the frequency of food consumption
from the EPIC-Norfolk study (see Table S2, available online).
The total flavan-3-ol content of each category was calculated
as the sum of the products of the weighing factor and
flavan-3-ol content of each individual food included in the
respective category.
The estimated mean and median values of flavan-3-ol
intake, as well as a range of minimum and maximum values,
based on the reported upper and lower ranges of food com-
position are reported. Values given in further tables are
based on mean intake values to allow for comparison with
other studies. The European countries represented in the
EFSA comprehensive database were grouped into regions to
allow for observations in each distinctive area (Southern:
Italy, Spain and France; Central: Belgium, Czech Republic,
Germany, Hungary, Ireland, Latvia, The Netherlands and UK;
Northern: Denmark, Finland and Sweden). Unless indicated
otherwise, all the data are given as the mean daily intake of
respective flavan-3-ols.
Results
Estimated daily flavan-3-ol intake
The estimated mean and median daily intakes (mg/d) of total
flavanols as well as of their subgroups for adults in the European
Union (EU) are given in Table 1 and Fig. 1. The mean intake
of total flavan-3-ols ranged from 181 mg/d (Czech Republic) to
793 mg/d (Ireland), whereas the median intake ranged from
5 mg/d (Belgium) to 702 mg/d (Ireland). The average intake
of flavan-3-ols was 369 mg/d in the EU. The mean intake of
the different flavan-3-ol groups was 77 mg/d for monomers,
123 mg/d for PA and 168 mg/d for theaflavins. The highest
intake of monomers was observed in Ireland (191 mg/d) and
the lowest in Spain (24 mg/d). The intake of theaflavins was
highest in Ireland (505 mg/d) and lowest in Spain (9 mg/d). In
contrast, the daily intake of PA was highest in Spain (175mg/d)
and lowest in The Netherlands (96 mg/d). The estimated
mean and median intakes (mg/d) of total flavan-3-ols and
flavan-3-ol subgroups for adults in the three European regions
are summarised in Table 2. The mean intake of total flavan-
3-ols was 241 mg/d in the Southern region, 449 mg/d in the
Central region and 283 mg/d in the Northern region.
The mean daily intake of individual monomers, PA and
theaflavins and their quantitative contribution to total intake
are given in Table 3 and Fig. 2. Theaflavins were the major
contributors to total flavan-3-ol intake (46 %) in the EU,
followed by PA (34 %) and monomers (21 %). The main
flavan-3-ol groups in the Southern region were PA (67 %),
whereas in the Central and Northern regions, theaflavins
were the main contributors (52 and 40 %, respectively). Table
3.
Contr
ibutio
nofin
div
idualfl
avan-3
-ols
and
subgro
ups
offlavan-3
-ols
toto
tali
nta
ke
inth
eE
FS
A(E
uro
pean
Food
Safe
tyA
uth
ority
)C
om
pre
hensi
veE
uro
pean
Food
Consu
mptio
nD
ata
base
for
adults
Euro
pe
South
ern
Centr
al
Nort
hern
Subgro
ups/c
om
pounds
Inta
ke
(mg/d
)
Perc
enta
ge
of
subgro
up
Perc
enta
ge
of
tota
lIn
take
(mg/d
)
Perc
enta
ge
of
subgro
up
Perc
enta
ge
of
tota
lIn
take
(mg/d
)P
erc
enta
ge
of
subgro
up
Perc
enta
ge
of
tota
lIn
take
(mg/d
)P
erc
enta
ge
of
subgro
up
Perc
enta
ge
of
tota
l
Fla
van-3
-olm
onom
ers
77
·020·9
35·2
14
·799
·522
·258·8
20·8
(2)-
Epic
ate
chin
13
·517·5
3·7
11·0
31
·34·6
14
·915
·03·3
12·2
20
·84·3
(2)-
Epic
ate
chin
-30 -
galla
te12
·816·7
3·5
4·0
11
·41·7
17
·717
·83·9
8·8
14
·93·1
(2)-
Epig
allo
cate
chin
17
·222·3
4·7
5·5
15
·72·3
23
·623
·75·3
11·9
20
·14·2
(2)-
Epig
allo
cate
chin
-30 -
galla
te20
·726·9
5·6
5·7
16
·22·4
28
·829
·06·4
14·0
23
·85·0
(þ)-
Cate
chin
10
·213·2
2·8
8·1
23
·13·4
10
·911
·02·4
10·2
17
·33·6
(þ)-
Gallo
cate
chin
2·6
3·3
0·7
0·8
2·2
0·3
3·5
3·5
0·8
1·8
3·0
0·6
Pro
anth
ocyanid
ins
(PA
)123
·433·5
160·0
66
·5114
·525
·5110·5
39·1
PA
dim
mers
23
·218·8
6·3
23·2
14
·59·6
24
·221
·25·4
20·4
18
·57·2
PA
trim
ers
10
·48·5
2·8
14·4
9·0
6·0
9·6
8·4
2·1
8·7
7·8
3·1
PA
tetr
am
ers
–hexam
ers
28
·222·9
7·7
41·4
25
·917
·224
·921
·85·6
23·8
21
·58·4
PA
hepta
mers
–decam
ers
19
·916·1
5·4
28·7
17
·911
·917
·615
·33·9
17·2
15
·56·1
PA
poly
mers
41
·733·8
11·3
52·4
32
·721
·838
·133
·38·5
40·4
36
·614·3
Theaflavin
s168
·245·6
45·3
18
·8234
·952
·3113·2
40·1
Theaflavin
3·0
1·8
0·8
0·8
1·8
0·3
4·2
1·8
0·7
2·0
1·8
0·7
Theaflavin
-3,3
0 -dig
alla
te3·4
2·0
0·9
0·9
2·0
0·4
4·7
2·0
0·8
2·3
2·0
0·8
Theaflavin
-30 -
galla
te2·9
1·7
0·8
0·8
1·7
0·3
4·0
1·7
0·7
2·0
1·7
0·7
Theaflavin
-3-g
alla
te2·4
1·4
0·7
0·6
1·4
0·3
3·4
1·4
0·6
1·6
1·4
0·6
Thearu
big
ins
156
·593·1
42·5
42·1
93
·117
·5218
·693
·137
·3105·3
93
·137·3
A. Vogiatzoglou et al.4
British
Journal
ofNutrition

The individual compounds with the highest intakes were
thearubigins (43 %) and PA polymers (11 %), followed by PA
(tetramers–hexamers) (8 %). This pattern was similar for the
Central and Northern regions, whereas in the Southern
region, PA polymers were the main contributors to flavan-3-
ol intake (22 %).
Major dietary flavan-3-ol sources
The main sources of dietary total flavan-3-ols in the EU were
tea (62 %), pome fruits (11 %), berries (3 %), cocoa products
(3 %) and stone fruits (3 %) (Table 4). Tea was the main con-
tributor to monomer intake (75 %), followed by pome fruits
(6 %), whereas pome fruits were the main sources of PA
(28 %). Table 5 summarises the contributions of the main
food groups to flavan-3-ol intake by country. The main
sources of total flavan-3-ols were non-alcoholic beverages
(46 % in France to 89 % in Ireland), with tea being the major
source for most countries. Fruits were the main contributors
to flavan-3-ol intake in Italy and Spain (42 and 45 % of total
intake, respectively). Alcoholic beverages were also an
important source of flavanols in some other countries, with
wine being the main contributor to total flavan-3-ol intake
within the group of alcoholic beverages.
The main food sources of flavan-3-ols in the Southern
region were fruits (38 %) and non-alcoholic beverages (23 %)
(Table 6 and Fig. 3). In the Central region, non-alcoholic
beverages were the major source of total flavan-3-ols (62 %),
followed by fruits (19 %). Non-alcoholic beverages were also
the main contributors to total flavan-3-ol intake in the North-
ern region (56 %), with fruits making a significant contribution
to flavan-3-ol intake (24 %). The difference in intakes between
European regions was due to variations in tea consumption.
The major source of total flavan-3-ols within the group of
fruits was pome fruits in all the regions; however, the other
important sources of flavan-3-ols varied according to region.
In the Southern region, stone fruits were the second most
important source of flavan-3-ols, whereas in the Northern
region, berries were the second most significant source of
flavan-3-ols within the group of fruits.
Discussion
In the present study, we estimated the habitual intake of
flavan-3-ols and their major food sources in the adult Euro-
pean population. An important strength is the FLAVIOLA
Flavanol Food Composition Database, which has been devel-
oped for the present study: it is based on an amalgamation of
the most recent food composition data from the USDA Data-
base and those from the Phenol-Explorer(24–26), augmented
by data from the EPIC-Norfolk food database, DINER(29),
which provides information on recipes and processing
effects. With more than 3000 food items, the FLAVIOLA
database is one of the most comprehensive food composition
databases for flavanols available. The provision of upper
and lower estimates of intake based on the variability of
Europe South Control North
Fig. 2. Relative contribution of flavan-3-ol subgroups to total flavan-3-ol
intake in Europe and the Southern, Central and Northern subregions. ,
Flavan-3-ol monomers; , proanthocyanidins; , theaflavins.
Table 4. Major food sources of dietary total and individual flavan-3-ols in the EFSA(European Food Safety Authority) Comprehensive European Food ConsumptionDatabase
Compounds Intake (mg/d) Food or food group %
Total flavan-3-ols 230·1 Tea (infusion) 62·438·7 Pome fruits 10·512·6 Berries and small fruits* 3·411·6 Cocoa beans and cocoa products 3·110·9 Stone fruits 2·9
Flavan-3-ol monomers 57·9 Tea (infusion) 75·14·2 Pome fruits 5·52·0 Wine 2·61·4 Berries and small fruits* 1·91·2 Fruit juice 1·2
Proanthocyanidins 34·5 Pome fruits 27·911·2 Berries and small fruits* 9·110·8 Cocoa beans and cocoa products 8·810·1 Stone fruits 8·27·7 Tea (infusion) 6·3
Theaflavins 164·5 Tea (infusion) 97·83·7 Tea and herbs for infusions (solid) 2·2
* Small fruits according to the definition used by the EFSA in the FoodEx system: azarole (Mediterra-nean medlar); bearberries; bilberries or whortleberries; blackberries; blueberries; boysenberries;cloudberries; cranberries; crowberries; currants (red, black and white); dewberries; elderberries;gooseberries; huckleberries; jabuticabas; lingonberries; loganberries; mulberries; physalis;raspberries; rose hips; salmonberries; sea buckthorns; strawberries; strawberry trees; table grapes;thimbleberries; wine grapes; wineberries.
Dietary intake of flavan-3-ols in Europe 5
British
Journal
ofNutrition

food composition data (see Table S3, available online) allows
for a better assessment of the likely range of intake values, in
particular, to investigate potential health effects and make
future recommendations.
There exist some methodological limitations that have to
be taken into consideration when interpreting the results.
The EFSA provides intake data for food groups, but not for
individual foods, and thus food balance sheets and other
information had to be used to address this gap and to improve
the usability of the data available. Furthermore, differences in
the dietary assessment methods (see Table S1, available
online) are likely to introduce a certain degree of bias. Food
records and 24 h recalls, the methods used in the present
study, can result in over- and under-reporting of the intake
of individual food items and thus in systematic bias. Cali-
bration studies to adjust for this, as used, for example, in the
EPIC study(33,34), have not been conducted so far, but would
be important to make better use of the data available. An
additional limitation is the data available on food composition:
these data are often based on a fairly small number of analysis
reports and thus the paucity of standardised and fully vali-
dated analytical methods(6,35) introduces additional variability.
There is also limited information available on food prep-
aration methods, which is, in particular, important for foods
such as tea, for which brewing time and preparation method
may affect the flavan-3-ol content. In the absence of such
information, the average food composition value is used.
Despite these limitations, the present study provides the
most accurate data on flavan-3-ol intake in the EU that are cur-
rently available and, for the first time, allows to estimate the
exposure of the European population to flavan-3-ols and to
investigate the potential impact on health. A key strength of
the present study is based on the fact that the food consump-
tion data used emanated from representative surveys of the
European population, thus reducing the selection bias often
found in observational studies.
A comparison between flavanol intake values determined in
the present study and data from other investigations is challen-
ging, because of a significant divergence in the interpretation
and application of flavanol nomenclature. The intake of
flavan-3-ols in the EU determined in the present study was
77 mg/d, which is lower than the values reported for the
USA (157 mg/d)(10,13), Japan (380 mg/d)(36) and Australia
(422 mg/d)(11). However, the data obtained from Australia
and the USA, but not from Japan, include those on theaflavins,
flavanol derivatives mainly found in tea. The combined intake
of flavan-3-ol monomers and theaflavins in Europe was
245 mg/d and thus higher than that in the USA. Differences
in the interpretation of the nomenclature can, therefore,
result in the over- or underestimation of intake. Within
Europe, the highest intakes of total flavan-3-ols (monomers,
PA and theaflavins) were observed in the Central region due
to the high intake of tea, especially in countries with a tea
culture, such as the UK and Ireland (600 and 793 mg/d,
respectively). Similar results were obtained in the EPIC
study, where the highest intake was found in a UK cohort
(408 mg/d)(23), even though total intake was lower than thatTable
5.
Rela
tive
contr
ibution
of
the
main
food
gro
ups
toto
talflavan-3
-olin
take
by
countr
ies
inadults
Food
gro
ups
and
food
item
sB
elg
ium
Czech
Republic
Denm
ark
Fin
land
Fra
nce
Germ
any
Hungary
Irela
nd
Italy
Latv
iaT
he
Neth
erlands
Spain
Sw
eden
UK
Gra
ins
and
gra
in-b
ased
pro
ducts
5·0
7·0
1·3
1·4
5·2
2·6
1·5
1·4
3·8
3·4
1·9
5·5
8·7
3·1
Vegeta
ble
sand
vegeta
ble
pro
ducts
3·6
38
·31·4
5·8
7·0
1·2
5·2
1·0
4·4
0·0
1·0
31
·00·0
0·0
Sta
rchy
roots
and
tubers
0·0
0·0
0·0
0·0
0·0
0·0
0·0
0·0
0·0
0·0
0·0
0·0
0·0
0·0
Legum
es,
nuts
and
oils
eeds
1·6
3·2
0·6
1·6
3·0
1·5
2·2
0·4
1·6
0·8
0·9
5·7
1·1
2·5
Fru
itand
fruit
pro
ducts
25·7
36
·523
·928
·327·1
17·9
27·5
4·7
41
·822
·66·0
44
·820
·97·2
Meat
and
meat
pro
ducts
0·0
0·2
0·0
0·1
0·0
0·1
0·1
0·0
0·0
0·1
0·0
0·1
0·1
0·0
Milk
and
dairy
pro
ducts
0·9
0·7
1·1
1·4
0·8
0·3
1·1
0·1
0·3
0·4
0·9
1·3
1·1
0·2
Sugar
and
confe
ctionery
5·7
2·0
3·4
3·0
2·6
2·0
1·3
1·5
1·0
2·0
2·5
2·2
3·2
1·6
Fru
itand
vegeta
ble
juic
es
1·4
0·9
1·4
2·9
1·0
2·2
0·6
0·2
0·6
0·6
1·1
1·3
1·7
0·5
Non-a
lcoholic
bevera
ges
47·0
0·1
59
·453
·445·5
69·6
56·9
89
·121
·066
·083
·61·6
56
·582
·1A
lcoholic
bevera
ges
6·8
6·4
7·0
1·7
5·4
2·1
1·3
1·1
6·5
0·4
1·1
3·3
3·8
2·2
Herb
s,
spic
es
and
condim
ents
*1·1
3·7
0·1
0·1
1·3
0·1
2·3
0·4
18
·20·3
0·1
2·1
0·0
0·3
Com
posite
foods†
0·4
0·5
0·0
0·0
0·0
0·1
0·0
0·0
0·1
3·0
0·2
0·1
2·0
0·0
Snacks,
dessert
sand
oth
er
foods
0·8
0·6
0·3
0·3
1·0
0·4
0·0
0·2
0·6
0·4
0·8
0·9
0·7
0·3
*D
ieta
ryassessm
ent
isunsuitable
tom
easure
the
inta
ke
valu
es
for
herb
s,
spic
es
and
condim
ents
accura
tely
,and
these
valu
es
are
,th
ere
fore
,lik
ely
tobe
subje
ct
toa
larg
er
err
or
than
valu
es
for
oth
er
food
gro
ups.
†C
om
posite
foods
accord
ing
toth
edefinitio
nused
by
the
EF
SA
(Euro
pean
Food
Safe
tyA
uth
ority
)in
the
FoodE
xsyste
min
clu
de
the
follo
win
g:
cere
al-based
dis
hes;
rice-b
ased
meals
;pota
to-b
ased
dis
hes;
bean-b
ased
meals
;m
eat-
based
meals
;fish-
and
seafo
od-b
ased
meals
;vegeta
ble
-based
meals
;egg-b
ased
meals
;m
ushro
om
-based
meals
;re
ady-t
o-e
at
soups
and
pre
pare
dsala
ds.
A. Vogiatzoglou et al.6
British
Journal
ofNutrition

Table 6. Relative contribution (%) of food groups and some main foods to the intake of total flavan-3-ols and groups of flavan-3-ols by European region
Total flavanols Total flavan-3-ol monomers Total proanthocyanidins Total theaflavins
Southern Central Northern Southern Central Northern Southern Central Northern Southern Central Northern
Grains and grain-based products 4·9 3·2 3·8 3·0 1·6 1·3 6·8 9·7 8·9 0·0 0·0 0·0Vegetables and vegetable products 14·1 6·3 2·4 10·0 6·6 0·8 16·1 5·7 5·6 25·0 12·6 0·0
Tea and herbs for infusions 1·5 4·0 0·0 3·2 5·8 0·0 0·0 0·0 0·0 25·0 12·6 0·0Cocoa beans and cocoa products 12·6 2·3 2·4 6·7 0·8 0·8 16·1 5·7 5·6 0·0 0·0 0·0
Legumes, nuts and oilseeds 3·4 1·6 1·1 2·6 0·7 0·5 4·5 5·0 2·6 0·0 0·0 0·0Fruit and fruit products 37·9 18·5 24·4 31·3 10·9 14·2 49·3 47·7 54·6 0·0 0·0 0·0
Citrus fruits 1·3 0·4 1·2 2·0 0·4 1·1 1·5 1·1 2·5 0·0 0·0 0·0Pome fruits 19·1 10·8 13·0 16·0 6·0 6·8 24·3 28·0 29·8 0·0 0·0 0·0Stone fruits 11·9 2·1 2·0 7·2 0·9 0·7 15·7 5·3 4·8 0·0 0·0 0·0Berries and small fruits 4·0 3·4 6·8 3·2 1·9 3·7 5·6 8·6 14·9 0·0 0·0 0·0Miscellaneous fruits 0·6 0·3 0·6 2·0 0·6 1·1 0·5 0·6 0·8 0·0 0·0 0·0
Meat and fish 0·0 0·1 0·1 0·1 0·1 0·1 0·1 0·2 0·1 0·0 0·0 0·0Milk and dairy products 0·8 0·6 1·2 1·2 0·5 1·1 1·0 1·6 2·5 0·0 0·0 0·0Sugar and confectionery 1·9 2·3 3·2 1·7 1·4 1·8 2·7 7·3 7·2 0·0 0·0 0·0Fruit and vegetable juices 1·0 0·9 2·0 3·2 2·0 4·7 0·8 1·8 2·6 0·0 0·0 0·0Non-alcoholic beverages 22·7 61·8 56·4 35·9 70·7 68·7 1·7 10·5 5·7 75·0 87·4 100·0
Tea (infusion) 22·4 61·5 55·9 35·4 70·2 67·5 1·4 9·9 4·8 75·0 87·4 100·0Coffee (beverage) 0·0 0·0 0·2 0·2 0·2 0·7 0·0 0·0 0·0 0·0 0·0 0·0Cocoa beverage 0·2 0·2 0·4 0·2 0·2 0·3 0·3 0·4 0·8 0·0 0·0 0·0
Alcoholic beverages 5·1 2·7 4·2 9·3 4·5 5·8 5·9 5·3 7·7 0·0 0·0 0·0Wine 4·8 2·0 3·6 8·0 2·4 4·0 5·8 4·6 7·2 0·0 0·0 0·0Beer and cider 0·2 0·6 0·6 1·1 2·0 1·8 0·1 0·6 0·5 0·0 0·0 0·0
Herbs, spices and condiments 7·2 1·0 0·1 0·3 0·2 0·2 10·0 2·5 0·1 0·0 0·0 0·0Composite foods 0·1 0·5 0·7 0·0 0·2 0·4 0·1 1·5 1·5 0·0 0·0 0·0Snacks, desserts and other foods 0·8 0·4 0·4 1·4 0·5 0·5 1·0 1·2 0·8 0·0 0·0 0·0
Die
taryin
take
of
flav
an-3
-ols
inEuro
pe
7
British Journal of Nutrition

in the present study, which can be explained by differences in
the study population and dietary assessment methods.
For individual subclasses of flavanols also, there were differ-
ences with regard to previously reported data: for example, in
a representative sample of the Dutch population, flavanol
monomer intake was 56 mg/d(14), which is lower than the
values obtained both in the present study and at the EPIC
centres of The Netherlands (139 and 89 mg/d, respectively)(23).
However, this study included an age range (1–93 years) that
was wider than that used in both the EPIC study (35–74
years) and the present study (18–64 years). Furthermore, the
study relied on food composition data for only a limited
number of foods, whereas both the EPIC study and the pre-
sent study used more comprehensive databases. The intake
of PA in the present study was lower than that in the EPIC
study (e.g. in the UK: 109 v. 198 mg/d)(14), and this could be
explained by differences in the dietary patterns of participants
of observational studies and a representative survey. The main
sources of PA in both EPIC study and the present study were
pome fruits. However, there were differences in other major
sources, supporting different dietary patterns as an expla-
nation for differences observed: while wine and stone fruits
were important contributors to total intake in the EPIC
study, berries and cocoa products were important contributors
in the present study. Differences have also been observed in
Scandinavian countries: the intake of flavan-3-ols in Denmark
in the present study was almost twice that reported in the
EPIC-Denmark study (203 v. 106 mg/d)(23), whereas that of
PA was much lower (116 v. 237 mg/d). Results from the
representative Danish Household Consumption Survey(11,12)
indicate an average flavan-3-ol intake of 148 mg/d; however,
the present study used older data and the lower intake
might be explained by differences in the food composition
tables used. In countries of the Southern region (France,
Italy and Spain), PA were the most important contributors to
total flavanol intake. Although the amount of flavan-3-ols con-
sumed was similar in the present study and other studies such
as the EPIC study(23) and the French SU.VI.MAX (Supplemen-
tation en Vitamines et Mineraux Antioxydants) study(37), there
were some discrepancies in the main sources. The EPIC study
identified red wine and tea as the main sources of monomers
in Spain, while the present study found pome fruits and cocoa
products to be the major sources. A possible explanation for
this discrepancy is the circumstance that data for the EPIC
study had been collected 10 years earlier and dietary habits
might have changed.
When stratified by regions, the intake of flavanols in the
Central region was approximately 2-fold higher than that in
the Southern region (451 and 242 mg/d, respectively). Conver-
sely, the intake of PA was found to be higher in the Southern
region due to the higher intake of fruits. The main source of
PA in the Southern region was pome fruits, similar to what
500
450
400
350
300
250
Flav
an-3
-ols
(m
g/d
)
200
150
100
50
0South South South
TheaflavinsProanthocyanidinsFlavan-3-ol monomersTotal flavan-3-ols
Central Central Central CentralNorth North NorthNorthSouth
Fig. 3. Contribution of individual food groups to the intake of total flavan-3-ols and subgroups in the Southern, Central and Northern subregions. , Fruit and
vegetables; , tea; , cocoa products; , alcoholic beverages; , other foods.
A. Vogiatzoglou et al.8
British
Journal
ofNutrition

was reported in the EPIC study(23,38). The major sources of
flavan-3-ols were similar for the Central and Northern regions,
with tea being the main source, while in the Southern region,
fruits, mainly pome and stone fruits, were the main sources.
However, in the Southern and Central regions, the main
source of flavan-3-ols within the group of fruits was pome
fruits, while in the Northern region, berries were the most sig-
nificant source. The main flavan-3-ol groups in the Southern
region were PA (66 %), whereas in the Central and Northern
regions, theaflavins were the most important sources (52 and
40 %, respectively). Monomers contributed 15 % in the
Southern region, 23 % in the Central region and 21 % in the
Northern region.
A comparison of the mean and median intakes of flavan-3-
ols indicated large differences in the distribution of intakes in
different countries. Median intake was lower for all the com-
pounds, indicating a skewed distribution, but this difference
was smallest in the Central region. The largest difference
was found for theaflavins. While the difference between the
mean and median intakes of flavan-3-ols and those of
monomers in Ireland was approximately 10 %, it was almost
100-fold in Germany (504 v. 6 mg/d for total flavan-3-ols and
111 v. 1·1 mg/d for monomers); this is probably due to a
large variation in tea consumption in Germany. For nutrients
with a very skewed distribution of intake, a comparison of
median and mean values is very important to avoid the
over- or underestimation of exposure.
The dietary data obtained in the present study allow for a
comparison of habitual intake in the general public with the
amounts used in dietary intervention studies and thus the
investigation of the potential impact of flavan-3-ol consump-
tion on public health. However, flavan-3-ols used in many
dietary intervention studies are not well characterised by com-
pound-specific analyses and are mainly non-specifically
described by their source, e.g. cocoa and grape seed extracts.
Thus, in the absence of well-characterised foodstuffs and plant
extracts, the absolute and relative content of individual flava-
nols is often not known(1). Therefore, to facilitate meaningful
outcome assessments, it is crucial to analytically characterise
foods used in dietary interventions and to provide specific
information with regard to the content and chemical identity
of compounds hypothesised to be bioactive. Nevertheless,
even the EFSA-approved health claim for cocoa flavanols(4)
– based on an unspecified increase of flow-mediated dilation
– only refers to ‘cocoa flavanols with a degree of polymeri-
sation (DP) from 1 to 10’. As gallated compounds are not
present in cocoa(25,26), this apparently only includes epicate-
chin and catechin monomers, but food processing and other
factors can result in epimerisation and may also affect the
DP, all of which can affect bioavailability and bioactivity(39,40).
Similar difficulties apply to grape seed extracts, where there
is a paucity of information apart from food composition
data (epicatechin, epicatechin-30-gallate, catechin and PA
(dimers–hexamers)), even though differences in extraction
procedures will lead to a significant variance in flavan-3-ol
900(a) (b)
(c) (d)
250
200
150
100
50
0
250
200
150
100
50
0
250
To
tal f
lava
no
ls (
mg
/d)
Flav
an-3
-ols
(m
g/d
)
To
tal P
A (
mg
/d)
Co
coa
flav
ano
ls (
mg
/d)
200
150
100
50
0
700
500
300
100
0
Belgiu
m
Czech
Rep
ublic
Denm
ark
Finlan
d
Fran
ce
Germ
any
Hungary
Irelan
dIta
ly
Latv
ia
The Net
herlan
ds
Spain
Sweden UK
Belgiu
m
Czech
Rep
ublic
Denm
ark
Finlan
d
Fran
ce
Germ
any
Hungary
Irelan
dIta
ly
Latv
ia
The Net
herlan
ds
Spain
Sweden UK
Belgiu
m
Czech
Rep
ublic
Denm
ark
Finlan
d
Fran
ce
Germ
any
Hungary
Irelan
dIta
ly
Latv
ia
The Net
herlan
ds
Spain
Sweden UK
Belgiu
m
Czech
Rep
ublic
Denm
ark
Finlan
d
Fran
ce
Germ
any
Hungary
Irelan
dIta
ly
Latv
ia
The Net
herlan
ds
Spain
Sweden UK
Fig. 4. Estimated mean intake (mg/d) of (a) total flavanols, (b) flavan-3-ols, (c) total procyanidins (PA) and (d) cocoa-flavanols ((2 )-epicatechin, (þ)-catechin and
PA (dimers–decamers)) for adults in the EFSA (European Food Safety Authority) Comprehensive European Food Consumption Database.
Dietary intake of flavan-3-ols in Europe 9
British
Journal
ofNutrition

content. Applying the definition provided above, it was found
that the intake of cocoa flavanols in Europe varied from
84 mg/d (Sweden) to 138 mg/d (Spain), with an average
value of 105 mg/d, an amount well below that used in many
intervention studies (mean 550 mg/d(3); Fig. 4). The intake of
grape seed flavanols was lower, with an average value of
98 mg/d (70 mg/d in the Czech Republic to 132 mg/d in
Ireland), which is also well below the amount used in inter-
vention studies (150–2000 mg/d(9)). Thus, on the one hand,
it seems that the intake of flavan-3-ols in Europe is well
below the intake levels thus far established in the context of
dietary interventions to be required to observe beneficial car-
diovascular effects. Moreover, most Europeans consume less
than 50 % of the 200 mg of cocoa flavanols per d considered
by the EFSA to be sufficient for improved vascular function
and less than 25 % of the 400 mg/d required to observe a
reduction of systolic blood pressure(41). On the other hand,
only the intake of one member of the cocoa flavanol group,
namely (2)-epicatechin, has thus far been reported to be
directly and causally linked to the modulation of vascular
function (flow-mediated dilation)(42,43) Recent data also
demonstrate that while (2)-epicatechin is absorbed and pre-
sent as a phase II metabolite in the systemic circulation, the
absorption of procyanidins (DP 2–10) in humans is negligible
and that these compounds do not contribute to the systemic
pool of flavanol metabolites(40). Thus, if one were to interpret
the opinion of the EFSA on cocoa flavanols based on the
intake of (2)-epicatechin alone, the intake of 200 mg of
cocoa flavanols (DP 1–10) would deliver between 15 and
25 mg of (2)-epicatechin, an amount that many Europeans
already consume as part of their daily diet, thus weakening
the arguments for food benefit claims at intake levels of
200 mg/d. Nevertheless, various other questions and knowl-
edge gaps exist in this context (influence of age, sex, dietary
background and ethnicity on flavanol intake/benefits), and
further research is necessary before the results from controlled
interventions studies can be meaningfully translated into the
context of primary prevention, public health and evidence-
based dietary recommendations. Such efforts will require not
only a more consistent application of flavanol nomenclature
and a better characterisation of foods used in dietary interven-
tions, but also improved methods for dietary assessment, such
as nutritional biomarkers. Only a combination of data from
intervention studies and those from observational studies
will ultimately enable a comprehensive assessment of the
impact of flavan-3-ol intake on public health.
Supplementary material
To view supplementary material for this article, please visit
http://dx.doi.org/10.1017/S0007114513003930
Acknowledgements
The authors thank all the EPIC-Norfolk study participants and
staff for their contribution to the study. They also thank the
members of the FLAVIOLA consortium for their critical
review of the manuscript.
The present study was supported by the EU (grant 226588,
‘Flaviola’) and an unrestricted grant from Mars, Inc. Mars, Inc.
had no role in the design and analysis of the study or in the
writing of this article.
The authors’ contributions are as follows: A. V. conducted
the research, analysed the data and wrote the article; A. A. M.,
R. N. L. and M. A. H. L. conducted the research, analysed
the data and contributed to manuscript preparation; C. H.,
M. K., M. W. M., J. P. E. S. and H. S. analysed the data and con-
tributed to manuscript preparation; G. G. C. K. wrote the
manuscript and had primary responsibility for the final
content. All authors read and approved the final manuscript.
H. S. is employed by MARS, Inc., a member of the
FLAVIOLA research consortium and a company engaged in
flavanol research and flavanol-related commercial activities.
None of the other authors has a conflict of interest to declare.
References
1. Schroeter H, Heiss C, Spencer JPE, et al. (2010) Recommend-ing flavanols and procyanidins for cardiovascular health:current knowledge and future needs. Mol Aspects Med 31,546–557.
2. Ellinger S, Reusch A, Stehle P, et al. (2012) Epicatechiningested via cocoa products reduces blood pressure inhumans: a nonlinear regression model with a Bayesianapproach. Am J Clin Nutr 95, 1365–1377.
3. Ried K, Sullivan T, Fakler P, et al. (2012) Effect of cocoa onblood pressure. Cochrane Database Syst Rev issue 8,CD008893.
4. EFSAPanel onDietetic Products,Nutrition andAllergies (NDA)(2012) Scientific opinion on the substantiation of a healthclaim related to cocoa flavanols and maintenance of normalendothelium-dependent vasodilation pursuant to Article13(5) of Regulation (EC) No. 1924/2006. EFSA J 10, 2809–2830.
5. Santos-Buelga C & Scalbert A (2000) Proanthocyanidins andtannin-like compounds: nature, occurrence, dietary intakeand effects on nutrition and health. J Sci Food Agric 80,1094–1117.
6. Manach C, Williamson G, Morand C, et al. (2005) Bioavail-ability and bioefficacy of polyphenols in humans. I. Reviewof 97 bioavailability studies. Am J Clin Nutr 81, 230S–242S.
7. Cassidy A, Rimm EB, O’Reill EJ, et al. (2012) Dietary flavo-noids and risk of stroke in women. Stroke 43, 946–951.
8. Cassidy A, O’Reilly EJ, Kay C, et al. (2011) Habitual intake offlavonoid subclasses and incident hypertension in adults.Am J Clin Nutr 93, 338–347.
9. Feringa HHH, Laskey DA, Dickson JE, et al. (2011) The effectof grape seed extract on cardiovascular risk markers: a meta-analysis of randomized controlled trials. J Am Diet Assoc 111,1173–1181.
10. Chun OK, Chung SJ & Song WO (2007) Estimated dietary fla-vonoid intake and major food sources of U.S. adults. J Nutr137, 1244–1252.
11. Johannot L & Somerset SM (2006) Age-related variations inflavonoid intake and sources in the Australian population.Public Health Nutr 9, 1045–1054.
12. Justesen U, Knuthsen P & Leth T (1997) Determination ofplant polyphenols in Danish foodstuffs by HPLC–UV andLC–MS detection. Cancer Lett 114, 165–167.
13. Wang Y, Chung SJ, Song WO, et al. (2011) Estimation of dailyproanthocyanidin intake and major food sources in the U.S.diet. J Nutr 141, 447–452.
A. Vogiatzoglou et al.10
British
Journal
ofNutrition
14. Arts IC, Hollman PC, Feskens EJ, et al. (2001) Catechin intakeand associated dietary and lifestyle factors in a representativesample of Dutch men and women. Eur J Clin Nutr 55,76–81.
15. Hertog MG, Hollman PC, Katan MB, et al. (1993) Intake ofpotentially anticarcinogenic flavonoids and their determi-nants in adults in The Netherlands. Nutr Cancer 20, 21–29.
16. Arai Y, Watanabe S, Kimira M, et al. (2000) Dietary intakes offlavonols, flavones and isoflavones by Japanese women andthe inverse correlation between quercetin intake and plasmaLDL cholesterol concentration. J Nutr 130, 2243–2250.
17. Chun O, Kim D-O, Smith NL, et al. (2005) Daily consumptionof phenolics and total antioxidant capacity from fruit andvegetables in the American diet. J Sci Food Agric 85,1715–1724.
18. Hertog MG, Feskens EJ, Hollman PC, et al. (1993) Dietaryantioxidant flavonoids and risk of coronary heart disease:the Zutphen Elderly Study. Lancet 342, 1007–1011.
19. Hertog MG, Kromhout D, Aravanis C, et al. (1995) Flavonoidintake and long-term risk of coronary heart disease andcancer in the seven countries study. Arch Intern Med 155,381–386.
20. Knekt P, Jarvinen R, Reunanen A, et al. (1996) Flavonoidintake and coronary mortality in Finland: a cohort study.BMJ 312, 478–481.
21. Knekt P, Kumpulainen J, Jarvinen R, et al. (2002) Flavonoidintake and risk of chronic diseases. Am J Clin Nutr 76,560–568.
22. Sampson L, Rimm E, Hollman PC, et al. (2002) Flavonol andflavone intakes in US health professionals. J Am Diet Assoc102, 1414–1420.
23. Knaze V, Zamora-Ros R, Lujan-Barroso L, et al. (2012) Intakeestimation of total and individual flavan-3-ols, proanthocya-nidins and theaflavins, their food sources and determinantsin the European Prospective Investigation into Cancer andNutrition (EPIC) study. Br J Nutr 108, 1095–1108.
24. Neveu V, Perez-Jimenez J, Vos F, et al. (2010) Phenol-Explorer: an online comprehensive database on polyphenolcontents in foods. Database (Oxford) 2010, bap024.
25. USDA (2007) USDA Database for the ProanthocyanidinContent of Selected Foods. Beltsville, MD: US Departmentof Agriculture.
26. USDA (2011) USDA Database for the Flavonoid Content ofSelected Foods. Beltsville, MD: US Department of Agriculture.
27. EFSAThe EFSA Comprehensive European Food ConsumptionDatabasehttp://wwwefsaeuropaeu/en/datexfoodcdb/datexfooddbhtm.2011
28. EFSA (2011) Food Classification. http://wwwefsaeuropaeu/en/datex/datexfoodclasshtm?wtrl¼01.2011
29. Welch AA, McTaggart A, Mulligan AA, et al. (2001) DINER(Data Into Nutrients for Epidemiological Research) – anew data-entry program for nutritional analysis in theEPIC-Norfolk cohort and the 7-day diary method. PublicHealth Nutr 4, 1253–1265.
30. Crozier A, Lean M, McDonald M, et al. (1997) Quantitativeanalysis of the flavonoid content of commercial tomatoes,onions, lettuces, and celery. J Agric Food Chem 45, 590–595.
31. Lentjes MAH, McTaggart A, Mulligan AA, et al. (2013) Dietaryintake measurement using 7 d diet diaries in British men andwomen in the European Prospective Investigation intoCancer-Norfolk Study: a focus on methodological issues. Br JNutr (epublication ahead of print version 17 September 2013).
32. Holland B, Welch AA, Unwin I, et al. (1991) McCance andWiddowson’s The Composition of Foods, 5th ed. London:Royal Society of Chemistry/Ministry of Agriculture, Fisheriesand Food.
33. Kaaks R & Riboli E (1997) Validation and calibration of diet-ary intake measurements in the EPIC project: methodologicalconsiderations. European Prospective Investigation intoCancer and Nutrition. Int J Epidemiol 26, Suppl. 1, S15–S25.
34. Slimani N, Kaaks R, Ferrari P, et al. (2002) EuropeanProspective Investigation into Cancer and Nutrition (EPIC)calibration study: rationale, design and population character-istics. Public Health Nutr 5, 1125–1145.
35. Robbins RJ, Leonczak J, Li J, et al. (2012) Determination offlavanol and procyanidin (by degree of polymerization1–10) content of chocolate, cocoa liquors, powder(s), andcocoa flavanol extracts by normal phase high-performanceliquid chromatography: collaborative study. J AOAC Int 95,1153–1160.
36. Otaki N, Kimira M, Katsumata S, et al. (2009) Distributionand major sources of flavonoid intakes in the middle-agedJapanese women. J Clin Biochem Nutr 44, 231–238.
37. Perez-Jimenez J, Fezeu L, Touvier M, et al. (2011) Dietaryintake of 337 polyphenols in French adults. Am J Clin Nutr93, 1220–1228.
38. Zamora-Ros R, Andres-Lacueva C, Lamuela-Raventos RM,et al. (2010) Estimation of dietary sources and flavonoidintake in a Spanish adult population (EPIC-Spain). J AmDiet Assoc 110, 390–398.
39. Ottaviani JI, Momma TY, Heiss C, et al. (2011) The stereo-chemical configuration of flavanols influences the leveland metabolism of flavanols in humans and their biologicalactivity in vivo. Free Radic Biol Med 50, 237–244.
40. Ottaviani JI, Kwik-Uribe C, Keen CL, et al. (2012) Intake ofdietary procyanidins does not contribute to the pool of circu-lating flavanols in humans. Am J Clin Nutr 95, 851–858.
41. Hooper L, Kay C, Abdelhamid A, et al. (2012) Effects of cho-colate, cocoa, and flavan-3-ols on cardiovascular health: asystematic review and meta-analysis of randomized trials.Am J Clin Nutr 95, 740–751.
42. Schroeter H, Heiss C, Balzer J, et al. (2006) (2)-Epicatechinmediates beneficial effects of flavanol-rich cocoa on vascularfunction in humans. Proc Natl Acad Sci U S A 103,1024–1029.
43. Loke WM, Hodgson JM, Proudfoot JM, et al. (2008) Puredietary flavonoids quercetin and (2)-epicatechin augmentnitric oxide products and reduce endothelin-1 acutely inhealthy men. Am J Clin Nutr 88, 1018–1025.
Dietary intake of flavan-3-ols in Europe 11
British
Journal
ofNutrition