Comparison of backbone dynamics of monomeric and domain-swapped stefin A
13
Comparison of Backbone Dynamics of Monomeric and Domain-Swapped Stefin A Bos ˇtjan Japelj, 1 Jonathan P. Waltho, 2 and Roman Jerala 1, * 1 Laboratory of Biotechnology, National Institute of Chemistry, Hajdrihova 19, 1000 Ljubljana, Slovenia 2 Krebs Institute, Department of Molecular Biology and Biotechnology, University of Sheffield, Sheffield, United Kingdom ABSTRACT Three-dimensional domain swap- ping has been observed in increasing number of proteins and has been implicated in the initial stages of protein aggregation, including that of the cystatins. Stefin A folds as a monomer under native conditions, while under some denaturing conditions domain-swapped dimer is formed. We have determined the backbone dynamics of the monomeric and domain-swapped dimeric forms of stefin A by 15 N relaxation using a model-free ap- proach. The overall correlation times of the mol- ecules were determined to be 4.6 0.1 ns and 9.2 0.2 ns for the monomer and the dimer, respec- tively. In the monomer, decreased order parame- ters indicate an increased mobility for the N- terminal trunk, the first and the second binding loops. At the opposite side of the molecule, the loop connecting the -helix with strand B, the beginning of strand B and the loop connecting strands C and D show increased localized mobil- ity. In the domain-swapped dimer, a distinctive feature of the structure is the concatenation of strands B and C into a single long -strand. The newly formed linker region between strands B and C, which substitutes for the first binding loop in the monomer, has order parameters typical for the remainder of the -strands. Thus, the interaction between subunits that occurs on domain-swap- ping has consequences for the dynamics of the protein at long-range from the site of conforma- tional change, where an increased rigidity in the newly formed linker region is accompanied by an increased mobility of loops remote from that site. Proteins 2004;54:500 –512. © 2004 Wiley-Liss, Inc. Key words: domain swapping; relaxation; order pa- rameter; NMR spectroscopy; diffusion; chemical exchange INTRODUCTION Stefin A is a member of the cystatin superfamily of proteins, which can be subdivided into three families: stefins, cystatins, and kininogens. 1 It acts as a tight and reversible inhibitor of the papain-like cysteine proteases. These inhibitors are involved in the control mechanism responsible for protein breakdown and thus protect cells from inappropriate endogenous and external proteolysis. Members of the stefin family lack disulphide bonds and glycosylation, and have a molecular mass of approximately 11 kDa. The most abundant source of stefin A is polymorpho- nuclear leucocytes, but it can be also found in squamous epithelia from the mouth, 2 esophagus, and vagina, 3 and in the stratum corneum and granulosum of the epidermis. 4 The localization of the inhibitor correlates with the first line of defense against pathogenic organisms, and indi- cates the important protective function of stefin A as an inhibitor of the cysteine proteases used as invasive tools by some infective agents. Stefin A is also involved in a number of disease states, such as epimeroid carcinomas (including squamous cell carcinomata of the esophagus, lung, skin, vulva, and cervix), where the cause is either its expression as a less active isoform or a lower level of expression. 5 Furthermore, a significant increase of the serum level of stefin A has been observed in patients with cardiovascular disease. 6 An increased concentration of the inhibitor has also been found in the upper spinous layer of psoriatic cells. 7 Under native conditions stefin A folds as a monomer that consists of a five-stranded anti-parallel –sheet exhib- iting a right-handed twist, which is wrapped around a central – helix. 1 The helix is approximately perpendicu- lar to the strands of the –sheet (Fig. 1). A C-terminal tail runs along the convex side of the –sheet. A dimer of stefin A can be formed under destabilizing conditions, such as in the temperature range from 74 to 93°C, by the presence of chemical denaturant (e.g., GdnHCl at concentrations above 2.7 M) or at pH values below 2.5. The dimerization of stefin A occurs via a three-dimensional domain swapping mecha- nism. In this mechanism two (or more) protein molecules form a dimer (or higher oligomer) by exchanging an identical structural element (the “domain”). 8 The swapped domain can be either a globular domain or a more simple structural element of one subunit and extends into an- other subunit where it interacts with the same elements Abbreviations: NOE, nuclear Overhauser effect; HSQC, hetero- nuclear single quantum coherence; CLEANEX-PM, phase modulated CLEAN chemical exchange; ROE, rotating frame Overhauser effect; TOCSY, total correlation spectroscopy; FHSQC, fast HSQC; PFG, pulsed-field gradient. *Correspondence to: Roman Jerala, Laboratory of Biotechnology, National Institute of Chemistry, Hajdrihova 19, POB 660 1000 Ljubljana, Slovenia. E-mail: [email protected] Received 14 March 2003; Accepted 31 July 2003 PROTEINS: Structure, Function, and Bioinformatics 54:500 –512 (2004) © 2004 WILEY-LISS, INC.
Transcript of Comparison of backbone dynamics of monomeric and domain-swapped stefin A

Comparison of Backbone Dynamics of Monomeric andDomain-Swapped Stefin ABostjan Japelj,1 Jonathan P. Waltho,2 and Roman Jerala1,*1Laboratory of Biotechnology, National Institute of Chemistry, Hajdrihova 19, 1000 Ljubljana, Slovenia2Krebs Institute, Department of Molecular Biology and Biotechnology, University of Sheffield, Sheffield, United Kingdom
ABSTRACT Three-dimensional domain swap-ping has been observed in increasing number ofproteins and has been implicated in the initialstages of protein aggregation, including that ofthe cystatins. Stefin A folds as a monomer undernative conditions, while under some denaturingconditions domain-swapped dimer is formed. Wehave determined the backbone dynamics of themonomeric and domain-swapped dimeric forms ofstefin A by 15N relaxation using a model-free ap-proach. The overall correlation times of the mol-ecules were determined to be 4.6 � 0.1 ns and 9.2 �0.2 ns for the monomer and the dimer, respec-tively. In the monomer, decreased order parame-ters indicate an increased mobility for the N-terminal trunk, the first and the second bindingloops. At the opposite side of the molecule, theloop connecting the �-helix with strand B, thebeginning of strand B and the loop connectingstrands C and D show increased localized mobil-ity. In the domain-swapped dimer, a distinctivefeature of the structure is the concatenation ofstrands B and C into a single long �-strand. Thenewly formed linker region between strands B andC, which substitutes for the first binding loop inthe monomer, has order parameters typical for theremainder of the �-strands. Thus, the interactionbetween subunits that occurs on domain-swap-ping has consequences for the dynamics of theprotein at long-range from the site of conforma-tional change, where an increased rigidity in thenewly formed linker region is accompanied by anincreased mobility of loops remote from that site.Proteins 2004;54:500–512. © 2004 Wiley-Liss, Inc.
Key words: domain swapping; relaxation; order pa-rameter; NMR spectroscopy; diffusion;chemical exchange
INTRODUCTION
Stefin A is a member of the cystatin superfamily ofproteins, which can be subdivided into three families:stefins, cystatins, and kininogens.1 It acts as a tight andreversible inhibitor of the papain-like cysteine proteases.These inhibitors are involved in the control mechanismresponsible for protein breakdown and thus protect cellsfrom inappropriate endogenous and external proteolysis.Members of the stefin family lack disulphide bonds and
glycosylation, and have a molecular mass of approximately11 kDa.
The most abundant source of stefin A is polymorpho-nuclear leucocytes, but it can be also found in squamousepithelia from the mouth,2 esophagus, and vagina,3 and inthe stratum corneum and granulosum of the epidermis.4
The localization of the inhibitor correlates with the firstline of defense against pathogenic organisms, and indi-cates the important protective function of stefin A as aninhibitor of the cysteine proteases used as invasive tools bysome infective agents. Stefin A is also involved in anumber of disease states, such as epimeroid carcinomas(including squamous cell carcinomata of the esophagus,lung, skin, vulva, and cervix), where the cause is either itsexpression as a less active isoform or a lower level ofexpression.5 Furthermore, a significant increase of theserum level of stefin A has been observed in patients withcardiovascular disease.6 An increased concentration of theinhibitor has also been found in the upper spinous layer ofpsoriatic cells.7
Under native conditions stefin A folds as a monomerthat consists of a five-stranded anti-parallel �–sheet exhib-iting a right-handed twist, which is wrapped around acentral �–helix.1 The helix is approximately perpendicu-lar to the strands of the �–sheet (Fig. 1). A C-terminal tailruns along the convex side of the �–sheet. A dimer of stefinA can be formed under destabilizing conditions, such as inthe temperature range from 74 to 93°C, by the presence ofchemical denaturant (e.g., GdnHCl at concentrations above2.7 M) or at pH values below 2.5. The dimerization of stefinA occurs via a three-dimensional domain swapping mecha-nism. In this mechanism two (or more) protein moleculesform a dimer (or higher oligomer) by exchanging anidentical structural element (the “domain”).8 The swappeddomain can be either a globular domain or a more simplestructural element of one subunit and extends into an-other subunit where it interacts with the same elements
Abbreviations: NOE, nuclear Overhauser effect; HSQC, hetero-nuclear single quantum coherence; CLEANEX-PM, phase modulatedCLEAN chemical exchange; ROE, rotating frame Overhauser effect;TOCSY, total correlation spectroscopy; FHSQC, fast HSQC; PFG,pulsed-field gradient.
*Correspondence to: Roman Jerala, Laboratory of Biotechnology,National Institute of Chemistry, Hajdrihova 19, POB 660 1000Ljubljana, Slovenia. E-mail: [email protected]
Received 14 March 2003; Accepted 31 July 2003
PROTEINS: Structure, Function, and Bioinformatics 54:500–512 (2004)
© 2004 WILEY-LISS, INC.

that it would in the monomer. The swapped domain andthe main domain are connected by a hinge loop, which isthe only part of the molecule that has a different conforma-tion in the monomer and the dimer. The interface betweenthe swapped domain and the main domain that exists inboth monomer and domain swapped dimer is termed theclosed interface. The interface that exists only in thedomain swapped dimer is termed the open interface.
The number of crosspeaks observed in a 2D 1H-15NHSQC NMR spectrum of the domain-swapped stefin Adimer remains the same as for the monomer, indicatingthat the dimer is symmetric. Although a large conforma-tional change must occur to generate the dimer from themonomer, when the 1H-15N HSQC spectrum of the dimeris compared to that of the monomer, most crosspeaks (73 of93) are in identical positions or only minimally shifted.Again this behavior is a consequence of symmetry of thedimer since most residues are in the same chemicalenvironment, although this environment consists of atomsfrom both subunits in the dimer. The larger chemical shiftdifferences are, in the most part, localized in the region ofthe first binding loop, the second binding loop, and on theN-terminal trunk,9 where the largest conformational
changes occur. The stefin A dimer is formed by theexchange of approximately half of the molecule by theswapping of a domain consisting of strand A, strand B, andthe �–helix (Fig. 2).
Investigations of self-association phenomena have provedimportant for the understanding of conformational dis-eases, i.e., diseases that are strongly associated with aconformational change within a protein. Conformationaltransitions within proteins are often coupled to self-association and can result in different biological activity.Some examples of the pathological consequences of suchself-associations include prion protein aggregates in trans-missible spongiform encephalopathies,10,11 �-amyloid de-posits in Alzheimer’s disease,12 and aggregates of cystatinC in hereditary cystatin C amyloid angiopathy.13,14 Thephysiological importance of the formation of dimers ofstefin A is exhibited by the inactivation of the dimer as aprotease inhibitor, by its altered ability to be incorporatedinto the polymerized cell envelope, and by the formation ofstructured aggregates that may lead to an accumulation ofamyloids. A possible mechanism by which domain swap-ping within stefin A may be involved in the formation oflarger associates has been proposed previously.15 We are
Fig. 1. Tertiary (left) and secondary (right) structure of stefin A monomer. Five stranded antiparallel�–sheet is wrapped around central �–helix. C-terminal loop runs along convex face of the �–sheet. N-terminaltrunk, 1. and 2. binding loop form a tripartite wedge, which interacts with the active site of the target protease.Figure created with the program MOLMOL.57
Fig. 2. Tertiary structure of stefin A dimer. Homodimer consists of two symmetrical subunits depicted indifferent shade, which are connected with a short linker region. One domain consists of strand A, �–helix, andstrand B of one subunit and strands C, D, and E of another subunit.
DYNAMICS OF MONOMERIC AND DIMERIC STEFIN A 501

specifically interested in the changes in protein dynamicsthat occur as a result of domain swapping, and theinfluence that such changes may have on the properties ofdomain-swapped oligomers. In this study, we have investi-gated the backbone dynamics of the monomer and thedomain-swapped dimer of stefin A.
TheoryOrder parameters
The dipolar interaction between a heteronucleus and itsdirectly attached 1H spin, and chemical shift anisotropyare the dominant mechanisms in the relaxation of proton-ated heteronuclei.16 The relaxation parameters of theamide 15N spin can be written as linear combinations ofspectral density function at different frequencies.17
A spectral density function for an axially symmetricdiffusion tensor with site-specific motion on two timescales can be written as:18–21
J��� �25 �
j�1
3
Aj� S2�j
1 � ���j�2 �
�1 � Sf2���f
1 � ����f�2 �
�Sf2 � S2���s
1 � ����s�2 �
(1)
where S2 � Sf2Ss
2 is the square of the generalized orderparameter characterizing the amplitude of internal mo-tions, and Sf
2 and Ss2 are squares of the order parameters
for the motions on the fast (�f 200 ps) and slow (�s 200ps) time scales, respectively. �1
�1 � 6D�, �2�1 � D� �
5D�, �3�1 � 4D� � 2D�, and ��s � �j�e/(�j � �e), where �e is
either �s or �f. � is the angle between the N-H bond vectorand the unique axis of the diffusion tensor, and A1 � (3cos2� � 1)2/4, A2 � 3 sin2� cos2�, A3 � (3/4)sin4�. Fastinternal motions are defined as those for which �/[1 (��)2] is within 10% of �e and � � �m�e/(�m � �e).
MATERIALS AND METHODSProtein Preparation and Isolation of Dimer
Human stefin A was expressed and purified as previ-ously described.24,25 The monomeric and dimeric formswere separated by size-exclusion chromatography on aSuperdex 75 column (Amersham-Pharmacia), eluted witha 20 mM potassium phosphate buffer at pH 6.0, whichcontained 0.1 M KCl. The purity of fractions of themonomer and the dimer was evaluated from chromato-grams and using PAGE. Samples of the monomer and thedimer contained less than 2% of the other form. Thehomogeneity of the sample was also confirmed by theabsence of crosspeaks corresponding to the dimer and themonomer in NMR spectra of the monomer and the dimerrespectively. 15N isotopically enriched protein was pre-pared using M9 minimal medium with [15N]NH4Cl (Spec-tra Stable Isotopes) at a concentration of 1gL as the solesource of nitrogen.
NMR ExperimentsRelaxation measurements
Experiments were performed on Varian Unity INOVA600 MHz spectrometer equipped with z-gradients and a
triple resonance probe, using a sample temperature of30°C. Prior to NMR measurements, the monomeric anddimeric forms of stefin A were concentrated in 10 mMpotassium phosphate buffer (pH 6.5) and 100 mM KCl,0.02% sodium azide, using Centricon ultrafiltration tubes.The final proteins concentrations were 1.2 mM and 0.89mM for the monomer and the dimer, respectively. Thespectral width of the HSQC spectra was 8000 Hz in thedirect (1HN) and 2000 Hz in the indirect (15N) dimension. Atotal of 64 increments was recorded for the indirectdimension. States-time proportional phase incrementmethod was used for quadrature detection. The 1H carrierwas set to the frequency of the water resonance and 15Ncarrier was positioned to the middle of the amide region.Longitudinal relaxation (T1) experiments were performedusing sensitivity-enhanced inversion-recovery pulse se-quences with pulsed field gradients,61 acquiring 1024 � 64points in t2 and t1 respectively. 32 scans per t1 incrementwere recorded. For the monomer, delay times of 20 (� 2),200 (� 2), 400, 600 (� 2), 800 and 1200 ms were used, andfor the dimer, the delay times were 100 (� 2), 200 (� 2),300, 400, 500, 600, 700, 800, 900 and 1000 ms (� 2designates duplicate recording of spectra). Transverserelaxation (T2) experiments were performed using a sensi-tivity-enhanced Carr-Purcell-Meiboom-Gill pulse sequencewith pulsed field gradients.61 The acquisition parameterswere identical to those of the T1 experiment except that 48scans per t1 increment were recorded for the dimer. For themonomer, delay times of 10 (� 2), 30, 50, 70, 90, 110 (� 2),130, 150 and 190 ms were used, and for the dimer, thedelay times were 10, 30 (� 2), 50 (� 2), 70, 90, 110 and 150ms. For the NOE measurements 1024 � 64 complex pointswere acquired in t2 and t1 respectively. Ninty-six (96)scans per t1 increment were recorded. 15N-{1H} steady-state NOE values were obtained by recording spectra withand without a proton presaturation period of 3 s appliedbefore the start of the 1H-15N HSQC experiment. The15N-{1H} NOE intensity ratios were measured by interleav-ing the NOE and reference experiments.
CLEANEX-PM ExperimentsCLEANEX-PM
Artifacts in chemical exchange experiments caused byNOE/ROE from rapidly exchanging protons, intramolecu-lar NOE/ROE peaks from the C�H protons whose chemicalshift coincides with water and TOCSY interactions can besuccessively suppressed by the use of the phase-modulatedCLEAN chemical exchange spectroscopy (CLEANEX-PM)22,23 sequence. This consists of the water selective 90°-G1- 180° -G1 combination, which selectively excites waterwhile the spins outside the 180° excitation profile aredephased by the use of gradients. In the mixing period, theCLEANEX-PM spin-locking 135°(�)-120°(-�)-110°(�)-110°(-�)-120°(�)-135°(-�) module is applied. In this pe-riod chemical exchange between amide protons and wateris present. The pulses of the spin-lock cancel NOE andROE artifacts by moving magnetizations to different angles.Complete cancellation within � 0.5�B1 bandwidth cannotbe achieved due to-off resonance effects. Residual peak
502 B. JAPELJ ET AL.

intensities remain within the noise level. The spin-lockingmodule is followed by a fast-HSQC. A water flip-back pulseis applied to move water back to z direction followed by a3-9-19 WATERGATE sequence, which suppresses theresidual water resonance.
The pulse sequence implemented for a Varian spectrom-eter was obtained from Lewis Kay (Toronto). 1024 � 64points were acquired in t2 and t1 respectively with 64 scansper t1 increment. Quantification of NH-exchange rates wasperformed according to theory.26–29 Exchange rate con-stants (k) were determined by fitting the following bi-exponential equation to experimental peak intensities:
II0
�k
R1A,app � k � R1B,app
� �exp��R1B,app��M � exp�R1A,app � k��M� (2)
where k is the normalized rate constant, �M is the mixingtime, I are amide crosspeak intensities at mixing times of5, 10, 15, and 20 ms and I0 is the intensity from thereference fast-HSQC spectrum. Approximate R1A,app andR1B,app values were also determined using equation 2,although it should be noted that the data recorded atmixing times up to 20 ms do not allow the accurate fittingof R1A,app, which is a combination of longitudinal andtransverse relaxation rates.23 Measured k values werecorrected by dividing them by 0.85 because of the effect ofwater saturation (see Results section).
NMR Self-Diffusion Measurements
Translational diffusion rates were measured using aPFG-LED experiment based on the stimulated echo ap-proach,30 using the pulse sequence described by Dingley.31
The gradient strength of the probe was calibrated on theHDO signal. Monomeric and dimeric stefin A were sepa-rately dissolved in 20 mM K-phosphate buffer in D2O andthe solutions adjusted to a pH* of 6.0. Experiments wereperformed with a diffusion time of 150 ms at 20 differentgradient strengths in the range 0–30 Gcm. Well-resolvedprotein resonances at seven different frequencies weremeasured and the results were analyzed by nonlinearregression using the program Origin (Microcal), accordingto the equation: R � exp(��2G2D�2(� � �3)).
NMR Data Processing and Analysis
NMR data were processed and analyzed on a SiliconGraphics INDIGO workstation using the program Fe-lix2001 (Accelrys). Shifted sinebell-squared apodizationwas applied to the t1 dimension and shifted sinebellapodization was applied to the t2 dimension prior toFourier transformation. Resonance intensities rather thanintegrated peak volumes were used to determine relax-ation rates owing to a small degree of resonance overlap.Peak heights were measured from the NMR spectra usingan in-house modification of the multiquant.mac routine(from Arthur Palmer, Columbia University) written in theFelix macro programming language. Uncertainties in peakintensities were determined from duplicate spectra asdescribed previously.32,33 Peak heights were fitted as a
mono-exponential function of the form I � I0e�Rt (whereR is either R1 � 1/T1 or R2 � 1/T2) of relaxation delay,using a Levenberg-Marquadt nonlinear least squares algo-rithm as implemented in the program CURVEFIT (ArthurPalmer, Columbia University). The NOE was calculatedas NOE � � � 1 � (Ipresat/Ino-presat), where Ipresat andIno�presat are the peak heights with and without 1Hpresaturation, respectively.
Rotational Diffusion Anisotropy
In order to separate the contributions to relaxation ofthe overall rotation of the molecule from site-specificinternal motions, an analysis of overall rotation wasperformed. The overall correlation time was calculated asthe trimmed mean value of the residue-specific localcorrelation times, which were calculated from R2R1 ratiosusing the program R2R1_�M (Arthur Palmer, ColumbiaUniversity). The program solves the equation (R2/R1) �(4J(0) � J(�X � �H) � 3J(�X) � 6J(�H) � 6J(�X ��H) � (c2/3d2)(4J(0) � 3J(�X))/(2J(�X � �H) � 6J(�X)� 12J(�X � �H) � (2c2/3d2)J(�H)), where J(�) �(2/5)S2[�M/(1 � �2�M
2 )]. Assuming that internal motionsare limited and fast, the last equation depends only on �m.
Estimates of axial and fully anisotropic diffusion tensorswere performed by applying the minimization techniqueswithin the program Tensor2 (Dosset, Marion, and Black-ledge Laboratoire de Resonance Magnetique Nucleare,Grenoble).34 Residues for which the NOE was less than0.65 at 600 MHz were excluded from the analysis due topossibility of large-amplitude fast internal motions.35 Ad-ditionally, residues that satisfied the inequation (�T2� �T2,n/�T2�) � (�T1� � T1,n/�T1�) 1.5 � SD (where T2,n is theT2 value of residue n, �T2� is the average T2 value, and SDis the standard deviation of (�T2� � T2,n/�T2�) � (�T1� �T1,n/�T1�) were identified as subject to conformationalexchange and were thus eliminated from consideration inthe analysis. A second rank ellipsoidal tensor, with eitherfour parameters (D�, D� � and �) for an axially symmetricor six parameters (Dx, Dy, Dz and the Euler angles �, � and�) for a fully anisotropic tensor, was used to describe therotational diffusion. Axially symmetric diffusion was de-scribed by �M � 1/(6Diso) (isotropic correlation time), ashape factor D�/D� (D� is the diffusion coefficient parallelto the unique axis and D� is the diffusion coefficientperpendicular to the unique axis) and two Euler angles �and � which represent the orientation of the unique axis ofthe diffusion tensor in the molecular frame. Diso is definedas Diso � (D� � 2D�)/3. Fully anisotropic rotation wasdescribed by the diffusion coefficients Dx, Dy and Dz, theshape factors 2Dz/(Dx � Dy) and Dx/Dy and the threeEuler angles �, �, and �.
RESULTSDetermination of Translational DiffusionCoefficients for Monomer and Dimer
The translational diffusion coefficients of the monomerand the dimer of stefin A, determined from measurementsof self-diffusion during PFG-LED experiments, are Dmon �0.87*10-10 cm2s and Ddim �1.14*10-10 cm2s. The ratio of
DYNAMICS OF MONOMERIC AND DIMERIC STEFIN A 503

Ddim to Dmon is 0.76, which corresponds well to thetheoretical value55 of 0.75.
Determination of Relaxation Parameters
Relaxation data were determined for all non-prolinebackbone amide resonances of both the monomer and thedimer (93 of 98 residues). For six peaks (E46, L108, Y113,G104, E34, T36), the quantification of peak intensities wasdifficult due to resonance overlap or weak resonanceintensity. In all other cases, the decay in intensity wasfound to be strictly exponential for 15N R1 and R2 data. R1
values provide information about motional properties withfrequencies in the range 108–1012 s�1,36 while R2 valuessimilarly depend on motions in the frequency range 108–1012 s�1 (but are more sensitive to the lower frequency (ns)motions), and in addition reflect contributions from ms or�s exchange processes. The 15N-{1H} NOE is typicallymost sensitive to higher frequency motions of the back-bone. Values near to 1.0 indicate a lack of higher frequencymotions, whereas lower values indicate an increased localflexibility of the backbone.
Monomer
The 10% trimmed weighted mean results for the mono-mer were 2.06 (� 0.05) s�1 for R1 (1/T1), 6.38 (� 0.15) s�1
for R2 (1/T2) and 0.81 (� 0.06) for the NOE. Seven valuesshowed an R1 value more than 10% greater and ninevalues showed an R1 value more than 10% lower than the
average value of R1. It is interesting to note that some ofthese residues (e.g. M6, I7, G57) constitute part of thebinding site for cysteine proteinases. Residues with signifi-cantly lower R2 values ( 5.7 s�1) than the average (i.e.,those that are involved in internal motions on the ns–pstime scale) included M6, I7, G9, and G10 in the N-terminaltrunk, G43, K44, and L45 in strand B, A56, and G57 in thefirst binding loop, G67, D68, and N92 in the loop connect-ing strands C and D, S102, G104, N105A, Q105, and D107in the second binding loop, L108, G112 in stand E, andF125 in the C-terminal loop. Except for L45 and L108, thesame residues had significantly lower R2/R1 (T1/T2) ratios.Some residues displayed R2 values greater than thetrimmed average. Most notable among them (R2 7.5 s�1)were S12, D26, K63, V64, Y94, M95, F100, D115A, andL122. Residues with NOE values lower than 0.65 at 600MHz (a criterion used in the diffusion tensor analysisbelow) included M6, I7, G9, G10, L11, T39, K44, L45, G57,G67, D68, G104, N105A, Q105, E106, D107, L108, andF125. NOE values significantly lower than the averagewere found in the N-terminal trunk, the first binding loop,the second binding loop, in the G43-L45 region, in theshort loop connecting strands C and D, and for F125 in theC-terminal loop (Fig. 3).
Dimer
A large change in the average values of relaxationparameters was observed upon dimer formation. The 10%
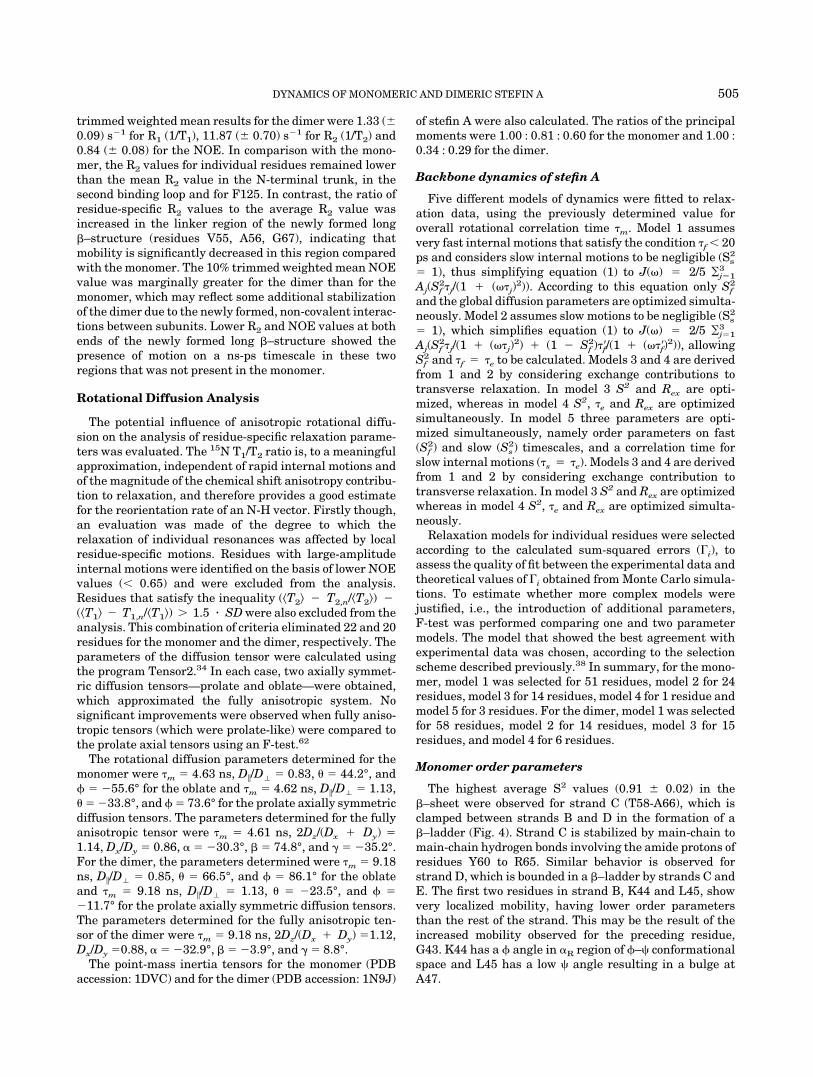
Fig. 3. Relaxation rate data for monomer (left) and dimer (right) of stefin A. Upper row: longitudinalrelaxation rates (R1), middle row: transverse relaxation rate (R2), and lower row: 15N-{1H} steady-state NOE(� 1).
504 B. JAPELJ ET AL.
trimmed weighted mean results for the dimer were 1.33 (�0.09) s�1 for R1 (1/T1), 11.87 (� 0.70) s�1 for R2 (1/T2) and0.84 (� 0.08) for the NOE. In comparison with the mono-mer, the R2 values for individual residues remained lowerthan the mean R2 value in the N-terminal trunk, in thesecond binding loop and for F125. In contrast, the ratio ofresidue-specific R2 values to the average R2 value wasincreased in the linker region of the newly formed long�–structure (residues V55, A56, G67), indicating thatmobility is significantly decreased in this region comparedwith the monomer. The 10% trimmed weighted mean NOEvalue was marginally greater for the dimer than for themonomer, which may reflect some additional stabilizationof the dimer due to the newly formed, non-covalent interac-tions between subunits. Lower R2 and NOE values at bothends of the newly formed long �–structure showed thepresence of motion on a ns-ps timescale in these tworegions that was not present in the monomer.
Rotational Diffusion Analysis
The potential influence of anisotropic rotational diffu-sion on the analysis of residue-specific relaxation parame-ters was evaluated. The 15N T1/T2 ratio is, to a meaningfulapproximation, independent of rapid internal motions andof the magnitude of the chemical shift anisotropy contribu-tion to relaxation, and therefore provides a good estimatefor the reorientation rate of an N-H vector. Firstly though,an evaluation was made of the degree to which therelaxation of individual resonances was affected by localresidue-specific motions. Residues with large-amplitudeinternal motions were identified on the basis of lower NOEvalues ( 0.65) and were excluded from the analysis.Residues that satisfy the inequality (�T2� � T2,n/�T2�) �(�T1� � T1,n/�T1�) � 1.5 � SD were also excluded from theanalysis. This combination of criteria eliminated 22 and 20residues for the monomer and the dimer, respectively. Theparameters of the diffusion tensor were calculated usingthe program Tensor2.34 In each case, two axially symmet-ric diffusion tensors—prolate and oblate—were obtained,which approximated the fully anisotropic system. Nosignificant improvements were observed when fully aniso-tropic tensors (which were prolate-like) were compared tothe prolate axial tensors using an F-test.62
The rotational diffusion parameters determined for themonomer were �m � 4.63 ns, D�/D� � 0.83, � � 44.2°, and� � �55.6° for the oblate and �m � 4.62 ns, D�/D� � 1.13,� � �33.8°, and � � 73.6° for the prolate axially symmetricdiffusion tensors. The parameters determined for the fullyanisotropic tensor were �m � 4.61 ns, 2Dz/(Dx � Dy) �1.14, Dx/Dy � 0.86, � � �30.3°, � � 74.8°, and � � �35.2°.For the dimer, the parameters determined were �m � 9.18ns, D�/D� � 0.85, � � 66.5°, and � � 86.1° for the oblateand �m � 9.18 ns, D�/D� � 1.13, � � �23.5°, and � ��11.7° for the prolate axially symmetric diffusion tensors.The parameters determined for the fully anisotropic ten-sor of the dimer were �m � 9.18 ns, 2Dz/(Dx � Dy) �1.12,Dx/Dy �0.88, � � �32.9°, � � �3.9°, and � � 8.8°.
The point-mass inertia tensors for the monomer (PDBaccession: 1DVC) and for the dimer (PDB accession: 1N9J)
of stefin A were also calculated. The ratios of the principalmoments were 1.00 : 0.81 : 0.60 for the monomer and 1.00 :0.34 : 0.29 for the dimer.
Backbone dynamics of stefin A
Five different models of dynamics were fitted to relax-ation data, using the previously determined value foroverall rotational correlation time �m. Model 1 assumesvery fast internal motions that satisfy the condition �f 20ps and considers slow internal motions to be negligible (Ss
2
� 1), thus simplifying equation (1) to J(�) � 2/5 ¥j�13
Aj(Sf2�j/(1 � (��j)
2)). According to this equation only Sf2
and the global diffusion parameters are optimized simulta-neously. Model 2 assumes slow motions to be negligible (Ss
2
� 1), which simplifies equation (1) to J(�) � 2/5 ¥j�13
Aj(Sf2�j/(1 � (��j)
2) � (1 � Sf2)��f/(1 � (���f)
2)), allowingSf
2 and �f � �e to be calculated. Models 3 and 4 are derivedfrom 1 and 2 by considering exchange contributions totransverse relaxation. In model 3 S2 and Rex are opti-mized, whereas in model 4 S2, �e and Rex are optimizedsimultaneously. In model 5 three parameters are opti-mized simultaneously, namely order parameters on fast(Sf
2) and slow (Ss2) timescales, and a correlation time for
slow internal motions (�s � �e). Models 3 and 4 are derivedfrom 1 and 2 by considering exchange contribution totransverse relaxation. In model 3 S2 and Rex are optimizedwhereas in model 4 S2, �e and Rex are optimized simulta-neously.
Relaxation models for individual residues were selectedaccording to the calculated sum-squared errors (�i), toassess the quality of fit between the experimental data andtheoretical values of �i obtained from Monte Carlo simula-tions. To estimate whether more complex models werejustified, i.e., the introduction of additional parameters,F-test was performed comparing one and two parametermodels. The model that showed the best agreement withexperimental data was chosen, according to the selectionscheme described previously.38 In summary, for the mono-mer, model 1 was selected for 51 residues, model 2 for 24residues, model 3 for 14 residues, model 4 for 1 residue andmodel 5 for 3 residues. For the dimer, model 1 was selectedfor 58 residues, model 2 for 14 residues, model 3 for 15residues, and model 4 for 6 residues.
Monomer order parameters
The highest average S2 values (0.91 � 0.02) in the�–sheet were observed for strand C (T58-A66), which isclamped between strands B and D in the formation of a�–ladder (Fig. 4). Strand C is stabilized by main-chain tomain-chain hydrogen bonds involving the amide protons ofresidues Y60 to R65. Similar behavior is observed forstrand D, which is bounded in a �–ladder by strands C andE. The first two residues in strand B, K44 and L45, showvery localized mobility, having lower order parametersthan the rest of the strand. This may be the result of theincreased mobility observed for the preceding residue,G43. K44 has a � angle in �R region of �–� conformationalspace and L45 has a low � angle resulting in a bulge atA47.
DYNAMICS OF MONOMERIC AND DIMERIC STEFIN A 505

The �–helix (E20- T36) is bent along the concave face ofthe sheet. The high order parameters generally observedfor the �–helix (S2 0.85) reflect the tight fit packing ofthe helix to the �–sheet. Very high order parameters areobserved in the first two turns. E20 (S2 � 0.93 � 0.01) andQ22 (S2 � 0.91 � 0.01) form hydrogen bonds to T18, whichprovides the hydrogen bond acceptors for the amide pro-tons of both residues. The fifth turn is slightly less welldefined, because the amide proton of K35 (S2 � 0.86 �0.01) has no hydrogen bond acceptor.
In most proteins the N and C termini are more mobilethan the core of the protein. The lowest order parametersfor the monomer of stefin A, ranging from 0.36 to 0.76, arefound at the N-terminal trunk, indicating the high mobil-ity of this region. The increased mobility agrees well withthe previously reported high RMSD values observed for C�
positions in these regions, and confirms the conclusion,based on the low density of 1H-1H NOEs1, that this regiondoes not populate any single conformation to a significantextent. Two residues M6 (S2 � 0.364 � 0.004) and I7 (S2 �0.469 � 0.004) have order parameters lower than 0.5.
In stefin A, the N-terminal trunk, the first and thesecond binding loop form a tripartite wedge, which docksinto the active site of target proteases, and therefore aclose examination of the mobility of these three regions ispertinent to understanding the physiological activity ofstefin A as an inhibitor. The first binding loop is a hairpinloop connecting strands B and C, and is part of the QVVAGmotif that is highly conserved in cystatins. The highestmobility in this region is observed for G57 (S2 � 0.62 �0.01) and V55 (S2 � 0.72 � 0.02), whereas the mobility ofA56 (S2 � 0.85 � 0.02) does not differ from that in the morerigid parts of the protein. The second binding loop, connect-ing strands D and E (residues 72–79), is an � loop. Thedynamics within this region are very complex. For threeresidues, namely L102A, Q105, and N105A, chemicalexchange can be observed. One residue has an S2 value
lower than 0.70, five residues have S2 values between 0.70and 0.80 and only one of the residues has an S2 valuegreater than 0.80. From the end of strand D, the Si
2/Si�12
ratio decreases monotonically towards the middle of theloop; N105A shows the highest mobility (S2 � 0.63 � 0.02).The Si
2/Si�12 ratios then increase towards the beginning of
the E strand. L108, which is the first residue in strand E,has an S2 � 0.84 � 0.02. Internal motions in this loop occuron the ps-ns timescale.
Internal motions in the loop connecting the �–helix andstrand B (N37 – G43) gradually increase towards thebeginning of strand B. Fast internal motions (10 �e 45ps) were again detected on a ps-ns timescale. Relaxationdata showed the presence of particularly fast internalmotions for G43 (R2 � 0.27 � 0.49 s�1 and NOE � 0.68 �0.08), the last residue in the loop. As mentioned above, theincreased mobility of G43 influences the dynamics of thestart of strand B, which consequently shows localizedmobility for K44 (S2 � 0.44 � 0.02, NOE � �0.13 � 0.05)and L45 (S2 � 0.68 � 0.01).
The �–hairpin loop connecting strands C and D consistsof three residues, namely G67, D68, and N92, all of whichshow high mobility. The greatest amplitude of internalmotions can be detected for G67 (S2 � 0.58 � 0.01),compared with D68 (S2 � 0.69 � 0.02) and N92 (S2 �0.72 � 0.02). G67 (along with G43) encloses the long�–strand that is formed upon dimerization.
The C-terminal loop (N117-F125) starts with a type I�–turn and runs along the convex face of the sheet. In mostproteins, the C-terminus has significantly lower orderparameters than the protein core. However, in stefin A,except for F125 (S2 � 0.64 � 0.01), the C-terminus is welldefined. High S2 values for N117 (S2 � 0.91 � 0.01) andD120 (S2 � 0.93 � 0.02) are a consequence of hydrogenbonding between the amide proton of D120 and thebackbone carbonyl oxygen of N117. In general though, thelow mobility of the C-terminal loop is the result of side-
Fig. 4. Calculated values of order parameters of resi-dues of monomer (upper left) and dimer (upper right) ofstefin A. Bottom: S2(dimer)/S2(monomer) ratios vs. resi-dues are shown to help highlight the differences. Mobilityincreases if ratio is higher than 1and decreases if ratio islower than 1.
506 B. JAPELJ ET AL.

chain to side-chain interactions formed between the loopand the main body of the protein.
Dimer order parameters
Substantial differences are observed for the dimer whencompared with the monomer (Table I). The S2 values forthe N-terminal trunk are increased, indicating a lowermobility of this region in the dimer. The S2 values for M6(S2 � 0.52 � 0.01) and I7 (0.54 � 0.01) show that althoughthe internal motions of this region are relatively lesspronounced than in the monomer, the N-terminus remainsmobile to a significant extent. An extended conformationin the linker region, which is formed in the dimer in placeof the first binding loop in the monomer, is a result of the3D domain swapping process. Strand B, the linker regionand strand C behave as a single long �–strand. Average S2
values in the linker region, namely for V55 to G57,increase from S2 � 0.73 � 0.02 in the monomer to S2 �0.86 � 0.04 in the dimer, indicating a mobility in the latterthat is typical for the �–strands of the protein core. Thedecrease in mobility for this region is a result of newinteractions in the open interface of the domain-swappeddimer. The increase of the average S2 values for strand Band strand C can also be rationalized by the cooperativestabilization of the long �–strand resulting from these newinteractions. In contrast, the regions around G43 and G67,at the beginning of strand B and the end of strand C,respectively, remain mobile. The S2 values for G43 (S2 �0.53 � 0.19) and K44 (S2 � 0.71 � 0.02), and for G67 (S2 �0.69 � 0.01), D68 (S2 � 0.42 � 0.19) and N92 (S2 � 0.18 �0.51), show the presence of substantial internal motions.
As in the monomer, the dynamics within the secondbinding loop are complex in the dimer. Fast internalmotions on the ps-ns timescale can be detected for differ-ent residues in this region, with �e values ranging from 34to 366 ps. Unlike in the monomer, the first half of thesecond binding loop seems to have higher mobility, reach-ing its peak at N105A (S2 � 0.54 � 0.03) and Q105 (S2 �0.51 � 0.21). Interestingly, the last residue in the secondhalf of the loop and the first residue in strand E showsimilar behavior (S2[D107] � 0.83 � 0.03, S2[L108] �0.79 � 0.02). Chemical exchange can also be observed forresidues E106 and D107.
The remaining secondary structure elements in thedimer are more rigid than in the monomer. S2 values forstrands A, B, and E are higher than in the monomer. Theaverage order parameters for strands C and D remainapproximately the same. Both of the latter strands form a�–ladder in the monomer and in the dimer, with thehydrogen-bonding pattern remaining similar. A distinc-tive feature of the �–helix in the dimer is the presence ofchemical exchange for the residues on the solvent-exposedside of helix, for which lower order parameters are ob-served. These residues include Q22 (S2 � 0.76 � 0.02), D26(S2 � 0.80 � 0.02) and L32 (S2 � 0.83 � 0.02). TheC-terminal loop of the dimer is well defined, with anaverage S2 value, excluding F125, of 0.86 � 0.10. Someincreased mobility is observed for G124 (S2 � 0.70 � 0.02)and F125 (S2 � 0.73 � 0.01), which also show someevidence of conformational exchange (Fig. 5).
Fast Hydrogen Exchange
An initial slope analysis of the signal intensity inCLEANEX-PM spectra was performed according to equa-tion (2). The values of k were divided by 0.85, in order totake into account the average degree of water saturation.The degree of saturation was measured by performing twoexperiments with different delays between scans (2s and30s). The ratio of the area of the water resonance in thespectra with the different inter-scan delays showed thatwater remains at 85% intensity during the CLEANEX-PMexperiment. Fast amide hydrogen exchange in the mono-mer was observed in regions of stefin A that are exposed tothe surface or that show an absence of intramolecularhydrogen bonding in the previously determined struc-tures.1,15 These residues also show increased localizedmobility, high C� RMSD values and the absence of 1H-1HNOEs1. For the monomer, 25 residues were observed tohave fast amide hydrogen exchange whereas for the dimeronly 14 such residues were observed, most of the latterbeing located in the N-terminal trunk, the second bindingloop and in the loops at the edges of the long �–strand(Table II).
DISCUSSION
An analysis of dynamics is important for understandingthe physiological properties of proteins. Information onprotein dynamics can also give us an insight into themechanism of macromolecular interactions, such as en-zyme inhibition or protein self-association through domain-swapping. The formation of 3D domain-swapped dimershas been observed in an ever-increasing number of pro-teins and it has been proposed that virtually any proteincould undergo domain swapping at a sufficiently highprotein concentration, by a process that is likely to beaccelerated under partially destabilizing conditions.8,15
This type of protein association has been implicated inphysiological processes such as signal transduction38,39
and in the formation of protein aggregates associated withthe so-called conformational diseases.40,41
No relaxation study of a member of cystatin superfamilyhas been reported so far. Members of the superfamily
TABLE I. Comparison of Mean Order Parameters forSecondary Structural Elements for Monomer and Dimer
Secondary structure
�S2� � dS2
Monomer Dimer
N-terminal trunk 0.59 � 0.01 0.66 � 0.05�A 0.87 � 0.01 0.92 � 0.03�–helix 0.90 � 0.01 0.86 � 0.03�B 0.83 � 0.01 0.84 � 0.03First binding loop 0.73 � 0.02 0.86 � 0.04�C 0.91 � 0.02 0.90 � 0.04G67-D68-N92 0.66 � 0.02 0.43 � 0.24�D 0.90 � 0.02 0.87 � 0.02Second binding loop 0.75 � 0.01 0.64 � 0.08�E 0.86 � 0.01 0.88 � 0.02C-terminal trunk without F125 0.88 � 0.04 0.86 � 0.09
DYNAMICS OF MONOMERIC AND DIMERIC STEFIN A 507

share regions of high sequence conservation, including thedipeptide GG (or GA) within the N-terminal trunk, and theQ53-G57 pentapeptide (conserved sequence QVVAG instefin family) in the first binding loop. The importance ofthese regions for enzyme inhibition has been demon-strated1,42 and confirmed by the tertiary structure of thecomplex between stefin B and papain. Deletion of residuesat the N-terminal trunk, where according to our study theorder parameters in the monomer of stefin A are particu-larly low, results in a decreased affinity for papain and
actinidin,43 while the Ki value for cathepsin H of a mutantstefin B, where the N-terminal MMC sequence was re-placed by MRLV56, is increased by a factor of seven. In thecontext of domain swapping, the more relevant mutationsare those that influence dimerization. The role of threeresidues on the dimerization of chicken cystatin has beenreported.15 One of these mutations, I66Q, causes fastspontaneous dimerization at room temperature. In thehomologue human cystatin C, the corresponding L68Qmutation causes hereditary cystatin C amyloid angiopa-
Fig. 5. Relaxation worms for monomer (a) and dimer (b) of stefin A. The width of the worm is proportional to(1-S2). Monomer: N-terminal trunk, the first binding loop and the second binding loop form a tripartite wedgewhich docks in the active site of the target protease. Increased localized mobility is located in the regionsaround G43 and G67. Dimer: Backbone dynamics of one subunit of dimer of stefin A is represented. The linkerregion, which is formed instead of the hairpin loop as a consequence of domain swapping shows mobilitysimilar to those of two neighboring strands.
508 B. JAPELJ ET AL.

thy,44 in which oligomerization results in cystatin deposi-tion in cerebral blood vessels, and causes an increasedpresence of the dimeric form in the circulatory system. Thecorresponding residue in stefin A is A66. It immediatelyprecedes the G67-N92 loop, for which very complex dynam-ics were observed in the current study. The replacement ofa non-polar residue with glutamine (I66Q and L68Q inchicken cystatin and human cystatin C, respectively) islikely to disrupt the packing of �–helix to the �–sheet. Incontrast to the I66Q mutation (a mutant within the closedinterface), the substitution of a hydrophobic residue with acharged residue in the first (V55-G57) and second bindingloop (S102-D107) of chicken cystatin (mutations at theopen interface) hinders dimerization. The substitutionsV55D, in the loop between strands B and C, and I102K, insecond binding loop, both resulted in an inability todimerize,15 even when heated at 90°C for 30 min.
There are two factors that may contribute to the de-creased tendency of these mutant proteins to dimerize.Firstly, both mutations introduce repulsive electrostaticinteractions between juxtaposed loops in the domain-swapped dimer. In both cases, the mutations would bepredicted to have smaller destabilizing effects on themonomer, since they are on loops that are exposed to thesolvent. Secondly, the V55D mutation causes a decrease in�–sheet propensity within the hinge region of the domain-
swapped dimer. As can be seen from Figure 6, the disap-pearance of fast hydrogen amide exchange in the hingeregion confirms the involvement of this region in intermo-lecular �–sheet interactions in the dimer. The hinge region(dimer)first binding loop (monomer) is composed of resi-dues that are strong � formers (QVV) and are by consensussecondary structure prediction algorithms (data not shown)predicted to be in an extended conformation. This is likelyto result in a strained loop conformation in the monomer,which is supported by the observation of strained torsionalangles for the solution structure in this region.1 Exchangeof V55, a strong �-forming residue, with asparagine, aresidue with a strong �-breaking propensity, is likely todecrease the stability of the long �–strand in the domain-swapped dimer, resulting in the monomer becoming rela-tively more stable.
The measurements of rotational anisotropy reveal thereto be relatively little deviation from isotropic behavior forboth the monomer and the dimer, and thus confirm thevalidity of the relaxation rates as accurate measures ofinternal mobility and conformational exchange. Intrigu-ingly, the measured D�/D� ratios for the monomer and thedimer are remarkably similar for both the oblate andprolate models, a conclusion not expected from calcula-tions of the inertia tensors of the previously reportedsolution structures.1,15 However, the inertia tensors andthe rotational diffusion tensors are not colinear indicatinga complexity within the rotational properties. Such com-plexities are likely to result from variations in conforma-tion of the regions displaying large-scale internal dynam-ics, rotations about the symmetry axis in the domain-swapped dimer (as reflected by the distribution of memberswithin the ensemble of structures reported previously15),and variations in solvation.
The closest comparison of the experimentally measureddynamics of stefin A can be made with those of monellin, atwo-chain protein sharing the same overall fold withmembers of the cystatin superfamily, which has beenisolated from the West African berries Dioscoreophyllumcuminsii.45 A similarity between cystatins and monellin,with respect to the formation of dimers and a tendency toform aggregates, has already been noted.9 A comparison oforder parameters between stefin A and monellin alsoreveals some similarities. NMR dynamics studies of monel-lin, selectively labeled with 15N at ten key positions,showed that AspB7 is the most flexible of these residues(S2 � 0.76). This corresponds to residue P16 in stefin A.The high flexibility of this region of monellin was rational-ized in terms of allowing conformational adaptation to thebinding site of the receptor. A similar mobility of theN-terminal region observed in stefin A likely indicates theimportance of this region for adaptation to the active site ofdifferent proteases. The same argument holds for the firstand the second binding loop of the monomer, where thehigher mobility should facilitate the fit to the active site ofthe enzyme. However, two other regions with increasedlocalized mobility, i.e., the loop that connects the �–helixand strand B, and the loop connecting strands C and D alsofollow this pattern. The highly flexible loop between strands
TABLE II. k Values Obtained from CLEANEX Experiment
k(s � 1) monomer � k(s � 1)
M6 8.8 0.1I7 2.8 0.2G9 31.5 1.7G10 16.0 0.9L11 4.2 0.04A14 15.3 3.6E20 14.8 0.3N37 0.8 0.2G43 71.9 1.6K44 9.1 0.2L45 5.1 0.6T58 * —A56 21.3 1.2G67 2.9 0.6D68 76.4 10.0N92 62.9 4.7L102 * —G104 31.5 1.7N105A 38.5 1.7Q105 29.6 2.9E106 12.4 0.7D107 2.3 0.1K118 14.6 0.4E121 * —L122 23.8 3.9
*k values below detection limit (0.5 s � 1).†Proton exchange is observed for residues at the surface of the protein,which are exposed to solvent. For all listed residues increased mobilitywith fast internal motions or conformational exchange was observedusing model-free approach. Residues with fast exchange, which aredetermined by CLEANEX-PM, could not be observed previously byH-D exchange.
DYNAMICS OF MONOMERIC AND DIMERIC STEFIN A 509

C and D in stefin A is the position of a large insertion inmembers of the cystatin family, where in the X-ray struc-ture of chicken cystatin, but not in the solution structure, ashort �–helix has been observed.65 This conformationalvariability supports the notion of high flexibility in thisregion of the protein.
A comparison of the order parameters of stefin A and thecrystallographic B-factors of stefin B (protein data bankaccession code 1STF)46 for the monomer shows that, in themain, the two quantities are correlated, even thoughB-factors are additionally sensitive to translational dis-placements, static disorder, and thermal fluctuations.47
Significantly higher B-factors are observed in the N-terminal trunk and in the second binding loop. However inthe crystal, stefin B is in complex with papain, whichinfluences the properties of residues in close intermolecu-lar contact; it has been demonstrated that B-factors incrystal structures reflect primarily the local packing den-sity.48 The close involvement of the first binding loop ofstefin B with papain in the crystal is the likely source ofthe low B factors observed for this region.
A comparison between the model-free analysis of relax-ation data and the phase modulated CLEANEX experi-ment shows a good agreement between residues identifiedwith lower order parameters or conformational exchange,and those with fast amide hydrogen exchange. This agree-ment is the result of the intrinsic physical properties of theresidues since the methods use different approaches.Results of the fast hydrogen exchange experiment comple-ment previously reported results obtained with deuteriumexchange,9 where the main difference in protection factorsbetween the monomer and the dimer was observed inresidues in the first binding loop (residues V55 and G57),the second binding loop (N105A) and the C-terminalregion (G124 and F125) of the dimer. Consistent with this,fast hydrogen exchange in N105A and Q105, observed forthe monomer, is lost following dimerization. A similareffect was observed for A56, in the first binding loop, whichis transformed following domain-swapping to the openinterface, with its amide hydrogen participating in newlyformed hydrogen bond.
Three-dimensional domain swapping has been observedin a number of proteins with different physiological func-tions. These functions include participation in the immuneresponse (in terms of antigen binding), cell cycle regula-
tion, signal transduction, constituents of the cytoskeleton,recognition processes (e.g., recognition of proline-rich se-quences in SH3 domain of Eps8, 63 molecular chaperones,metabolism (e.g., citrate synthesis by citrate synthase,64
conversion of phosphoenolpyruvate to phosphonopyru-vate53), cell growth, inhibition (cysteine protease inhibitorchicken cystatin monomer65), transcellular transport, DNArepair, and anticoagulation.8,51 The phenomenon has beenshown to be physiologically relevant in some proteins,whereas no physiological role has been reported in others.Some examples where the active forms of proteins aredomain-swapped include T4 endonuclease,52 phosphoenol-pyruvate mutase,53 and cro repressor.54 Stefin A is anexample that shows the opposite behavior, since inhibitionof the physiological function is a consequence of dimeriza-tion. The formation of amyloid aggregates of cystatins hasbeen observed in vivo and in vitro,44,58 and the physicaldimensions of amyloid fibrils compare well with the pack-ing of four cystatins molecules in each layer either as apair of dimers or as larger oligomers, though to date therehas been no direct demonstration that molecules aredomain-swapped in amyloid fibers. Our study indicatesthat there is a rigidification of residues in the closedinterface and a general decrease of order parameter, whichwould be beneficial for packing into larger aggregates. Loworder parameters in the loops opposite to the open inter-face of dimer would suggest that they might lie at the outerface of the fibril. The observed loss of the reactivity ofamyloid fibrils with a monoclonal antibody59 that bindsclose to the protease-binding wedge60 supports this asser-tion.
Conclusion
The backbone dynamics of stefin A have been deter-mined by the use of heteronuclear NMR spectroscopy. 15Nnuclear spin relaxation measurements have been per-formed in order to calculate order parameters. The dynam-ics reveal some differences between the monomeric andthe domain-swapped dimeric forms, which reflect theconformational rearrangement that occurs upon dimerformation. The most important differences between themonomer and the dimer of stefin A are: the linker regionconnecting the two domains, which is formed in thedomain-swapping process as a replacement for the firstbinding loop in the monomer, has motions typical of those
Fig. 6. Residues for which significant exchange using CLEANEX-PM experiment was observed are shown in light shading.
510 B. JAPELJ ET AL.

observed in the other �–strands; mobility at the beginningand the end of the newly formed long �–strand in thedimer increases while that in the linker region decreases;the high frequency mobility of the N-terminal trunkdecreases but is not eliminated on dimerization; differ-ences in the mobility of the second binding loop can beobserved; the rate of amide hydrogen exchange decreasesin most of these regions upon dimerization.
REFERENCES
1. Martin JR, Craven CJ, Jerala R, Kroon-Zitko, L., Zerovnik E, TurkV, Waltho JP. The three-dimensional solution structure of humanstefin A. J Mol Biol 1995;246:331–343.
2. Jarvinen M, Pernu H, Rinne A, Hopsu-Havu VK, Altonen M.Localisation of three inhibitors of cysteine proteinases in thehuman oral mucosa. Acta Histochem 1983;73:279–282.
3. Rinne A, Jarvinen M, Rasanen O. A protein reminiscent of theepidermal SH- proteinase inhibitor occurs in the squamous epithe-lia of man and rat. Acta Histochem 1978;63:183–192.
4. Rasanen O, Jarvinen M, Rinne A. Localisation of the human SH-protease inhibitor in the epidermis. Acta Histochem 1978;63:193–196.
5. Lah T, Kokalj-Kunovar M, Turk V. Cysteine proteinase inhibitorsin human cancerous tissues and fluids. Biol Cem Hoppe-Seyler1990;371:199–203.
6. Hopsu-Havu VK, Jarvinen M, Rinne A. Separation of cysteineproteinase inhibitors from psoriatic scale. Br J Dermatol 1983;109:77–85.
7. Hopsu-Havu VK, Joronen I, Jarvinen M, Rinne A. Detection ofacid cysteine proteinase inhibitor in human tissues and serumwith RIA. Eur Rev Med Pharm Sci 1983;5:1–4.
8. Liu Y, Eisenberg D. 3D domain swapping: As domains continue toswap. Protein Sci 2002;11:1285–1299.
9. Jerala R, Zerovnik E. Accessing the global minimum conformationof stefin A dimer by annealing under partially denaturatingconditions. J Mol Biol 1999;291:1079–1089.
10. Knaus KJ, Morillas M, Swietnicki W, Malone M, Surewicz WK,Yee VC. Crystal structure of the human prion protein reveals amechanism for oligomerization. Nat Struct Biol 2001;8:770–774.
11. Prusiner SB. Prions. Proc Natl Acad Sci USA 1998;95:13363–13383.
12. Soto C, Franginone B. Two conformational states of amyloidbeta-peptide: implications for the pathogenesis of Alzheimer’sdisease. Neurosci Lett 1995;186:115–118.
13. Abrahamson, M. Molecular basis for amyloidosis related to heredi-tary brain hemorrhage. Scand J Clin Lab Invest Suppl 1996;226:47–56.
14. Gerhartz B, Ekiel I, Abrahamson M. Two stable unfolding interme-diates of the disease-causing L68Q variant of human cystatin C.Biochemistry 1998;37:17309–17317.
15. Staniforth RA, Giannini S, Higgins LD, Conroy MJ, HounslowAM, Jerala R, Craven JC, Waltho JP. Three-dimensional domainswapping in the folded and molten-globule states of cystatins, anamyloid-forming structural superfamily. EMBO J 2001;20:4774–4781.
16. Peng JW, Wagner G. Investigation of protein motions via relax-ation measurements. Meth Enzymol 1994;239:563–596.
17. Abragam A. The principles of nuclear magnetism. Oxford: Claren-don Press; 1961. 599 p.
18. Clore GM, Szabo A, Bax A, Kay LE, Driscoll PC, Gronenborn AM.Deviations from the simple two-parameter model-free approach tothe interpretation of nitrogen-15 nuclear magnetic relaxation ofproteins. J Am Chem Soc 1990;112:4989–4991.
19. Inman KG, Baldisseri DM, Miller KE, Weber KE. Backbonedynamics of the calcium-signaling protein apo-s100b as deter-mined by 15N NMR relaxation. Biochemistry 2001;40:3439–3448.
20. Lipari G, Szabo A. Model-free approach to the interpretation ofnuclear magnetic resonance relaxation in macromolecules. 1.Theory and range of validity. J Am Chem Soc 1982;104:4546–4559.
21. Lipari G, Szabo A. Model-free approach to the interpretation ofnuclear magnetic resonance relaxation in macromolecules. 2.Analysis of experimental results. J Am Chem Soc 1982;104:4559–4570.
22. Hwang TL, Mori S, Shaka AJ, van Zijl PCM. Application ofphase-modulated CLEAN chemical exchange spectroscopy(CLEANEX-PM) to detect water-protein proton exchange andintramolecular NOEs. J Am Chem Soc 1997;119:6203–6204.
23. Hwang TL, van Zijl PCM, Mori S. Accurate quantitation ofwater-amide proton exchange rates using the phase-modulatedCLEAN chemical exchange (CLEANEX-PM) approach with afast-HSQC (FHSQC) detection scheme. J Biomol NMR 1998;11:221–226.
24. Jerala R, Kroon-Zitko L, Turk V. Improved expression andevaluation of polyethylenamine precipitation in isolation of recom-binant cystein proteinase inhibitor stefin B. Prot Ex Pur 1994;5:65–69.
25. Jerala R, Zerovnik E, Lohner K, Turk V. Structural basis for thedifference in thermodynamic properties between the two cysteinproteinase inhibitors stefins A and B. Protein Eng 1994;7:977–984.
26. Jeener J, Meier BH, Bachmann P, Ernst RR. Investigation ofexchange processes by two-dimensional NMR spectroscopy. J ChemPhys 1979;71:4546–4553.
27. Schwartz AL, Cutnell JD. One-dimensional and two-dimensionalNMR studies of exchanging amide protons in glutathione. J MagnReson 1983;53:398–411.
28. Dobson CM, Lian L-Y, Redfield C, Topping KD. Measurement ofhydrogen-exchange rates using 2D NMR-spectoscopy. J MagnReson 1986;69:201–209.
29. Mori S, Abeygunawardana C, van Zijl PCM, Berg JM. Waterexchange filter with improved sensitivity (WEX II) to sudy solventexchangeable protons. Applications to the consensus zinc fingerpeptide CP-I. J Magn Reson 1996;B110:96–101.
30. Stejskal EO, Tanner JE. Spin diffusion measurements: spinechoes in the presence of a time-dependent field gradient. J ChemPhys 1965;42:288–292.
31. Dingley AJ, Mackay JP, Chapman BE, Morris MB, Kuchel PW,Hambly BD, King GF. Measuring protein self-association usingpulsed-field-gradient NMR spectroscopy: Application to myosinlight chain 2. J Biomol NMR 1995;6:321–328.
32. Palmer AG, Rance M, Wright PE. Intramolecular motions of a zincfinger DNA-binding domain from xfin charcterized by proton-detected natural abundance 13C heteronuclear NMR spectros-copy. J Am Chem Soc 1991;113:4371–4380.
33. Skelton NJ, Palmer AG, Akke M, Kordel J, Rance M, Chazin WJ.Practical aspects of two-dimensional proton-detected 15N spinrelaxation measurements. J Magn Reson 1993;102(Ser. B):253–264.
34. Blackledge M, Cordier F, Dosset P, Marion D. Precision anduncertainty in the characterization of anisotropic rotational diffu-sion by 15N relaxation. J Am Chem Soc 1998;120:4538–4539.
35. Tjandra N, Feller SE, Pastor R, Bax A. Rotational diffusionanisotropy of human ubiquitin from 15N NMR relaxation. J AmChem Soc 1995;117:12562–12566.
36. Chi Y, Kumar TKS, Chiu IM, Yu C. 15N NMR relaxation studiesof free and ligand-bound human acidic fibroblast growth factor.J Biol Chem 2000;275:39444–39450.
37. Mandel AM, Akke M, Palmer AG, III. Backbone dynamics ofEscherichia coli riobonuclease HI: correlations with structure andfunction in an active enzyme. J Mol Biol 1995;246:144–163.
38. Musacchio A, Saraste M, Wilmanns M. High-resolution crystalstructures of tyrosine kinase SH3 domains complexed with proline-rich peptides. Nat Struct Biol 1994;1:546–551.
39. Maignan S, Guilloteau JP, Fromage N, Arnoux B, Becquart J,Ducruix A. Crystal structure of the mammalian Grb2 adaptor.Science 1995;268:291–293.
40. Carrel RW, Lomas DA. Conformational disease. Lancet 1997;350:134–138.
41. Carrel RW, Gooptu B. Conformational changes and disease-serpins, prions and Alzheimer’s. Curr Opin Struct Biol 1998;8:799–809.
42. Ylinenjarvi K, Widersten M, Bjorkm I. Hydrophobic sequencescan substitute for the wild-type N-terminal sequence of cystatin A(stefin A) in tight binding to cysteine proteinases. Selection ofhigh-affinity N-terminal region variants by phage display. EurJ Biochem 1999;261:682–688.
43. Bjork I, Ylinenjarvi K. Interaction between chicken cystatin andthe cysteine proteinases actinidin, chymopapain, and ficin. Bio-chemistry 1990;29:1770–1776.
44. Ekiel I, Abrahamson M, Fulton DB, Lindahl P, Storer AC,
DYNAMICS OF MONOMERIC AND DIMERIC STEFIN A 511

Levadoux W, Lafrance M, Labelle S, Pomerleau Y, Groleau D,LeSauteur L, Gehring K. NMR structural studies of humancystatin C dimers and monomers. J Mol Biol 1997;271:266–277.
45. Mizukoshi T, Masnori K, Suzuki E, Ariyoshi Y. Structure anddynamic studies by NMR of the potent sweet protein monellin anda non-sweet analog. FEBS Lett 1997;413:409–416.
46. Stubbs MT, Laber B, Bode W, Huber R, Jerala R, Lenarcic B, TurkV. The refined 2.4 angstroms X-ray crystal structure of recombi-nant human stefin B in complex with the cysteine proteinasepapain: a novel type of proteinase inhibitor interaction. EMBO J1990;9:1939–1947.
47. Powers R, Clore GM, Garret DS, Gronenborn AM. Relationshipsbetween the precision of high-resolution protein NMR structures,solution order parameters and crystallographic B factors. J MagnReson B. 1993;101:325–327.
48. Halle B. Flexibility and packing in proteins. PNAS 2002;99:1274–1279.
49. Dempsey CE. Hydrogen exchange in peptides and proteins usingNMR spectroscopy. Prog Nucl Magn Reson Spect 2001;39:135–170.
50. Cantor CR, Schimmel PR. Biophysical chemistry, Part II: Tech-niques for the study of biological structure and function. NewYork: W.H. Freeman; 1980. p 539–590.
51. Bennet MJ, Sclunegger MP, Eisenberg D. 3D domain swapping: Amechanism for oligomer assembly. Protein Sci 1995;4:2455–2468.
52. Raaijmakers H, Vix O, Toro I, Golz S, Kemper B, Suck D. X-raystructure of T4 endonuclease VII: A DNA junction resolvase with anovel fold and unusual domain-swapped dimer architecture.EMBO J 1999;18:1447–1458
53. Huang K, Li Z, Jia Y, Dunaway-Mariano D, Herzberg O. Helixswapping between two alphabeta barrels: Crystal structure ofphosphoenolpyruvate mutase with bound Mg(2 )-oxalate. StructFold Des 1999;7:539–548.
54. Anderson WF, Ohlendorf DH, Takeda Y, Matthews BW. Structureof the cro-repressor from the bacteriophage lambda and itsinteraction with DNA. Nature 1981;290:835–842.
55. Teller DC, Swanson E, de Haen C. The translational frictioncoefficient of proteins. Methods Ezymol 1979;61:103–124.
56. Jerala R, Kroon-Zitko L, Popovic, T, Turk V. Elongation on theamino-terminal part of stefin B decreases as inhibition of cathep-sin-H. Eur J Biochem 1994;224:797–802.
57. Koradi R, Billoter M, Wutrich K. MOLMOL: a program for displayand analysis of macromolecular structures. J Mol Graph 1996;14:51–55.
58. Ekiel I, Abrahamson M. Folding-related dimerization of humancystatin C. J Biol Chem 1996;271:1314–1321.
59. Zerovnik E, Zavasnik-Bergant V, Kopitar-Jerala N, Pompe-NovakM, Skarabot M, Goldie K, Ravnikar M, Musevic, I, Turk V.Amyloid fibril formation by human stefin B in vitro: Immunogoldlabelling and comparison to stefin A. Biol Chem 2002;383:589–563.
60. Kopitar-Jerala N, Curin-Serbec V, Jerala R, Krizaj I, Gubensek F,Turk V. Monoclonal antibodies to human stefin B and determina-tion of their epitopes. Biochim Biophys Acta 1993;1164:75–80.
61. Farrow NA, Ranjith M, Singer AU, Pascal SM, Kay CM, Gish G,Shoelson SE, Pawson T, Forman-Kay JD, Kay LE. Backbonedynamics of a free and a phosphopeptide complexed Src homology2 domain studied by 15N NMR relaxation. Biochemistry 1994;33:5984–6003.
62. Dosset P, Hus J-C, Blackledge M, Marion DE. Efficient analysis ofmacromolecular rotational diffusion from heteronuclear relax-ation data. J Biomol NMR 2000;16:23–28.
63. Kishan KV, Scita G, Wong WT, Di Fiore PP, Newcomer ME. TheSH3 domain of Eps8 exists as a novel interwined dimmer. NatStruct Biol 1997;4:739–743.
64. Remington S, Wiegand G, Huber R. Crystallographic refinementand atomic models of two different forms of cytrat synthase at 2.7and 1.7 Å resolution. J Mol Biol 1982;158:111–152.
65. Bode W, Engh R, Musil D, Thiele U, Huber R, Karshikov A, BrzinJ, Kos J, Turk V. The 2.0 Å X-ray crystal structure of chicken eggwhite cystatin and its possible mode of interaction with cysteineproteinases. EMBO J 1998;7:2593–2599.
512 B. JAPELJ ET AL.