Strength, Conditioning, and Nutritional Considerations for ...
Upload
khangminh22Category
view
0download
0
Food and Nutrition Technical Assistance Project (FANTA)Academy for Educational Development 1825 Connecticut Ave., NW Washington, DC 20009-5721
Tel: 202-884-8000 Fax: 202-884-8432 E-mail: [email protected] Website: www.fantaproject.org
Dietary Diversity, DietaryQuality, and Child NutritionalStatus: Evidence from ElevenDemographic and HealthSurveys
Mary Arimond andMarie T. Ruel
March 2004

This publication was made possible through thesupport provided to the Food and NutritionTechnical Assistance (FANTA) Project by theOffice of Health, Infectious Disease andNutrition of the Bureau for Global Health at theU.S. Agency for International Development,under terms of Cooperative Agreement No.HRN-A-00-98-00046-00 awarded to theAcademy for Educational Development (AED).The opinions expressed herein are those of theauthor(s) and do not necessarily reflect the viewsof the U.S. Agency for InternationalDevelopment.
Published March 2004
Recommended citation:Arimond, Mary and Marie T. Ruel. DietaryDiversity, Dietary Quality, and Child NutritionalStatus: Evidence from Eleven Demographic andHealth Surveys. Washington, D.C.: Food andNutrition Technical Assistance (FANTA) Project,Academy for Educational Development (AED),2004.
Copies of the publication can be obtainedfrom:Food and Nutrition Technical Assistance ProjectAcademy for Educational Development1825 Connecticut Avenue, NWWashington, D.C. 20009-5721Tel: 202-884-8000Fax: 202-884-8432Email: [email protected]: www.fantaproject.org

ACKNOWLEDGMENTS
The authors thank Altrena Mukuria and Casey Aboulafia of ORC MACRO International forhelpful discussions concerning the DHS+ data sets. We thank Anne Swindale and PaigeHarrigan of the FANTA Project, and Eunyong Chung of USAID for their support and fordiscussions of these topics, and for their comments on an earlier preliminary report. We are alsograteful to Wahid Quabili of the International Food Policy Research Institute (IFPRI) forassistance with data analysis and with tables.

ACRONYMS
DHS Demographic and Health SurveysHAZ Height-for-age Z-scoreKPC Knowledge, Practices, and CoveragePAHO Pan American Health OrganizationPVO Private Voluntary OrganizationUSAID United States Agency for International DevelopmentWAZ Weight-for-age Z-scoreWHZ Weight-for-height Z-scoreWHO World Health Organization

TABLE OF CONTENTS
Executive Summary ....................................................................................................................... i
1. Review of Dietary Diversity: Measurement, Meaning, and Associations with NutrientAdequacy and Child Nutritional Status................................................................................ 11.1. Dietary Diversity and Related Terms: Definitions and Measurement.............................. 2
1.1.1. Definitions ............................................................................................................ 21.1.2. Measurement of dietary diversity ......................................................................... 31.1.3. Measurement of nutrient adequacy....................................................................... 41.1.4. Measurement of dietary quality ............................................................................ 4
1.2. Relationships among Dietary Diversity, Nutrient Adequacy, and Child Nutritional Status................................................................................................................................. 5
1.2.1. Association between dietary diversity and nutrient intake or adequacy............... 51.2.2. Association between dietary diversity and child nutritional status..................... 13
2. Dietary Diversity in the Demographic and Health Surveys.............................................. 16
3. Methods.................................................................................................................................. 203.1. Selection of Data Sets ..................................................................................................... 203.2. Variations in Questionnaires........................................................................................... 213.3. Data Cleaning ................................................................................................................. 213.4. Variable Construction ..................................................................................................... 22
3.4.a. Dietary diversity.................................................................................................. 223.4.b. Proxy index household wealth ............................................................................ 24
3.5. Analytical Methodology ................................................................................................. 25
4. Description of Households, Mothers, and Children .......................................................... 284.1. Selected Household Characteristics................................................................................ 284.2. Characteristics of the Mother.......................................................................................... 284.3. Proxies for Access to Health Care .................................................................................. 314.4. Anthropometric Indicators for Children Aged 6-23 Months .......................................... 314.5. Morbidity and Feeding during Diarrhea for Children Aged 6-23 Months ..................... 324.6. Feeding Practices for Children Aged 6-23 Months ........................................................ 32
5. Dietary Diversity and Food Group Patterns ...................................................................... 35
6. Categories for Dietary Diversity.......................................................................................... 476.1. Sample-specific Diversity Terciles ................................................................................. 476.2. Diversity Categories Based on Recommended Food Groups......................................... 51
7. Association between Dietary Diversity and Height-for-Age Z-scores.............................. 54
8. Comparing the 24-hour and 7-day Food Group Recalls ................................................... 69
9. Summary................................................................................................................................ 819.1. Dietary Diversity and Food Group Patterns.................................................................... 819.2. Dietary Diversity Indicators and Height-for-Age Z-score (HAZ).................................. 819.3. The Question of Cut-offs for a Dietary Diversity Score................................................. 829.4. Comparing 24-hour and 7-day Food Group Recalls....................................................... 839.5. Conclusion ...................................................................................................................... 83
References .................................................................................................................................... 84
Annex 1. Food Groups on Country Questionnaires ............................................................... 88
Annex 2. Construction of Asset Index for Each Country....................................................... 93A1. Variation captured by first principal component (asset score) ............................................ 94A2. Variables included in principal components analysis, by country....................................... 95
Annex 3. Regression Results ..................................................................................................... 99A3. Regression results for Benin, dependent variable HAZ....................................................... 99A4. Regression results for Ethiopia, dependent variable HAZ................................................. 100A5. Regression results for Malawi, dependent variable HAZ.................................................. 101A6. Regression results for Mali, dependent variable HAZ....................................................... 102A7. Regression results for Rwanda, dependent variable HAZ ................................................. 103A8. Regression results for Zimbabwe, dependent variable HAZ ............................................. 104A9. Regression results for Cambodia, dependent variable HAZ.............................................. 105A10. Regression results for Nepal, dependent variable HAZ..................................................... 106A11. Regression results for Colombia, dependent variable HAZ .............................................. 107A12. Regression results for Haiti, dependent variable HAZ ...................................................... 108A13. Regression results for Peru, dependent variable HAZ....................................................... 109
Annex 4. Tables Comparing the 24-hour and 7-day Food Group Recalls ......................... 110A14. Benin: Comparing 24-hour and 7-day recalls .................................................................... 110A15. Ethiopia: Comparing 24-hour and 7-day recalls ................................................................ 110A16. Malawi: Comparing 24-hour and 7-day recalls ................................................................. 110A17. Mali: Comparing 24-hour and 7-day recalls ...................................................................... 111A18. Rwanda: Comparing 24-hour and 7-day recalls ................................................................ 111A19. Zimbabwe: Comparing 24-hour and 7-day recalls ............................................................ 111A20. Cambodia: Comparing 24-hour and 7-day recalls ............................................................. 112A21. Nepal: Comparing 24-hour and 7-day recalls .................................................................... 112A22. Colombia: Comparing 24-hour and 7-day recalls.............................................................. 112A23. Peru: Comparing 24-hour and 7-day recalls ...................................................................... 113A24. Benin: Comparing classification into diversity terciles based on the 24-hour food group recall compared to the 7-day food group recall ................................................................. 114A25. Ethiopia: Comparing classification into diversity terciles based on the 24-hour food group recall compared to the 7-day food group recall ................................................................. 114A26. Malawi: Comparing classification into diversity terciles based on the 24-hour food group recall compared to the 7-day food group recall ................................................................. 114A27. Mali: Comparing classification into diversity terciles based on the 24-hour food group recall compared to the 7-day food group recall ................................................................. 115A28. Rwanda: Comparing classification into diversity terciles based on the 24-hour food group recall compared to the 7-day food group recall ................................................................. 115A29. Zimbabwe: Comparing classification into diversity terciles based on the 24-hour food group recall compared to the 7-day food group recall ....................................................... 115A30. Cambodia: Comparing classification into diversity terciles based on the 24-hour food group recall compared to the 7-day food group recall ....................................................... 116A31. Nepal: Comparing classification into diversity terciles based on the 24-hour food group

recall compared to the 7-day food group recall ................................................................. 116A32. Colombia: Comparing classification into diversity terciles based on the 24-hour food group recall compared to the 7-day food group recall ................................................................. 116A33. Peru: Comparing classification into diversity terciles based on the 24-hour food group recall compared to the 7-day food group recall ................................................................. 117A34. Benin: Comparing classification using fixed cut-offs, 24-hour food group recall compared to the 7-day food group recall ............................................................................................ 118A35. Ethiopia: Comparing classification using fixed cut-offs, 24-hour food group recall compared to the 7-day food group recall ........................................................................... 118A36. Malawi: Comparing classification using fixed cut-offs, 24-hour food group recall compared to the 7-day food group recall ........................................................................... 118A37. Mali: Comparing classification using fixed cut-offs, 24-hour food group recall compared to the 7-day food group recall ............................................................................................ 119A38. Rwanda: Comparing classification using fixed cut-offs, 24-hour food group recall compared to the 7-day food group recall ........................................................................... 119A39. Zimbabwe: Comparing classification using fixed cut-offs, 24-hour food group recall compared to the 7-day food group recall ........................................................................... 119A40. Cambodia: Comparing classification using fixed cut-offs, 24-hour food group recall compared to the 7-day food group recall ........................................................................... 120A41. Nepal: Comparing classification using fixed cut-offs, 24-hour food group recall compared to the 7-day food group recall ............................................................................................ 120A42. Colombia: Comparing classification using fixed cut-offs, 24-hour food group recall compared to the 7-day food group recall ........................................................................... 120A43. Peru: Comparing classification using fixed cut-offs, 24-hour food group recall compared to the 7-day food group recall ........................................................................................... 121
TABLES
1a. Characteristics of the studies that looked at the association between dietary diversityand nutrient intake or adequacy in developing countries.......................................................... 6
1b. Characteristics of the studies that looked at the association between dietary diversityand child nutritional status in developing countries ................................................................. 9
2. Sample size by country ........................................................................................................... 213. Selected household characteristics, by country (all households with children 0-23 months) 294. Characteristics of mother and her partner, by country (all households with children 0-23
months) ................................................................................................................................... 295. Selected proxies for access to health care, by country (all households with children 0-23
months) ................................................................................................................................... 306. Percent of children 6-23 months with fever, cough, or diarrhea in last two weeks, and
feeding during diarrhea, by country........................................................................................ 337. Feeding practices for children 6-23 months, by country: Breastfeeding, bottle use, and
frequency of feeding ............................................................................................................... 338. Average 24-hour food group diversity for children aged 6-23 months, by country ............... 359. Benin: Percentage of 6-23 month old children who consumed different food groups, by
category of 24-hour food group diversity ............................................................................... 36

10. Ethiopia: Percentage of 6-23 month old children who consumed different food groups, bycategory of 24-hour food group diversity ............................................................................... 37
11. Malawi: Percentage of 6-23 month old children who consumed different food groups, bycategory of 24-hour food group diversity ............................................................................... 38
12. Mali: Percentage of 6-23 month old children who consumed different food groups, bycategory of 24-hour food group diversity ............................................................................... 39
13. Rwanda: Percentage of 6-23 month old children who consumed different food groups, bycategory of 24-hour food group diversity ............................................................................... 40
14. Zimbabwe: Percentage of 6-23 month old children who consumed different food groups, bycategory of 24-hour food group diversity ............................................................................... 40
15. Cambodia: Percentage of 6-23 month old children who consumed different food groups, bycategory of 24-hour food group diversity ............................................................................... 41
16. Nepal: Percentage of 6-23 month old children who consumed different food groups, bycategory of 24-hour food group diversity ............................................................................... 42
17. Colombia: Percentage of 6-23 month old children who consumed different food groups, bycategory of 24-hour food group diversity ............................................................................... 43
18. Haiti: Percentage of 6-23 month old children who consumed different food groups, bycategory of 24-hour food group diversity ............................................................................... 43
19. Peru: Percentage of 6-23 month old children who consumed different food groups, bycategory of 24-hour food group diversity ............................................................................... 44
20. Percentage of 6-23 month old children who consumed dairy, by category of 24-hour foodgroup diversity ........................................................................................................................ 45
21. Dietary diversity terciles for ten countries, children aged 6-23 months ................................. 4822. Dietary diversity terciles for ten countries, children aged 6-8 months ................................... 4923. Dietary diversity terciles for ten countries, children aged 9-11 months ................................. 4924. Dietary diversity terciles for ten countries, children aged 11-17 months ............................... 5025. Dietary diversity terciles for ten countries, children aged 18-23 months ............................... 5026. Percent of children 6-23 months in 10 countries with low, middle, and high scores for dietary
diversity, using fixed cut-offs ................................................................................................. 5227. Benin: Percentage of 6-23 month old children who consumed different food groups by
dietary diversity category (fixed cut-offs for low, middle, and high diversity)...................... 5328. Ethiopia: Percentage of 6-23 month old children who consumed different food groups by
dietary diversity category (fixed cut-offs for low, middle, and high diversity)...................... 5329. Summary of regression results: Dependent variable =HAZ. Significant coefficients by
country .................................................................................................................................... 6330. Summary of regression results: Significant interactions with dietary diversity, by country . 6531. Differences (> 5 percentage points) between food groups eaten yesterday and those eaten
three or more days in the last seven, for children aged 6-23 months, by country .................. 7632. Comparing 24-hour food group recall (Y/N) to three or more days last week, by country and
food group: Kappa and percent agreement for each comparison ........................................... 7833. Concordance coefficientsa for 24-hr diversity as compared to three or more days, four or
more days, and at least once in the last seven days, by country ............................................. 7934. Benin: Comparing classification into diversity terciles based on the 24-hour food group recall
compared to the 7-day food group recall ................................................................................ 80

FIGURES
1. Mean adjusted height-for-age Z-scores, by dietary diversity score in previous 7-days(children 12-36 months of age: Ethiopia DHS 2000) ............................................................. 13
2. Low HAZ (< -2) among children 6-23 months, by country ................................................... 313. Low WHZ (< -2) among children 6-23 months, by country .................................................. 324. Mean HAZ by dietary diversity tercile in six African countries ............................................ 545. Mean HAZ by dietary diversity tercile (6-23 months): Five countries in Asia and the LAC
region ...................................................................................................................................... 556. Benin: HAZ by dietary diversity tercile, within age groups................................................... 567. Ethiopia: HAZ by diet diversity tercile, within age groups .................................................... 568. Malawi: HAZ by dietary diversity tercile, within age groups ................................................ 579. Mali: HAZ by diet diversity tercile, within age groups .......................................................... 5710. Rwanda: HAZ by dietary diversity tercile, within age groups ............................................... 5811. Zimbabwe: HAZ by diet diversity tercile, within age groups ................................................ 5812. Cambodia: HAZ by dietary diversity tercile, within age groups ............................................ 5913. Nepal: HAZ by diet diversity tercile, within age groups ........................................................ 5914. Colombia: HAZ by dietary diversity tercile, within age groups............................................. 6015. Haiti: HAZ by diet diversity tercile, within age groups..........................................................6016. Peru: HAZ by dietary diversity tercile, within age groups ..................................................... 6117. Cambodia: Interaction between breastfeeding status and dietary diversity........................... 6618. Adjusted mean HAZ by dietary diversity tercile in six African countries ............................. 6719. Adjusted mean HAZ by dietary diversity tercile: Five countries in Asia and the LAC
region ...................................................................................................................................... 6720. Benin: Comparing food groups eaten yesterday to 3 or more days last week........................ 7121. Ethiopia: Comparing food groups eaten yesterday to 3 or more days last week.................... 7122. Malawi: Comparing food groups eaten yesterday to 3 or more days last week ..................... 7223. Mali: Comparing food groups eaten yesterday to 3 or more days last week.......................... 7224. Rwanda: Comparing food groups eaten yesterday to 3 or more days last week .................... 7325. Zimbabwe: Comparing food groups eaten yesterday to 3 or more days last week ................ 7326. Cambodia: Comparing food groups eaten yesterday to 3 or more days last week ................. 7427. Nepal: Comparing food groups eaten yesterday to 3 or more days last week........................ 7428. Colombia: Comparing food groups eaten yesterday to 3 or more days last week.................. 7529. Peru: Comparing food groups eaten yesterday to 3 or more days last week .......................... 75
BOXES
1. Liquid group recall question from the DHS+ model questionnaire ........................................ 162. Food group recall question from the DHS+ model questionnaire........................................... 173. Food groups in dietary diversity score..................................................................................... 23

Executive Summary
i
EXECUTIVE SUMMARY
Nutritionists have long recognized the value of dietary diversity, and the concept of diversity isreflected in various national dietary guidelines. When people eat a variety of foods, they aremore likely to meet their needs for a wide range of essential nutrients. Yet for many poor peopleacross the globe dietary diversity is very low, and the daily diet is dominated by one main staplefood.
Young children in particular need energy- and nutrient-dense foods to meet their dietary needs.In this report we focus on the issue of dietary diversity for young children, across the vulnerableage-range when most children transition from breastfeeding to the family diet (6-23 months).For many poor children, this is also the age when growth falters, usually due to a combination offrequent illness and inadequate diet.
While there is consensus that dietary diversity is good, there are a number of unansweredquestions about the definition and measurement of diversity, and about the relationship betweendiversity, nutrient adequacy, and outcomes such as child nutritional status. Relatively fewstudies have focused on dietary diversity among young children in developing countries. Studiesto date have used a wide range of operational definitions of dietary diversity. Nevertheless, therehas been some consistency in results, with dietary diversity shown to be associated with bothnutrient adequacy and child nutritional status in most of the few studies where these relationshipshave been examined.
Many programs in developing countries seek to improve the quality of children�s diets.Managers of these programs need simple indicators to monitor and evaluate progress towardsimprovement. Dietary diversity is considerably simpler to measure than nutrient adequacy; thus,dietary diversity may be one such simple indicator. But additional work is needed to refineindicators, to determine if standardized indicators are appropriate, and finally to confirm andextend knowledge about associations among dietary diversity, nutrient adequacy, and nutritionalstatus, across various populations.
We review current knowledge about these relationships and use data from eleven recentDemographic and Health Surveys (DHS) to accomplish four tasks:
1. To describe how a simple dietary diversity score relates to diet patterns among youngchildren;
2. To explore the feasibility of deriving global or regional cut-off points for low and highdiversity;
3. To determine whether simple dietary diversity indicators are meaningfully associatedwith height-for-age among young children across a range of countries;
4. To test the nature and strength of the associations between food group and dietarydiversity indicators derived from a 24-hour food group recall and those derived from a 7-day food group recall across a range of countries with varying levels of dietary diversity.

Executive Summary
ii
Dietary diversity and child height-for-age
Our results show that there is a strong bivariate association between dietary diversity tercile andheight-for-age Z-score (HAZ), which is statistically significant in nine of the eleven countriesstudied. The size of the differences between the low and high diversity groups is large and ofpractical significance in most countries, ranging from 0.25 to 0.51 Z-score units in the ninecountries where the association was observed. In models controlling for a variety of biologicaland household socioeconomic factors, the association between dietary diversity and HAZremains significant in six countries. In addition, dietary diversity interacts significantly withother factors, such as child age, urban/rural location of household, or whether the child was stillbreastfed in four of the remaining five countries, indicating that diversity is more stronglyassociated with HAZ for some sub-groups.
An interaction between breastfeeding status and dietary diversity, observed in four countries, isparticularly interesting, showing very large Z-score differences between low and high diversitygroups for non-breastfed children. Dietary diversity may be particularly important to ensurenutrient adequacy for non-breastfed children. Dietary diversity may thus be a particularlyrelevant proxy for diet quality in the case of non-breastfed children in the age-range studied.
Our analysis of dietary diversity and HAZ is limited by the fact that measurement of householdwelfare and socioeconomic status is limited in the DHS data sets. Therefore even in thecountries where associations remained significant, we cannot conclusively state that theassociations are not due to socioeconomic characteristics such as wealth or income.
Cut-offs for dietary diversity
In the absence of international recommendations for adequate or optimal food group or dietarydiversity we have used cut-offs for diversity based on terciles, which were derived individuallyfor each study sample. The cut-offs varied greatly among countries, even within narrow ageranges. In addition, in some countries the use of cut-offs based on sample terciles resulted inranking children as �high� for diversity when, in fact, diversity was clearly too low. Weconclude that cut-offs must be based on further research, in a variety of countries, relatingspecific diversity indicators and cut-offs to nutrient adequacy.
Usefulness of the 7-day food group recall
Food group recalls can be used to gather information on population-level diet patterns. Weassessed the �added value� of the 7-day recall in simple surveys that also include a 24-hour foodgroup recall. At the population level, agreement was very good between the proportion ofchildren eating each food group yesterday, and the proportion eating each group 3 or more daysin the last seven days. Food group diversity indicators for yesterday were also very similar toindicators for diversity in food groups eaten 3 or more days. We conclude that when theobjective is to identify which food groups are eaten regularly, the 7-day recall does not providemuch information beyond what is available from the 24-hour recall. We do not assess the 7-dayrecall relative to other objectives.

Executive Summary
iii
Conclusion
Our work suggests that simple indicators of dietary diversity reflect important differences in dietpatterns, and are associated with height-for-age. Further work, with richer data sets, could betterdefine the relationship between specific dietary diversity indicators and nutrient adequacy. Insuch work, particular attention should be paid to non-breastfed children in the vulnerable 6-23month age group. Further work could also better define apparent relationships among dietarydiversity, household socioeconomic status, and outcomes such as child nutritional status.

Chapter 1: Review of Dietary Diversity: Measurement, Meaning & Associations with Nutrient Adequacy and Child Nutritional Status
1
1. REVIEW OF DIETARY DIVERSITY: MEASUREMENT, MEANING, ANDASSOCIATIONS WITH NUTRIENT ADEQUACY AND CHILD NUTRITIONAL STATUS
All people need a variety of foods to meet requirements for essential nutrients, and the value of adiverse diet has long been recognized. In the context of many developing countries, monotonousdiets based on a very small number of foods contribute to micronutrient malnutrition, particularlyin rural areas. In these contexts, a large proportion of calories may come from starchy staples,with relatively low energy density and very few micronutrients. For vulnerable young childrenthe problem is particularly critical, because young children need energy- and nutrient-densefoods to grow and develop. Beyond meeting needs for essential nutrients, diverse diets areincreasingly recognized as playing a role in the prevention of some chronic diseases.
For all these reasons, dietary diversity is recommended as an objective to be included in eachcountry�s food-based dietary guidelines (WHO/FAO, 1998). Dietary diversity is also advocatedin the recently updated guidance for complementary feeding of infants and young children(PAHO/WHO, 2003). However, while there is consensus among nutritionists that dietarydiversity is good, there are a large number of unanswered questions about the definition andmeasurement of diversity, and about the relationships among diversity, nutrient adequacy, andoutcomes such as child nutritional status. Existing knowledge on these issues is reviewed in thischapter.
In addition to reflecting the quality of the diet, dietary diversity has also been linked with foodsecurity, and particularly with household-level access to calories. In an analysis of data from tenpoor and middle-income countries, increases in dietary diversity were associated with increasedavailability of calories both from staples and from non-staple foods, at the household level(Hoddinott and Yohannes, 2002).
Many programs in developing countries seek to improve household access to food, foodconsumption, diet quality, child nutritional status, or all of these. Managers need simple,relevant indicators of progress and impact in order to monitor and evaluate these programs.Managers also need simple, meaningful indicators when they advocate for their programs todonors and policy-makers. Dietary diversity is an attractive indicator because it is relativelysimple to measure, and because it may reflect well improvements in household food access, foodconsumption, and improvements in diet quality. For these reasons, an indicator of dietarydiversity is found on the Title II Generic Indicator list for use in the Title II developmentprogram that is administered by the United States Agency for International Development.
While dietary diversity is a promising indicator, it has not been widely used in developmentprograms. As noted, a number of questions remain. After reviewing existing knowledge, theobjective of this paper is to shed light on several questions about dietary diversity, using datafrom eleven recent Demographic and Health Surveys (DHS)1 to accomplish four main tasks,listed below.
1 The countries included in our analysis are: Benin, Cambodia, Colombia, Ethiopia, Haiti, Malawi, Mali, Nepal, Peru, Rwanda,and Zimbabwe. Criteria for selecting these data sets are described in Chapter 3.

Chapter 1: Review of Dietary Diversity: Measurement, Meaning & Associations with Nutrient Adequacy and Child Nutritional Status
2
Our focus is on dietary diversity and very young children, from the age of six months up to twoyears. During this age span � from 6-232 months � children are very vulnerable. In developingcountries, this is the age span when growth falters, usually due to a combination of frequentillness and inadequate diet that are often present as children transition from breastfeeding to thefamily diet.
The DHS use both a 24-hour and a 7-day food group recall to collect data to characterize dietpatterns among young children. Because a standard questionnaire is used, the DHS data setsprovide an opportunity to explore associations between dietary diversity and child nutritionalstatus using a standardized definition of dietary diversity across countries. We use these datasets to accomplish four tasks:
1. To describe how a simple dietary diversity score relates to diet patterns among youngchildren
2. To explore the feasibility of deriving global or regional cut-off points for low and highdiversity
3. To determine whether simple dietary diversity indicators are meaningfully associatedwith height-for-age among young children across a range of countries
4. To test the nature and strength of the associations between food group and dietarydiversity indicators derived from a 24-hour food group recall and those derived from a 7-day food group recall across a range of countries with varying levels of dietary diversity.
Each of these tasks is described further following a review of current knowledge. The review isin two parts, focusing first on definitions and measurement issues, and secondly on developingcountry studies documenting relationships between dietary diversity, nutrient adequacy, andchild nutritional status.
1.1. Dietary Diversity and Related Terms: Definitions and Measurement
1.1.1. Definitions
Throughout this paper we use the term dietary diversity. This is a widely used term, and hasbeen defined as either the number of foods or the number of food groups consumed over a givenreference period (generally from one day to two weeks). Other authors have used the termsdietary variety or food variety to indicate the same thing.
Two other related terms are nutrient adequacy and dietary quality. Nutrient adequacy refers tothe extent to which the diet provides sufficient energy, protein, and essential micronutrients. Wereview below evidence for a relationship between dietary diversity and nutrient adequacy in thecontext of developing countries.
2 Where age ranges are mentioned, the following convention is used: 6-23 months means 6-23.9 months, 0-5 months means 0-5.9months, 6-9 months means 6-9.9 months, etc.

Chapter 1: Review of Dietary Diversity: Measurement, Meaning & Associations with Nutrient Adequacy and Child Nutritional Status
3
Dietary quality is a broader concept than either dietary diversity or nutrient adequacy.Historically, when the main nutrition concerns were related to nutrient adequacy, nutrientadequacy and dietary quality were often equated. Currently, in developed countries concepts ofdiet quality are multi-dimensional and include the avoidance of excess (for example, of simplecarbohydrates, saturated fat and sodium) as well as achievement of nutrient adequacy. Inmiddle- and low-income countries, concerns about avoidance of excess and imbalanced diets areincreasingly relevant, as diet-related risk factors for chronic disease are rapidly becomingprevalent in many populations (WHO/FAO, 2003). However, in the poorest developingcountries and the poorest areas of many other countries, nutrient adequacy remains thepredominant diet quality concern, particularly when considering the needs of young children.
1.1.2. Measurement of dietary diversity
Dietary diversity is usually measured by summing the number of foods or food groups consumedover a reference period (Krebs-Smith et al., 1987; Löwik, Hulshof, and Brussaard, 1999). Thereference period usually ranges from one to three days, but seven days is also often used andperiods of up fifteen days have been reported (Drewnowski et al., 1997). A variety of dietaryassessment methods have been used, including in-home observation, food frequencyquestionnaires and simple food group recalls.
While most dietary diversity measures consist of a simple count of foods or food groups, somescales in developed countries have weighted elements and/or taken into consideration the numberof servings of different food groups in conformity with dietary guidelines. Examples of thislatter approach include the �dietary score� developed by Guthrie and Scheer (1981), whichallocates equal weights to each of four food groups consumed in the previous 24 hours: milkproducts and meat/meat alternatives receive 2 points for each of 2 recommended servings, andfruits/vegetables and bread/cereals receive 1 point for each of 4 recommended servings.
A modification of this approach developed by Kant et al. (1991; 1993) evaluates the presence ofa desired number of servings from 5 food groups (2 servings each from the dairy, meat, fruit andvegetables groups and four servings from the grain group) over a period of 24 hours. This score,called the �Serving Score�, allocates a maximum of four points to each food group, for a totalscore of 20.
Finally, Krebs-Smith and colleagues (1987) used and compared four different types of dietarydiversity measures (which they refer to as dietary variety): 1) an overall variety score (simplecount of food items), 2) a variety score among major food groups (6 food groups), 3a) a varietyscore within major food groups, counting separate foods, and 3b) a variety score within majorfood groups, counting minor food groups. All dietary measures are based on a 3-day recall.
In developing countries, single food or food group counts have been the most popularmeasurement approaches for dietary diversity, probably because of their simplicity. The numberof servings based on dietary guidelines was not considered in any of the developing countrystudies reviewed. In China (Taren and Chen, 1993), Ethiopia (Arimond and Ruel, 2002) andNiger (Tarini, Bakari, and Delisle, 1999) researchers used food group counts, while in Kenya(Onyango, Koski, and Tucker, 1998), and Ghana and Malawi (Ferguson et al., 1993) they used

Chapter 1: Review of Dietary Diversity: Measurement, Meaning & Associations with Nutrient Adequacy and Child Nutritional Status
4
the number of individual foods consumed. Studies in Mali (Hatloy, Torheim, and Oshaug, 1998)and Vietnam (Ogle, Hung, and Tuyet, 2001) used both single food counts (called the FoodVariety Score (FVS)) and a food group count (called the Dietary Diversity Score (DDS)).
This brief overview highlights the fact that researchers have used a variety of dietary diversitymeasures based on different food and food group classification systems, different numbers offoods and food groups and varying reference period lengths. This has made comparisons amongstudies difficult.
1.1.3. Measurement of nutrient adequacy
In assessing the nutrient adequacy of diets, several types of measures have been used. Theseinclude simple measures of energy and nutrient intake, measures of nutrient density (as a percentof energy) for selected nutrients, and other nutritional indices scored using a fixed cut-off valueof the U.S. Recommended Dietary Allowances (RDA) for each nutrient (for example, two-thirdsor three-fourths of the RDA).
One widely used approach involves calculation of the �nutrient adequacy ratio� (NAR) and the�mean nutrient adequacy ratio� (MAR). These two measures were first developed by Maddenand Yoder (1972) and have since then been used both in developed and developing countries(Guthrie and Scheer 1981; Krebs-Smith et al. 1987; Hatloy, Torheim, and Oshaug 1998). TheNAR is defined as the ratio of intake of a particular nutrient to its recommended dietaryallowance (RDA). The MAR is the average of the NARs, computed by summing the NARs anddividing by the number of nutrients. Each NAR is usually truncated at 100 percent of the RDAsto avoid high consumption levels of some nutrients compensating for low levels of others in theresulting MAR.3
1.1.4. Measurement of dietary quality
Measures of dietary quality range from simple indicators such as the percentage of energy fromanimal sources (Allen et al. 1991) to complex indices that combine both nutrient and foodcomponents (Patterson, Haines, and Popkin 1994; Kennedy et al. 1995; Haines, Siega-Riz, andPopkin 1999). Recognition of the need to include both concepts of nutrient deficiency and over-nutrition in the definition of dietary quality has led to the development of a variety of newmeasurement tools; most of these have been developed for use in the U.S. and Europe. Severalreviews are available which provide descriptions of these tools (Kant, 1996; Ruel, forthcoming).
In developing countries, dietary quality has been equated with nutrient adequacy. Consequently,researchers have often used some combination of the measures described above (nutrient intake,nutrient density, and/or the NAR and MAR) to measure dietary quality. However, as thenutrition transition accelerates in a variety of developing countries, new, multi-dimensionalmeasures will be needed. A 1996 WHO/FAO report recommended that developing countries
3 Note that this approach, although useful, does not completely eliminate interpretation problems arising from situations wherevery low intake of some nutrients exists in combination with high (albeit lower than 100 percent) intake of others.
Chapter 1: Review of Dietary Diversity: Measurement, Meaning & Associations with Nutrient Adequacy and Child Nutritional Status
5
also develop and use measures of dietary quality that capture both problems of nutrientdeficiency and dietary excess and over-nutrition (WHO/FAO 1996).
1.2. Relationships among Dietary Diversity, Nutrient Adequacy, and ChildNutritional Status
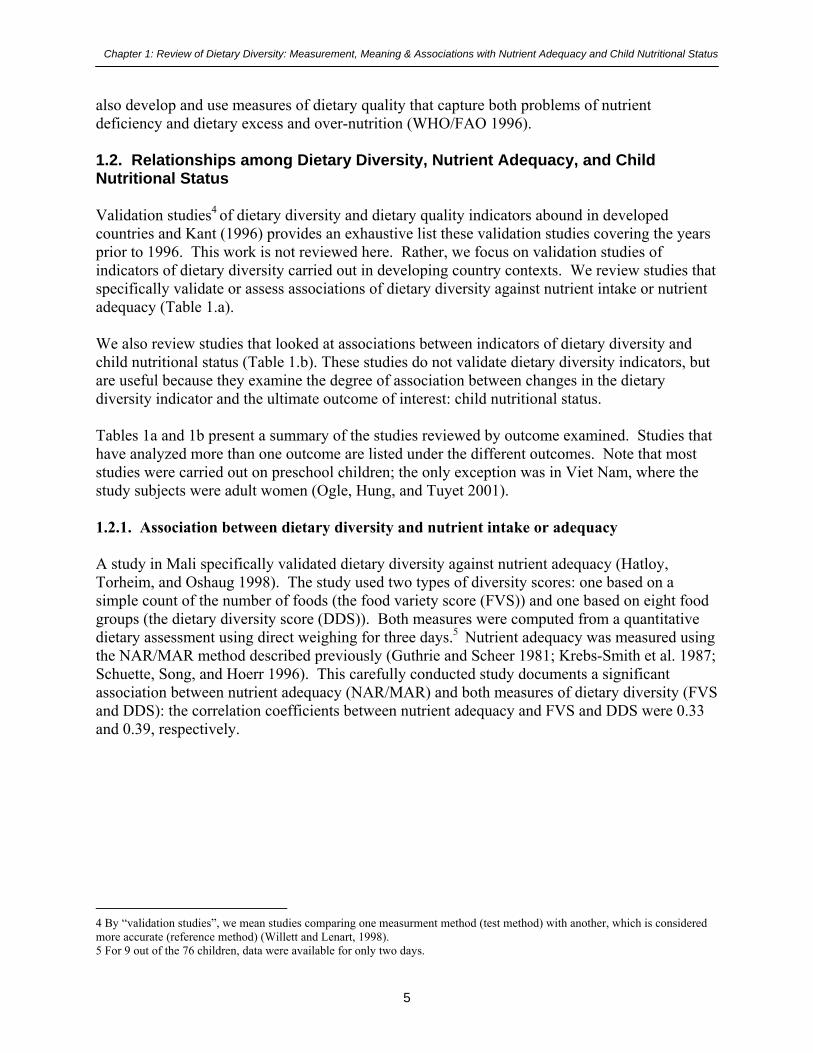
Validation studies4 of dietary diversity and dietary quality indicators abound in developedcountries and Kant (1996) provides an exhaustive list these validation studies covering the yearsprior to 1996. This work is not reviewed here. Rather, we focus on validation studies ofindicators of dietary diversity carried out in developing country contexts. We review studies thatspecifically validate or assess associations of dietary diversity against nutrient intake or nutrientadequacy (Table 1.a).
We also review studies that looked at associations between indicators of dietary diversity andchild nutritional status (Table 1.b). These studies do not validate dietary diversity indicators, butare useful because they examine the degree of association between changes in the dietarydiversity indicator and the ultimate outcome of interest: child nutritional status.
Tables 1a and 1b present a summary of the studies reviewed by outcome examined. Studies thathave analyzed more than one outcome are listed under the different outcomes. Note that moststudies were carried out on preschool children; the only exception was in Viet Nam, where thestudy subjects were adult women (Ogle, Hung, and Tuyet 2001).
1.2.1. Association between dietary diversity and nutrient intake or adequacy
A study in Mali specifically validated dietary diversity against nutrient adequacy (Hatloy,Torheim, and Oshaug 1998). The study used two types of diversity scores: one based on asimple count of the number of foods (the food variety score (FVS)) and one based on eight foodgroups (the dietary diversity score (DDS)). Both measures were computed from a quantitativedietary assessment using direct weighing for three days.5 Nutrient adequacy was measured usingthe NAR/MAR method described previously (Guthrie and Scheer 1981; Krebs-Smith et al. 1987;Schuette, Song, and Hoerr 1996). This carefully conducted study documents a significantassociation between nutrient adequacy (NAR/MAR) and both measures of dietary diversity (FVSand DDS): the correlation coefficients between nutrient adequacy and FVS and DDS were 0.33and 0.39, respectively.
4 By �validation studies�, we mean studies comparing one measurment method (test method) with another, which is consideredmore accurate (reference method) (Willett and Lenart, 1998).5 For 9 out of the 76 children, data were available for only two days.

Cha
pter
1: R
evie
w o
f Die
tary
Div
ersi
ty: M
easu
rem
ent,
Mea
ning
& A
ssoc
iatio
ns w
ith N
utrie
nt A
dequ
acy
and
Chi
ld N
utrit
iona
l Sta
tus
Tab
le 1
a. C
hara
cter
istic
s of t
he st
udie
s tha
t loo
ked
at th
e as
soci
atio
n be
twee
n di
etar
y di
vers
ity a
nd n
utri
ent i
ntak
e or
adeq
uacy
in d
evel
opin
g co
untr
ies1
Aut
hor
Cou
ntry
Age
grou
p
Die
tary
Div
ersi
ty(D
D) a
ppro
ach
(indi
cato
r)
Met
hod
and
refe
renc
epe
riod
Des
crip
tive
DD
findi
ngs
Typ
e of
Val
idat
ion/
asso
ciat
ion
Aga
inst
whi
chm
easu
re?
Mai
n fin
ding
sV
AL
IDA
TIO
N/A
SSO
CIA
TIO
N W
ITH
NU
TR
IEN
T IN
TA
KE
OR
AD
EQ
UA
CY
1. H
atlø
y,To
rhei
man
dO
shau
g,19
98
Mal
i<
60 m
o1)
Foo
d V
arie
ty S
core
(FV
S): s
ingl
e fo
ods
(n=7
5)
2) D
ieta
ry D
iver
sity
Scor
e (D
DS)
: 8 fo
odgr
oups
: sta
ples
,ve
geta
bles
, fru
its,
mea
t, m
ilk, f
ish,
egg
,gr
een
leav
es
Dire
ctw
eigh
ing
for
2-3
d
Tota
lco
nsum
edov
er 2
-3 d
Mea
nFV
S: 2
0.5
DD
S: 5
.8
Val
idat
ion
agai
nst N
AR
and
MA
R
Cal
cula
ted
Sens
itivi
ty(S
e) a
ndsp
ecifi
city
(Spe
) of
diff
eren
t cut
-of
f poi
nts f
orFV
S an
d D
DS
NA
R fo
ren
ergy
, fat
,pr
otei
n, ir
on,
vita
min
A,
thia
min
;rib
ofla
vin,
niac
in,
calc
ium
folic
aci
d.M
AR
(usi
ng75
% R
DA
)
1) C
orre
latio
n FV
S an
d D
DS
with
NA
R: s
igni
fican
t for
% fa
t, vi
tam
in C
,an
d vi
tam
in A
2) C
orre
latio
n M
AR
with
FV
S =
0.33
;w
ith D
DS
= 0.
39
3) D
DS
= st
rong
er d
eter
min
ant o
fM
AR
than
FV
S (r
egre
ssio
n)
4) C
ut-o
ff p
oint
s:D
DS
= 6:
Se=
77%
, Spe
=33%
FVS=
23:
Se=8
7%, S
pe=2
9%2. O
gle,
Hun
g an
dTu
yet,
2001
Vie
tnam
Adu
ltw
omen
1) F
VS:
all
food
s in
7-d
(n>1
20)
2) D
DS:
12
food
grou
ps c
erea
ls, s
tarc
h,gr
een
leaf
yve
geta
bles
, oth
erve
geta
bles
,fis
h/se
afoo
d, m
eat,
eggs
, nut
s/le
gum
es,
frui
ts/ju
ice,
oil/
fats
,sa
uces
,be
vera
ges/
bisc
uits
/sw
eets
7-d
food
freq
uenc
yFV
S:R
ange
: 6-
39;
mea
n=18
and
20 (2
regi
ons)
;
DD
S:R
ange
: 5-
11;
mea
n=8
and
9
Val
idat
ion
agai
nst:
1) in
take
of 1
3nu
trien
ts
2) n
utrie
ntde
nsity
Cre
ated
terc
iles o
fFV
S: lo
w<1
5; h
igh:
>21
Mea
sure
d:1)
nut
rient
inta
ke
2) n
utrie
ntin
take
as %
of e
nerg
y
1) F
VS>
21: s
igni
fican
tly g
reat
er in
take
of m
ost n
utrie
nts t
han
FVS<
15
2) F
VS
>21
also
con
sum
ed h
ighe
rva
riety
of f
oods
from
mos
t foo
d gr
oups
3) D
DS
> 8:
sign
ifica
ntly
hig
her M
AR
of e
nerg
y, p
rote
in, n
iaci
n, v
itam
in C
,zi
nc
4) H
igh
FVS
grou
p ha
d hi
gher
mic
ronu
trien
t den
sity
, esp
ecia
lly fo
rvi
tam
in A
, C, r
ibof
lavi
n an
d ca
lciu
m,
but o
nly
in 1
of 2
regi
ons s
tudi
ed
6

Cha
pter
1: R
evie
w o
f Die
tary
Div
ersi
ty: M
easu
rem
ent,
Mea
ning
& A
ssoc
iatio
ns w
ith N
utrie
nt A
dequ
acy
and
Chi
ld N
utrit
iona
l Sta
tus
Aut
hor
Cou
ntry
Age
grou
p
Die
tary
Div
ersi
ty(D
D) a
ppro
ach
(indi
cato
r)
Met
hod
and
refe
renc
epe
riod
Des
crip
tive
DD
findi
ngs
Typ
e of
Val
idat
ion/
asso
ciat
ion
Aga
inst
whi
chm
easu
re?
Mai
n fin
ding
sV
AL
IDA
TIO
N/A
SSO
CIA
TIO
N W
ITH
NU
TR
IEN
T IN
TA
KE
OR
AD
EQ
UA
CY
3. Bro
wn
etal
. 200
2
Gua
tem
ala
9-11
mo
No.
of s
ingl
e fo
ods
12-h
wei
ghed
inta
ke +
12-
h re
call
Mea
n no
. of
food
s = 1
0B
ivar
iate
asso
ciat
ion
betw
een
dive
rsity
terc
iles a
nden
ergy
and
nutri
ent i
ntak
ean
d nu
trien
tde
nsity
(%en
ergy
)
Inta
ke o
fen
ergy
, fat
,pr
otei
n,vi
tam
in A
,ni
acin
,rib
ofla
vin,
calc
ium
,iro
n, z
inc;
%en
ergy
from
thes
enu
trien
ts a
ndfr
om a
nim
also
urce
food
s
1) D
ieta
ry d
iver
sity
terc
iles a
ssoc
iate
dw
ith: e
nerg
y de
nsity
, non
-bre
ast m
ilken
ergy
, tot
al e
nerg
y, p
rote
in, f
at,
vita
min
A, n
iaci
n, ri
bofla
vin,
cal
cium
,iro
n, z
inc
2) D
ieta
ry d
iver
sity
NO
T as
soci
ated
with
hig
her d
ensi
ty o
f any
of t
hese
nutri
ents
4. Ony
ango
,K
oski
and
Tuck
er,
1998
Ken
ya12
-36
mo
No.
of s
ingl
e fo
ods
Ave
rage
daily
inta
kefr
om 3
24-
hre
calls
Mea
n no
.fo
ods:
5 fo
rB
F ch
ildre
n;6
for n
onB
F ch
ildre
n
Ass
ocia
tion
betw
een
low
<5
and
high
>5
dive
rsity
and
% R
DA
RD
A fo
ren
ergy
,pr
otei
n,vi
tam
in A
,C
, thi
amin
,rib
ofla
vin,
niac
in, i
ron,
calc
ium
Div
ersi
ty >
5 as
soci
ated
with
gre
ater
inta
ke o
f all
nutri
ents
5. Tarin
i,B
akar
i and
Del
isle
,19
99
Nig
er24
-48
mo
Div
ersi
ty sc
ore
(DS)
:11
food
gro
ups o
ver 3
d: c
erea
ls, g
reen
leaf
yve
geta
bles
, oth
erve
geta
bles
,pu
lses
/nut
s,ro
ots/
tube
rs, f
at,
frui
ts, l
egum
es,
milk
/egg
s, m
eat,
suga
r
3-d
mod
ified
wei
ghed
inta
ke. A
llin
gred
ient
sw
eigh
ed; i
fsh
ared
bow
lus
ed c
hild
�sm
outh
fuls
wer
eco
unte
d an
da
sam
ple
ofm
outh
fuls
wei
ghed
DS:
mea
n =
4.8,
5.3
, 5.3
(3 se
ason
s)
Ass
ocia
tion
betw
een
DS
and
nutri
tiona
lqu
ality
scor
e(N
QS)
NQ
S: 4
poin
ts, w
ith1
poin
t eac
hfo
r ade
quac
yof
ene
rgy,
prot
ein,
vita
min
A,
and
zinc
Div
ersi
ty <
5 si
gnifi
cant
ly lo
wer
NQ
Sin
all
3 se
ason
s com
pare
d to
DS
> 6
7

Cha
pter
1: R
evie
w o
f Die
tary
Div
ersi
ty: M
easu
rem
ent,
Mea
ning
& A
ssoc
iatio
ns w
ith N
utrie
nt A
dequ
acy
and
Chi
ld N
utrit
iona
l Sta
tus
Aut
hor
Cou
ntry
Age
grou
p
Die
tary
Div
ersi
ty(D
D) a
ppro
ach
(indi
cato
r)
Met
hod
and
refe
renc
epe
riod
Des
crip
tive
DD
findi
ngs
Typ
e of
Val
idat
ion/
asso
ciat
ion
Aga
inst
whi
chm
easu
re?
Mai
n fin
ding
sV
AL
IDA
TIO
N/A
SSO
CIA
TIO
N W
ITH
NU
TR
IEN
T IN
TA
KE
OR
AD
EQ
UA
CY
6. Ferg
uson
et a
l. 19
93
Gha
na a
ndM
alaw
i36
-72
mo.
1) N
o. o
f si
ngle
food
s
2) 1
3 fo
od g
roup
s:ci
trus,
non-
citru
sfr
uits
, ken
key,
bre
ad,
bank
u (c
orn
orca
ssav
a), f
ufu
(cas
sava
or p
lant
ain)
,fis
h, m
eat,
bush
mea
t,ca
ssav
a, sw
eet
pota
toes
, cor
n,gr
ound
nuts
Ave
rage
over
3-d
from
dire
ctw
eigh
ing
Mea
n da
ilynu
mbe
r of
food
s ran
ged
from
6.4
to7.
1 in
Mal
awi;
7.1
to 8
inG
hana
.Se
ason
alva
riatio
nsfo
und
Cor
rela
tion
betw
een
DD
and
nutri
ent
dens
ities
(res
ults
onl
ybr
iefly
repo
rted)
Nut
rient
dens
ities
(%en
ergy
) for
prot
ein,
fat,
calc
ium
,zi
nc, i
ron
1) N
o co
rrel
atio
n w
ith p
rote
in,
fat,
calc
ium
den
sity
in e
ither
coun
try
2) G
hana
: no
corr
elat
ion
with
zinc
or i
ron
dens
ity
3) M
alaw
i: ne
gativ
e co
rrel
atio
nw
ith ir
on a
nd z
inc
dens
itydu
ring
food
shor
tage
seas
on
4) M
alaw
i: co
rrel
atio
n w
ithen
ergy
inta
kes
7. Ros
e et
al.
2002
Moz
ambi
que
Adu
ltsM
ozam
biqu
e D
iet
Ass
essm
ent T
ool
Hou
seho
ld le
vel:
Each
food
scor
ed 1
-4 b
ased
on n
utrie
nt d
ensi
ty,
avai
labi
lity,
size
of
porti
on. E
.g.:
vege
tabl
es, f
ruits
, oils
,su
gars
=1;
Cer
eals
, bre
ad, t
uber
s=2
Bea
ns, n
uts=
3M
eat,
fish,
milk
, egg
=4
Rec
all o
fal
l foo
dsco
nsum
edby
all
indi
vidu
als a
t all
mea
ls in
1d
Ver
y lo
wsc
ores
:(0
-12:
11%
of
sam
ple)
;av
erag
e(1
2-19
: 35%
);ad
equa
te(>
20:
54%
)
Ass
ocia
tion
with
Die
tary
Qua
ntita
tive
Inde
x (D
QI)
base
d on
quan
titat
ive
diet
ary
asse
ssm
ent
(24-
h re
call
atH
H le
vel)
DQ
I: 10
poin
ts,
base
d on
nutri
ent
adeq
uacy
for:
ener
gy(2
poi
nts)
,vi
tam
in A
(2 p
oint
s),
iron
(2po
ints
),pr
otei
n (2
poin
ts),
7ot
her
nutri
ents
(2po
ints
tota
l).
1) M
ozam
biqu
e D
iet
Ass
essm
ent T
ool (
MD
AT)
asso
ciat
ed w
ith D
iet Q
ualit
yIn
dex
(DQ
I) fo
r all
nutri
ents
exce
pt v
itam
in A
2) C
hang
ing
cut-o
ff p
oint
s tha
tde
fine
low
, ave
rage
and
adeq
uate
scor
es im
prov
edpe
rfor
man
ce o
f MD
AT
8
Cha
pter
1: R
evie
w o
f Die
tary
Div
ersi
ty: M
easu
rem
ent,
Mea
ning
& A
ssoc
iatio
ns w
ith N
utrie
nt A
dequ
acy
and
Chi
ld N
utrit
iona
l Sta
tus
Tab
le 1
b. C
hara
cter
istic
s of t
he st
udie
s tha
t loo
ked
at th
e as
soci
atio
n be
twee
n di
etar
y di
vers
ity a
nd c
hild
nut
ritio
nal s
tatu
s in
deve
lopi
ng c
ount
ries
a
Aut
hor
Cou
ntry
Age
grou
p
Die
tary
Div
ersi
ty(D
D) a
ppro
ach:
(indi
cato
r)
Met
hod
and
refe
renc
epe
riod
Des
crip
tive
DD
find
ing
Typ
e of
Ass
ocia
tion
Aga
inst
whi
chou
tcom
e?M
ain
findi
ngs
ASS
OC
IAT
ION
WIT
H C
HIL
D N
UT
RIT
ION
AL
ST
AT
US
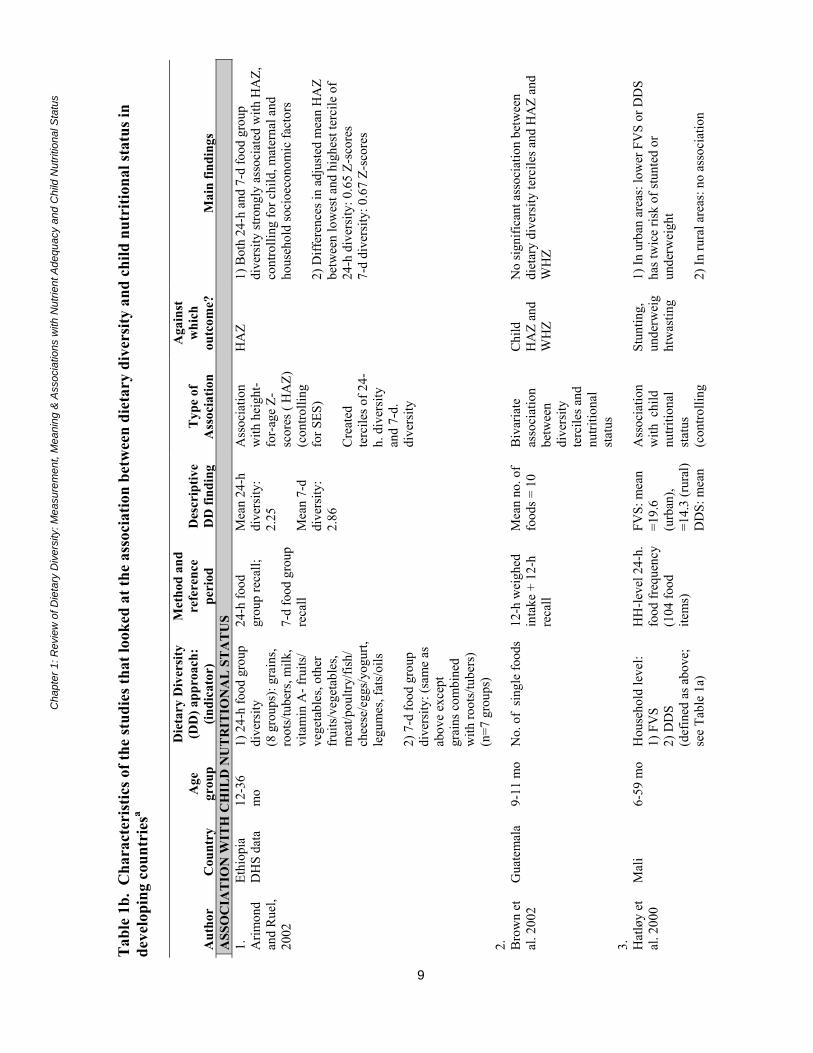
1. Arim
ond
and
Rue
l,20
02
Ethi
opia
DH
S da
ta12
-36
mo
1) 2
4-h
food
gro
updi
vers
ity(8
gro
ups)
: gra
ins,
root
s/tu
bers
, milk
,vi
tam
in A
- fru
its/
vege
tabl
es, o
ther
frui
ts/v
eget
able
s,m
eat/p
oultr
y/fis
h/ch
eese
/egg
s/yo
gurt,
legu
mes
, fat
s/oi
ls
2) 7
-d fo
od g
roup
dive
rsity
: (sa
me
asab
ove
exce
ptgr
ains
com
bine
dw
ith ro
ots/
tube
rs)
(n=7
gro
ups)
24-h
food
grou
p re
call;
7-d
food
gro
upre
call
Mea
n 24
-hdi
vers
ity:
2.25
Mea
n 7-
ddi
vers
ity:
2.86
Ass
ocia
tion
with
hei
ght-
for-
age
Z-sc
ores
( H
AZ)
(con
trolli
ngfo
r SES
)
Cre
ated
terc
iles o
f 24-
h. d
iver
sity
and
7-d.
dive
rsity
HA
Z1)
Bot
h 24
-h a
nd 7
-d fo
od g
roup
dive
rsity
stro
ngly
ass
ocia
ted
with
HA
Z,co
ntro
lling
for c
hild
, mat
erna
l and
hous
ehol
d so
cioe
cono
mic
fact
ors
2) D
iffer
ence
s in
adju
sted
mea
n H
AZ
betw
een
low
est a
nd h
ighe
st te
rcile
of
24-h
div
ersi
ty: 0
.65
Z-sc
ores
7-d
dive
rsity
: 0.6
7 Z-
scor
es
2. Bro
wn
etal
. 200
2G
uate
mal
a9-
11 m
oN
o. o
f si
ngle
food
s12
-h w
eigh
edin
take
+ 1
2-h
reca
ll
Mea
n no
. of
food
s = 1
0B
ivar
iate
asso
ciat
ion
betw
een
dive
rsity
terc
iles a
ndnu
tritio
nal
stat
us
Chi
ldH
AZ
and
WH
Z
No
sign
ifica
nt a
ssoc
iatio
n be
twee
ndi
etar
y di
vers
ity te
rcile
s and
HA
Z an
dW
HZ
3. Hat
løy
etal
. 200
0M
ali
6-59
mo
Hou
seho
ld le
vel:
1) F
VS
2) D
DS
(def
ined
as a
bove
;se
e Ta
ble
1a)
HH
-leve
l 24-
h.fo
od fr
eque
ncy
(104
food
item
s)
FVS:
mea
n=1
9.6
(urb
an),
=14.
3 (r
ural
)D
DS:
mea
n
Ass
ocia
tion
with
chi
ldnu
tritio
nal
stat
us(c
ontro
lling
Stun
ting,
unde
rwei
ght
was
ting
1) In
urb
an a
reas
: low
er F
VS
or D
DS
has t
wic
e ris
k of
stun
ted
orun
derw
eigh
t
2) In
rura
l are
as: n
o as
soci
atio
n
9

Cha
pter
1: R
evie
w o
f Die
tary
Div
ersi
ty: M
easu
rem
ent,
Mea
ning
& A
ssoc
iatio
ns w
ith N
utrie
nt A
dequ
acy
and
Chi
ld N
utrit
iona
l Sta
tus
Aut
hor
Cou
ntry
Age
grou
p
Die
tary
Div
ersi
ty(D
D) a
ppro
ach:
(indi
cato
r)
Met
hod
and
refe
renc
epe
riod
Des
crip
tive
DD
find
ing
Typ
e of
Ass
ocia
tion
Aga
inst
whi
chou
tcom
e?M
ain
findi
ngs
ASS
OC
IAT
ION
WIT
H C
HIL
D N
UT
RIT
ION
AL
ST
AT
US
=6.7
(urb
an)
=6.1
(rur
al)
for S
ES)
(con
trolli
ng fo
r SES
)
4. Tarin
i,B
akar
ian
dD
elis
le,
1999
Nig
er24
-48
mo.
Div
ersi
ty sc
ore
(DS)
: 11
food
grou
ps o
ver 3
d(d
efin
ed a
s abo
ve;
see
Tabl
e 1a
)
3-d
mod
ified
wei
ghed
inta
keD
S: m
ean
=4.
8, 5
.3, 5
.3(3
seas
ons)
Ass
ocia
tion
betw
een
DS
and
child
nutri
tiona
lst
atus
Chi
ldH
AZ,
WA
Z,W
HZ
Ass
ocia
tion
DS
and
nutri
tiona
l sta
tus
not s
igni
fican
t (lo
w c
orre
latio
ns,
sign
ifica
nt o
nly
for W
HZ
in o
nero
und)
.
5. Ony
ango
,K
oski
and
Tuck
er,
1998
Ken
ya12
-36
mo
No.
of s
ingl
e fo
ods
Ave
rage
dai
lyin
take
from
3,
24-h
reca
lls
Mea
n no
.fo
ods:
5 (B
Fch
ildre
n);
6 (n
on B
Fch
ildre
n)
Ass
ocia
tion
with
chi
ldnu
tritio
nal
stat
us(m
ultiv
aria
tean
alys
is, b
utno
con
trol f
orSE
S);
Chi
ldH
AZ,
WA
Z,W
HZ,
trice
pssk
info
ld(T
S), m
id-
uppe
r arm
circ
umfe
ren
ce(M
UA
C)
1) D
iver
sity
ass
ocia
ted
with
HA
Z,W
AZ,
WH
Z, T
S an
d M
UA
C
2) D
iver
sity
>5 m
ore
impo
rtant
for
HA
Z am
ong
non-
BF
child
ren
(diff
eren
ce b
etw
een
dive
rsity
gro
ups:
0.9
HA
Z am
ong
non-
BF,
vs.
0.2
amon
gB
F)
6. Mar
quis
et a
l.19
97
Peru
12-1
5m
o1)
27
food
s and
beve
rage
sco
nsum
ed m
ore
than
twic
e/w
k
2) 5
ani
mal
food
grou
ps: c
ow m
ilk,
mea
t, or
gan
mea
ts,
eggs
, fis
h
Ave
rage
of 3
,1-
mo
food
-fr
eque
ncy
ques
tionn
aire
Mea
n no
.fo
ods:
14.
8
Mea
n no
.an
imal
food
s: 3
.6
Ass
ocia
tion
with
leng
th a
t15
mo.
(mul
tivar
iate
anal
ysis
, but
no c
ontro
l for
SES)
Leng
th a
t15
mo
1) A
ssoc
iatio
n be
twee
n no
. of a
nim
alfo
ods a
nd le
ngth
not
sign
ifica
nt a
s mai
nef
fect
2) In
tera
ctio
ns: a
) ani
mal
food
sas
soci
ated
with
leng
th in
chi
ldre
n w
ithlo
w o
vera
ll di
vers
ity; b
) BF
asso
ciat
edw
ith le
ngth
in c
hild
ren
with
low
inta
kes
of a
nim
al fo
ods
7. Tare
nan
d C
hen
Chi
na12
-47
mo
Food
gro
up sc
ale
(0-7
): ric
e, e
gg,
Rec
all o
f usu
alin
take
at 1
2M
ean
no. o
ffo
od g
roup
s:B
ivar
iate
asso
ciat
ion
Chi
ldH
AZ,
Sign
ifica
nt d
iffer
ence
of 0
.20
HA
Zbe
twee
n ch
ildre
n w
ho c
onsu
med
< 3
10

Cha
pter
1: R
evie
w o
f Die
tary
Div
ersi
ty: M
easu
rem
ent,
Mea
ning
& A
ssoc
iatio
ns w
ith N
utrie
nt A
dequ
acy
and
Chi
ld N
utrit
iona
l Sta
tus
Aut
hor
Cou
ntry
Age
grou
p
Die
tary
Div
ersi
ty(D
D) a
ppro
ach:
(indi
cato
r)
Met
hod
and
refe
renc
epe
riod
Des
crip
tive
DD
find
ing
Typ
e of
Ass
ocia
tion
Aga
inst
whi
chou
tcom
e?M
ain
findi
ngs
ASS
OC
IAT
ION
WIT
H C
HIL
D N
UT
RIT
ION
AL
ST
AT
US
1993
vege
tabl
es, f
ruits
,so
ybea
ns, m
eat,
othe
r
mo.
4.8
with
nutri
tiona
lst
atus
WA
Z,W
HZ
grou
ps a
nd re
st o
f sam
ple
8. Alle
n et
al. 1
991
Mex
ico
18-3
0m
o8
food
gro
ups:
5 pl
ant g
roup
s :to
rtilla
s, le
gum
es,
vege
tabl
es, f
ruits
,ot
her
3 a
nim
al g
roup
s:da
iry, e
ggs,
mea
t
Mea
n da
ilyin
take
from
2-
d qu
antit
ativ
ere
call
data
each
mo
for a
tle
ast 8
mo
88%
of
ener
gyin
take
from
plan
t foo
ds;
12%
from
anim
al fo
ods
Cor
rela
tion
betw
een
%en
ergy
from
diff
eren
t foo
dgr
oups
and
nutri
tiona
lst
atus
Chi
ldH
AZ,
WA
Z,W
HZ
at30
mo
1) P
ositi
ve c
orre
latio
n be
twee
n %
ener
gy fr
om a
nim
al fo
ods a
nd H
AZ
2) P
ositi
ve c
orre
latio
n be
twee
n %
ener
gy fr
om d
airy
food
s and
HA
Z
3) N
egat
ive
corr
elat
ion
betw
een
%en
ergy
from
pla
nt fo
ods (
torti
llas i
npa
rticu
lar)
and
HA
Z
a Abb
revi
atio
ns: B
F: B
reas
tfeed
ing;
DD
S: D
ieta
ry d
iver
sity
scor
e; D
S: D
ieta
ry S
core
; FV
S: F
ood
varie
ty sc
ore;
HA
Z: H
eigh
t-for
-age
Z-s
core
s; H
H:
Hou
seho
ld;
MA
R: m
ean
adeq
uacy
ratio
; MU
AC
: Mid
-Upp
er A
rm C
ircum
fere
nce;
NA
R: N
utrie
nt a
dequ
acy
ratio
; NQ
S: N
utrit
iona
l qua
lity
scor
e;R
DA
: Rec
omm
ende
d di
etar
y al
low
ance
s; S
e: S
ensi
tivity
; SES
: soc
ioec
onom
ic st
atus
; Spe
: Spe
cific
ity;T
S: T
ricep
s ski
nfol
ds; W
AZ:
Wei
ght-f
or-a
ge Z
-sc
ores
; WH
Z: W
eigh
t-for
-Hei
ght Z
-sco
res.
11

Chapter 1: Review of Dietary Diversity: Measurement, Meaning & Associations with Nutrient Adequacy and Child Nutritional Status
12
This study also includes a comparison of the two diversity measures. A regression analysisshowed that DDS (based on food groups) was a stronger determinant of nutrient adequacy thanFVS (based on individual foods). Thus in this context, increasing the number of food groups hasa greater impact on nutrient adequacy than increasing the number of individual foods in the diet.
An additional methodological contribution of the study is the sensitivity-specificity analysiscarried out to identify best cut-off points to predict nutrient adequacy for both diversityindicators. In this sample, the cut-off points of six for food-group diversity and 23 for foodvariety provided the best sensitivity and specificity combinations to predict nutrient adequacy.Although these findings are highly context-specific, they provide useful methodologicalguidance for similar studies to be conducted in other populations.
The study in Viet Nam, which included adult women, used a similar methodology to validate thesame diversity measures (FVS and DDS) against nutrient intake and nutrient density (Ogle,Hung, and Tuyet 2001). FVS and DDS were derived from a seven-day food frequencyquestionnaire and included more than 120 foods and 12 food groups, respectively. The findingsconfirm a positive association between the two measures of diversity and intake of a variety ofnutrients. Women in the highest tercile of FVS�those who had consumed 21 or more differentfoods in 7 days�had a significantly higher intake of most nutrients studied than those from thelowest tercile�who had consumed 15 or fewer foods. Similarly, women with a food groupdiversity greater or equal to eight (out of a maximum of 12 groups) had significantly highernutrient adequacy ratios for energy, protein, niacin, vitamin C, and zinc than women with lowerfood group diversity.6
Two other studies that have looked at the association between diversity measures and nutrientintakes confirm the positive association between dietary diversity and intake of a variety ofnutrients (Onyango, Koski, and Tucker 1998; Tarini, Bakari, and Delisle 1999). In contrast, astudy conducted in Ghana and Malawi documents only weak, and in some cases negative,associations between diversity and density of certain nutrients (Ferguson et al. 1993). In thisstudy, which aimed to describe and compare major nutrient sources in two countries, analysis ofthe association between diversity and nutrient intakes was not a primary objective, and thefindings are reported only briefly.
Finally, a study in Mozambique evaluated a rapid assessment tool called the Mozambican DietAssessment Tool (MDAT); the MDAT can be considered as a context-specific, weighteddiversity score. (Rose et al., 2002). The tool was applied at the household level and gatheredinformation on all individual foods consumed by all household members in one day. Each foodreceived a score of 1�4, based on its nutrient density, the bioavailability of the nutrients itcontains, and typical portion sizes (foods received a lower score if consumed in small amountscompared to foods of similar nutrient value consumed in larger amounts).7 Total scores below12 points were considered to indicate very low dietary quality, 12�19, average, and 20 or higher,adequate. 6 The authors also measured a variety of nutritional status indicators (anthropometry, hemoglobin, serum ferritin, retinol, retinolbinding protein and C-reactive proteins) and report only weak associations between women�s nutritional status and the dietarydiversity measures.7 Examples of foods receiving different scores are as follows: 1: vegetables, fruits, oils, sugars, some popular condiments; 2:cereals, tubers, bread, spaghetti, cookies, cakes; 3: beans, nuts, coconuts; 4: meat, fish, shellfish, eggs, milk products.

Chapter 1: Review of Dietary Diversity: Measurement, Meaning & Associations with Nutrient Adequacy and Child Nutritional Status
13
The association between this rapid assessment tool and a Diet Quality Index (DQI) score8
computed from data from a quantitative household-level 24-hour recall was tested. Findingsshow that households classified by the rapid assessment tool as having acceptable diets hadhigher mean intakes of energy, protein, and iron than those classified as having poor or very poordiets. Findings for vitamin A intakes, however, were in the opposite direction.
This review of developing country research confirms the consistent pattern of a positiveassociation between diversity measures and nutrient adequacy previously documented indeveloped countries. The results are surprisingly consistent, considering the wide differencesamong studies in definitions of foods, food groups, reference period, dietary assessment method,scoring systems, cut-off points used, as well as age of study subjects and general environmentaland socioeconomic characteristics.
1.2.2. Association between dietary diversity and child nutritional status
A number of studies have looked at the association between some measure of dietary diversityand child nutritional status, as seen in Table 1. Our recent analysis of data from the Ethiopia2000 DHS showed a strong and statistically significant association between food-group diversitymeasures based either on a 24-hour or seven-day recall and children�s height-for-age Z-scores(HAZ) (Arimond and Ruel 2002). Figure 1 shows the adjusted mean HAZ of 12�36 month oldchildren by the seven-day food group dietary diversity score.
Figure 1. Mean adjusteda height-for-age Z-scores, by dietary diversity score in previous7-days (children 12-36 months of age: Ethiopia DHS 2000)
aMeans were adjusted for child age and gender, maternal age, height, body mass index, education, parity, attendance atprenatal visits (as a proxy for access to health care), partner�s education, household socioeconomic factors (assets, quality ofhousing, availability of services), number of preschool children, and area of residence.
8 A composite measure was created based on household nutrient intakes of energy, protein, vitamin A, iron, and seven othernutrients. Each of these five components received two points, for a maximum score of 10 points.
-3
-2.5
-2
-1.5
-1
-0.5
0
1 2 3 4 5 6 7 8Number of food groups
Mea
n H
AZ

Chapter 1: Review of Dietary Diversity: Measurement, Meaning & Associations with Nutrient Adequacy and Child Nutritional Status
14
A positive and generally linear trend in mean HAZ is observed as food group diversity increases.The difference between the extremes � one food group as compared to eight � is 1.6 Z-scores.Differences in HAZ scores of this size have been associated with both short-term and long-termfunctional outcomes, especially cognitive development, fulfillment of intellectual potential, workcapacity and reproductive performance, and are therefore considered biologically meaningful, orof functional significance (Martorell and Scrimshaw, 1995). Note that the mean HAZ valuespresented here are adjusted by multivariate analysis for a variety of child, maternal, andhousehold socioeconomic factors, thereby reducing the possibility that this association is due toother potentially confounding influences. When terciles of dietary diversity are used, thedifference in adjusted mean HAZ between children from the lowest diversity tercile compared tothe highest tercile is 0.65 Z-scores. Similar findings are obtained when food group diversity inthe previous 24 hours is used.
A study in Mali also documents a strong association between dietary diversity and nutritionalstatus, for children aged 6-59 months (Hatloy et al. 2000). In urban areas of Mali, lower foodvariety scores (FVS) or dietary diversity scores (DDS) were associated with twice the risk ofbeing stunted or underweight, controlling for socioeconomic factors.9 No association betweendiversity and nutritional status was found in rural areas, however.
In Kenya, diversity was measured as the number of individual foods consumed in 24 hours,using an average of three 24-hour recalls. This was significantly associated with five nutritionalstatus indicators (HAZ, WAZ, WHZ, triceps skinfolds, and mid-upper arm circumference)among 12�36 month old children (Onyango, Koski, and Tucker 1998). In this age group, diversediets appeared to be more strongly related to nutritional status among children who were nolonger breastfed. Among the non-breastfed group, the height-for-age of children with dietarydiversity greater than five was 0.9 Z-scores higher than the HAZ of children with lower dietarydiversity scores. The size of the difference between diversity groups among children who werestill breastfed was only 0.2 Z-scores. This finding highlights the importance of diversity incomplementary foods, especially among children who are no longer breastfed and therefore areentirely dependent on complementary foods for their nutrient intakes.
The importance of animal-source foods as one component of dietary diversity is highlighted instudies in Peru and Mexico (Marquis et al. 1997; Allen et al. 1991). In Peru, animal source foodswere not significantly associated with length at 15 months as a main effect, but significantlyinteracted with overall diversity and breastfeeding in multivariate models.10 Animal foods weresignificantly associated with length at 15 months only among children who had low overalldietary diversity (measured as total number of foods consumed more than twice a week). Theinteraction with breastfeeding, on the other hand, showed that breastfeeding was positively 9 Although the authors did control for socioeconomic factors in their analysis, we have concerns about the validity of the indicatorused to reflect household socioeconomic status. Our main concern is that the indicator was based on a series of household assets,many of which were agricultural tools that may have been irrelevant to socioeconomic status in urban areas. It is well recognizedthat socioeconomic status indicators for urban and rural areas should be created separately (and probably based on a different setof variables) because the characteristics that define wealth in urban and rural areas are expected to be different (Ruel and Menon2002).10 Note that the multivariate models used did not include any indicators of socioeconomic status or maternal education. Theycontrolled for child-level characteristics such as weight-for-height and diarrhea, and for breastfeeding and complementaryfeeding practices.

Chapter 1: Review of Dietary Diversity: Measurement, Meaning & Associations with Nutrient Adequacy and Child Nutritional Status
15
associated with length only among children who had low intakes of animal products. Thisfinding is similar to the one documented previously in Kenya (Onyango, Koski, and Tucker1998) and highlights the importance of dietary diversity (and possibly animal-source foods inparticular) among children who are not breastfed � or, conversely, the importance of continuedbreastfeeding for children who do not receive high quality diets during their second year of life.
Again, in spite of the variety in measurement approaches and environmental conditions, theresults are consistent in showing a positive association between dietary diversity and childnutritional status. One weakness of most studies, however, is the lack of appropriate control forsocioeconomic factors. It may be that the association between diversity and nutritional status isin fact due to socioeconomic factors, because dietary diversity is also associated with householdsocioeconomic characteristics. That is, it may be that dietary diversity is merely a good proxyfor socioeconomic status. In this case better nutritional status may be due to a combination offavorable conditions, including higher maternal education, higher household income, greateravailability of health and sanitation services, etc. On the other hand, improved dietary diversityand nutrient adequacy may in fact be one of the mechanisms through which socioeconomicfactors produce a positive effect on child nutritional status.

Chapter 2: Dietary Diversity in the Demographic and Health Surveys
16
2. DIETARY DIVERSITY IN THE DEMOGRAPHIC AND HEALTH SURVEYS
The Demographic and Health Surveys (DHS) are a series of standardized, nationally-representative surveys that have been implemented in 67 countries since 1984.11 Multiple surveyrounds have been completed in many countries. The earliest DHS surveys are referred to as theDHS-I round; subsequently, the questionnaire has been revised for DHS-II, DHS-III and, mostrecently, the MEASURE DHS+ round.
The current model questionnaire includes two questions on foods and liquids (see Boxes 1 and2). These questions provide much more detail about a range of liquids and foods than didquestions in the earlier DHS rounds. Mothers are asked to provide information for theiryoungest child under three years of age; if there are no children under three no data are collected.Mothers are asked first about a number of liquids and groups of liquids, and then secondly abouta number of food groups. For each liquid or food group, the mother is first asked how manydays in the last week the child drank or ate any item in the group. If the response for the lastweek is greater than zero, the mother is then asked how many times the child had an item in thegroup yesterday (during the day or at night). Liquids and foods were generally grouped based onnutrient content (ORC Macro, 2001).
Box 1. Liquid group recall question from the DHS+ model questionnaire
11 The DHS program is funded by the U.S. Agency for International Development (USAID) and administered by ORC Macro.Summary statistics, country reports, and datasets are available at www.measuredhs.com.
a
b
c
d
e
Now I would like to ask you about liquids (NAME) drank over thelast seven days, including yesterday.
How many days during the last seven days did (NAME) drinkeach of the following?
FOR EACH ITEM GIVEN AT LEAST ONCE IN LAST SEVENDAYS, BEFORE PROCEEDING TO THE NEXT ITEM, ASK:
In total, how many times yesterday during the day or at night did(NAME) drink (ITEM)?
Plain water
Commercially produced infant formula?
Any other milk such as tinned, powdered, or fresh animal milk?
Fruit juice?
Any other liquids such as sugar water, tea, coffee, carbonateddrinks, or soup broth?
IF 7 OR MORE TIMES, RECORD �7�.IF DON�T KNOW, RECORD �8�.
LAST 7 DAYS
NUMBER OFDAYS
a
b
c
d
e
YESTERDAY/LAST NIGHT
NUMBER OFTIMES
a
b
c
d
e

Chapter 2: Dietary Diversity in the Demographic and Health Surveys
17
Box 2. Food group recall question from the DHS+ model questionnaire
a
b
c
d
e
Now I would like to ask you about the types of foods1 (NAME)ate over the last seven days, including yesterday.
How many days during the last seven days did (NAME) eat eachof the following foods either separately or combined with otherfood?
FOR EACH ITEM GIVEN AT LEAST ONCE IN LAST SEVENDAYS, BEFORE PROCEEDING TO THE NEXT ITEM, ASK:
In total, how many times yesterday during the day or at night did(NAME) eat (ITEM)?
Any food made from grains [e.g., millet, sorghum, maize, rice,wheat, porridge, or other local grains]?
Pumpkin, red or yellow yams or squash, carrots, or red sweetpotatoes?2
Any other food made from roots or tubers [e.g., white potatoes,white yams, manioc, cassava, or other local roots/tubers]?
Any green leafy vegetables?
Mango, papaya [or other local vitamin A rich fruits]?
Any other fruits and vegetables [e.g., bananas, apples/sauce, greenbeans, avocados, tomatoes]?
Meat, poultry, fish, shellfish, or eggs?
Any food made from legumes [e.g., lentils, beans, soybeans,pulses, or peanuts]?
Cheese or yoghurt?
Any food made with oil, fat, or butter?
IF 7 OR MORE TIMES, RECORD �7�.IF DON�T KNOW, RECORD �8�.
a
b
c
d
e
f
g
h
i
j
a
b
c
d
e
f
g
h
i
j
1The following separate food categories must be added in countries where these foods are fed to children:commercially prepared baby food; chicken/beef liver, tripe, other organ meats; grubs, snails, insects, other smallprotein food.
2Items in this category should be modified to include only vitamin A rich tubers, starches, or red or yellowvegetables that are consumed in the country.
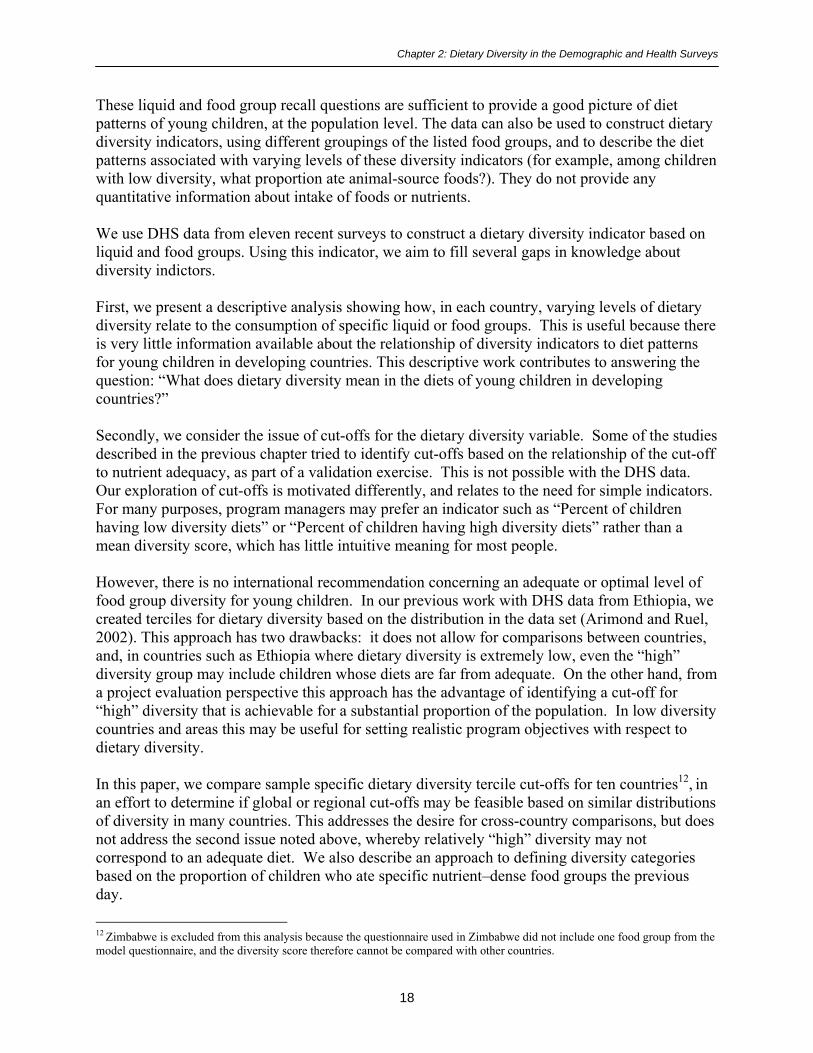
Chapter 2: Dietary Diversity in the Demographic and Health Surveys
18
These liquid and food group recall questions are sufficient to provide a good picture of dietpatterns of young children, at the population level. The data can also be used to construct dietarydiversity indicators, using different groupings of the listed food groups, and to describe the dietpatterns associated with varying levels of these diversity indicators (for example, among childrenwith low diversity, what proportion ate animal-source foods?). They do not provide anyquantitative information about intake of foods or nutrients.
We use DHS data from eleven recent surveys to construct a dietary diversity indicator based onliquid and food groups. Using this indicator, we aim to fill several gaps in knowledge aboutdiversity indictors.
First, we present a descriptive analysis showing how, in each country, varying levels of dietarydiversity relate to the consumption of specific liquid or food groups. This is useful because thereis very little information available about the relationship of diversity indicators to diet patternsfor young children in developing countries. This descriptive work contributes to answering thequestion: �What does dietary diversity mean in the diets of young children in developingcountries?�
Secondly, we consider the issue of cut-offs for the dietary diversity variable. Some of the studiesdescribed in the previous chapter tried to identify cut-offs based on the relationship of the cut-offto nutrient adequacy, as part of a validation exercise. This is not possible with the DHS data.Our exploration of cut-offs is motivated differently, and relates to the need for simple indicators.For many purposes, program managers may prefer an indicator such as �Percent of childrenhaving low diversity diets� or �Percent of children having high diversity diets� rather than amean diversity score, which has little intuitive meaning for most people.
However, there is no international recommendation concerning an adequate or optimal level offood group diversity for young children. In our previous work with DHS data from Ethiopia, wecreated terciles for dietary diversity based on the distribution in the data set (Arimond and Ruel,2002). This approach has two drawbacks: it does not allow for comparisons between countries,and, in countries such as Ethiopia where dietary diversity is extremely low, even the �high�diversity group may include children whose diets are far from adequate. On the other hand, froma project evaluation perspective this approach has the advantage of identifying a cut-off for�high� diversity that is achievable for a substantial proportion of the population. In low diversitycountries and areas this may be useful for setting realistic program objectives with respect todietary diversity.
In this paper, we compare sample specific dietary diversity tercile cut-offs for ten countries12, inan effort to determine if global or regional cut-offs may be feasible based on similar distributionsof diversity in many countries. This addresses the desire for cross-country comparisons, but doesnot address the second issue noted above, whereby relatively �high� diversity may notcorrespond to an adequate diet. We also describe an approach to defining diversity categoriesbased on the proportion of children who ate specific nutrient�dense food groups the previousday.
12 Zimbabwe is excluded from this analysis because the questionnaire used in Zimbabwe did not include one food group from themodel questionnaire, and the diversity score therefore cannot be compared with other countries.

Chapter 2: Dietary Diversity in the Demographic and Health Surveys
19
Thirdly, we relate dietary diversity to height-for-age Z-scores (HAZ) for children 6-23 months.As noted in the review, a number of studies have shown some relationship between dietarydiversity and anthropometric indicators. Clearly a child�s current height, which is the product ofprocesses beginning in utero, is not determined by what was eaten yesterday or last week.Recent dietary diversity will be meaningful as a contributor to growth to the extent that it reflectsdietary patterns and nutrient adequacy over longer, biologically meaningful time periods. Forexample, if children with more diverse diets yesterday and/or in the past week have generallyreceived more diverse, higher quality diets over the last year, then measures of recent dietarydiversity may be meaningfully related to outcomes.
We first present information on bivariate relationships between dietary diversity and HAZ, thenassess the relationship while controlling for a number of maternal and household-level factors.
Fourthly and finally, we address the issue of the �added value� of the 7-day food group recall,above and beyond the 24-hour food group recall. This issue has been under discussion forseveral years, both in relation to the DHS questionnaire, and in relation to the widely usedKnowledge, Practices, and Coverage (KPC) 2000+ questionnaire. The objective of this latterquestionnaire is to provide a simple, standardized and quantitative survey tool, useful both forbaseline assessments and for assessments of outputs and outcomes of Child Survival and Healthprojects funded by USAID. Like the DHS, the KPC has included a 24-hour food-group recall.Based on feedback from private voluntary organizations (PVOs) that pilot-tested a versionsimilar to the DHS, the 7-day food group recall was not included in the KPC.
We assess the added value of the 7-day recall by comparing results for the 24-hour recall toresults for the 7-day recall, both for individual food and liquid groups, and for the diversityindicators.
The next chapter (Chapter 3) describes the selection of data sets and statistical methods. Chapter4 presents selected descriptive statistics for households, women and their partners, and thechildren in order to provide a context for the analysis of the food group recall data. Chapter 5presents results for the first task above, describing differences in food group patterns by diversityscore within each country. Chapter 6 addresses the issue of the feasibility and usefulness of cut-offs for low and high diversity. Chapter 7 reports results describing the association betweendietary diversity and height-for-age in these DHS data sets. Chapter 8 addresses the question ofthe added value of the 7-day food group recall, above and beyond the 24-hour food group recall,when the objective is to assess population-level diet patterns of young children. Chapter 9summarizes our analyses and highlights remaining questions.

Chapter 3: Methods
20
3. METHODS
3.1. Selection of Data Sets
We used the following three criteria for selecting data sets:
1. Surveys from the DHS+ round (the most recent round, which provides information onmore liquids and food groups)
2. Countries in Africa, South or Southeast Asia, or the Latin America/Caribbean region3. The food-group recall on the questionnaire must have included at least seven of the
following eight food groups:! Food made from grains! Food made from roots and tubers! Food made from legumes! Dairy! Meat, poultry, fish or eggs! Vitamin A-rich fruits and vegetables! (one or more of the three sub-groups on the model questionnaire)! Other fruits and vegetables! Foods made with oil, fat or butter
Eleven data sets met these criteria. For some countries, preliminary data were available at thetime the data were acquired and analysis begun. A �P� in the list below indicates preliminarydata. Countries and survey years included in the analysis were:
! Africa:− Benin 2001− Ethiopia 2000 P− Malawi 2000− Mali 2001 P− Rwanda 2000 P− Zimbabwe 1999
! Asia:− Cambodia 2000− Nepal 2001 P
! Latin America/Caribbean:− Colombia 2000− Haiti 2000 P− Peru 2000 P
Within these countries, all living children aged 0-23 months were selected, then, one child perhousehold was randomly selected. Table 2 shows the number of children aged 6-23 monthsremaining in each data set after selecting one child per household, as our analyses focus onchildren in this age group.

Chapter 3: Methods
21
Table 2. Sample size by country
Country
Number ofchildren 6-23months of age
AfricaBenin 1312Ethiopia 2697Malawi 3228Mali 1136Rwanda 2110Zimbabwe 958
AsiaCambodia 2049Nepal 1809
Latin America/CaribbeanColombia 1346Haiti 1758Peru 3662
3.2. Variations in Questionnaires
Ten of the eleven countries included all eight food groups. In Zimbabwe the food group list didnot include foods made with fats and oils, so Zimbabwe is excluded from analyses comparinglevels of dietary diversity across countries. The Haiti survey included the 24-hour food-grouprecall, but not the 7-day food group recall, so Haiti is excluded from analyses comparing the 24-hour to the 7-day food group recall.
The DHS questionnaires are meant to be adapted, at country level, to include foods in each groupthat are locally available. However, sometimes this adaptation process results in somesignificant deviations from the Model questionnaire. Most of the substantive differencesoccurred in relation to infant formula and �other milks�, and in relation to the vitamin A-richfruits and vegetables (for example, with the inclusion of items not rich in vitamin A, such ascelery, leeks, etc.). Differences from the Model questionnaire are documented in Annex 1.
3.3. Data Cleaning
DHS data sets undergo extensive cleaning before they are released. In the case of most variables,we performed no additional cleaning. However, in the case of the children�s height-for-age, weexcluded additional extreme values, based on the �flexible criteria� recommended by WHO(WHO, 1995). Z-scores that were more than 4 Z-score units from the sample-specific meanvalue were excluded. The exception to this (per same recommendations) was that an upper limitof +3.0 is used for HAZ. For mothers, we examined outliers for height, and based on observeddistributions and BMIs for outliers, excluded heights less than 135 cm or greater than 183 cm.Because the BMI calculation includes height, BMI was also coded missing for these women.

Chapter 3: Methods
22
3.4. Variable Construction
3.4.1. Dietary diversity
Until validation studies provide information on the relationship between various formulations ofdiversity indicators and nutrient adequacy, decisions about grouping foods will remain somewhatarbitrary.
When working with data sets with existing food groupings, as with the DHS data sets, certaindecisions have already been made and grouped foods cannot be �ungrouped�. For example, wecannot separate �eggs yesterday� from �meat, poultry, fish, and shellfish yesterday� even thoughthere are some nutritional differences (eggs are not a good source of iron, and meat, poultry, etc.are a good source). The only remaining decisions involve selecting which groups to include, andcombining existing groups on the questionnaire.
In selecting groups to include in the diversity variable, we organized our thinking around the ideaof measuring diversity in complementary feeding. Because our focus was on complementaryfeeding, neither breastmilk nor infant formula was included in our diversity indicator; infantformula is considered as a replacement for, and not a complement to breastmilk. However, othermilks, yogurt, and cheese were combined into a dairy variable and provide one point in thediversity score.
Secondly, and in order to balance the number of plant food vs. animal-source food groups, wecombined all three vitamin A-rich fruit and vegetable groups into one variable for the purposesof the diversity score. That is, any child who had any of the three vitamin A-rich plant foodgroups in the last 24-hours (or last 7 days) is given a point towards his/her diversity score.
Thirdly, we combined grain-based foods with roots and tubers. Although these are somewhatdifferent from each other nutritionally, other nutritionally different foods are already groupedtogether on the questionnaire (for example, eggs and meat). We did not feel that a child whohad, for example, maize and cassava yesterday should score two points, while a child who hadmeat and eggs yesterday should score one point.
Finally, we combined �other fruits and vegetables� (other than vitamin A-rich fruits andvegetables) with fruit juice. Fruit juice may provide some of the same vitamins found in thisgeneral fruits and vegetables group (notably, vitamin C from citrus juice, pineapple juice andsome others). Excess consumption of sweet drinks � including juice � by small children maydisplace food or may be associated with excess calorie intake, and is a concern in developedcountries. It may also be a concern in some middle- and low-income countries, particularly inurban areas. However, in the poorest countries and poorest areas, consumption of fruit juice maymake a positive contribution to nutrient intake.
The final 7-point diversity score included the groups shown in Box 3.

Chapter 3: Methods
23
Box 3. Food groups in dietary diversity score
1. Starchy staples � two questionnaire items combined:Foods made from grainFoods made from roots or tubers
2. Food made from legumes3. Dairy � two items combined:
Milk other than breastmilkCheese or yogurt
4. Meat, poultry, fish or eggs5. Vitamin A-rich fruits and vegetables � three items combined:
Pumpkin, red or yellow yams or squash, carrots, or red sweet potatoesGreen leafy vegetablesMango, papaya, or other local vitamin A rich fruits
6. Other fruits and vegetables, or fruit juice � two items combined7. Foods made with oil, fat or butter
The intention was to develop a score that included a point for each of the major nutritionallyimportant types of food the child may have eaten, while providing some balance between plantfoods and animal-source foods. Other liquids, such as thin soups, teas, and infusions are notincluded in the diversity score; generally these liquids are neither energy- nor nutrient-densebecause water is a primary ingredient.
Diversity scores for the 24-hour and the 7-day food group recall were constructed by summingthese seven food groups. In order to construct diversity variables scoring the number of foodgroups eaten 3 or more days out of the last 7 days, and 4 or more days out of the last 7 days, weneeded to make some assumptions about the 7-day recall data, when items were combined.
Mothers were asked how many days out of the last seven days their child had eaten each item.For items that are not combined in the list above � such as legumes � variables were easilyconstructed indicating whether the child had the food three or more days (or four or more days).For combined items, it was not possible to know if the days the mother reported for one itemoverlapped, or were entirely different from the days she reported for the other item(s). Forexample, if the child had mango 3 days and leafy greens 3 days, the number of days the childactually had vitamin A-rich fruits and vegetables could have been as few as 3 (if she had bothmango and leafy greens on the same 3 days, and neither the other days) or as many as 6 (if shenever had mango and greens on the same day). In these cases, we took the mean number of daysout of this possible range (in this example, 4.5) and assigned that as the number of days the childhad the food group.
We then constructed dichotomous variables for each food group (for example, did the child havethe food group 3 or more days, or not?) and summed these variables to construct scores fordiversity indicating the number of food groups each child ate at least 3 days out of the last seven.

Chapter 3: Methods
24
Finally, the diversity scores were used to create a series of categorical variables, indicating low,middle and high diversity. Several types of categorical variables were constructed. First, usingthe data for all children aged 6-23 months, terciles were constructed for dietary diversity.Secondly, age-specific terciles were constructed, within narrow age ranges (6-8 months, 9-11months, 12-17 months, and 18-23 months). Children were ranked as having had low, middle, orhigh diversity compared to children in their same narrow age group, then these ranking variableswere combined into a single age-specific ranking variable for all the children. Finally,categorical variables were constructed using fixed cut-offs of 0-2, 3-4, and 5-7 food groups.
3.4.2. Proxy index for household wealth
Following the method developed by Filmer and Prichett (1998), we used principal componentsanalysis as a data reduction tool to combine a large number of variables into a household-levelindex. For simplicity, and following Filmer and Prichett, we refer to this as an �asset index�.Note that there are several categories of variables included in the principal components analysis,not all of which are assets. The categories of variables are:
! Household items: radios, telephones, television, refrigerator! Whether or not the household has electricity! Ownership of bicycle, motorcycle or car/truck! Agricultural implements and related assets (hoes, plows, etc.)! Main source of drinking water! Type of toilet or latrine (or none)! Main material of the floor! Main material of the roof! Main type of fuel used for cooking! Number of household members per sleeping room
Some categories of variables were not available in all countries (for example, only Benin,Cambodia, Ethiopia, and Peru had information on the main material of the roof, and onlyColombia, Ethiopia, and Peru had the number of household members per sleeping room). Manycountries had no information on agricultural implements/assets. In some cases, variables wereincluded in the data set but in our sub-sample there was no variability, and these were dropped.
In addition to the list above, country-specific variables were included where these wereavailable. For example, in Benin there was a variable for ownership of a boat; in Cambodiathere were variables for ownership of a sewing machine or loom, a boat with motor, and a boatwithout a motor. Several countries had one or more variables for ownership of livestock. Annex2 presents a complete list of the variables included in the principal components analysis for eachcountry.
Gwatkin and colleagues (2000) provide a model for using the Filmer/Pritchett approach withDHS data. We have followed their methods, except that we performed the analysis separatelyfor urban and rural areas, because the assets and household characteristics that differentiate betteroff from worse off households can be expected to vary between urban and rural areas. Once theindex was constructed, we used the index score to create terciles, again separately for urban and

Chapter 3: Methods
25
rural areas. These ranking variables (terciles) were then combined into a single variable, witheach child/household was scored as low, middle, or high for the index. Dummy variables for theindex terciles were in turn used in the regression analyses. More details of the construction ofthe index, for each country, are included in Annex 2.
3.5. Analytical Methodology
Sample weights (available in each DHS data file) were used for all analyses. Initial variableconstruction was performed in SPSS for Windows, version 11.0. Statistical tests were performedusing Stata (version 7). Stata allows specification of sample design, and can provide appropriatestatistical tests given the stratified cluster sample design of the surveys.
For the first and third tasks listed in the introduction � description of diet patterns by diversityscore, and addressing the issue of cut-offs � simple descriptive statistics are presented. Methodsfor the second and fourth tasks are detailed next.
Analyses for task 3: To determine whether simple dietary diversity indicators are meaningfullyassociated with height-for-age among young children.
We first performed bivariate analyses comparing mean HAZ for children in low, middle, andhigh diversity groups. The statistical significance of differences between means was tested usingan adjusted Wald test for joint hypothesis testing (StataCorp, 2001, p. 210).
In the multivariate analyses, the dependent variable was HAZ. The independent variablesincluded dietary diversity (age-specific terciles for number of food groups eaten 3 or more daysin the last seven), and a series of child, maternal, and household characteristics that are known tobe associated with child nutritional status, namely:
! Biological variables:− Child age (and age squared)− Sex of child− Maternal height
! Variables reflecting household welfare/socioeconomic status:− Maternal BMI− Maternal education− Education of mother�s partner− Number of antenatal care visits (related to welfare/socioeconomic status, but also
serves as a proxy for access to health care)− Whether the household is in an urban or rural area− Asset index tercile
! Other variables:− Whether the child was still breastfed (related to socioeconomic status, but also
influences nutrient requirements from complementary food; included in order toassess interactions with dietary diversity)
− Number of children in household under five years (related both to mother�s parity andto socioeconomic status)
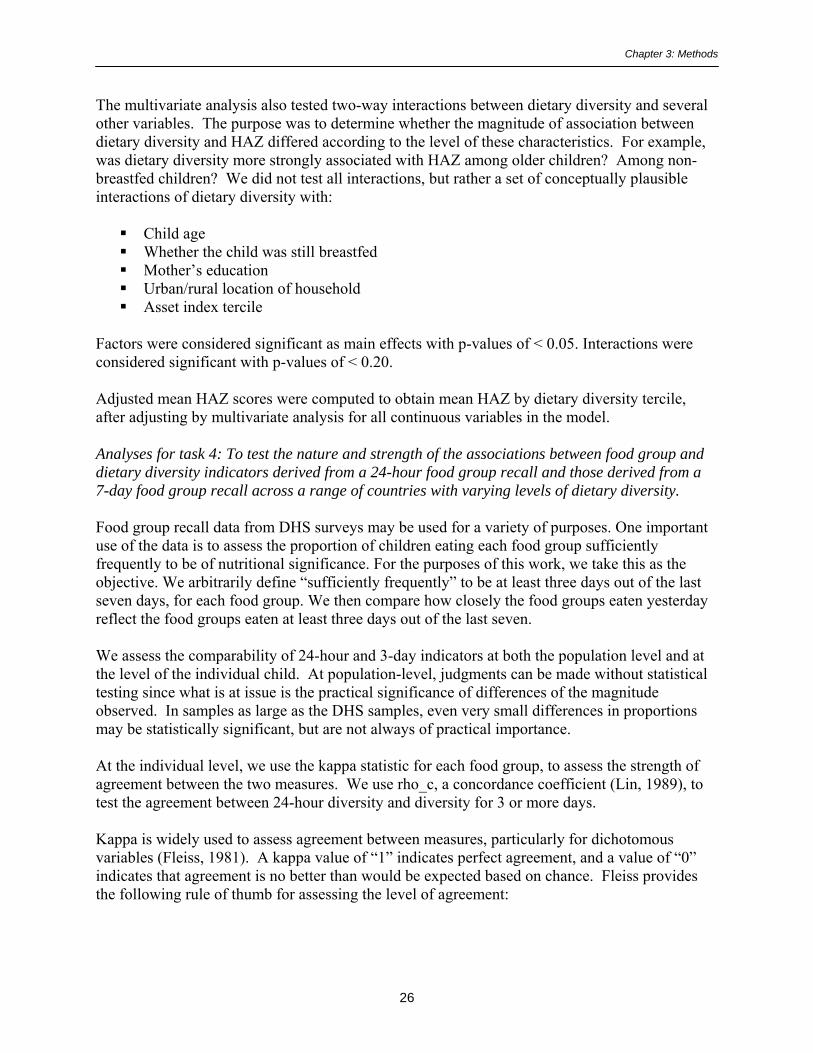
Chapter 3: Methods
26
The multivariate analysis also tested two-way interactions between dietary diversity and severalother variables. The purpose was to determine whether the magnitude of association betweendietary diversity and HAZ differed according to the level of these characteristics. For example,was dietary diversity more strongly associated with HAZ among older children? Among non-breastfed children? We did not test all interactions, but rather a set of conceptually plausibleinteractions of dietary diversity with:
! Child age! Whether the child was still breastfed! Mother�s education! Urban/rural location of household! Asset index tercile
Factors were considered significant as main effects with p-values of < 0.05. Interactions wereconsidered significant with p-values of < 0.20.
Adjusted mean HAZ scores were computed to obtain mean HAZ by dietary diversity tercile,after adjusting by multivariate analysis for all continuous variables in the model.
Analyses for task 4: To test the nature and strength of the associations between food group anddietary diversity indicators derived from a 24-hour food group recall and those derived from a7-day food group recall across a range of countries with varying levels of dietary diversity.
Food group recall data from DHS surveys may be used for a variety of purposes. One importantuse of the data is to assess the proportion of children eating each food group sufficientlyfrequently to be of nutritional significance. For the purposes of this work, we take this as theobjective. We arbitrarily define �sufficiently frequently� to be at least three days out of the lastseven days, for each food group. We then compare how closely the food groups eaten yesterdayreflect the food groups eaten at least three days out of the last seven.
We assess the comparability of 24-hour and 3-day indicators at both the population level and atthe level of the individual child. At population-level, judgments can be made without statisticaltesting since what is at issue is the practical significance of differences of the magnitudeobserved. In samples as large as the DHS samples, even very small differences in proportionsmay be statistically significant, but are not always of practical importance.
At the individual level, we use the kappa statistic for each food group, to assess the strength ofagreement between the two measures. We use rho_c, a concordance coefficient (Lin, 1989), totest the agreement between 24-hour diversity and diversity for 3 or more days.
Kappa is widely used to assess agreement between measures, particularly for dichotomousvariables (Fleiss, 1981). A kappa value of �1� indicates perfect agreement, and a value of �0�indicates that agreement is no better than would be expected based on chance. Fleiss providesthe following rule of thumb for assessing the level of agreement:

Chapter 3: Methods
27
Kappa below 0.40 Poor agreement0.40-0.74 Fair to good agreement0.75 or higher Excellent agreement
The concordance coefficient, rho_c, is an appropriate statistic for assessing agreement betweentwo continuous measures (or ordered categorical variables with many categories, such as ourdiversity score). The concordance coefficient combines measures of both accuracy and precisionto determine if the data deviate significantly from the line of perfect concordance (i.e., the line at45 degrees). The strength of association represented by a particular concordance coefficient canbe evaluated similarly to a simple correlation coefficient.

Chapter 4: Description of Households, Mothers, and Children
28
4. DESCRIPTION OF HOUSEHOLDS, MOTHERS, AND CHILDREN
In order to provide some context for the analysis of dietary diversity, this chapter presents aseries of tables and figures with key descriptive statistics, by country. We include the following:
! Selected household characteristics! Characteristics of the mother and her partner! Selected proxies for access to health care! Anthropometric indicators for children aged 6-23 months! Morbidity and feeding during diarrhea for children aged 6-23 months! Feeding practices for children aged 6-23 months
4.1. Selected Household Characteristics
Table 3 presents descriptive statistics for key household characteristics, and provides a snapshotof some of the major differences between countries. In most countries, more than two-thirds ofthe households are in rural areas; in Colombia and Peru the proportion is much lower (32% and44%, respectively). The proportion of female-headed households ranges from 11-22% in mostcountries, but is markedly higher in Zimbabwe (32%) and Haiti (37%).
The proportion of households with piped water is lowest in Cambodia (4%) and Ethiopia (13%)and is well under 50% in all the other African and Asian countries. In Latin America, theproportion with piped water ranges from 50% in Haiti to 83% in Colombia.
Access to latrines/toilets differs from some of the other characteristics in that countries wherehouseholds have poor access to piped water and electricity may have a high proportion ofhouseholds using latrines (for example, Malawi, Mali, and Rwanda).
In general, Colombia and Peru have more favorable household characteristics, while Ethiopiaconsistently ranks low.
4.2. Characteristics of the Mother
Table 4 presents selected descriptive statistics for the mother and her partner. Average maternalheight was lowest in Nepal, Cambodia and Peru (150-153 cm) and highest (>158 cm) in Haiti,Benin, Mali and Zimbabwe. The proportion of women with low BMI (< 18.5) ranged from 1%-11% in most countries, but was markedly higher in Ethiopia (26%) and both Asian countries(Cambodia with 20% and Nepal with 24%). At the other end of the spectrum, the highest ratesof overweight and obesity (BMI ≥ 25) were in Colombia (38%) and Peru (42%).
Maternal education and literacy varied particularly widely between countries. In four countries,over 70% of women reported that they had not attended school at all (Benin, Ethiopia, Mali andNepal). In another set of countries, approximately 1/3 of the women reported no education(Malawi, Rwanda, Cambodia, and Haiti). In the remaining countries (Zimbabwe, Colombia, andPeru) the proportion with no education was less than 10%, and in these same countries over 50%of the women surveyed had at least some secondary education.

Cha
pter
4: D
escr
iptio
n of
Hou
seho
lds,
Mot
hers
, and
Chi
ldre
n
Tab
le 3
. Se
lect
ed h
ouse
hold
cha
ract
eris
tics,
by c
ount
ry (a
ll ho
useh
olds
with
chi
ldre
n 0-
23 m
onth
s)
Afr
ica
Asi
aL
atin
Am
eric
a/C
arib
bean
Ben
inE
thio
pia
Mal
awi
Mal
iR
wan
daZ
imba
bwe
Cam
bodi
aN
epal
Col
ombi
aH
aiti
Peru
% r
ural
6690
8773
8567
8794
3268
44%
fem
ale-
head
ed13
1219
2217
3218
1121
3713
% w
ith p
iped
wat
er40
1322
2835
434
3383
5066
% w
ith n
o to
ilet o
rla
trin
e, u
se fi
eld/
bush
/riv
er70
8519
203
2985
7912
4629
% w
ith e
lect
rici
ty19
74
116
3412
1794
3060
% w
ith r
adio
7720
5873
4051
3641
8446
82%
with
bic
ycle
550
4951
1021
4929
NA
1422
Tab
le 4
. C
hara
cter
istic
s of m
othe
r an
d he
r pa
rtne
r, b
y co
untr
y (a
ll ho
useh
olds
with
chi
ldre
n 0-
23 m
onth
s)
Ben
inE
thio
pia
Mal
awi
Mal
iR
wan
daZ
imba
bwe
Cam
bodi
aN
epal
Col
ombi
aH
aiti
Peru
Mat
erna
l hei
ght
(Mea
n ht
in c
m)
158.
115
7.2
155.
716
1.6
158.
015
9.4
152.
515
0.3
154.
515
8.1
150.
2
Mat
erna
l BM
IM
ean
% <
18.
5%
≥ 2
5.0
21.9 11 13
20.0 26 3
21.9 6 10
21.8 9 13
22.4 6 15
22.9 5 20
20.4 20 4
20.1 24 3
24.4 3 38
22.3 10 19
24.8 1 42
Mat
erna
l edu
catio
n%
with
non
eSo
me/
all p
rim
ary
At l
east
som
e 2º
71 20 9
81 14 5
31 61 8
82 11 6
32 57 11
6 43 51
32 53 15
73 14 13
3 39 58
38 47 15
7 38 55%
of m
othe
rs w
ho
cann
ot r
ead
at a
ll81
8048
8735
NA
3767
NA
5314
Pate
rnal
edu
catio
n%
with
non
eSo
me/
all p
rim
ary
At l
east
som
e 2º
52 27 22
62 27 12
17 65 18
78 10 12
32 56 13
4 35 61
17 50 33
36 25 39
4 40 57
29 42 30
2 31 67
29

Cha
pter
4: D
escr
iptio
n of
Hou
seho
lds,
Mot
hers
, and
Chi
ldre
n
Tab
le 5
. Se
lect
ed p
roxi
es fo
r ac
cess
to h
ealth
car
e, b
y co
untr
y (a
ll ho
useh
olds
with
chi
ldre
n 0-
23 m
onth
s)
Ben
inE
thio
pia
Mal
awi
Mal
iR
wan
daZ
imba
bwe
Cam
bodi
aN
epal
Col
ombi
aH
aiti
Peru
% o
f wom
en w
ith n
o an
tena
tal v
isits
for
last
pre
gnan
cy9
745
466
654
509
2013
% o
f wom
en w
ith
four
or
mor
e an
tena
tal v
isits
for
last
pre
gnan
cy
1056
3310
7710
1488
4371
% o
f wom
en
deliv
erin
g at
hom
e (o
wn
/oth
er h
ome)
2095
4659
7422
9087
1374
42
% w
ho w
ere
give
n or
bo
ught
iron
ta
blet
s / sy
rup
duri
ng la
st
preg
nanc
y
85N
A66
3620
6123
2473
5758
% w
ho r
ecei
ved
a V
it. A
dos
e w
/in 2
m
os a
fter
last
de
liver
y
2012
3918
15N
A9
11N
A25
15
% o
f chi
ldre
n w
ho
rece
ived
a V
it A
do
se in
last
6 m
os19
5062
3765
NA
24N
AN
A32
NA
30

Chapter 4: Description of Households, Mothers, and Children
31
4.3. Proxies for Access to Health Care
Table 5 presents some proxies for access to health care services (including antenatal care andmicronutrient supplementation). The proportion of women who reported attending no antenatalvisits is highest in Ethiopia (74%), and is also quite high in Mali, Cambodia, and Nepal (46%-54%).
Information on iron and vitamin A supplements is not available for all countries; amongcountries with data, the proportion of women receiving iron supplements during pregnancy(yes/no) ranges from a low of 20% in Rwanda to a high of 85% in Benin. The coverage of post-partum vitamin A supplementation and vitamin A supplementation for children also varieswidely. Note that access to supplementation for children � which occurs through differentchannels � is not related to access to antenatal care. For example, very few women in Ethiopiareceived antenatal care, but 50% of the children were reported to have received vitamin Asupplements in the last six months.
4.4. Anthropometric Indicators for Children Aged 6-23 Months
Figure 2 illustrates the prevalence of low height-for-age (HAZ < -2). Prevalence of low HAZ ishighest in Ethiopia and Malawi, and is notably lower in all three countries in the LatinAmerica/Caribbean region.
Figure 2. Low HAZ (< -2) among children 6-23 months, by country
28
47 47
3540
3136
44
1620 22
0
20
40
60
BeninEthiopia
Malawi
Mali
Rwanda
Zimbabwe
Cambodia
NepalColombia
HaitiPeru
Perc
ent o
f chi
ldre
n
Figure 3 illustrates low weight-for-height (WHZ < -2). Prevalence of low WHZ is highest inEthiopia, the West Africa countries (Benin and Mali) and in both Asian countries (Cambodia andNepal), at 16-19%, and very low (1%) in Colombia and Peru.

Chapter 4: Description of Households, Mothers, and Children
32
Figure 3. Low WHZ (< -2) among children 6-23 months, by country
1618
9
18
10 9
19 18
1
8
10
10
20
30
BeninEthiopia
Malawi
Mali
Rwanda
Zimbabwe
Cambodia
NepalColombia
HaitiPeru
Perc
ent o
f chi
ldre
n
4.5. Morbidity and Feeding during Diarrhea for Children Aged 6-23 Months
Table 6 shows the proportion of children aged 6-23 months who were reported to have had fever,cough or diarrhea in the last two weeks. While there is some variation among countries inprevalence of each illness, the overall picture is one of highly prevalent illness among children inthis age range, in all countries. For example, even in Colombia and Peru, roughly 1/3 of thechildren had fevers in the last two weeks, 1/2 had coughs, and 1/4 had diarrhea. Countries withthe highest prevalence of fever (> 50%) were Benin, Malawi, and Haiti; the highest prevalenceof diarrhea occurred in Ethiopia (38%) and Haiti (43%). The burden of illness seems particularlyhigh in Haiti, where 73% of the children were also reported to have had coughs in the last twoweeks.
Table 6 also shows the proportion of mothers who report following recommended practices forfeeding during diarrhea (increased liquids and at least the same amount of food). With fewexceptions, less than half of the children who had diarrhea were fed according torecommendations.
4.6. Feeding Practices for Children Aged 6-23 Months
Finally, Table 7 presents information on feeding practices for children in the 6-23 month agegroup. For children this age, continued breastfeeding, avoidance of baby bottles, and adequatelyfrequent feeding are each important. All children in this age group should be receiving solidand/or semi-solid food regularly. Recommendations for adequate frequency of feeding vary byage; breastfed children aged 6-8 months should be fed complementary foods at least twice a day,with additional snacks as desired, while breastfed children 9-23 months should be fed at leastthree times a day, with additional snacks (PAHO/WHO, 2003).

Cha
pter
4: D
escr
iptio
n of
Hou
seho
lds,
Mot
hers
, and
Chi
ldre
n
Tab
le 6
. Pe
rcen
t of c
hild
ren
6-23
mon
ths w
ith fe
ver,
cou
gh, o
r di
arrh
ea in
last
two
wee
ks, a
nd fe
edin
g du
ring
dia
rrhe
a, b
yco
untr
y
Ben
inE
thio
pia
Mal
awi
Mal
iR
wan
daZ
imba
bwe
Cam
bodi
aN
epal
Col
ombi
aH
aiti
Peru
% w
ith fe
ver
5337
5536
4038
4643
3152
32%
with
cou
gh30
4151
3246
4740
5252
7349
% w
ith d
iarr
hea
2038
3327
2926
2932
2243
24 IF
chi
ld h
ad d
iarr
hea:
% o
ffer
ed
m
ore
liqui
ds37
3036
5619
5354
2833
3852
% o
ffer
ed th
e sa
me
amou
nt
or m
ore
food
4312
5937
5037
3835
4934
35
Tab
le 7
. Fe
edin
g pr
actic
es fo
r ch
ildre
n 6-
23 m
onth
s, by
cou
ntry
: Bre
astf
eedi
ng, b
ottle
use
, and
freq
uenc
y of
feed
ing
Ben
inE
thio
pia
Mal
awi
Mal
iR
wan
daZ
imba
bwe
Cam
bodi
aN
epal
Col
ombi
aH
aiti
Peru
% st
ill b
reas
tfed
8892
9390
9178
8196
4769
75%
giv
en a
nyth
ing
by
bott
le y
este
rday
49
45
107
193
2721
42
% b
reas
tfed
chi
ldre
nfe
d at
leas
t the
m
inim
umre
com
men
ded
num
ber
of ti
mes
3943
5025
1542
5968
6622
68
Mea
n nu
mbe
r of
tim
es c
hild
ate
ye
ster
day
2.0
2.1
2.3
1.6
1.3
2.2
2.8
2.7
2.7
1.8
2.9
% w
ith N
O so
lid
food
gro
ups i
n la
st7
days
6-8
mos
9-11
mos
12-2
3 m
os
28 16 5
59 23 5
5 2 1
57 43 16
19 3 0
5 0 1
22 12 3
35 11 1
8 1 0N
A21 2 0
33

Chapter 4: Description of Households, Mothers, and Children
34
Table 7 shows that breastfeeding is maintained through the second year of life for most childrenin these countries. Over 85% of the children were still breastfed in five of the six Africancountries, and in Nepal. Rates were lowest in Colombia (47%) and Haiti (69%).
Bottle use is rare (10% or less) in all six African countries and in Nepal, and is somewhat higherin Cambodia (19%), Haiti (21%), and Colombia (27%). Bottle use is particularly prevalent inPeru (42%). Note that even in countries with low overall prevalence, bottle use may be muchhigher in urban areas. For example in Ethiopia, where the overall rate of bottle use was 9%, inurban areas 28% of the children aged 6-23 months were fed by bottle the day before the survey.
Low frequency of feeding appears to be a problem in most countries, and particularly in Mali,Rwanda, and Haiti. In these three countries, on average children were fed less than twice the daybefore the survey.
As noted, all children 6-23 months of age should be receiving solids or semi-solids foodsregularly. Late introduction of complementary foods can be assessed indirectly by looking at theproportion of children who received none of the food groups on the questionnaire in the lastseven days. Based on this indirect assessment, late introduction of solids/semi-solids is aproblem in a number of countries, and is particularly extreme in Ethiopia and Mali, where morethan half of the 6-8 month old children received none in the last week. In the case of Mali,nearly one-half of the 9-11 month old children also received none. In Mali, even among 12-23month old children, 16% had none of the solid/semi-solid food groups in the last week.
This brief description provides a context for the food group recall results, reported in Chapter 5.

Chapter 5: Dietary Diversity and Food Group Patterns
35
5. DIETARY DIVERSITY AND FOOD GROUP PATTERNS
Because dietary diversity indicators have rarely been used in development projects, it is useful toprovide a picture of how diet patterns change as diversity increases. In this chapter, we present aseries of tables based on the 24-hour food group recall. The results are similar when the 7-dayfood group recall is used (results not shown). The tables illustrate which food groups childrenare likely to have eaten yesterday at each level of dietary diversity. For example, if a child hashad only one food group, for what proportion of children was this a grain-based staple food? Forwhat proportion was it dairy? At what diversity score did half the children receive meat, poultry,fish or eggs?
Taken together, the results show that particular diversity scores and increases in diversity meandifferent things in different countries. For example, at a diversity score of �3�, in Benin half thechildren ate meat, poultry, fish or eggs, yesterday, and most (82%) had food made with oil or fat.However at this same diversity score of �3�, in Ethiopia only 13% had meat, poultry, fish oreggs; in Malawi among those scoring �3� almost no children (4%) had food cooked in fat or oil.
The results also show that in each country, diets do appear to be more adequate as diversityincreases. For example, the new Guiding Principles for complementary feeding of breastfedchildren recommend that children have meat, poultry fish or eggs, and also vitamin A-rich plantfoods daily or as often as possible. In each country, children with high dietary diversity scoresare much more likely to have had these foods. While this is natural, as the diversity score sumsthese (and other) groups, it is useful to illustrate this in order to give more meaning to diversityscores.
Before presenting results for individual countries, we provide a comparison of diversity acrosscountries. Table 8 shows the average 24-hour food group diversity score for each country, thepercent of children scoring zero, and the percent scoring 0-2 out of a possible range of 0-7.
Table 8. Average 24-hour food group diversity for children aged 6-23 months, by country
Mean diversityscore (range 0-7) % scoring zero % scoring 0-2
Africa (2.6)Benin 2.9 15 43Ethiopia 2.2 13 61Malawi 2.7 3 45Mali 1.5 34 77Rwanda 2.9 6 41Zimbabwea 3.1 2 38
Asia (3.0)Cambodia 3.3 9 33Nepal 2.8 8 41
Latin America/Caribbean (4.3)Colombia 4.7 1 10Haiti 3.8 4 19Peru 4.5 3 12
aThe mean diversity score for Zimbabwe is on a scale of 0-6 because one food group was missing from the questionnaire.
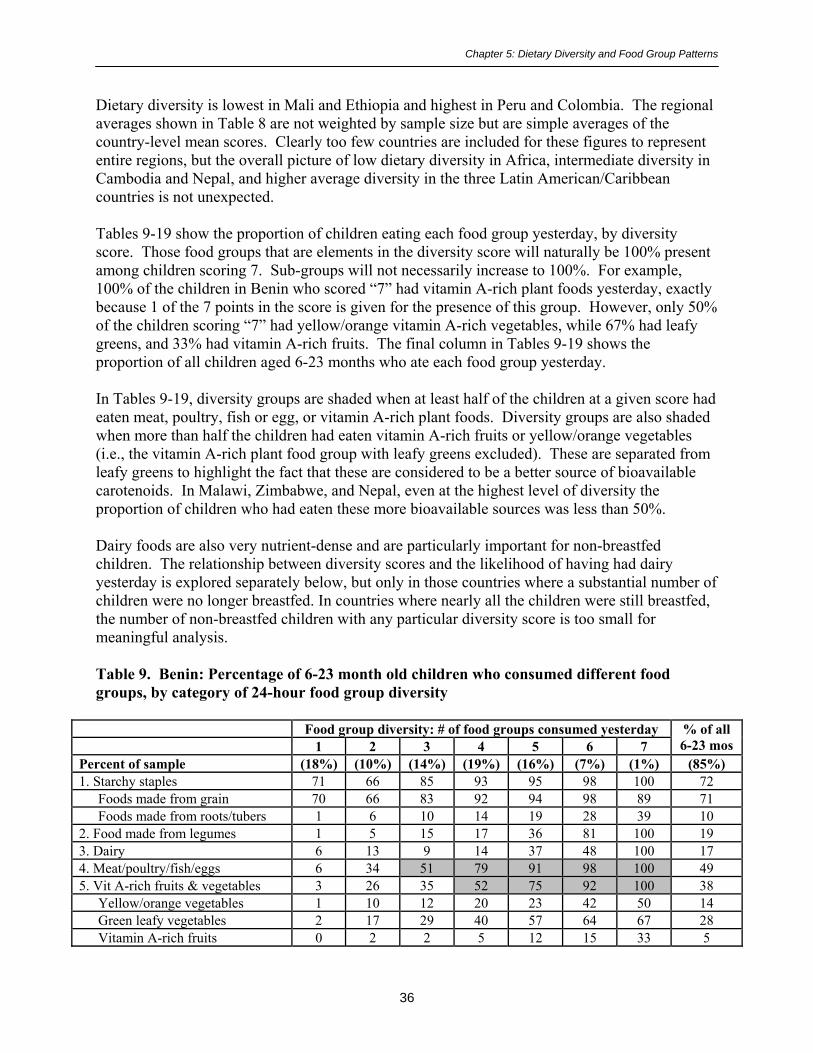
Chapter 5: Dietary Diversity and Food Group Patterns
36
Dietary diversity is lowest in Mali and Ethiopia and highest in Peru and Colombia. The regionalaverages shown in Table 8 are not weighted by sample size but are simple averages of thecountry-level mean scores. Clearly too few countries are included for these figures to represententire regions, but the overall picture of low dietary diversity in Africa, intermediate diversity inCambodia and Nepal, and higher average diversity in the three Latin American/Caribbeancountries is not unexpected.
Tables 9-19 show the proportion of children eating each food group yesterday, by diversityscore. Those food groups that are elements in the diversity score will naturally be 100% presentamong children scoring 7. Sub-groups will not necessarily increase to 100%. For example,100% of the children in Benin who scored �7� had vitamin A-rich plant foods yesterday, exactlybecause 1 of the 7 points in the score is given for the presence of this group. However, only 50%of the children scoring �7� had yellow/orange vitamin A-rich vegetables, while 67% had leafygreens, and 33% had vitamin A-rich fruits. The final column in Tables 9-19 shows theproportion of all children aged 6-23 months who ate each food group yesterday.
In Tables 9-19, diversity groups are shaded when at least half of the children at a given score hadeaten meat, poultry, fish or egg, or vitamin A-rich plant foods. Diversity groups are also shadedwhen more than half the children had eaten vitamin A-rich fruits or yellow/orange vegetables(i.e., the vitamin A-rich plant food group with leafy greens excluded). These are separated fromleafy greens to highlight the fact that these are considered to be a better source of bioavailablecarotenoids. In Malawi, Zimbabwe, and Nepal, even at the highest level of diversity theproportion of children who had eaten these more bioavailable sources was less than 50%.
Dairy foods are also very nutrient-dense and are particularly important for non-breastfedchildren. The relationship between diversity scores and the likelihood of having had dairyyesterday is explored separately below, but only in those countries where a substantial number ofchildren were no longer breastfed. In countries where nearly all the children were still breastfed,the number of non-breastfed children with any particular diversity score is too small formeaningful analysis.
Table 9. Benin: Percentage of 6-23 month old children who consumed different foodgroups, by category of 24-hour food group diversity
Food group diversity: # of food groups consumed yesterday1 2 3 4 5 6 7
% of all6-23 mos
Percent of sample (18%) (10%) (14%) (19%) (16%) (7%) (1%) (85%)1. Starchy staples 71 66 85 93 95 98 100 72
Foods made from grain 70 66 83 92 94 98 89 71Foods made from roots/tubers 1 6 10 14 19 28 39 10
2. Food made from legumes 1 5 15 17 36 81 100 193. Dairy 6 13 9 14 37 48 100 174. Meat/poultry/fish/eggs 6 34 51 79 91 98 100 495. Vit A-rich fruits & vegetables 3 26 35 52 75 92 100 38
Yellow/orange vegetables 1 10 12 20 23 42 50 14Green leafy vegetables 2 17 29 40 57 64 67 28Vitamin A-rich fruits 0 2 2 5 12 15 33 5
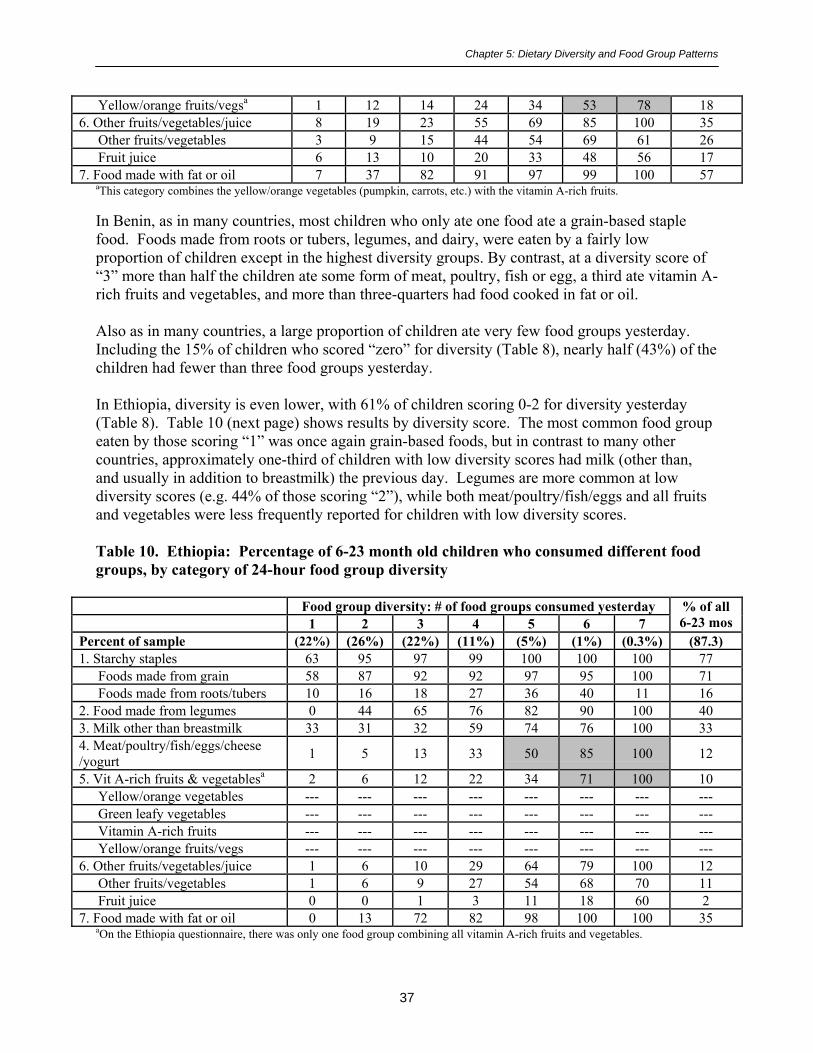
Chapter 5: Dietary Diversity and Food Group Patterns
37
Yellow/orange fruits/vegsa 1 12 14 24 34 53 78 186. Other fruits/vegetables/juice 8 19 23 55 69 85 100 35
Other fruits/vegetables 3 9 15 44 54 69 61 26Fruit juice 6 13 10 20 33 48 56 17
7. Food made with fat or oil 7 37 82 91 97 99 100 57aThis category combines the yellow/orange vegetables (pumpkin, carrots, etc.) with the vitamin A-rich fruits.
In Benin, as in many countries, most children who only ate one food ate a grain-based staplefood. Foods made from roots or tubers, legumes, and dairy, were eaten by a fairly lowproportion of children except in the highest diversity groups. By contrast, at a diversity score of�3� more than half the children ate some form of meat, poultry, fish or egg, a third ate vitamin A-rich fruits and vegetables, and more than three-quarters had food cooked in fat or oil.
Also as in many countries, a large proportion of children ate very few food groups yesterday.Including the 15% of children who scored �zero� for diversity (Table 8), nearly half (43%) of thechildren had fewer than three food groups yesterday.
In Ethiopia, diversity is even lower, with 61% of children scoring 0-2 for diversity yesterday(Table 8). Table 10 (next page) shows results by diversity score. The most common food groupeaten by those scoring �1� was once again grain-based foods, but in contrast to many othercountries, approximately one-third of children with low diversity scores had milk (other than,and usually in addition to breastmilk) the previous day. Legumes are more common at lowdiversity scores (e.g. 44% of those scoring �2�), while both meat/poultry/fish/eggs and all fruitsand vegetables were less frequently reported for children with low diversity scores.
Table 10. Ethiopia: Percentage of 6-23 month old children who consumed different foodgroups, by category of 24-hour food group diversity
Food group diversity: # of food groups consumed yesterday1 2 3 4 5 6 7
% of all6-23 mos
Percent of sample (22%) (26%) (22%) (11%) (5%) (1%) (0.3%) (87.3)1. Starchy staples 63 95 97 99 100 100 100 77
Foods made from grain 58 87 92 92 97 95 100 71Foods made from roots/tubers 10 16 18 27 36 40 11 16
2. Food made from legumes 0 44 65 76 82 90 100 403. Milk other than breastmilk 33 31 32 59 74 76 100 334. Meat/poultry/fish/eggs/cheese/yogurt 1 5 13 33 50 85 100 12
5. Vit A-rich fruits & vegetablesa 2 6 12 22 34 71 100 10Yellow/orange vegetables --- --- --- --- --- --- --- ---Green leafy vegetables --- --- --- --- --- --- --- ---Vitamin A-rich fruits --- --- --- --- --- --- --- ---Yellow/orange fruits/vegs --- --- --- --- --- --- --- ---
6. Other fruits/vegetables/juice 1 6 10 29 64 79 100 12Other fruits/vegetables 1 6 9 27 54 68 70 11Fruit juice 0 0 1 3 11 18 60 2
7. Food made with fat or oil 0 13 72 82 98 100 100 35aOn the Ethiopia questionnaire, there was only one food group combining all vitamin A-rich fruits and vegetables.

Chapter 5: Dietary Diversity and Food Group Patterns
38
Table 11. Malawi: Percentage of 6-23 month old children who consumed different foodgroups, by category of 24-hour food group diversity
Food group diversity: # of food groups consumed yesterday1 2 3 4 5 6 7
% of all6-23 mos
Percent of sample (18%) (25%) (28%) (17%) (8%) (2%) (1%) (99)1. Starchy staples 97 99 99 99 99 100 100 96
Foods made from grain 97 97 98 99 98 100 100 95Foods made from roots/tubers 11 25 36 44 44 44 26 30
2. Food made from legumes 0 13 33 54 62 77 100 283. Dairy 0 2 3 12 29 66 100 84.Meat/poultry/fish/eggs/termites 0 16 45 68 86 97 100 375. Vit A-rich fruits & vegetables 1 58 84 91 93 100 100 63
Yellow/orange vegetables 0 7 15 19 26 12 39 12Green leafy vegetables 1 50 71 76 76 87 84 53Vitamin A-rich fruits 0 9 19 23 25 36 37 14Yellow/orange fruits/vegsa 1 16 31 38 46 41 42 23
6. Other fruits/vegetables/juice 1 10 33 66 84 93 100 32Other fruits/vegetables 0 8 27 59 74 89 100 27Fruit juice 0 3 8 14 21 30 53 8
7. Food made with fat or oil 0 2 4 9 46 66 100 8aThis category combines the yellow/orange vegetables (pumpkin, carrots, etc.) with the vitamin A-rich fruits.
In Malawi, the proportion scoring 0-2 for diversity is similar to the proportion in Benin, at 45%(Table 8).13 Nearly all children with low diversity scores ate grain-based foods, with the nextfood to enter the pattern likely to be leafy greens. Very few children had dairy or any food madewith fat or oil, except among those with the highest diversity scores. Other than the leafy greens,vitamin A-rich plant foods are also unlikely to be eaten except by those children with the highestscores.
Mali had the highest proportion of children scoring �zero� for diversity the day before thesurvey. Fully 1/3 of the children had none of the food groups yesterday. Three-quarters of thechildren had very low scores (0-2). The overall low diversity is the most compelling piece ofinformation about the diet pattern of these children. As diversity increased, children were morelikely to have meat, poultry, fish, or eggs, vitamin A-rich fruits or vegetables, or foods cookedwith fat, than they were to have legumes or dairy. At scores of �3�, roughly half of the childrenhad meat, poultry, fish or eggs, roughly half had one or more vitamin A-rich plant foods, androughly half had foods cooked with fat or oil.
13 Note that the percents reported in Table 8 for 0-2 food groups (e.g., for Malawi, 45%), may differ slightly from the sum of thepercents shown in tables 9-19, because of rounding (e.g., Table 8 shows 3% eating none, and Table 18% and 25% eating 1 and 2groups, respectively. 3+18+25 sums to 46%, but when a categorical variable for 0-2 food groups is used, the rounded percent ofchildren eating 0-2 is 45%).

Chapter 5: Dietary Diversity and Food Group Patterns
39
Table 12. Mali: Percentage of 6-23 month old children who consumed different foodgroups, by category of 24-hour food group diversity
1 2 3 4 5 6 7% of all6-23 mos
Percent of sample (28%) (15%) (8%) (8%) (4%) (3%) (1%) (67)1. Starchy staples 77 83 90 86 100 96 100 55
Foods made from grain 76 80 88 82 93 83 100 53Foods made from roots/tubers 3 5 11 20 39 71 100 8
2. Food made from legumes 0 8 12 26 43 50 100 83. Dairy 6 21 29 51 58 72 100 164. Meat/poultry/fish/eggs 5 36 48 73 93 96 100 235. Vit A-rich fruits & vegetables 1 27 49 74 76 86 100 20
Yellow/orange vegetables 0 8 15 19 32 45 90 7Green leafy vegetables 0 6 10 41 28 32 80 8Vitamin A-rich fruits 1 16 38 41 49 71 90 14Yellow/orange fruits/vegsa 1 23 45 54 68 75 100 17
6. Other fruits/vegetables/juice 7 9 26 28 68 100 100 14Other fruits/vegetables 2 4 15 12 61 64 90 8Fruit juice 6 7 14 20 35 54 40 8
7. Food made with fat or oil 3 15 47 62 65 100 100 18aThis category combines the yellow/orange vegetables (pumpkin, carrots, etc.) with the vitamin A-rich fruits.
In Rwanda, the proportion of children scoring zero was low (6%), but the proportion scoring 0-2was once again comparable to Benin and Malawi, at 41%. Roots and tubers were morefrequently eaten in Rwanda as compared to the other African countries. Among children withlow diversity scores, legumes were also more commonly eaten than in many other countries (seeTable 13, next page). Children with low to moderate scores were also fairly likely to have eatenvitamin A-rich vegetables. Only children with the highest diversity scores were likely to havehad any animal source foods (the dairy group, or meat, poultry, fish or eggs).

Chapter 5: Dietary Diversity and Food Group Patterns
40
Table 13. Rwanda: Percentage of 6-23 month old children who consumed different foodgroups, by category of 24-hour food group diversity
Food group diversity: # of food groups consumed yesterday1 2 3 4 5 6 7
% of all6-23 mos
Percent of sample (13%) (21%) (26%) (19%) (10%) (4%) (1%) (94)1. Starchy staples 72 83 91 96 99 99 100 83
Foods made from grain 57 59 71 79 83 83 100 65Foods made from roots/tubers 30 62 66 73 79 75 86 59
2. Food made from legumes 3 51 75 80 86 87 100 583. Dairy 7 4 7 16 29 60 100 134. Meat/poultry/fish/eggs 1 4 8 16 30 72 100 135. Vit A-rich fruits & vegetables 13 37 69 79 89 92 100 55
Yellow/orange vegetables 9 20 39 41 45 50 46 30Green leafy vegetables 5 20 39 50 59 67 86 34Vitamin A-rich fruits 1 6 9 23 26 45 71 13Yellow/orange fruits/vegsa 10 26 45 56 59 74 82 39
6. Other fruits/vegetables/juice 3 12 23 49 81 98 100 31Other fruits/vegetables 3 10 21 45 71 87 79 27Fruit juice 1 3 4 8 19 31 54 7
7. Food made with fat or oil 1 10 28 64 87 93 100 35aThis category combines the yellow/orange vegetables (pumpkin, carrots, etc.) with the vitamin A-rich fruits.
Table 14. Zimbabwe: Percentage of 6-23 month old children who consumed different foodgroups, by category of 24-hour food group diversity
Food group diversity: # of food groups consumed yesterday1 2 3 4 5 6 7
% of all6-23 mos
Percent of sample (11%) (25%) (25%) (19%) (13%) (5%) --- (98)1. Starchy staples 91 96 97 100 100 100 --- 96
Foods made from grain 91 96 97 100 99 100 --- 95Foods made from roots/tubers 1 7 10 26 33 40 --- 16
2. Food made from legumes 0 16 40 64 83 100 --- 433. Dairy 1 7 12 24 47 100 --- 214. Meat/poultry/fish/eggs 1 11 36 66 91 100 --- 435. Vit A-rich fruits & vegetables 2 54 71 75 88 100 --- 63
Yellow/orange vegetables 0 4 3 7 19 28 --- 7Green leafy vegetables 1 52 70 71 81 98 --- 60Vitamin A-rich fruits 0 3 5 9 10 9 --- 6Yellow/orange fruits/vegsa 0 7 7 16 29 36 --- 13
6. Other fruits/vegetables/juice 5 15 44 72 90 100 --- 47Other fruits/vegetables 3 14 38 64 82 84 --- 42Fruit juice 2 7 17 31 51 74 --- 23
7. Food made with fat or oil --- --- --- --- --- --- --- ---aThis category combines the yellow/orange vegetables (pumpkin, carrots, etc.) with the vitamin A-rich fruits. Because the Zimbabwequestionnaire did not include a food group for foods cooked with fats or oil the diversity score ranges from 0-6 instead of 0-7; thismakes direct comparisons with other countries more difficult. However the general pattern seen for Zimbabwe is similar to Malawi,with the vast majority of children having had a grain-based staple yesterday, and with the next most commonly eaten food amongchildren with low scores being leafy greens. Few children ate yellow/orange vegetables or vitamin A-rich fruits. It is also worthnoting that despite the smaller range of possible scores, the average diversity score in Zimbabwe (3.1) was higher than in any of theother African countries analyzed, and was twice as high as the average score in Mali (1.5). (See Table 8).

Chapter 5: Dietary Diversity and Food Group Patterns
41
Moving on to the two Asian countries, the average diversity score in Cambodia was similar toZimbabwe, at 3.25. The proportion scoring 0-2 was lower than in any of the African countries,at 33%. Table 15 shows results by diversity score for Cambodia.
Table 15. Cambodia: Percentage of 6-23 month old children who consumed different foodgroups, by category of 24-hour food group diversity
Food group diversity: # of food groups consumed yesterday1 2 3 4 5 6 7
% of all6-23 mos
Percent of sample (10%) (14%) (19%) (23%) (15%) (10%) (1%) (92)1. Starchy staples 92 96 97 100 100 100 100 89
Foods made from grain 92 96 97 100 99 100 100 89Foods made from roots/tubers 1 7 11 19 25 58 87 18
2. Food made from legumes 0 2 5 7 27 93 100 173. Tinned/ powdered/ condensed milk 3 4 2 2 3 12 100 44. Meat/poultry/fish/eggs/organ meats, other small protein food 1 57 83 93 95 100 100 70
5. Vit A-rich fruits & vegetables 0 10 49 84 97 100 100 55Yellow/orange vegetables 0 6 15 36 50 74 87 27Green leafy vegetables 0 5 27 52 68 84 87 37Vitamin A-rich fruits 0 5 21 40 42 55 100 27Yellow/orange fruits/vegsa 0 9 33 62 69 89 100 41
6. Other fruits/vegetables/juice 4 25 44 80 93 100 100 55Other fruits/vegetables 3 21 36 66 79 94 87 47Fruit juice 2 8 12 33 47 53 73 24
7. Food made with fat or oil 0 7 22 35 81 96 100 35aThis category combines the yellow/orange vegetables (pumpkin, carrots, etc.) with the vitamin A-rich fruits.
In interpreting Table 15, note the extremely low proportion of children who were reported tohave had dairy yesterday. Unlike the Model questionnaire, on the Cambodia questionnaireincluded in the country report (National Institute of Statistics, Directorate General for Health[Cambodia], and ORC Macro, 2001) the group for milk other than breastmilk was worded as�Any other milk such as tinned, powdered, or sweetened condensed milk?� If fresh milk was notincluded in the questionnaire in the field, this could explain the extremely low proportion ofchildren reported to have had milk yesterday (except at a diversity score of 7, which bydefinition includes a point for dairy and must = 100%). Overall, only 4% of the children werereported to have had milk yesterday. This would also affect all other proportions in Table 15.Leaving this aside, it appears that even at low diversity scores children are quite likely to havehad non-dairy animal foods, and next most likely to have had fruits and vegetables.14
In Nepal, the average diversity score (2.8) was lower than in Cambodia, and was very similar toBenin and Rwanda. Table 16 shows results by diversity score for Nepal.
14 Note that the proportion having vitamin A-rich fruits may be overestimated; see Annex 1 for details.

Chapter 5: Dietary Diversity and Food Group Patterns
42
Table 16. Nepal: Percentage of 6-23 month old children who consumed different foodgroups, by category of 24-hour food group diversity
Food group diversity: # of food groups consumed yesterday1 2 3 4 5 6 7
% of all6-23 mos
Percent of sample (11%) (22%) (26%) (19%) (10%) (3%) (1%) (92)1. Starchy staples 78 99 100 100 100 100 100 89
Foods made from grain 77 99 100 100 100 98 100 89Foods made from roots/tubers 34 53 58 70 72 80 87 54
2. Food made from legumes 1 23 49 65 77 93 100 423. Dairy 19 29 39 58 73 88 100 404. Meat/poultry/fish/eggs 0 6 12 24 42 58 100 165. Vit A-rich fruits & vegetables 1 15 29 48 69 88 100 30
Yellow/orange vegetables --- --- --- --- --- --- --- ---Green leafy vegetables 1 13 26 41 53 62 93 25Vitamin A-rich fruits --- --- --- --- --- --- --- ---Yellow/orange fruits/vegsa 0 3 4 11 18 34 25 7
6. Other fruits/vegetables/juice --- --- --- --- --- --- --- ---Other fruits/vegetables 1 4 12 29 56 82 100 19Fruit juice --- --- --- --- --- --- --- ---
7. Food made with fat or oil 0 26 59 77 83 90 100 47aThis category combines the yellow/orange vegetables (pumpkin, carrots, etc.) with the vitamin A-rich fruits.
Unlike in any of the countries described to this point, in Nepal many people are vegetarian andthis obviously affects diet patterns for children. Overall 16% of the children aged 6-23 monthshad eaten meat, poultry, fish or eggs the previous day. Among children with lower diversityscores, the most common foods were foods made from grain (presumably rice), roots or tubers(likely potatoes), legumes, dairy, and foods cooked with fat or oil. Fruits and vegetables wereless commonly reported, and yellow/orange fruits and vegetables were particularly rare.
As noted previously, average dietary diversity in Colombia � at 4.7 food groups yesterday � washigher than in any other country included in our analysis. In Colombia, only 10% of the childrenin the survey had scores of 0-2 for food group diversity yesterday. Table 17 shows results bydiversity score for Colombia.
Other than the overall high diversity, other diet patterns to note in Colombia include the highproportion of children who scored �1� who had dairy the day before. This is related to the factthat a higher proportion of children are no longer breastfed in Colombia than in any of the othercountries (only 47% of the children aged 6-23 months were still breastfed).15 Meat, poultry, fishand eggs, and also fruit juice, were commonly reported even among children with low diversityscores. Among children scoring �3� 59% had meat, poultry, fish or eggs, and among childrenscoring as low as �2�, 31% had fruit juice the previous day.
15 Also see Annex 1 for an explanation of some issues with this food group on the Colombia questionnaire. The vitamin A-richfruit group also included a number of foods which are not extremely rich sources of carotenoids; this is also detailed in Annex 1.

Chapter 5: Dietary Diversity and Food Group Patterns
43
Table 17. Colombia: Percentage of 6-23 month old children who consumed different foodgroups, by category of 24-hour food group diversity
Food group diversity: # of food groups consumed yesterday1 2 3 4 5 6 7
% of all6-23 mos
Percent of sample (3%) (6%) (10%) (17%) (29%) (26%) (9%) (100)1. Starchy staples 33 74 86 91 98 100 100 92
Foods made from grain 29 61 72 79 89 94 99 83Foods made from roots/tubers 26 44 66 72 83 83 85 75
2. Food made from legumes 0 6 12 18 25 49 100 333. Dairy 46 45 63 70 91 96 100 824. Meat/poultry/fish/eggs 8 24 59 79 90 96 100 805. Vit A-rich fruits & vegetables 0 6 26 50 79 89 100 66
Yellow/orange vegetables 0 6 15 38 62 68 82 51Green leafy vegetables --- --- --- --- --- --- --- ---Vitamin A-rich fruits 0 0 14 28 45 58 60 39Yellow/orange fruits/vegsa 0 6 26 50 79 89 100 66
6. Other fruits/vegetables/juice 13 42 42 59 82 95 100 74Other fruits/vegetables 3 15 21 30 53 69 78 48Fruit juice 8 31 31 44 67 73 83 58
7. Food made with fat or oil 0 6 14 32 35 76 100 46aThis category combines the yellow/orange vegetables (pumpkin, carrots, etc.) with the vitamin A-rich fruits.
The average diversity score in Haiti was lower than in Colombia, at 3.8, but higher than in any ofthe countries in Africa or Asia. Nineteen percent of the children in Haiti had scores of 0-2.Table 18 shows results by diversity score for Haiti.
Table 18. Haiti: Percentage of 6-23 month old children who consumed different foodgroups, by category of 24-hour food group diversity
Food group diversity: # of food groups consumed yesterday1 2 3 4 5 6 7
% of all6-23 mos
Percent of sample (4%) (11%) (22%) (26%) (20%) (11%) (3%) (97)1. Starchy staples 15 71 92 96 94 99 100 85
Foods made from grain 9 61 88 92 84 97 98 80Foods made from roots/tubers 6 20 21 33 36 32 51 28
2. Food made from legumes 0 2 7 25 32 80 100 263. Dairy 4 19 8 17 41 57 100 264. Meat/poultry/fish/eggs 3 3 11 28 67 83 100 355. Vit A-rich fruits & vegetables 4 13 31 52 80 84 100 50
Yellow/orange vegetables 3 4 11 15 34 42 70 20Green leafy vegetables 0 7 9 20 43 45 82 24Vitamin A-rich fruits 3 4 17 35 40 43 66 28Yellow/orange fruits/vegsa 4 7 25 46 62 67 86 41
6. Other fruits/vegetables/juice 57 31 59 84 87 98 100 71Other fruits/vegetables 17 8 27 38 53 65 53 36Fruit juice 47 27 47 64 68 71 98 56
7. Food made with fat or oil 16 62 94 98 99 99 100 86aThis category combines the yellow/orange vegetables (pumpkin, carrots, etc.) with the vitamin A-rich fruits.

Chapter 5: Dietary Diversity and Food Group Patterns
44
Among children in Haiti with low diversity scores, starchy staples and foods cooked with fat oroil were most commonly eaten. Even at low diversity scores, many children had juice. Childrenwith low diversity scores were unlikely to have eaten legumes, meat, poultry, fish or eggs, oryellow/orange vegetables.
Finally, Table 19 shows results for Peru. The average diversity score for Peru, at 4.49, wasalmost as high as in Colombia. In interpreting differences between Colombia and Peru (forexample, the proportion of children having had dairy) note that in Peru three-quarters of thechildren were still breastfed (as compared to roughly half in Colombia).
Table 19. Peru: Percentage of 6-23 month old children who consumed different foodgroups, by category of 24-hour food group diversity
Food group diversity: # of food groups consumed yesterday1 2 3 4 5 6 7
% of all6-23 mos
Percent of sample (3%) (6%) (13%) (19%) (26%) (23%) (8%) (98)1. Starchy staples 59 89 96 99 100 100 100 94
Foods made from grain 48 77 86 92 94 97 99 89Foods made from roots/tubers 39 72 80 88 89 92 93 84
2. Food made from legumes 2 11 19 25 31 44 100 343. Dairy 21 13 21 43 66 89 100 574. Meat/poultry/fish/eggs 7 23 41 61 85 96 100 705. Vit A-rich fruits & vegetables 5 25 58 76 92 98 100 77
Yellow/orange vegetables 4 14 41 59 73 81 81 61Green leafy vegetables 1 10 22 38 58 67 79 47Vitamin A-rich fruits 1 10 23 29 46 54 61 38Yellow/orange fruits/vegsa 5 23 53 71 87 94 95 73
6. Other fruits/vegetables/juice 1 9 17 32 52 86 100 50Other fruits/vegetables 0 7 12 27 43 71 84 41Fruit juice 1 3 6 13 22 36 54 21
7. Food made with fat or oil 5 30 49 66 75 86 100 67aThis category combines the yellow/orange vegetables (pumpkin, carrots, etc.) with the vitamin A-rich fruits.
In Peru as in Colombia the overall picture is one of very high diversity. Only 12% of thechildren scored from 0-2. Children with low diversity scores were likely to have eaten grain-based foods and potatoes, and food made with fat or oil. At scores as low as �3� children werelikely to have had at least one vitamin A-rich fruit or vegetable.
Note, however, that on the Peru questionnaire a number of atypical items were listed among thevitamin A-rich fruits and vegetables. Tomatoes were included with pumpkin, carrots, etc. Whiletomatoes provide some carotenoids, they are generally not considered rich enough sources to beincluded on lists of vitamin A-rich plant foods. Celery and leeks were included in the �greens�group, and plantains were included with the vitamin A-rich fruits. Plantains are not generallyvery rich in carotenoids, but it is possible that some local varieties are. In sum, the proportion ofchildren eating vitamin A-rich fruits and vegetables may be overestimated.

Chapter 5: Dietary Diversity and Food Group Patterns
45
Breastfeeding, dairy, and diversity
Milk and other dairy foods are particularly important for children who are no longer breastfed.For these children, dairy foods can be a very important source of calcium and other nutrients.Table 20 shows the proportion of children who had dairy yesterday at each level of the diversityscore. Breastfed children are compared to children who are no longer breastfed.
Countries were excluded (Benin, Mali, and Nepal) if there were fewer than 150 non-breastfedchildren, because the number of non-breastfed children at any one level of the diversity scorebecomes very small. Cambodia also was excluded because of uncertainties about the wording ofthe milk question, and the unusually small number of children reported to have had milk.
Diversity scores are shaded where at least 50% of the non-breastfed children had dairy.
Table 20. Percentage of 6-23 month old children who consumed dairy, by category of 24-hour food group diversity
Food group diversity: # of food groups consumed yesterday1 2 3 4 5 6 7
% of all6-23 mos
AfricaEthiopia
Not breastfedBreastfed
834
4030
5629
7756
9667
10069
100100
5631
MalawiNot breastfedBreastfed
00
62
43
1712
4827
4470
100100
167
RwandaNot breastfedBreastfed
07
04
166
2515
4425
7556
100100
2911
ZimbabweNot breastfedBreastfed
01
77
1411
2722
6240
100100
------
3617
Latin America/CaribbeanColombia
Not breastfedBreastfed
4746
5243
7059
7466
9684
9893
100100
8974
HaitiNot breastfedBreastfed
05
722
68
1916
4538
5956
100100
3522
PeruNot breastfedBreastfed
022
1313
2720
5440
8558
9686
100100
7851
Table 20 shows that in most countries, children with low diversity scores are unlikely to havehad milk or dairy. In Ethiopia and Colombia, children are more likely to have had dairy.Because of differing diet patterns (reflecting access to milk and dairy) there is no consistencyacross countries in the score at which at least half of the children had milk.

Chapter 5: Dietary Diversity and Food Group Patterns
46
Tables 9-20 provide a picture of the relationship between each diversity score and the likelihoodthat children will have eaten particular food groups, including those rich in micronutrients.These tables also illustrate the difficulties with summarizing information on food group diversitywhen each diversity score is looked at separately. In the next chapter, we explore the possibilityof creating categories for diversity.

Chapter 6: Categories for Dietary Diversity
47
6. CATEGORIES FOR DIETARY DIVERSITY
When assessing the diets of young children in developing countries, there is consensus that morediverse diets are generally better. However, there is no international recommendationconcerning an adequate or optimal level of food group diversity for young children, and thusthere are no agreed upon cut-offs for low or high diversity.
The most meaningful categories for dietary diversity would reflect defined relationships tonutrient adequacy. Several studies described in Chapter 1 look at diversity categories in thisway. Future validation work may show whether it is possible to consistently relate diversityindicators and cut-offs to nutrient adequacy across contexts, or whether cut-offs must always becontext-specific and based on detailed local work.
Meanwhile, if diversity indicators are to be useful to project managers some other approach tothinking about diversity categories may be needed. For many purposes, managers may preferindicators with cut-offs, which can be expressed as percents, to indicators such as �the averagediversity score�. In this chapter we describe two approaches. First, as we have done previously(Arimond and Ruel, 2002), we create sample-specific terciles for dietary diversity, and thencompare these among countries. Secondly, we describe an approach for defining diversitygroups based on recommendations in the recently published Guiding Principles forcomplementary feeding (PAHO/WHO, 2003).
6.1. Sample-specific Diversity Terciles
The 7-point diversity score described previously was used to create terciles. Two different typesof categorical variables (both terciles) were created. First, as in our previous analysis, we lookedat the distribution of diversity scores within small age groups (6-8, 9-11, 12-17, and 18-23months) and created terciles within each age group. That is, each child was ranked as havinglow, middle or high diversity, but the diversity cut-off for these groups vary by age, reflectingthe distribution of diversity within age groups in the samples. These ranking variables were thencombined into one and used in further analysis in the next chapter focusing on the relationshipbetween dietary diversity and height-for-age.
A second categorical variable for diversity was constructed more simply, using the distributionof diversity across the entire age range (6-23 months). In the context of programs and projects,sample sizes within small age groups preclude construction of the more complex variabledescribed above, with age-specific terciles. For monitoring and evaluation purposes, it does notmatter that younger children are likely to have lower diversity scores, so long as any monitoringor evaluation involves groups with similar age distribution (e.g., at baseline and end of project).16
16 For analytic purposes, it does matter that younger children score lower and therefore the more complicated, age-specificterciles are needed in the bivariate and multivariate analyses reported in Chapter 7.

Chapter 6: Categories for Dietary Diversity
48
Table 21 shows the resulting categories for low, middle, and high diversity for this second,simpler indicator, by country.17 This gives a visual overview of the variation in cut-offs bycountry. Tables 22-25 follow, with the age-specific cut-offs.
Table 21. Dietary diversity terciles for ten countries, children aged 6-23 months
Food group diversity: # of food groups consumed yesterday0 1 2 3 4 5 6 7
AfricaBeninEthiopiaMalawiMaliRwanda
AsiaCambodiaNepal
Latin America/CaribbeanColombiaHaitiPeru
Table 21 illustrates large differences in cut-offs, reflecting large differences between countries inthe distribution of diversity scores. In the country with the lowest diversity, Mali, the lowesttercile includes only those children who had none of the food groups, the middle tercile includesonly those who had just one food group, and the �high� diversity group ranges from 2-7 foodgroups yesterday. In Ethiopia, the groups are 0-1 (low), 2 (middle), and 3-7 (�high� diversity).At the other extreme, in Colombia the low diversity tercile includes children who had from 0-4food groups yesterday, the middle group had 5, and the high diversity tercile includes onlychildren with 6 or 7 food groups yesterday. Even within the Africa region, there are a variety ofcut-offs, with the high diversity group in Benin including children who had 5-7 groups yesterday.
Tables 22-25 document the cut-offs for the diversity when terciles are determined within eachsmall age group. Since diversity changes with age, we examined these cut-offs to see if cut-points defining low, middle and high groups might be more consistent across countries butwithin small age groups, as compared to the cut-offs defined across the 6-23 month age groupand illustrated in Table 21. Tables 22-25 show that the lack of consistency in tercile cut-offsremains, even within narrow age groups. For example, even among the youngest children aged6-8 months � who would be expected to have the least diverse diets � the cut-off for low
17 Zimbabwe is excluded from this analysis because one food group was not on the questionnaire, and the range for the diversityscore in Zimbabwe is therefore smaller.
= Low diversity
= Middle diversity
= High diversity

Chapter 6: Categories for Dietary Diversity
49
diversity ranges from < 1 in Benin, Ethiopia, and Mali, to < 3 in Colombia and Peru. Among theolder children the range is wider.
Table 22. Dietary diversity terciles for ten countries, children aged 6-8 months
Food group diversity: # of food groups consumed yesterday0 1 2 3 4 5 6 7
AfricaBeninEthiopiaMalawiMaliRwanda
AsiaCambodiaNepal
Latin America/CaribbeanColombiaHaitiPeru
Table 23. Dietary diversity terciles for ten countries, children aged 9-11 months
Food group diversity: # of food groups consumed yesterday0 1 2 3 4 5 6 7
AfricaBeninEthiopiaMalawiMaliRwanda
AsiaCambodiaNepal
Latin America/CaribbeanColombiaHaitiPeru
= Low diversity
= Middle diversity
= High diversity
= Low diversity
= Middle diversity
= High diversity
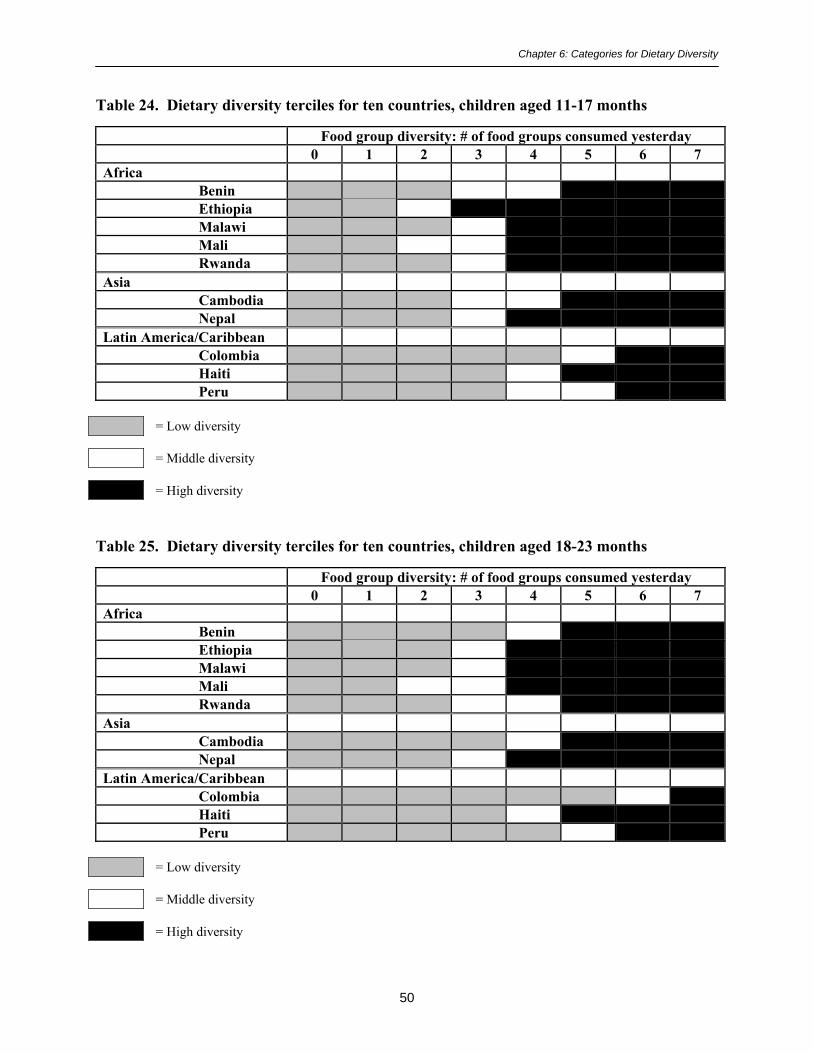
Chapter 6: Categories for Dietary Diversity
50
Table 24. Dietary diversity terciles for ten countries, children aged 11-17 months
Food group diversity: # of food groups consumed yesterday0 1 2 3 4 5 6 7
AfricaBeninEthiopiaMalawiMaliRwanda
AsiaCambodiaNepal
Latin America/CaribbeanColombiaHaitiPeru
Table 25. Dietary diversity terciles for ten countries, children aged 18-23 months
Food group diversity: # of food groups consumed yesterday0 1 2 3 4 5 6 7
AfricaBeninEthiopiaMalawiMaliRwanda
AsiaCambodiaNepal
Latin America/CaribbeanColombiaHaitiPeru
= Low diversity
= Middle diversity
= High diversity
= Low diversity
= Middle diversity
= High diversity
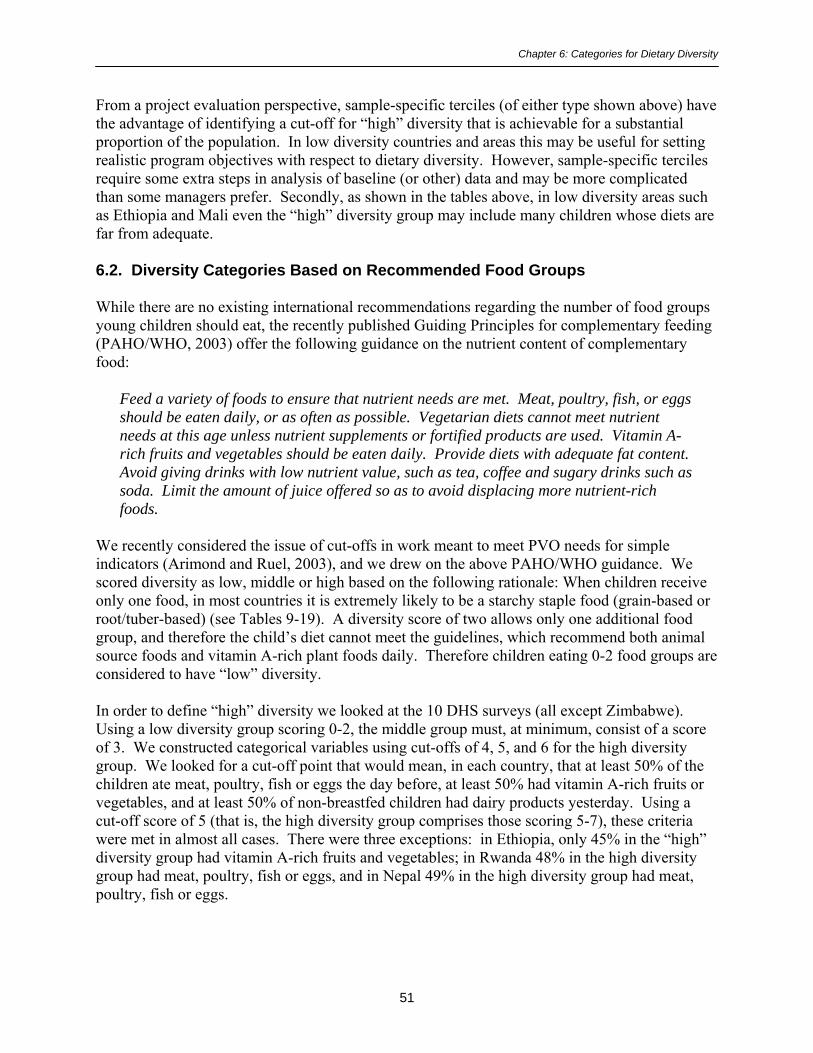
Chapter 6: Categories for Dietary Diversity
51
From a project evaluation perspective, sample-specific terciles (of either type shown above) havethe advantage of identifying a cut-off for �high� diversity that is achievable for a substantialproportion of the population. In low diversity countries and areas this may be useful for settingrealistic program objectives with respect to dietary diversity. However, sample-specific tercilesrequire some extra steps in analysis of baseline (or other) data and may be more complicatedthan some managers prefer. Secondly, as shown in the tables above, in low diversity areas suchas Ethiopia and Mali even the �high� diversity group may include many children whose diets arefar from adequate.
6.2. Diversity Categories Based on Recommended Food Groups
While there are no existing international recommendations regarding the number of food groupsyoung children should eat, the recently published Guiding Principles for complementary feeding(PAHO/WHO, 2003) offer the following guidance on the nutrient content of complementaryfood:
Feed a variety of foods to ensure that nutrient needs are met. Meat, poultry, fish, or eggsshould be eaten daily, or as often as possible. Vegetarian diets cannot meet nutrientneeds at this age unless nutrient supplements or fortified products are used. Vitamin A-rich fruits and vegetables should be eaten daily. Provide diets with adequate fat content.Avoid giving drinks with low nutrient value, such as tea, coffee and sugary drinks such assoda. Limit the amount of juice offered so as to avoid displacing more nutrient-richfoods.
We recently considered the issue of cut-offs in work meant to meet PVO needs for simpleindicators (Arimond and Ruel, 2003), and we drew on the above PAHO/WHO guidance. Wescored diversity as low, middle or high based on the following rationale: When children receiveonly one food, in most countries it is extremely likely to be a starchy staple food (grain-based orroot/tuber-based) (see Tables 9-19). A diversity score of two allows only one additional foodgroup, and therefore the child�s diet cannot meet the guidelines, which recommend both animalsource foods and vitamin A-rich plant foods daily. Therefore children eating 0-2 food groups areconsidered to have �low� diversity.
In order to define �high� diversity we looked at the 10 DHS surveys (all except Zimbabwe).Using a low diversity group scoring 0-2, the middle group must, at minimum, consist of a scoreof 3. We constructed categorical variables using cut-offs of 4, 5, and 6 for the high diversitygroup. We looked for a cut-off point that would mean, in each country, that at least 50% of thechildren ate meat, poultry, fish or eggs the day before, at least 50% had vitamin A-rich fruits orvegetables, and at least 50% of non-breastfed children had dairy products yesterday. Using acut-off score of 5 (that is, the high diversity group comprises those scoring 5-7), these criteriawere met in almost all cases. There were three exceptions: in Ethiopia, only 45% in the �high�diversity group had vitamin A-rich fruits and vegetables; in Rwanda 48% in the high diversitygroup had meat, poultry, fish or eggs, and in Nepal 49% in the high diversity group had meat,poultry, fish or eggs.

Chapter 6: Categories for Dietary Diversity
52
The use of a 50% criterion is arbitrary, and represents a compromise. If the criterion was that allchildren must have both meat, poultry, fish, or eggs and also vitamin A-rich fruits andvegetables, the cut-off for high diversity would have to be set at �7�; this seems unrealisticallyhigh. Looking at Table 21, groups of 0-2 (low), 3-4 (middle), and 5-7 (high diversity) dorepresent a compromise between the extremes. Arguments could be made for setting the cut-offfor �high� at 4, particularly in Africa, or alternatively for setting the bar higher, and seeking cut-offs where a higher proportion of children (two-thirds or three-fourths) had the high-qualitynutrient dense food groups recommended in the Guiding Principles.
Ultimately, a satisfactory answer to the question of cut-offs will require more work validatingvarious types of diversity indicators, with a variety of cut-offs, against nutrient adequacy. In themeantime, Table 26 shows the proportion of children in each country who would be classifiedinto the three diversity groups described above, and Tables 27 and 28 provide examples of howthe diversity groups can be used to summarize the types of information found in tables 9-20.
Table 26. Percent of children 6-23 months in 10 countries with low, middle, and highscores for dietary diversity, using fixed cut-offs
Low diversity(0-2 food groups)
Middle(3-4 foodgroups)
High diversity(5-7 foodgroups)
AfricaBenin 43 33 24Ethiopia 61 33 7Malawi 45 45 10Mali 77 16 7Rwanda 41 44 15
AsiaCambodia 33 42 26Nepal 41 45 14
Latin America/CaribbeanColombia 10 27 63Haiti 19 47 34Peru 12 31 57
Table 26 again reflects differences between countries in dietary diversity; diversity is lowest inMali and Ethiopia, with only 7% of children classified as having had high diversity yesterday,and well over half the children in the lowest diversity group. Diversity is highest in Colombiaand Peru, where only 10-12% of children were classified as having had low diversity, and overhalf were classified as having had high dietary diversity.
Tables 27 and 28 show results for Benin and Ethiopia using the three fixed categories for low,middle, and high diversity. Contrasts between the diet patterns at different levels of diversity areeasier to see and interpret than in the earlier presentation (Tables 9 and 10).18
18 In addition, when surveys are done in the context of projects, sample sizes are much smaller than DHS samplesizes. With small sample sizes, the number of children represented by each cell in Tables 9-20 becomes very small,

Chapter 6: Categories for Dietary Diversity
53
Table 27. Benin: Percentage of 6-23 month old children who consumed different foodgroups by dietary diversity category (fixed cut-offs for low, middle, and high diversity)
Dietary diversity: # of food groupsconsumed yesterday
Low0-2
Middle3-4
High5-7
% of all6-23 mos
Percent of sample (43%) (33%) (24%) (100)Starchy staples 45 90 96 94Food made from legumes 2 16 53 34Dairy 5 12 44 57Meat/poultry/fish/eggs 11 67 94 70Vit A-rich fruits & vegetables 7 45 81 77
Green leafy vegetables 5 35 60 47Yellow/orange fruits/vegsa 3 20 42 73
Other fruits/vegetables/juice 8 41 75 50Other fruits/vegetables 4 31 60 41Fruit juice 5 16 39 21
Food made with fat or oil 12 87 97 67aThis category combines the yellow/orange vegetables (pumpkin, carrots, etc.) with the vitamin A-rich fruits.
Table 28. Ethiopia: Percentage of 6-23 month old children who consumed different foodgroups by dietary diversity category (fixed cut-offs for low, middle, and high diversity)
Dietary diversity: # of food groupsconsumed yesterday
Low0-2
Middle3-4
High5-7
% of all6-23 mos
Percent of sample (61%) (33%) (7%) (100)Starchy staples 63 98 100 77Food made from legumes 19 69 84 40Milk other than breastmilk 25 41 74 33Meat/poultry/fish/eggs 2 19 59 12Vit A-rich fruits & vegetables 3 15 45 10Other fruits/vegetables/juice 3 16 68 12
Other fruits/vegetables 3 15 58 11Fruit juice 0 2 15 2
Food made with fat or oil 6 75 99 35
In the next chapter, we explore the relationship between dietary diversity and height-for-age Z-scores.
and can be hard to interpret.
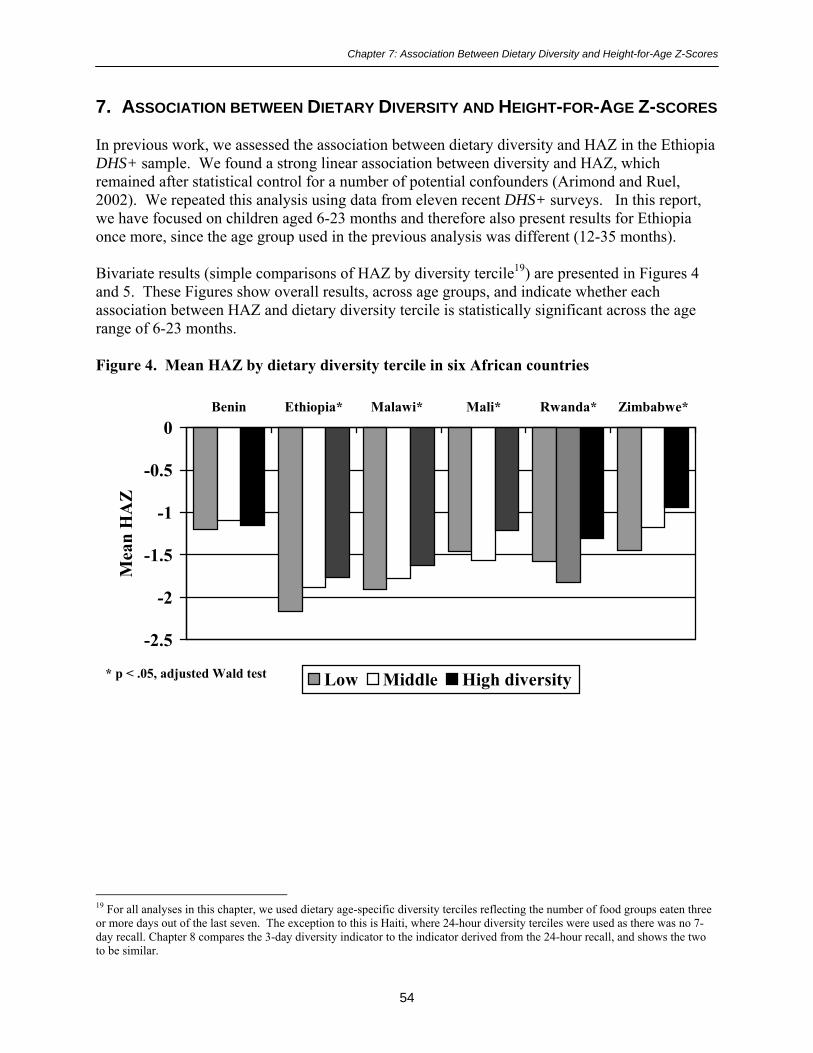
Chapter 7: Association Between Dietary Diversity and Height-for-Age Z-Scores
54
7. ASSOCIATION BETWEEN DIETARY DIVERSITY AND HEIGHT-FOR-AGE Z-SCORES
In previous work, we assessed the association between dietary diversity and HAZ in the EthiopiaDHS+ sample. We found a strong linear association between diversity and HAZ, whichremained after statistical control for a number of potential confounders (Arimond and Ruel,2002). We repeated this analysis using data from eleven recent DHS+ surveys. In this report,we have focused on children aged 6-23 months and therefore also present results for Ethiopiaonce more, since the age group used in the previous analysis was different (12-35 months).
Bivariate results (simple comparisons of HAZ by diversity tercile19) are presented in Figures 4and 5. These Figures show overall results, across age groups, and indicate whether eachassociation between HAZ and dietary diversity tercile is statistically significant across the agerange of 6-23 months.
Figure 4. Mean HAZ by dietary diversity tercile in six African countries
19 For all analyses in this chapter, we used dietary age-specific diversity terciles reflecting the number of food groups eaten threeor more days out of the last seven. The exception to this is Haiti, where 24-hour diversity terciles were used as there was no 7-day recall. Chapter 8 compares the 3-day diversity indicator to the indicator derived from the 24-hour recall, and shows the twoto be similar.
-2.5
-2
-1.5
-1
-0.5
0Benin Ethiopia* Malawi* Mali* Rwanda* Zimbabwe*
Mea
n H
AZ
Low Middle High diversity* p < .05, adjusted Wald test

Chapter 7: Association Between Dietary Diversity and Height-for-Age Z-Scores
55
Figure 5. Mean HAZ by dietary diversity tercile (6-23 months): Five countries in Asia andthe LAC region
In nine of eleven countries, Figures 4 and 5 show significant bivariate associations between HAZand dietary diversity terciles. Differences between extreme terciles in these nine countries rangefrom 0.25 in Mali to 0.51 in Zimbabwe. The differences are generally in the expected direction,but in some cases are not consistent in direction. In Mali and Rwanda children in the middlediversity tercile have the lowest mean HAZ. Figures 6-16 show associations within six-monthage groups. When results are shown within age groups, children in Mali and Rwanda no longerlook �worse off� in the middle diversity tercile.
In Figures 6-16, results are presented within age group. Figure 6 shows HAZ by diversity tercilefor Benin, for ages 6-11 months, 12-17 months, and 18-23 months. Figures 7-16 follow, andshow HAZ by diversity tercile within these age groups for the remaining ten countries. Figures6-16 show generally consistent patterns in the association between dietary diversity and meanHAZ. In five of the nine countries with significant associations � Ethiopia, Mali, Cambodia,Nepal, and Colombia � the difference between the lowest and the highest tercile of dietarydiversity is largest among the oldest children (18-23 months). Differences in this age grouprange from 0.52 Z-score units in Colombia to 0.91 Z-score units in Cambodia.20 In three othercountries, all in Eastern or Southern Africa, the difference is largest for the youngest children(Malawi, Rwanda, and Zimbabwe). In Rwanda and Zimbabwe, the difference among the oldestage group is also large (0.53 and 0.49 Z-score units, respectively). In Peru differences are largefor both the middle and the oldest age group (0.77 and 0.59 Z-scores units for the two agegroups). 20Differences in HAZ scores of this size have been associated with both short-term and long-term functional outcomes, especiallycognitive development, fulfillment of intellectual potential, work capacity and reproductive performance, and are thereforeconsidered biologically meaningful, or of functional significance (Martorell and Scrimshaw, 1995).
-2.5
-2
-1.5
-1
-0.5
0Cambodia* Nepal* Colombia* Haiti Peru*
Mea
n H
AZ
Low Middle High diversity* p < .05, adjusted Wald test

Chapter 7: Association Between Dietary Diversity and Height-for-Age Z-Scores
56
Figure 6. Benin: HAZ by dietary diversity tercile, within age groups
Figure 7. Ethiopia: HAZ by diet diversity tercile, within age groups
-0.55
-1.46-1.79
-0.58
-1.37
-1.78
-0.33
-1.3-1.62
-2.5
-2
-1.5
-1
-0.5
06-11 mos 12-17 mos 18-23 mos
Mea
n H
AZ
Low Middle High diversity
-1.53
-2.44 -2.59
-1.3
-2.08-2.44
-1.32
-1.92 -1.98
-3
-2.5
-2
-1.5
-1
-0.5
06-11 mos 12-17 mos 18-23 mos
Mea
n H
AZ
Low Middle High diversity

Chapter 7: Association Between Dietary Diversity and Height-for-Age Z-Scores
57
Figure 8. Malawi: HAZ by dietary diversity tercile, within age groups
Figure 9. Mali: HAZ by diet diversity tercile, within age groups
-1.26
-2.05
-2.49
-1.15
-1.84
-2.41
-0.98
-1.95-2.27
-3
-2.5
-2
-1.5
-1
-0.5
06-11 mos 12-17 mos 18-23 mos
Mea
n H
AZ
Low Middle High diversity
-0.86
-1.73
-2.45
-0.73
-1.72
-2.28
-0.76
-1.3
-1.89
-3
-2.5
-2
-1.5
-1
-0.5
06-11 mos 12-17 mos 18-23 mos
Mea
n H
AZ
Low Middle High diversity

Chapter 7: Association Between Dietary Diversity and Height-for-Age Z-Scores
58
Figure 10. Rwanda: HAZ by dietary diversity tercile, within age groups
Figure 11. Zimbabwe: HAZ by diet diversity tercile, within age groups
-1.23
-1.86
-2.32
-1.25
-1.83
-2.34
-0.64
-1.7 -1.81
-3
-2.5
-2
-1.5
-1
-0.5
06-11 mos 12-17 mos 18-23 mos
Mea
n H
AZ
Low Middle High diversity
-1.03
-1.73 -1.65
-0.52
-1.12
-1.54
-0.36
-1.26 -1.16
-3
-2.5
-2
-1.5
-1
-0.5
06-11 mos 12-17 mos 18-23 mos
Mea
n H
AZ
Low Middle High diversity

Chapter 7: Association Between Dietary Diversity and Height-for-Age Z-Scores
59
Figure 12. Cambodia: HAZ by dietary diversity tercile, within age groups
Figure 13. Nepal: HAZ by diet diversity tercile, within age groups
-1.05
-1.59
-2.31
-1.32-1.55
-1.86
-0.97-1.28 -1.4
-3
-2.5
-2
-1.5
-1
-0.5
06-11 mos 12-17 mos 18-23 mos
Mea
n H
AZ
Low Middle High diversity
-1.51
-2.17-2.53
-1.41
-2.1-2.26
-1.1
-1.68-1.97
-3
-2.5
-2
-1.5
-1
-0.5
06-11 mos 12-17 mos 18-23 mos
Mea
n H
AZ
Low Middle High diversity

Chapter 7: Association Between Dietary Diversity and Height-for-Age Z-Scores
60
Figure 14. Colombia: HAZ by dietary diversity tercile, within age groups
Figure 15. Haiti: HAZ by diet diversity tercile, within age groups
-0.76
-1.27 -1.34
-0.59
-1.07 -1.09
-0.49-0.72 -0.82
-3
-2.5
-2
-1.5
-1
-0.5
06-11 mos 12-17 mos 18-23 mos
Mea
n H
AZ
Low Middle High diversity
-0.7-1.07
-1.59
-0.43
-1.23 -1.13
-0.27
-1.15 -1.24
-3
-2.5
-2
-1.5
-1
-0.5
06-11 mos 12-17 mos 18-23 mos
Mea
n H
AZ
Low Middle High diversity

Chapter 7: Association Between Dietary Diversity and Height-for-Age Z-Scores
61
Figure 16. Peru: HAZ by dietary diversity tercile, within age groups
In order to assess whether the observed bivariate relationships could be explained by some otherfactor known to effect HAZ, we entered the following variables into regression models:
! Biological variables:− Child age (and age squared)− Sex of child− Maternal height
! Variables reflecting household welfare/socioeconomic status:− Maternal BMI− Maternal education− Education of mother�s partner21
− Number of antenatal care visits (related to welfare/socioeconomic status, but alsoserves as a proxy for access to health care)
− Whether the household is in an urban or rural area− Asset index tercile
! Other variables:− Whether the child was still breastfed (related to socioeconomic status, but also
influences nutrient requirements from complementary food; included in order toassess interactions with dietary diversity)
− Number of children in household under five years (related both to mother�s parity andto socioeconomic status)
− Dietary diversity tercile (3 or more days22) 21 The data sets have information on the mother�s partner, not on the child�s father.
-0.95
-1.59 -1.73
-0.66
-1.23-1.55
-0.69 -0.82-1.14
-3
-2.5
-2
-1.5
-1
-0.5
06-11 mos 12-17 mos 18-23 mos
Mea
n H
AZ
Low Middle High diversity

Chapter 7: Association Between Dietary Diversity and Height-for-Age Z-Scores
62
In addition to assessing the significance of each of these factors in the model, we explored fiveinteractions with dietary diversity. That is, we explored whether the association between dietarydiversity and HAZ varied depending on some other factor. For example, was the associationstronger (or weaker) for women with no education as compared to women with primary orsecondary education? Was the association stronger (or weaker) for non-breastfed children? Thefollowing variables were assessed for interactions with dietary diversity:
! Child age! Whether the child was still breastfed! Mother�s education! Urban/rural location of household! Asset index tercile
Table 29 summarizes which factors were significant (at the p<0.05 level) in the regressionmodels, and Table 30 shows which interactions were significant (at the p<0.20 level). Annex 3gives more details of these analyses, with tables showing coefficients for each factor and R2
values for the models. R2 values ranged from at low of 0.14 in Zimbabwe to a high of 0.30 inPeru.
22 Except in Haiti, where 24-hour diversity terciles were used.

Cha
pter
7: A
ssoc
iatio
n B
etw
een
Die
tary
Div
ersi
ty a
nd H
eigh
t-for
-Age
Z-S
core
s
Tab
le 2
9. S
umm
ary
of r
egre
ssio
n re
sults
: D
epen
dent
var
iabl
e =
HA
Z. S
igni
fican
t coe
ffic
ient
s by
coun
trya
Ben
inE
thio
pia
Mal
awi
Mal
iR
wan
daZ
imba
bwe
Cam
bodi
aN
epal
Col
ombi
aH
aiti
Peru
Chi
ld a
ge-
--
--
--
--
Chi
ld a
ge sq
uare
d+
++
++
++
Sex
of c
hild
b-
--
-M
ater
nal h
eigh
t+
++
++
++
++
++
Mat
erna
l BM
I+
++
++
Mat
erna
l edu
catio
n+
++
Edu
catio
n of
mot
her�
s par
tner
++
Num
ber
ofan
tena
tal c
are
visi
ts+/
-c+
Urb
an o
r ru
rald
--
-+
--
Ass
et in
dex
terc
ile+
++
+-
++
Still
bre
astf
ede
--
-N
umbe
r of
chi
ldre
nun
der
5 ye
ars
--
--
--
Die
tary
div
ersi
tyte
rcile
(3 o
r m
ore
days
)+
++
++
+
a A �
+� in
dica
tes a
pos
itive
ass
ocia
tion,
and
a �
-� in
dica
tes a
neg
ativ
e as
soci
atio
n.b A
neg
ativ
e co
effic
ient
indi
cate
s a n
egat
ive
asso
ciat
ion
for b
oys,
as c
ompa
red
to g
irls.
c Th
e co
effic
ient
for 1
-3 v
isits
was
neg
ativ
e (a
s com
pare
d to
0 v
isits
) whi
le th
e co
effic
ient
for 4
or m
ore
visi
ts w
as p
ositi
ve. F
our o
r mor
e vi
sits
are
reco
mm
ende
d by
WH
O fo
rno
rmal
pre
gnan
cies
(WH
O, 1
994)
.d A
neg
ativ
e co
effic
ient
indi
cate
s a n
egat
ive
asso
ciat
ion
for r
ural
are
as, a
s com
pare
d to
urb
an a
reas
.e A
neg
ativ
e co
effic
ient
indi
cate
s a n
egat
ive
asso
ciat
ion
with
con
tinue
d br
east
feed
ing.
63

Chapter 7: Association Between Dietary Diversity and Height-for-Age Z-Scores
64
In general, significant coefficients are associated with child HAZ in the expected direction.Maternal height is significantly associated with greater HAZ, whereas child age is associatedwith decreasing HAZ Maternal BMI is positive and significant in five countries. There is anegative association for boys, indicating poorer HAZ among boys compared to girls, in fourcountries; this has been observed elsewhere (see e.g. Jacobs, Joubert, and Hoffman, 1988; Joosteet al., 1998; Ngare and Muttunga, 1999).
Coefficients for the asset index terciles are significant (and positive) in six of the elevencountries. In Colombia, there was a negative coefficient when the highest asset tercile wascompared to the lowest; we do not have an explanation for this. Children in urban areas alsohave significantly higher HAZ than children in rural areas in five countries. Surprisingly, ruralchildren have higher HAZ than urban children in Cambodia in our sub-sample.23 The number ofchildren under five years of age in the household has a negative and significant coefficient in sixcountries.
Most surprisingly, neither the mother�s nor her partner�s education level are significant in thesemodels in a majority of countries. Partner�s education was significant (and positive) in twocountries: Zimbabwe and Nepal. Mother�s education was significant in Malawi, Cambodia, andPeru, but only when women with some secondary education are compared with women withnone. In some countries, a lack of association may be due to the fact that very few women havemore than a few years of education, and most have none (for example, in Benin, Ethiopia, Mali,and Nepal). However, in other countries there is good variability in the level of mother�seducation, and the coefficient for education is also not significant in these countries.
Dietary diversity tercile remained significant in these models in six of the nine countries wheresignificant bivariate associations were observed: Ethiopia, Malawi, Rwanda, Zimbabwe,Cambodia, and Nepal.24 In all remaining countries except Colombia, dietary diversitysignificantly interacted with one or more of the factors tested (see Table 30). Thus, anassociation between dietary diversity and child HAZ was confirmed in 10 of the 11 countriesstudied, either as a main effect or in interaction.
A significant interaction between dietary diversity and child age group was found in fourcountries (Malawi, Rwanda, Haiti, and Peru). The nature of the interaction varied by country andno consistent pattern was observed. In some countries dietary diversity was more stronglyassociated with HAZ among younger children (Malawi and Rwanda), whereas in other countriesZ-score differences between diversity terciles were larger among the middle or oldest age group.
A statistically significant association was found between the level of maternal education anddietary diversity only in Malawi, with a stronger association between diversity and HAZ both forwomen with no education and for women with secondary education, as compared to women withsome primary education.
23 In the DHS Country Report for Cambodia, the urban/rural comparison is available for all children under 5 years ofage, and shows a slightly lower mean Z-score in rural areas (-1.8) as compared to urban areas (-1.6) (NationalInstitute of Statistics, Directorate General for Health [Cambodia], and ORC Macro, 2001, p.174).24 In Malawi, only the contrast between middle and low diversity terciles was significant; the joint test that assessedthe overall significance of both contrasts (middle vs. low and high vs. low) was not significant (p = .07).
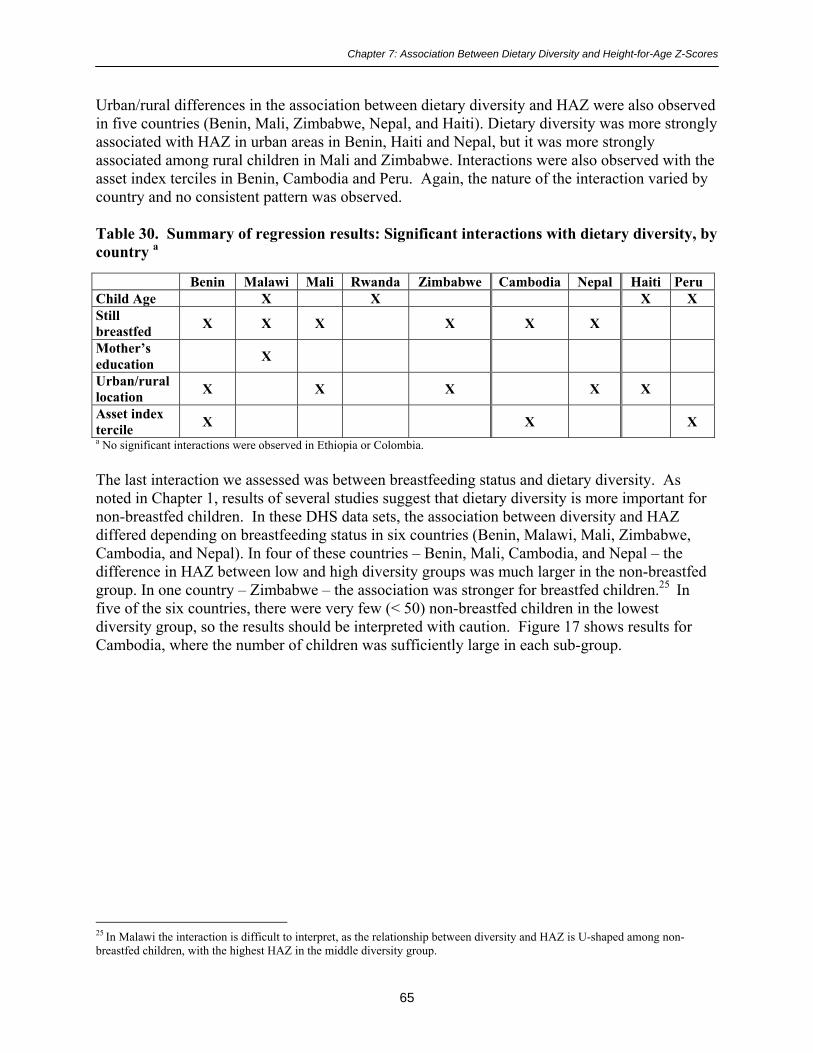
Chapter 7: Association Between Dietary Diversity and Height-for-Age Z-Scores
65
Urban/rural differences in the association between dietary diversity and HAZ were also observedin five countries (Benin, Mali, Zimbabwe, Nepal, and Haiti). Dietary diversity was more stronglyassociated with HAZ in urban areas in Benin, Haiti and Nepal, but it was more stronglyassociated among rural children in Mali and Zimbabwe. Interactions were also observed with theasset index terciles in Benin, Cambodia and Peru. Again, the nature of the interaction varied bycountry and no consistent pattern was observed.
Table 30. Summary of regression results: Significant interactions with dietary diversity, bycountry a
Benin Malawi Mali Rwanda Zimbabwe Cambodia Nepal Haiti PeruChild Age X X X XStillbreastfed X X X X X X
Mother�seducation X
Urban/rurallocation X X X X X
Asset indextercile X X Xa No significant interactions were observed in Ethiopia or Colombia.
The last interaction we assessed was between breastfeeding status and dietary diversity. Asnoted in Chapter 1, results of several studies suggest that dietary diversity is more important fornon-breastfed children. In these DHS data sets, the association between diversity and HAZdiffered depending on breastfeeding status in six countries (Benin, Malawi, Mali, Zimbabwe,Cambodia, and Nepal). In four of these countries � Benin, Mali, Cambodia, and Nepal � thedifference in HAZ between low and high diversity groups was much larger in the non-breastfedgroup. In one country � Zimbabwe � the association was stronger for breastfed children.25 Infive of the six countries, there were very few (< 50) non-breastfed children in the lowestdiversity group, so the results should be interpreted with caution. Figure 17 shows results forCambodia, where the number of children was sufficiently large in each sub-group.
25 In Malawi the interaction is difficult to interpret, as the relationship between diversity and HAZ is U-shaped among non-breastfed children, with the highest HAZ in the middle diversity group.

Chapter 7: Association Between Dietary Diversity and Height-for-Age Z-Scores
66
Figure 17. Cambodia: Interaction between breastfeeding status and dietary diversity
In summary, dietary diversity is strongly associated with HAZ in bivariate associations. Inregression models controlling for a number of potential confounders � both biological and socio-economic � dietary diversity remains significantly associated with HAZ in 10 of the 11countries, either as a main effect or in interaction with one or more factors. The only countrywhere dietary diversity is not associated with child HAZ is Colombia, the country with thehighest overall diversity score in our sample, and the lowest prevalence of malnutrition.Figures 18 and 19 (next page) show mean Z-scores by diversity tercile, after adjusting for allcontinuous variables in the model. For those countries with significant coefficients for diversity,the size of the adjusted Z-score difference between low and high diversity groups ranges from0.40 in Nepal, to 0.53 in both Zimbabwe and Cambodia. These differences are very similar tothe non-adjusted means presented above in Figures 4 and 5.
-1.7 -1.84-1.62
-1.19-1.41
-0.65
-3
-2.5
-2
-1.5
-1
-0.5
0Still breastfed Not breastfed
Mea
n H
AZ
Low Middle High diversity

Chapter 7: Association Between Dietary Diversity and Height-for-Age Z-Scores
67
Figure 18. Adjusteda mean HAZ by dietary diversity tercile in six African countries
a Means were adjusted for all continous variables in the model: child age (and age squared), maternal height and BMI, herpartner�s years of education, and the number of children under five years of age in the household.
Figure 19. Adjusteda mean HAZ by dietary diversity tercile: Five countries in Asia andthe LAC region
a Means were adjusted for all continuous variables in the model: child age (and age squared), maternal height and BMI, herpartner�s years of education, and the number of children under five years of age in the household.
-2.5
-2
-1.5
-1
-0.5
0Benin Ethiopia* Malawi* Mali Rwanda* Zimbabwe*
Mea
n H
AZ
Low Middle High diversity * p < .05, test of significance in model
-2.5
-2
-1.5
-1
-0.5
0Cambodia* Nepal* Colombia Haiti Peru
Mea
n H
AZ
Low Middle High diversity

Chapter 7: Association Between Dietary Diversity and Height-for-Age Z-Scores
68
In Chapter 9 of this report we comment further on these results and outline unansweredquestions. In the next chapter, we address our final objective, by comparing the 24-hour recallwith the 7-day recall.

Chapter 8: Comparing the 24-hour and7-day Food Group Recalls
69
8. COMPARING THE 24-HOUR AND 7-DAY FOOD GROUP RECALLS
The current DHS surveys include both a 24-hour food group recall and a 7-day food group recall(see the DHS questions in Boxes 1 and 2, Chapter 2). In the DHS and other surveys that includesimple food group recalls, shortening and simplifying questionnaires is always an objective.Each question (or set of questions) that remains on the questionnaire should provide unique andimportant information. In this chapter, we assess the �added value� of the 7-day recall bycomparing results from the 24-hour and the 7-day recall, both for individual food and liquidgroups, and for the dietary diversity indicators.
The DHS and similar surveys can provide a good picture of population-level diet patterns.Simple food group recalls are not meant to provide quantitative information about nutrient intakeor adequacy. Therefore in assessing the �added value� of the 7-day recall, we assess it relative tothe task of providing a population-level picture of diet patterns for young children.
More specifically, we consider the objective to be to provide a description of which food groupschildren eat with some regularity. If a child has eaten a food only one day out of the last seven,we do not consider this to be sufficiently regular to have great nutritional significance. While itis easy to say �once a week is not enough� it is more difficult to say � for all food groups and inall places � how often a food group must be eaten to be nutritionally significant. A thoroughanswer to this question would once again involve validation work with a number of data sets. Inthe meantime, we consider a child who has eaten a food group three or more times in the lastweek to have eaten that food group �regularly� for the purposes of this analysis.
Simple food group recalls may be used for purposes other than providing a picture of dietpatterns. For example, Helen Keller International (HKI) used a simple food group recall in theirsurvey tool for assessing population-level risk of vitamin A deficiency (Rosen, Haselow, andSloan, 1993). Program managers may also use data from simple food group recalls to obtainindirect evidence of access, at the level of the child, to various foods. Access at the level of thechild reflects both household-level access to food, and cultural practices including intra-household distribution. When food group recalls are used to answer this type of question, theproportion of children who ate a particular food group at all in the last week may be of interest.26
For example, in Nepal only 16% of the children ate meat, poultry, fish or eggs yesterday, andonly 9% had any of these foods three or more days in the last seven. However, 38% had meat,poultry, fish or eggs at least once in the last week. This means that when these foods areavailable in the household they are given to children, at least some of the time. In most cases,even differences between yesterday and the last seven days were not this extreme, but certainlyfigures for the last seven days are very different from figures for yesterday.
We do not assess the usefulness of the 24-hour as compared to the 7-day recall for these latterpurposes. For those interested in assessing differences between responses for yesterday ascompared to the last seven days, Annex 4 provides a set of tables. These tables compare resultsfor each food group for yesterday, the last seven days, three or more days in the last seven, and 26 Note that other, non-survey methods, including qualitative methods, may be more appropriate for exploring cultural practicesand intra-household distribution of foods.

Chapter 8: Comparing the 24-hour and7-day Food Group Recalls
70
four or more days in the last seven. If, for any reason, estimates are needed of the proportion ofchildren receiving a particular food group at least once in the last week, the 24-hour recall is notsufficient.
We also note that the DHS are extremely large surveys, both in sample size and in length of thequestionnaire. The food group recall is only one very small element in these surveys. It ispossible that if simple food group recalls are implemented differently than they are in the contextof the DHS � if, for example, there were longer training and more probing on the nutritionquestions � 24-hour and 7-day indicators might not relate in the same way as they do in thesedata sets.
Turning back to the issue of assessing foods groups eaten regularly, Figures 20-29 compare theproportion of children eating each food group yesterday to the proportion who ate each foodgroup three or more days in the last seven days.27 The following food groups are shown in thefigures:
1. Starchy staples (food made from grain, roots or tubers)2. Food made from legumes3. Dairy4. Meat, poultry, fish, or eggs5. Vitamin A-rich fruits and vegetables (all three sub-groups together)6. Orange/red vitamin A-rich fruits and vegetables7. Other fruits, vegetables, and juice8. Foods cooked with fat or oil
For simplicity, grain-based staples and roots and tubers are not shown separately, and juice is notshown separately from other fruits and vegetables. However, the vitamin A-rich orange/redvegetables and fruits are shown separately in recognition of their higher carotenoidbioavailability.
Table 31 follows the figures, and summarizes all differences in proportions shown in the figuresthat are larger than five percentage points.
27 Haiti is excluded from this analysis because there was no 7-day recall on the Haiti questionnaire.

Chapter 8: Comparing the 24-hour and7-day Food Group Recalls
71
Figure 20. Benin: Comparing food groups eaten yesterday to 3 or more days last week
Figure 21. Ethiopia: Comparing food groups eaten yesterday to 3 or more days last week
72
19 17
4938
18
35
57
80
21 19
5344
22
42
60
0
20
40
60
80
100
Staples
Legumes
DairyFlesh/eggs
Vit A (all)
Vit A orange
Oth fruit veg
Fats/oil
Perc
ent o
f chi
ldre
n
Yesterday 3+ days
77
4033
12 10 12
35
77
4235
11 9 9
34
0
20
40
60
80
100
Staples
Legumes
DairyFlesh/eggs
Vit A (all)
Oth fruit veg
Fats/oil
Perc
ent o
f chi
ldre
n
Yesterday 3+ days
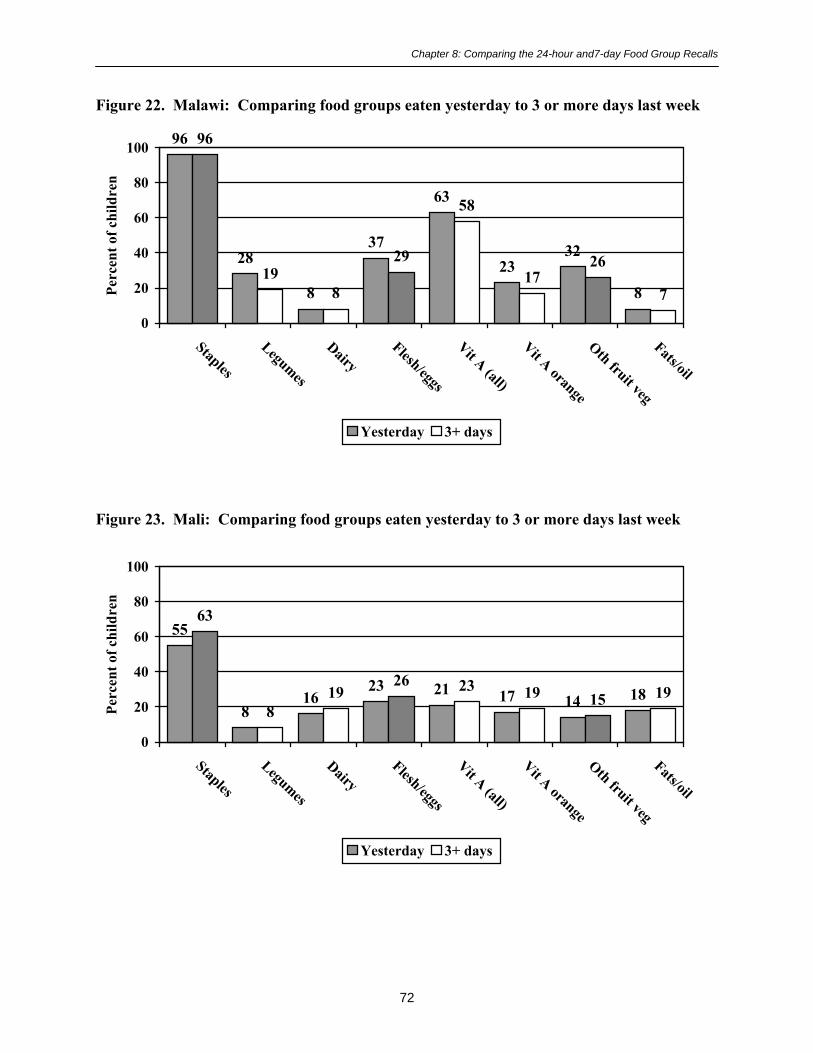
Chapter 8: Comparing the 24-hour and7-day Food Group Recalls
72
Figure 22. Malawi: Comparing food groups eaten yesterday to 3 or more days last week
Figure 23. Mali: Comparing food groups eaten yesterday to 3 or more days last week
96
28
8
37
63
2332
8
96
198
29
58
1726
7
0
20
40
60
80
100
Staples
Legumes
DairyFlesh/eggs
Vit A (all)
Vit A orange
Oth fruit veg
Fats/oil
Perc
ent o
f chi
ldre
n
Yesterday 3+ days
55
816
23 21 17 14 18
63
819
26 23 19 15 19
0
20
40
60
80
100
Staples
Legumes
DairyFlesh/eggs
Vit A (all)
Vit A orange
Oth fruit veg
Fats/oil
Perc
ent o
f chi
ldre
n
Yesterday 3+ days
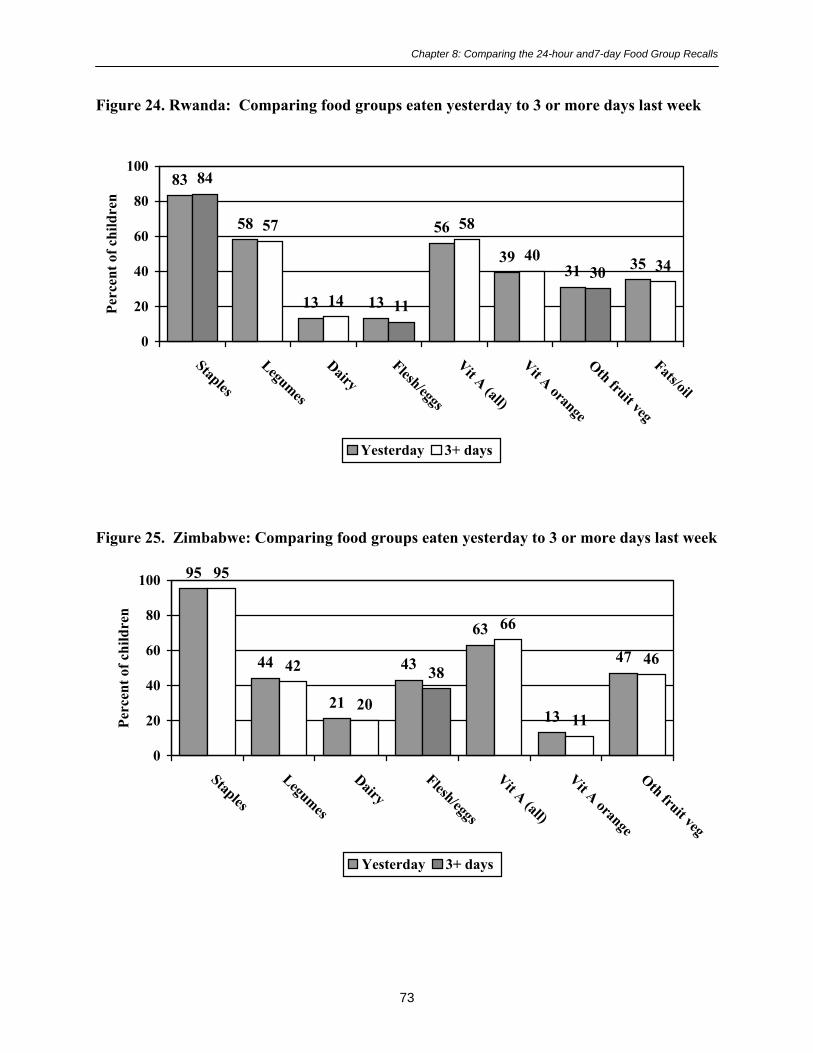
Chapter 8: Comparing the 24-hour and7-day Food Group Recalls
73
Figure 24. Rwanda: Comparing food groups eaten yesterday to 3 or more days last week
Figure 25. Zimbabwe: Comparing food groups eaten yesterday to 3 or more days last week
83
58
13 13
56
3931 35
84
57
14 11
58
4030 34
0
20
40
60
80
100
Staples
Legumes
DairyFlesh/eggs
Vit A (all)
Vit A orange
Oth fruit veg
Fats/oil
Perc
ent o
f chi
ldre
n
Yesterday 3+ days
95
44
21
43
63
13
47
95
42
20
38
66
11
46
0
20
40
60
80
100
Staples
Legumes
DairyFlesh/eggs
Vit A (all)
Vit A orange
Oth fruit veg
Perc
ent o
f chi
ldre
n
Yesterday 3+ days

Chapter 8: Comparing the 24-hour and7-day Food Group Recalls
74
Figure 26. Cambodia: Comparing food groups eaten yesterday to 3 or more days lastweek
Figure 27. Nepal: Comparing food groups eaten yesterday to 3 or more days last week
89
174
70
5541
55
36
88
8 4
6247
3143
24
0
20
40
60
80
100
Staples
Legumes
DairyFlesh/eggs
Vit A (all)
Vit A orange
Oth fruit veg
Fats/oil
Perc
ent o
f chi
ldre
n
Yesterday 3+ days
89
42 40
1630
719
47
90
42 41
9
30
517
46
0
20
40
60
80
100
Staples
Legumes
DairyFlesh/eggs
Vit A (all)
Vit A orange
Oth fruit veg
Fats/oil
Perc
ent o
f chi
ldre
n
Yesterday 3+ days

Chapter 8: Comparing the 24-hour and7-day Food Group Recalls
75
Figure 28. Colombia: Comparing food groups eaten yesterday to 3 or more days last week
Figure 29. Peru: Comparing food groups eaten yesterday to 3 or more days last week
92
33
82 8066
73
46
92
31
84 7969
80
44
0
20
40
60
80
100
Staples
Legumes
DairyFlesh/eggs
Vit A orange
Oth fruit veg
Fats/oil
Perc
ent o
f chi
ldre
n
Yesterday 3+ days
94
34
5770
77 73
50
67
94
33
5969
79 74
51
68
0
20
40
60
80
100
Staples
Legumes
DairyFlesh/eggs
Vit A (all)
Vit A orange
Oth fruit veg
Fats/oil
Perc
ent o
f chi
ldre
n
Yesterday 3+ days

Chapter 8: Comparing the 24-hour and7-day Food Group Recalls
76
The overall picture provided by Figures 20-29 is of quite good agreement between the proportionhaving the food group yesterday as compared to three or more days in the last seven. Table 31shows that the agreement was worst in Benin, Malawi, and Cambodia, but even in thesecountries the differences were generally less than 10 percentage points. Agreement was best inEthiopia, Rwanda, Zimbabwe, and Peru, where none of the percentage point differencesexceeded 5%. In the remaining countries (Mali, Nepal, and Colombia), only one food groupdiffered by more than 5 percentage points.
Table 31. Differences (> 5 percentage points) between food groups eaten yesterday andthose eaten three or more days in the last seven, for children aged 6-23 months, by country
Food groups Percentage point differenceHigher
yesterdaya Higher 3+ daysb
Range ofdifferences
(percentage pts)Benin Starchy staples
Vit A-rich (all)Other fruits/vegs/juice
---867
2-8
Ethiopia None --- --- 0-3Malawi Legumes
Meat/poultry, etc.Vit A-rich (orange)
Other fruits/vegs/juice
9866
--- 0-9
Mali Starchy staples --- 8 0-8Rwanda None --- --- 1-2Zimbabwe None --- --- 0-5Cambodia Legumes
Meat/poultry, etc.Vit A-rich (all)
Vit A-rich (orange)Other fruits/vegs/juice
Fats and oil
988
101212
--- 0-12
Nepal Meat/poultry, etc. 7 --- 0-7Colombia Other fruits/vegs/juice --- 7 0-7Peru None --- --- 0-2
a �Higher� means the percent eating yesterday was more than 5 percentage points higher than the percent eating thefood group 3 or more days out of the last seven. A �---� means that the difference was 0 to 5 percentage points.b �Higher� in this column means that the percent eating the food group 3 or more days out of the last 7 was morethan 5 percentage points higher than the percent eating the food group yesterday.
Differences in both directions were observed, and no single food group dominates the list ofdifferences. The number and size of the differences was not associated with overall dietarydiversity, as both the lowest diversity countries (Mali and Ethiopia) and the highest diversitycountries (Colombia and Peru) showed few differences.

Chapter 8: Comparing the 24-hour and7-day Food Group Recalls
77
Whether or not differences of the sizes seen in the figures and in Table 31 are important willdepend on the objectives of the survey.28 When the purpose of the survey is to provide a generalpicture of diet patterns, differences of this size might not be important.
In addition to assessing the size of the differences in proportions, we statistically assessed theagreement of the two measures. If the objective of both the 24-hour recall and the 7-day recall isto assess whether food groups are eaten regularly, then the two recalls can be considered as twomethods of measuring the same underlying reality. The Kappa statistic is frequently used toassess agreement between two methods of measurement. This statistic assesses agreement at thelevel of the individual, and therefore is a more stringent test than may be needed. For projectpurposes, the information in Figures 20-29 may be all that is needed to assess if the twomeasures are close enough. Nevertheless, the Kappa statistic gives another useful assessment ofagreement between the measures.
The Kappa statistic ranges from 0 to 1, with 1 indicating perfect agreement and 0 indicating thatthe agreement is no better than would be expected due to chance. A Kappa ≥ 0.75 is taken toindicate excellent agreement between measures, and a Kappa of 0.40 � 0.74 indicates fair togood agreement (Fleiss, 1981).
Table 32 (next page) shows both the Kappa and the percent agreement for each comparison. Thepercent agreement is the percent of children for whom the answer for yesterday (yes/no for thefood group) is the same as the answer for 3 or more days. In total, Table 32 shows results for 77comparisons.
Overall, the percent agreement ranges from 68%-98%. Only three comparisons show agreementin fewer than 80% of the children, 33 show agreement for 80-89% of the children, and 41 showagreement in at least 90% of the children. Each Kappa is significant at the p < .001 level.Among the 77 comparisons, one-third (27/77) have Kappas in the excellent range, and all butone of the others are in the fair to good range (Kappa for legumes in Colombia is 0.39). Only 3Kappas are less than 0.50. Agreement is best for starchy staples, dairy, and foods cooked withfats or oil and is worst for fruits and vegetables (both vitamin A-rich and other). However, evenin these groups Kappas were solidly in the fair to good range (range for these groups was 0.54-0.79).
In summary, at either the population level or the individual level, there is good though notperfect agreement between individual food groups eaten yesterday and those eaten three or moredays in the last seven. Whether the level of agreement is good enough will depend on surveyobjectives.
28 When surveys are undertaken for project management purposes, managers must assess both the objectives forasking the food group recall questions and sample size issues. In many KPC surveys, for example, sample sizes willyield estimates with confidence intervals of +/- 10%, or +/-5% at best. In these cases the differences seen above areof the same magnitude as differences due to chance.

Cha
pter
8: C
ompa
ring
the
24-h
our a
nd7-
day
Food
Gro
up R
ecal
ls
Tab
le 3
2. C
ompa
ring
24-
hour
food
gro
up r
ecal
l (Y
/N) t
o th
ree
or m
ore
days
last
wee
k, b
y co
untr
y an
d fo
od g
roup
: Kap
paa
and
perc
ent a
gree
men
t for
eac
h co
mpa
riso
n
Food
s mad
efr
om g
rain
,or
roo
ts a
ndtu
bers
Food
mad
efr
om le
gum
esD
airy
Mea
t,po
ultr
y, fi
sh,
shel
lfish
, or
eggs
Vita
min
A-
rich
frui
ts &
vege
tabl
es(a
ll 3
grou
ps)b
Ora
nge
vita
min
A-
rich
frui
ts &
vege
tabl
es(le
afy
gree
nsex
clud
ed)
Oth
er fr
uits
& v
eget
able
sor
juic
eFo
ods m
ade
with
fat o
r oi
lB
enin
0.75
91%
0.61
88%
0.82
95%
0.78
89%
0.67
83%
0.63
68%
0.76
89%
0.87
94%
Eth
iopi
a0.
8996
%0.
8392
%0.
9196
%0.
6793
%0.
6994
%--
---
-0.
6893
%0.
8694
%M
alaw
i0.
6597
%0.
4881
%0.
7896
%0.
5378
%0.
6583
%0.
5987
%0.
6084
%0.
7596
%M
ali
0.77
89%
0.54
94%
0.78
93%
0.66
87%
0.73
91%
0.73
92%
0.69
92%
0.74
92%
Rw
anda
0.63
90%
0.75
88%
0.86
96%
0.65
91%
0.71
86%
0.72
86%
0.60
82%
0.74
88%
Zim
babw
e0.
7398
%0.
7890
%0.
7993
%0.
5880
%0.
7991
%0.
6192
%0.
7186
%--
---
-C
ambo
dia
0.86
97%
0.54
90%
0.68
97%
0.77
90%
0.71
86%
0.67
85%
0.63
81%
0.60
83%
Nep
al0.
9198
%0.
7085
%0.
9095
%0.
4688
%0.
6384
%0.
5494
%0.
66c
90%
0.89
94%
Col
ombi
a0.
6895
%0.
3973
%0.
7593
%0.
6087
%--
---
-0.
6384
%0.
5784
%0.
7085
%Pe
ru0.
8498
%0.
5680
%0.
8090
%0.
6484
%0.
7189
%0.
6887
%0.
6583
%0.
8593
%
a P <
.001
for a
ll K
appa
b The
thre
e gr
oups
are
: 1. Y
ello
w/o
rang
e vi
tam
in A
-ric
h ve
geta
bles
such
as p
umpk
in, c
arro
t, an
d or
ange
swee
t pot
atoe
s; 2
. Gre
en le
afy
vege
tabl
es; a
nd 3
. Man
go o
r oth
er v
itam
inA
-ric
h fr
uits
.
c In N
epal
, jui
ce w
as n
ot in
clud
ed o
n th
e qu
estio
nnai
re; s
tatis
tics a
re sh
own
for �
othe
r fru
its a
nd v
eget
able
s.�
78

Chapter 8: Comparing the 24-hour and7-day Food Group Recalls
79
In addition to assessing agreement for individual food groups, we assessed agreement betweenmeasures of dietary diversity based on the 24-hour food group recall and the 7-day food grouprecall. We compared the number of food groups eaten yesterday to the number eaten three ormore days, four or more days, or at all in the last seven days. Table 33 presents the average foodgroup diversity by country for yesterday and last week, and also gives the concordancecoefficient (Rho_c) for each comparison. Rho_c was significant at the p < .001 level for allcomparisons; in assessing the strength of the relationship, Rho_c can be interpreted in the sameway as a simple correlation coefficient.
Table 33. Concordance coefficientsa for 24-hr diversity as compared to three or more days,four or more days, and at least once in the last seven days, by country
Average food groupdiversity
24hr 3+d 4+d 1+db
Rho_c for 24-hrvs. 3 or more
days
Rho_c for 24-hrvs. 4 or more
days
Rho_c for 24-hrvs. at least once
in 7 daysBenin 2.9 3.2 2.8 3.9 0.85 0.84 0.76Ethiopia 2.2 2.2 1.9 2.8 0.88 0.81 0.81Malawi 2.7 2.4 1.9 3.6 0.70 0.53 0.67Mali 1.5 1.7 1.5 2.4 0.81 0.78 0.72Rwanda 2.9 2.9 2.4 3.8 0.82 0.74 0.72Zimbabwec
3.1 3.1 2.7 3.9 0.81 0.74 0.73
Cambodia 3.3 2.8 2.2 3.7 0.77 0.60 0.84Nepal 2.8 2.8 2.4 3.7 0.82 0.76 0.74Colombia 4.7 4.8 4.2 5.9 0.75 0.69 0.56Haiti 3.8 (no 7-day data) --- --- ---Peru 4.5 4.5 3.9 5.5 0.82 0.74 0.72
aP < .001 for all rho_c
bThis is the same as 7-day dietary diversity; each food group is coded yes if the child ate it ever in the last week, and no if not.The food groups are summed to give a 7-day dietary diversity score, indicating whether or not the child had the food at least oneday in the last seven (�1+ days�).
cZimbabwe questionnaire did not include �foods made with fat or oil� so the highest possible diversity score for Zimbabwe is 6.The highest possible score for all other countries is 7.
As Figures 20-29 did for individual food groups, the first column in Table 33 gives a population-level view of food group diversity yesterday as compared to in the last week. In most countries,children had approximately one more food group over the last seven days than they had theprevious day. In comparing the number of food groups eaten yesterday to the number of foodgroups children had three or more days in the last seven, once again agreement is very good.Diversity was the same based on these two measures in five countries (Ethiopia, Rwanda,Zimbabwe, Nepal, and Peru), while the largest difference in average diversity was 0.5, inCambodia.
The concordance coefficient assesses agreement at the individual level. As with the individualfood group results, the coefficients show reasonably strong, but not perfect agreement, at theindividual level.
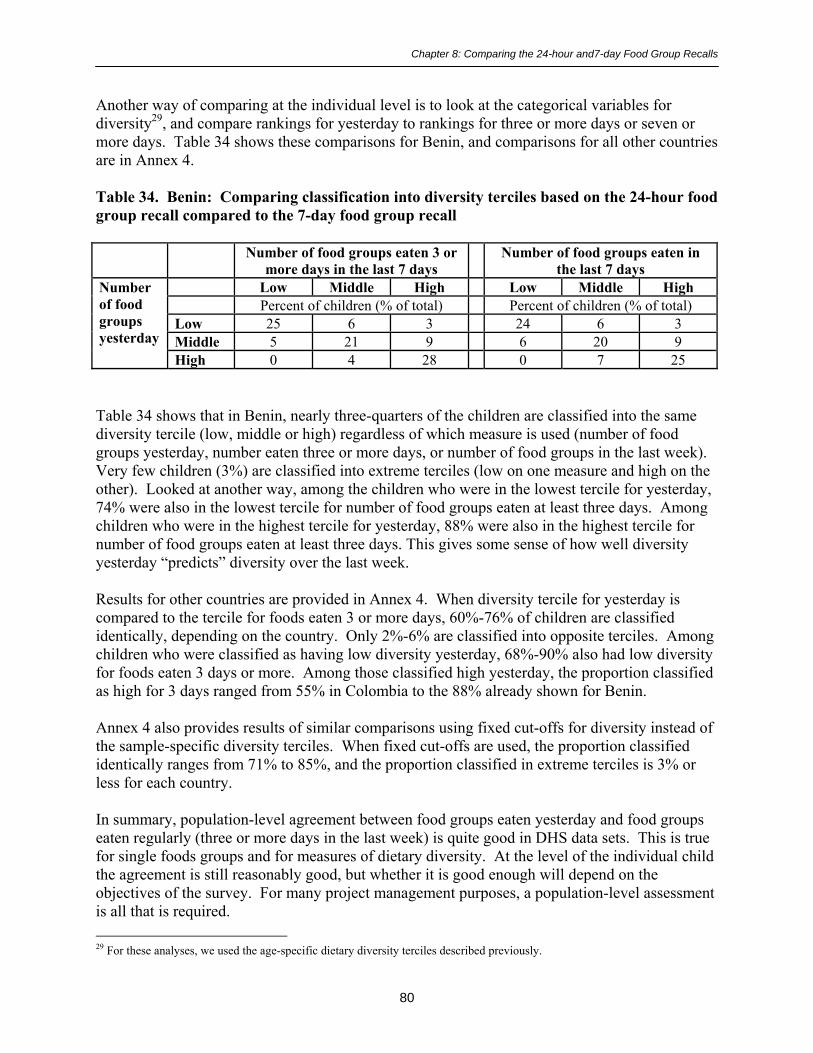
Chapter 8: Comparing the 24-hour and7-day Food Group Recalls
80
Another way of comparing at the individual level is to look at the categorical variables fordiversity29, and compare rankings for yesterday to rankings for three or more days or seven ormore days. Table 34 shows these comparisons for Benin, and comparisons for all other countriesare in Annex 4.
Table 34. Benin: Comparing classification into diversity terciles based on the 24-hour foodgroup recall compared to the 7-day food group recall
Number of food groups eaten 3 ormore days in the last 7 days
Number of food groups eaten inthe last 7 days
Low Middle High Low Middle HighPercent of children (% of total) Percent of children (% of total)
Low 25 6 3 24 6 3Middle 5 21 9 6 20 9
Numberof foodgroupsyesterday
High 0 4 28 0 7 25
Table 34 shows that in Benin, nearly three-quarters of the children are classified into the samediversity tercile (low, middle or high) regardless of which measure is used (number of foodgroups yesterday, number eaten three or more days, or number of food groups in the last week).Very few children (3%) are classified into extreme terciles (low on one measure and high on theother). Looked at another way, among the children who were in the lowest tercile for yesterday,74% were also in the lowest tercile for number of food groups eaten at least three days. Amongchildren who were in the highest tercile for yesterday, 88% were also in the highest tercile fornumber of food groups eaten at least three days. This gives some sense of how well diversityyesterday �predicts� diversity over the last week.
Results for other countries are provided in Annex 4. When diversity tercile for yesterday iscompared to the tercile for foods eaten 3 or more days, 60%-76% of children are classifiedidentically, depending on the country. Only 2%-6% are classified into opposite terciles. Amongchildren who were classified as having low diversity yesterday, 68%-90% also had low diversityfor foods eaten 3 days or more. Among those classified high yesterday, the proportion classifiedas high for 3 days ranged from 55% in Colombia to the 88% already shown for Benin.
Annex 4 also provides results of similar comparisons using fixed cut-offs for diversity instead ofthe sample-specific diversity terciles. When fixed cut-offs are used, the proportion classifiedidentically ranges from 71% to 85%, and the proportion classified in extreme terciles is 3% orless for each country.
In summary, population-level agreement between food groups eaten yesterday and food groupseaten regularly (three or more days in the last week) is quite good in DHS data sets. This is truefor single foods groups and for measures of dietary diversity. At the level of the individual childthe agreement is still reasonably good, but whether it is good enough will depend on theobjectives of the survey. For many project management purposes, a population-level assessmentis all that is required. 29 For these analyses, we used the age-specific dietary diversity terciles described previously.

Chapter 9: Summary
81
9. SUMMARY
Analysis of the DHS+ data sets has contributed to our understanding of the four tasks outlined inChapter 1:
1. To describe how a simple dietary diversity score relates to diet patterns among youngchildren
2. To explore the feasibility of deriving global or regional cut-off points for low and highdiversity
3. To determine whether simple dietary diversity indicators are meaningfully associatedwith height-for-age among young children across a range of countries
4. To test the nature and strength of the associations between food group and dietarydiversity indicators derived from a 24-hour food group recall and those derived from a 7-day food group recall across a range of countries with varying levels of dietary diversity.
9.1. Dietary Diversity and Food Group Patterns
Analysis of the DHS+ data sets has contributed to our understanding of the relationship betweendietary diversity indicators and diet patterns among young children in these countries. Theresults detailed in Chapter 5 show that in each country, children with high diversity scores aremuch more likely to have eaten both animal-source foods and vitamin A-rich fruits andvegetables, as recommended. They are also more likely to have eaten other high quality foods(dairy, legumes, other fruits and vegetables, etc). While this is inevitably so, because the scoresums food groups, it is useful to illustrate because dietary diversity indicators derived from DHSsurveys have not been analyzed up to this point. Chapter 5 shows that differences in diversityscores reflect important differences in dietary patterns.
9.2. Dietary Diversity Indicators and Height-for-Age Z-score (HAZ)
In several studies reviewed in Chapter 1, we observed a strong bivariate association between dietdiversity and HAZ, which is statistically significant in nine of the eleven countries studied. Thesize of Z-score differences between the low and high diversity groups is large and of functionalsignificance. In models controlling for a variety of biological and household socioeconomicfactors, the association between dietary diversity and HAZ remains significant in six countries,and dietary diversity interacts significantly with other factors in four of the remaining 5countries.
Colombia was the only country for which there was no association between dietary diversity andZ-scores and no interactions between diversity and other factors. Colombia � the wealthiestcountry included in the analysis � also has the lowest rates of malnutrition among the elevencountries (16% stunting and 1% wasting among children 6-23 months) and the highest meandietary diversity (4.7 on a scale of 7 points). When the fixed cut-off for low diversity is used (0-2 food groups yesterday) only 10% of the Colombian children aged 6-23 months, and only 4% of

Chapter 9: Summary
82
those aged 12-23 months score �low�. It is likely that low dietary diversity is not a mainconstraint for child nutritional status in this country.
The interaction between breastfeeding status and dietary diversity, observed in four countries, isparticularly interesting. The observed interaction is consistent with several studies reviewed inChapter 1, makes sense conceptually, and shows very large Z-score differences between low andhigh diversity groups for non-breastfed children. Dietary diversity may be particularly importantto ensure nutrient adequacy for non-breastfed children. Dietary diversity may thus be aparticularly relevant proxy for diet quality in the case of non-breastfed children in the age-rangestudied.
Our analysis of dietary diversity and HAZ is limited by the fact that measurement of householdwelfare and socioeconomic status is limited in the DHS data sets. Further, the summaryasset/welfare measure (the �asset index�) used in our analysis did not capture a large proportionof the variability in asset and housing variables (the proportion of shared variation captured bythe index ranged from 8% in rural Ethiopia to 25% in urban Benin). Therefore even in thecountries where associations remained significant, we cannot conclusively state that theassociations are not due to socioeconomic characteristics such as wealth or income.
9.3. The Question of Cut-offs for a Dietary Diversity Score
In the absence of international recommendations for food group diversity, we have used cut-offsfor dietary diversity based on terciles, which were derived individually for each study sample.The cut-offs derived using this approach varied greatly among countries. As expected, there wasa tendency for countries with overall higher mean dietary diversity scores (Table 8) to havehigher cut-off points to define high dietary diversity and vice versa.
Looking across regions, cut-offs were lowest in Sub-Saharan Africa and highest in the LatinAmerican/Caribbean countries. Looking within regions, there was great variability in cut-offswithin the Sub-Saharan Africa region. Too few DHS+ data sets were available in Asia and theLatin America/Caribbean region to make judgments about variability within these regions.
Within Sub-Saharan Africa, cut-offs defining low diversity varied from �<1� for Mali, to �<2� forBenin and Ethiopia, to �< 3� for the remaining 2 countries. An even greater variability was foundfor the cut-offs that defined high diversity (�>1� for Mali, �>2� for Ethiopia �>3 for Malawi andRwanda and �>4� for Benin). Clearly, using the sample-based approach to define cut-offs canresult in a �high� diversity group corresponding to very low diversity in the diet (for example, inMali a child who consumed two food groups would be classified in the high diversity group).
We illustrate the usefulness of cut-offs both for descriptive analysis of diet patterns, and forresearch purposes, but we do not make any recommendations about cut-offs. Several studies inChapter 1 addressed the issue of cut-offs in relating dietary diversity to nutrient adequacy.Similar studies are needed in a variety of contexts, using a variety of operationalized dietarydiversity indicators. Such studies could provide the information needed to define nutritionallymeaningful dietary diversity cut-offs.
Chapter 9: Summary
83
9.4. Comparing 24-hour and 7-day Food Group Recalls
When fielding household surveys, the added value of each set of questions should always beassessed, as it is a challenge to keep fieldwork, data entry, and data processing timely andmanageable. This is particularly true for surveys undertaken in the context of projects orprograms, as compared to research settings. Our analysis contributes to an on-going discussionof the usefulness of the 7-day recall, in addition to the 24-hour recall, in the context of simplesurveys.
We assessed the comparability of the 24-hour food group recall and indicators derived from the7-day food group recall, when the purpose is to capture population-level diet patterns. Morespecifically, we assessed this relative to the goal of identifying which food groups are eatensufficiently regularly to be of nutritional significance. We defined �sufficiently regularly� asthree or more days in the last seven days.30
The proportion of children eating a food group yesterday and the proportion eating that foodgroup three or more days out of the last seven are remarkably consistent for almost all foodgroups in all countries. At the population level, the diversity indicator constructed from the 24-hour food group recall was also very similar to the indicator reflecting the number of food groupseaten three or more days in the last seven. There was reasonably strong agreement even at theindividual level; whether the individual-level agreement is sufficient would depend on thequestion at hand. In most project contexts, population-level analysis is all that is practical andfrequently is all that is needed.
We conclude that in the context of the DHS, there is little added value to the 7-day recall, if theobjective is to characterize population-level diet patterns reflecting frequently eaten foods.Another, compromise approach which has been used in some surveys is to ask about all foods orfood groups eaten in the last 24 hours, and in addition to ask about specific foods or food groupsof interest eaten in the last week (for example, vitamin A-rich foods, animal-source foods, etc.).
9.5. Conclusion
Our work suggests that simple indicators of dietary diversity reflect important differences in dietpatterns, and are associated with height-for-age Z-scores. Further work, with richer data sets,could better define the relationship between specific dietary diversity indicators and nutrientadequacy. In such work, particular attention should be paid to non-breastfed children in thevulnerable 6-23 month age group. Further work could also better define apparent relationshipsbetween dietary diversity, household socioeconomic status, and outcomes such as childnutritional status.
30 As with a number of other issues raised in this report, the relationship between the number of days a food group is eaten andnutrient intake could be clarified by research validating simple indicators.

References
84
REFERENCES
Allen, L. H., A. Black, J. Backstrand, G. Pelto, R. Ely, E. Molina, and A. Chavez. "An analyticalapproach for exploring the importance of dietary quality versus quantity in the growth ofMexican children." Food and Nutrition Bulletin 13 (1991): 95-104.
Arimond, M. and M. Ruel. Summary indicators for infant and child feeding practices: Anexample from the Ethiopia Demographic and Health Survey 2000. Food Consumption andNutrition Division Discussion Paper. Washington, D.C.: International Food Policy ResearchInstitute, 2002.
Arimond, M. and M.Ruel. Generating Indicators of Appropriate Feeding of Children 6 through23 Months from the KPC 2000+. Washington, D.C.: Food and Nutrition Technical Assistance(FANTA) Project, Academy for Educational Development (AED), 2003.
Brown, K.H., J.M. Peerson, J.E. Kimmons, and C. Hotz. "Options for achieving adequate intakefrom home-prepared complementary foods in low income countries." Public Health Issues inInfant and Child Nutrition (Black, R.E. & Fleischer Michaelsen, K., eds.). Nestlé NutritionWorkshop Series, Pediatric Program, Vol. 48. Nestec Ltd. Philadelphia, PA: Vevey/LippincottWilliams & Wilkins, 2002.
Drewnowski, A., S. Ahlstrom Henderson, A. Driscoll, and B. Rolls. "The Dietary Variety Score:Assessing diet quality in healthy young and older adults." Journal of the American DieteticAssociation 97 (1997): 266-271.
Ferguson, E., R. Gibson, C. Opare-Obisaw, C. Osei-Opare, C. Lamba, and S. Ounpuu."Seasonal food consumption patterns and dietary diversity of rural preschool Ghanaian andMalawian children." Ecology of Food and Nutrition 29 (1993): 219-234.
Filmer, D. and L. Prichett. Estimating wealth effects without expenditure data -- or tears: Anapplication to educational enrollments in States of India. World Bank Policy Research WorkingPaper, No. 1994. Washington, D.C.: The World Bank, 1998.
Fleiss, J. Statistical Methods for Rates and Proportions. 2nd ed. Wiley Series in Probability andMathematical Statistics. New York: Wiley & Sons, 1981.
Guthrie, H. and J. Scheer. "Validity of a dietary score for assessing nutrient adequacy." Journalof the American Dietetic Association 78 (1981): 240-245.
Gwatkin, D., S. Rutstein, K. Johnson, R. Pande, and A. Wagstaff. Socioeconomic Differences inHealth, Nutrition, and Population in Mozambique. Washington, D.C.: HNP/Poverty ThematicGroup of the World Bank, 2000.
Haines, P., A. Siega-Riz, and B. Popkin. "The Diet Quality Index revised: A measurementinstrument for populations." Journal of the American Dietetic Association 99 (1999): 697-704.

References
85
Hatløy, A., L. E. Torheim, and A. Oshaug. "Food variety�A good indicator of nutritionaladequacy of the diet? A case study from an urban area in Mali, West Africa." European Journalof Clinical Nutrition 52 (1998): 891-898.
Hatløy, A., J. Hallund, M. M. Diarra, and A. Oshaug. "Food variety, socioeconomic status andnutritional status in urban and rural areas in Koutiala (Mali)." Public Health Nutrition 3 (2000):57-65.
Hoddinott, J. and Y. Yohannes. Dietary diversity as a food security indicator. FoodConsumption and Nutrition Division Discussion Paper. Washington, D.C.: International FoodPolicy Research Institute, 2002.
Jacobs, M., G. Joubert, and M. Hoffman. "Anthropometric assessment of children in Mamre."South African Medical Journal 74 (1988): 341-343.
Johns Hopkins University, PVO Child Survival Support Program. "Origin of the Rapid KPCSurvey." PVO Child Survival Technical Report 3 (1993). Cited in William Weiss. "VarianceEstimates of Rapid Knowledge, Practice and Coverage (KPC) Surveys: Implications forMonitoring and Evaluation of PVO Child Survival Projects." Unpublished document, 1998.
Jooste, P., M. Langenhoven, J. Kriek, E. Kunneke, M. Nyaphisis, and B. Sharp. "Nutritionalstatus of rural children in the Lesotho Highlands." East African Medical Journal 74: 680-689.
Kant, A. "Indexes of overall diet quality: A review." Journal of the American DieteticAssociation 96 (1996): 785-791.
Kant, A., A. Schatzkin, R. Ziegler, and M. Nestle. "Dietary diversity in the US population,NHANES II, 1976-1980." Journal of the American Dietetic Association 91 (1991): 1526-1531.
Kant, A., A. Schatzkin, T. B. Harris, R. G. Ziegel, and G. Block. "Dietary diversity andsubsequent mortality in the First National Health and Nutrition Examination SurveyEpidemiologic Follow-up Study." American Journal of Clinical Nutrition 57 (1993): 434-440.
Kennedy, E. T., J. Ohls, S. Carlson, and K. Fleming. "The Healthy Eating Index: Design andapplications." Journal of the American Dietetic Association 95 (1995): 1103-1108.
Krebs-Smith, S., H. Smiciklas-Wright, H. Gutherie, and J. Krebs-Smith. "The effects of varietyin food choices on dietary quality." Journal of the American Dietetic Association 87 (1987):897-903.
Lin, L. "A concordance correlation coefficient to evaluate reproducibility." Biometrics 45(1989): 255-268.
Löwik, M., K. Hulshof, and J. Brussaard. "Food-based dietary guidelines: Some assumptionstested for The Netherlands." British Journal of Nutrition 81 (1999): S143-S149.
References
86
Madden, J. P. and M. D. Yoder. "Program evaluation: Food stamps and commodity distributionin rural areas of central Pennsylvania." Pennsylvania Agricultural Experiment Station Bulletin78 (1972): 1-119.
Marquis, G. S., J.-P. Habicht, C. F. Lanata, R. E. Black, and K. M. Rasmusson. "Breast milk oranimal-product foods improve linear growth of Peruvian toddlers consuming marginal diets."American Journal of Clinical Nutrition 66 (1997): 1102-1109.
Martorell, R. and N.S. Scrimshaw. "The effects of improved nutrition in early childhood: theInstitute of Nutrition of Cenral America and Panama (INCAP) follow-up study." Journal ofNutrition 125 (1995)(4S).
National Institute of Statistics, Directorate General for Health [Cambodia], and ORC Macro.Cambodia Demographic and Health Survey 2000. Phnom Penh, Cambodia, and Calverton,Maryland USA: National Institute of Statistics, Directorate General for Health [Cambodia], andORC Macro, 2001.
Ngare, D. and J. Muttunga. "Prevalence of malnutrition in Kenya." East African MedicalJournal 76: 376-380.
Ogle, B. M., P. H. Hung, and H. T. Tuyet. "Significance of wild vegetables in micronutrientintakes of women in Vietnam: An analysis of food variety." Asia Pacific Journal of ClinicalNutrition 10 (2001): 21-30.
Onyango, A., K. G. Koski, and K. L. Tucker. "Food diversity versus breastfeeding choice indetermining anthropometric status in rural Kenyan toddlers." International Journal ofEpidemiology 27 (1998): 484-489.
ORC Macro. "MEASURE DHS+ Model 'A' Questionnaire with Commentary for HighContraceptive Prevalence Countries." Calverton, Md.: ORC Macro, 2001.
PAHO/WHO. "Guiding Principles for Complementary Feeding of the Breastfed Child.�Washington, D.C./Geneva, Switzerland: PAHO/WHO, 2003.
Patterson, R., P. Haines, and B. Popkin. "Diet quality index: Capturing a multidimensionalbehavior." Journal of American Dietetic Association 94 (1994): 57-64.
Rose, D., S. Meershoek, C. Ismael, and M. McEwan. "Evaluation of a rapid field tool forassessing household diet quality in Mozambique." Food and Nutrition Bulletin 23 (2002):181-189.
Rosen, D., N. Haselow, and N.S loan. How to Use the HKI Food Frequency Method to AssessCommunity Risk of Vitamin A Deficiency. New York: Helen Keller International, 1993.
Ruel, M. "Operationalizing Dietary Diversity: A Review of Measurement Issues and ResearchPriorities." Journal of Nutrition, forthcoming.

References
87
Ruel, M. and P. Menon. "Child feeding practices are associated with child nutritional status inLatin America: Innovative uses of the Demographic and Health Surveys." Journal of Nutrition132 (2002): 1180-1187.
Schuette, L., W. Song, and S. Hoerr. "Quantitative use of the Food Guide Pyramid to evaluatedietary intake of college students." Journal of the American Dietetic Association 96 (1996):453-457.
StataCorp. Stata Statistical Software: Release 7.0 Reference, vol. 4. College Station, TX: StataCorporation, 2001.
Taren, D. and J. Chen. "A positive association between extended breast-feeding and nutritionalstatus in rural Hubei Province, People's Republic of China." American Journal of ClinicalNutrition 58 (1993): 862-867.
Tarini, A., S. Bakari, and H. Delisle. "The overall nutritional quality of the diet is reflected inthe growth of Nigerian children." Sante 9 (1999): 23-31.
WHO. Prenatal Care. Report of a Technical Working Group. Geneva: WHO, 1994.
WHO. Physical Status: The Use and Interpretation of Anthropometry. WHO Technical ReportSeries No. 854. Geneva: WHO, 1995.
WHO. Complementary Feeding of Young Children in Developing Countries: A Review ofScientific Evidence. Geneva: WHO, 1998.
WHO/FAO. Preparation and Use of Food-Based Dietary Guidelines. Report of a JointWHO/FAO Consultation. WHO Technical Report Series No. 880. Geneva: WHO, 1998.
WHO/FAO. Diet, Nutrition, and the Prevention of Chronic Diseases. Report of a JointWHO/FAO Consultation. WHO Technical Report Series No. 916. Geneva: WHO, 2003.
Willet, W., and E. Lenart. Nutritional Epidemiology. New York and Oxford: Oxford UniversityPress, 1998.

Annex 1. Food Groups on Country Questionnaires
88
ANNEX 1. FOOD GROUPS ON COUNTRY QUESTIONNAIRES
The MEASURE DHS+ model questionnaire is presented in Chapter 2. This Annex providesinformation on any food groups that differ from those on the model questionnaire. Somedifferences represent appropriate adaptations of the questionnaire, while others are lessconsistent with the model.
The model questionnaire is compared to questionnaires as presented in each country report.Country reports (and questionnaires) are either in English (Ethiopia, Malawi, Zimbabwe,Cambodia, Nepal), French (Benin, Mali, Rwanda, Haiti) or Spanish (Colombia, Peru). In thefour French questionnaires the food groups appear to be direct translations of the modelquestionnaire food groups, with no adaptation. For these countries � Benin, Mali, Rwanda, andHaiti � no further information is provided below.
For the remaining seven countries, differences are summarized below, by liquid or food group.31
Food group descriptions from the Model Questionnaire are in bold letters.
! Commercially produced infant formula?
Ethiopia: No group for infant formulaNepal: No group for infant formula, but included with other milks, below.Colombia: Leche en polvo para bebe? (powdered milk for babies?)
Comments: In both Ethiopia and Nepal, formula use is very rare so lack of a separatefood group for formula is not very problematic. In Colombia, because the wording didnot clearly indicate infant formula, we examined the data to see what this grouprepresents. The data suggest that this group was capturing other powdered milk inaddition to formula. The proportion of children receiving this did not decline among theolder children; 30% of the children 18-23 months of age had “leche en polvo” the daybefore the survey. This variable was combined with other dairy, in Colombia only.
! Any other milk such as tinned, powdered, or fresh animal milk?
Ethiopia: Milk other than breastmilk?Zimbabwe: Split milks into two groups:
Fresh cow or goat milk?Any other milk such as tinned or powdered milk?
Cambodia: Any other milk such as tinned, powdered, or sweetened condensed milk?Nepal: Any milk, other than breastmilk, such as cow milk, mohi, tinned or powdered
milk, or infant formula?
31 Differences are not listed if the only change was to shorten the list of examples (e.g., in Malawi, the list of examples for rootsand tubers was shortened to included only those commonly eaten in that country: white potatoes, cassava, or other. This is notlisted as a difference).
Annex 1. Food Groups on Country Questionnaires
89
Comments: In Cambodia, a very low proportion of children were reported to have hadmilk in the previous day or even in the previous week. It is possible that the wording ofthe question, which does not mention fresh milk, contributes to this.
! Fruit juice?
Cambodia: Fruit juice such as coconut juice?Nepal: Did not include this group.
! Any other liquids such as sugar water, tea, coffee, carbonated drinks, or soupbroth?
Malawi: Any other liquids such as tea, coffee, carbonated drinks, �freezes�, or soupbroth?
Zimbabwe: Any other liquids such as glucose water, tea, herbal teas/roots, or mahewu?Nepal: Any other liquids such as ghee, honey, tea, soup, rice water?
Comments: In Nepal, note that ghee is listed twice, with other liquids and with fats. Weassume it is sometimes given diluted or as an ingredient in a drink.
! Other country-specific liquid groups added:
Malawi: Thobwa
! Any food made from grains [e.g., millet, sorghum, maize, rice, wheat, porridge, orother local grains]?
Ethiopia: Any food made from grains e.g. millet, sorghum, maize, rice, wheat, barely [sic], teff, oats?
Malawi: Split grain-based foods into three groups:Any food made from grains [e.g. millet, etc., as above, except porridge]Plain porridge?Porridge enriched with foods such as legumes, vegetables, fruits, ground nut
flour, fish or meat?Zimbabwe: Any other foods made from grains such as sadza, bread, porridge or thin
gruel?Cambodia: Rice, rice flour, maize, bread, wheat, cakes, porridge, or noodles?Nepal: Any food made from grains, like rice, millet, sorghum, maize, wheat, or
porridge?Peru: Any food made with grain (rice, maize, oats, quinoa, wheat (flour, bread, noodles,
biscuits/cookies), kiwicha)?
Comments: In Malawi, because porridge enriched with other foods is included as aseparate food group, it is likely that those other ingredients (e.g., ground nuts) did notalso get recorded in their own group. This could have resulted in lower estimates for theproportion of children receiving some food groups, and lower diversity scores for some
Annex 1. Food Groups on Country Questionnaires
90
children. Approximately 15% of the children had enriched porridge the day before thesurvey. In Zimbabwe, it would have been better if the thin gruels were included asliquids, rather than with the solid food groups, as the main ingredient is probably water.
! Pumpkin, red or yellow yams or squash, carrots, or red sweet potatoes?
Ethiopia: Combines three groups:Any food made from pumpkins, carrots, red sweet potatoes, green leafyvegetables, mango, papaya?
Malawi: Pumpkin, yellow squash, carrots, or yellow sweet potatoes?Zimbabwe: Pumpkin, squash, sweet potatoes, or carrots?Nepal: Combines two groups:
Pumpkin, carrots, papaya, or mango?Colombia: Pumpkin, carrots, kidney beans (habichuela) and tomatoPeru: Squash, pumpkin, carrots, tomatoes?
Comments: In Zimbabwe: White sweet potatoes are eaten in southern Africa, and arelow in carotenoids. By not specifying color, this questionnaire may have led to anoverestimate of the proportion of children eating vitamin A-rich vegetables. InColombia, two foods are listed that are not generally considered to be high in vitamin A(kidney beans and tomato). Similarly, tomato is included in Peru. There are severalways to assess which foods to include in lists of vitamin A-rich fruits and vegetables.They can be assessed based on carotenoid content (per gram), in which case tomatowould not be included. Or they can be assessed based on the role they play in the diet; insome contexts, tomatoes may provide more carotenoids than other foods, because theyare much more frequently eaten or eaten in larger quantities (WHO, 1998, p.107).
! Any other food made from roots or tubers [e.g., white potatoes, white yams, manioc,cassava, or other local roots/tubers]?
Ethiopia: Any food made from roots or tubers [e.g. white potatoes, cassava, enset or otherlocal roots/tubers]?
Zimbabwe: Potatoes or other food made from tubers?Cambodia: Any other food made from roots or tubers such as white potatoes, taro, white
or purple yams, cassava, or daikon?Nepal: Food made from roots or tubers like potatoes, yams, tapioca?Peru: Food made from tubers or roots (potatoes, manioc, sweet potatoes, olluca, mashua)
Comments: Peru: Note that sweet potatoes are included in this group. Presumably nocarotenoid rich orange/yellow varieties are eaten.
! Any green leafy vegetables?
Ethiopia: Combined with orange vegetables, above.Cambodia: Any green leafy vegetables such as morning glory, basil, amaranth, mustard
greens?

Annex 1. Food Groups on Country Questionnaires
91
Colombia: Did not include this group.Peru: Any greens (celery, leek, spinach, chard, etc.)?
Comments: In Peru, several foods are included that are not generally considered high incarotenoids (celery and leek). Possibly these words have local definitions and indicateother foods (“apio” and “poro”).
! Mango, papaya [or other local vitamin A rich fruits]?
Ethiopia: Combined with orange vegetables, above.Cambodia: Ripe mango, ripe papaya, jackfruit, or durian?Nepal: Combined with orange vegetables, above.Colombia: Mango, papaya, pineapple, plums, grapes, berries?Peru: Mango, papaya, plantain �de la isla�, maduro, aguaje32?
Comments: In Cambodia, jackfruit and durian are included. Jackfruit are reasonably,though not extremely high in carotenoids; in the WorldFood33 database, using the old 6:1conversion factor, jackfruit is listed at 91 RE/100 grams. Durian, however, are not highin carotenoids, according to this source (4 RE/100 grams). The proportion of childreneating vitamin A-rich fruits may thus be overestimated in Cambodia. In Colombia anumber of fruits, not generally considered high in carotenoids are also included. InPeru, several words could not be translated.
! Any other fruits and vegetables [e.g., bananas, apples/sauce, green beans, avocados,tomatoes]?
Malawi: Any other fruits and vegetables [e.g. oranges, bananas, guava, green beans,avocados, tomatoes]?
Zimbabwe: Any other fruits and vegetables such as oranges, bananas, or tomatoes?Cambodia: Any other fruits and vegetables such as bananas, green beans, tomatoes,watermelon, pineapple?Nepal: Any other fruits and vegetables, like bananas, apples, guava, green beans, amala,orange, tomatoes?Colombia: Other fruits (bananas, apples, guava)?Nepal: Other fruits (plantain �de la seda� apple, avocado)?
! Meat, poultry, fish, shellfish, or eggs?
Ethiopia: Meat, poultry, fish, egg, cheese, or yogurt?Malawi: Meat, poultry, fish, termites, or eggs?Cambodia: Split into two groups:
Red meats, poultry, fish, shellfish, snake, snails, frog, rat, or insects?Liver, tripe, kidneys, and other organ meats, or eggs?
32 Maduro means ripe, but can also mean plantain; could not find a food-related translation for aguaje.33 The WorldFood Dietary Assessment System is a public domain program available at: www.fao.org/infoods/software/worldfood.html.

Annex 1. Food Groups on Country Questionnaires
92
Nepal: Meat, poultry, fish, liver, or eggs?
! Any food made from legumes [e.g., lentils, beans, soybeans, pulses, or peanuts]?
Malawi: Any food made from legumes [e.g., peas, beans, cowpeas, pulses, orgroundnuts]?
Zimbabwe: Beans, groundnuts or peanut butter?Cambodia: Any food made from legumes such as beans, mung beans, soybeans, tofu, or
nuts?Nepal: Any food made from legumes, like daal, peanuts, beans?
! Cheese or yogurt?
Ethiopia: Combined with meat, poultry, etc., above.Cambodia: Did not include this group.
! Any food made with oil, fat, or butter?
Malawi: Any food made with oil, fat, margarine, or butter?Zimbabwe: Did not include this group.Cambodia: Any food made with oil, fat, or coconut milk?Nepal: Any food made with ghee, oil, fat, or butter?
! Other country-specific food groups added:
Colombia: Grain-based enriched weaning foods distributed by a variety of governmentand non-governmental organizations.
Comments: These foods were combined with other grain-based foods for the purposes ofconstructing diversity scores.

Annex 2. Construction of Asset Index for Each Country
93
ANNEX 2. CONSTRUCTION OF ASSET INDEX FOR EACH COUNTRY
Details of the method used by Gwatkin et al. (2000) were provided to us, including a sampleStata command file (personal communication with Rohini Pande, one of the co-authors). Wefollowed their method, with the following exceptions: we did the analysis separately for ruraland urban areas, and we created terciles rather than quintiles because our sub-sample sizes aresmaller. Finally, we used larger groupings for some variables. For example, for water source weused the following variables, each dichotomously coded yes or no:
Piped waterCovered wells/springsOpen wells/springsSurface waterRainwaterTanker or bottled waterOther water sources
Gwatkin and colleagues included more categories in some countries (for example, using separatevariables for water piped into the dwelling, piped into the compound, or a public standpipe).
The following Stata commands and options used were:
Factor varlist [aweight=weightvariable] if v025==1, pc means mineigen (2)Score u1Xtile utertile=u1, nq(3)
Factor varlist [aweight=weightvariable] if v025==2, pc means mineigen (2)Score r1Xtile rtertile=r1, nq(3)
Generate tertile=utertile if v025==1Replace tertile=rtertile if v025==2
V025 is coded �1� for urban households and �2� for rural households.
Note that �Factor� is not a SVY (survey) command in Stata, so design elements such asstratification and clustering cannot be specified. However, sample weights can be applied (seebelow).
OPTIONS USED:
WEIGHTS: Aweights and fweights are allowed for this Stata, not pweights. Our weightvariable (in data set from ORC Macro) is a pweight. This can be a problem when standard errorsare calculated, because aweights are actually meant for situations where data are already means,and therefore represent >1 observation; this is not the case with pweights. However, when onlypoint estimates (e.g., in this case, of factor scores) the results will be very close.

Annex 2. Construction of Asset Index for Each Country
94
PC specifies that the method of extraction is principal components. Stata distinguishes betweenthe option �pc� -- where principal components is used to analyze the correlation (or, optionally,covariance) matrix � and �pcf�, where factor analysis is performed using the principal-components factor method. The default correlation matrix is used.
Stata manual also clarifies that when the �pc� method is used, rotation is not an option as rotationcan result in correlated components, and this violates the definition of principal componentsanalysis.
MEANS presents the means for each variable in the output
MINEIGEN specifics the minimum eigenvalue for inclusion. The default value is 1 so Gwatkinet al. used a more stringent condition, which we also followed.
SCORE creates a new variable (or set of variables) that are estimates of the factor. In this casewe created only one variable, estimating the first principal component.
The proportion of the shared variation in the included variables that is captured by the firstprincipal component (the asset score) is shown in Table A1, for urban and rural areas.
Table A1. Variation captured by first principal component (asset score)
Urban RuralBenin .25 .15Ethiopia .14 .08Malawi .23 .13Mali .18 .11Rwanda .17 .11Zimbabwe .21 .15
Cambodia .23 .11Nepal .21 .17
Colombia .16 .17Haiti .12 .13Peru .16 .11
Table A2 on the next several pages shows which variables were used in the principalcomponents analysis in each country. A �---� indicates that either the variable was not includedon the questionnaire, or there was no variability in our subset. When there was no variability ineither urban or the rural areas, the variable was included only in one area. For example inEthiopia, there was a question for �television� on the questionnaire, but no one in rural areas (atleast in our sub-sample) had a television. This is indicated by �urban� in the table. If a variableis incorporated in both the urban and rural analysis, this is indicated on the table by �both�.

Annex 2. Construction of Asset Index for Each Country
95
Table A2. Variables included in principal components analysis, by country
Benin Ethiopia Malawi Mali Rwanda ZimbabweVariables used in most countries:
Has electricity V119 Both Both Both Both Both BothHas radio V120 Both Both Both Both Both BothHas television V121 Both Urban Both Both Both BothHas refrigerator V122 Both --- --- Both Both BothHas bicycle V123 Both Both Both Both Both BothHas motorcycle/scooter V124 Both Urban Both Both Both BothHas car/truck V125 Both Urban Both Both Both BothHas telephone V153 Both Urban --- Both Both Both
Piped water PIPED Both Both Both Both Both BothProtected well/spring COVWELL Both Both Both Both Both BothOpen well/spring OPENWELL Both Both Both Both Both RuralSurface water SURFACE Both Both Both Both Both RuralRain water RAINWAT Both Rural Rural --- Rural RuralTanker truck/bottled water TANK_BOT Rural --- Rural --- Both ---Other water OTHERWAT Urban Urban Rural
No toilet - use field/bush NOTOILET Both Both Both Both Both RuralFlush toilet FLUSHTOI Both Urban Both Both Both BothPit latrine PITTOILE Both Both Both Both Both BothOther toilet OTHERT Both --- --- --- --- Rural
Natural floor material -Earth, dung, sand, etc. NATURF Both Both Both Both Both Both
Rudimentary floor material � Woodplanks, palm, bamboo, etc. RUDIMF Rural Both Both Rural Both Urban
Finished floor � vinyl, asphalt, Cement,carpet, tile, polished wood FINISHF Both Both Both Both Both Both
Other floor OTHERFL Rural Both --- --- Both Rural
Use charcoal for cooking CHARCOAL Both Both Both Both Both RuralUse firewood for cooking FIREWOOD Both Both Both Both Both BothUse natural gas for cooking LPG Urban --- --- Urban --- UrbanUse gasoline for cooking GASOLINE Both --- --- --- --- ---Use electricity for cooking ELECTRIC --- Urban Both Rural Urban BothUse biogas for cooking BIOGAS --- Urban --- --- --- ---Use dung for cooking DUNG --- Both --- Both Rural RuralUse kerosene for cooking KEROSENE --- Both Both --- Urban BothUse coal for cooking COAL --- --- --- Urban Urban ---Use other fuel for cooking OTHERF Both --- --- Rural Both Rural

Annex 2. Construction of Asset Index for Each Country
96
Benin Ethiopia Malawi Mali Rwanda ZimbabweCountry-specific variables:
No. of HH members persleeping room NUMPERRM Both
Owns a boat S028D BothElectricity is source for light ELECLITE BothPetrol is source for light PETRLITE BothGas is source for light GASLITE Both
Earth, leaves for roof NATURRF BothWood planks, palm branches RUDIMRF BothFinished roof � tile or cement
FINISHRF Both
Other roof OTHERRF Urban
Wood and mud roof WOODRF BothThatch roof THATCHRF BothReed/bamboo roof REEDRF BothPlastic sheet roof PLASTRF BothMobile roofs of nomads MOBILRF BothFinished roof: corrugated iron,cement, concrete FINISHRF Both
Other roof OTHERRF Rural
Has electric mitad SH25E BothHas kerosene lamp SH25F BothHas a bed/table SH25G BothOwns house SH25AA BothOwns crop land SH24AB BothOwns cattle/camels SH25AC BothOwns horse/donkey/mule SH25AD Both
Has a paraffin lamp SH025B Both
Has horse-drawn cart SH28D BothHas plow SH28E BothHas horse SH28F BothHas wheel barrow SH28G BothHas donkey SH28H Both
Has modern oxcart SH22A Both

Annex 2. Construction of Asset Index for Each Country
97
Cambodia Nepal Colombia Haiti PeruVariables used in most countries:
Has electricity V119 Both Both Both Both BothHas radio V120 Both Both Both Both BothHas television V121 Both Both Both Both BothHas refrigerator V122 Both --- Both Both BothHas bicycle V123 Both Both --- Both BothHas motorcycle/scooter V124 Both --- --- Both BothHas car/truck V125 Both --- --- Both BothHas telephone V153 Both Both --- Both Both
Piped water PIPED Both Both Both Both BothProtected well/spring COVWELL Both Both --- Both ---Open well/spring OPENWELL Both Both Both Both BothSurface water SURFACE Both Both Rural Both BothRain water RAINWAT Both --- Both Both BothTanker truck/bottled water TANK_BOT Both --- Both Both BothOther waterOTHERWAT Both --- Both --- Both
No toilet - use field/bush NOTOILET Both Both Both Both BothFlush toilet FLUSHTOI Both Both See below Both BothPit latrine PITTOILE Both Both Both Both BothOther toilet OTHERT Both --- --- --- Both
Natural floor material -Earth, dung, sand, etc. NATURF Both Both Both Both Both
Rudimentary floor material � Woodplanks, palm, bamboo, etc. RUDIMF Both Both Both Both Both
Finished floor � vinyl, asphalt, Cement,carpet, tile, polished wood FINISHF Both Both Both Both Both
Other floor OTHERFL Rural Both Rural --- Both
Use charcoal for cooking CHARCOAL Both --- Both Both BothUse firewood for cooking FIREWOOD Both --- Both Both BothUse natural gas for cooking LPG Both Both Both Both BothUse gasoline for cooking GASOLINE --- --- Both --- ---Use electricity for cooking ELECTRIC Both --- Both --- UrbanUse biogas for cooking BIOGAS --- Both --- Urban ---Use dung for cooking DUNG --- --- --- --- BothUse kerosene for cooking KEROSENE Both Both Both Both BothUse coal for cooking COAL --- --- --- --- ---Use chulo for cooking CHULO --- Both --- --- ---Use wood/charcoal/dungTRADFWCD --- Both --- --- ---
Use other fuel for cooking OTHERF --- Both --- Rural Rural

Annex 2. Construction of Asset Index for Each Country
98
Cambodia Nepal Colombia Haiti PeruCountry-specific variables:
No. of HH members persleeping roomNUMPERRM
Both Both
Thatch/palm/bamboo/barkroof THATCH Both
Plastic sheet/tent roof PLASTIC BothGalvanized iron/aluminumroof GALVIRON Both
Tiles/cement/concrete roof CEMENTRF BothOther roof OTHERRF Rural
Has wardrobe S25B BothHas sewing machine/loom S25C BothHas boat with motor S28D BothHas boat without motor S28E BothHas oxcart/horsecart S28F Both
Owns land OWNSLAND BothOwns livestock OWNSLVST Both
Toilet to sewer FLUSHSEW BothToilet to pit FLUSHPIT BothToilet to creek/open space FLUSHCRK Both
Electricity from EDH SH24B BothOther source of electricity SH24C BothHas furnace SH25A BothHas bed SH25B BothHas horse, mule SH28D BothOwns home OWNHOME BothRents home RENTHOME BothStays for free FREEHOME Both
Wood roof WOODRF BothCorrugated iron/cement fiber CALAMRF BothBamboo/matting w/mud BAMBOORF BothPalm leaf/thatch PALMRF BothConcrete roof CEMENTRF BothTile roof TILESRF BothOther roof OTHERRF Both
Has computer SH25F BothHas other transport SH28D Both

Annex 3. Regression Results
99
ANNEX 3. REGRESSION RESULTS
This annex presents more complete regression results for the analyses summarized in Chapter 9.Tables A3-A13 show the coefficients, T-statistics, and p-values for each variable in theregressions (main effects model). P-values for joint tests of the significance of categoricalvariables, and also p-values for significant interactions are shown below each table. Our criteriain evaluating significance are p-values of < 0.05 for main effects, and p-values of < 0.20 forinteractions.
Table A3. Regression results for Benin, dependent variable HAZ
Independent variables Coefficient t p-valueChild age -0.22 -4.77 0.00Child age2 0.00 2.28 0.02Child sex -0.14 -1.76 0.08Maternal height 0.05 7.07 0.00Maternal BMI 0.01 0.88 0.38Mother�s education � primary vs. none -0.04 -0.37 0.71Mother�s education � secondary vs. none -0.14 -0.78 0.44Father�s education in years 0.01 0.38 0.70Antenatal care � 1-3 visits vs. none -0.10 -0.58 0.57Antenatal care � 4+ visits vs. none 0.05 0.36 0.72Continued breastfeeding (Yes) -0.35 -2.44 0.02Dietary diversity tercile � middle vs. low 0.02 0.24 0.81Dietary diversity tercile � high vs. low 0.12 1.34 0.18Urban or rural location (Rural) -0.11 -1.37 0.17Asset index tercile � middle vs. low 0.01 0.07 0.95Asset index tercile � high vs. low 0.02 0.17 0.87Number of children < 5 years old in household -0.10 -3.08 0.00Constant -5.86 -5.16 0.00Sample size 931F 20.07R2 0.23
Joint tests for categorical variables p-valueMother�s education level 0.74Number of antenatal visits 0.25Asset index terciles 0.99Dietary diversity terciles 0.39
Tests for interactions of dietary diversity with: p-valueUrban-rural location 0.13Asset index terciles 0.12Continued breastfeeding 0.19

Annex 3. Regression Results
100
Table A4. Regression results for Ethiopia, dependent variable HAZ
Independent variables Coefficient t p-valueChild age -0.24 -5.34 0.00Child age2 0.01 3.40 0.00Child sex -0.25 -3.76 0.00Maternal height 0.04 6.73 0.00Maternal BMI 0.02 0.85 0.40Mother�s education � primary vs. none 0.15 1.48 0.14Mother�s education � secondary vs. none 0.35 1.40 0.16Father�s education in years 0.00 0.31 0.76Antenatal care � 1-3 visits vs. none -0.06 -0.64 0.53Antenatal care � 4+ visits vs. none 0.08 0.64 0.52Continued breastfeeding (Yes) -0.56 -2.54 0.01Dietary diversity tercile � middle vs. low 0.19 2.33 0.02Dietary diversity tercile � high vs. low 0.31 3.78 0.00Urban or rural location (Rural) -0.15 -0.88 0.38Asset index tercile � middle vs. low 0.20 2.58 0.01Asset index tercile � high vs. low 0.17 1.72 0.09Number of children < 5 years old in household -0.12 -2.31 0.02Constant -5.00 -4.36 0.00
Sample size 2379F 19.81R2 0.19
Joint tests for categorical variables p-valueMother�s education level 0.17Number of antenatal visits 0.57Asset index terciles 0.03Dietary diversity terciles 0.00
No significant interactions with dietary diversity
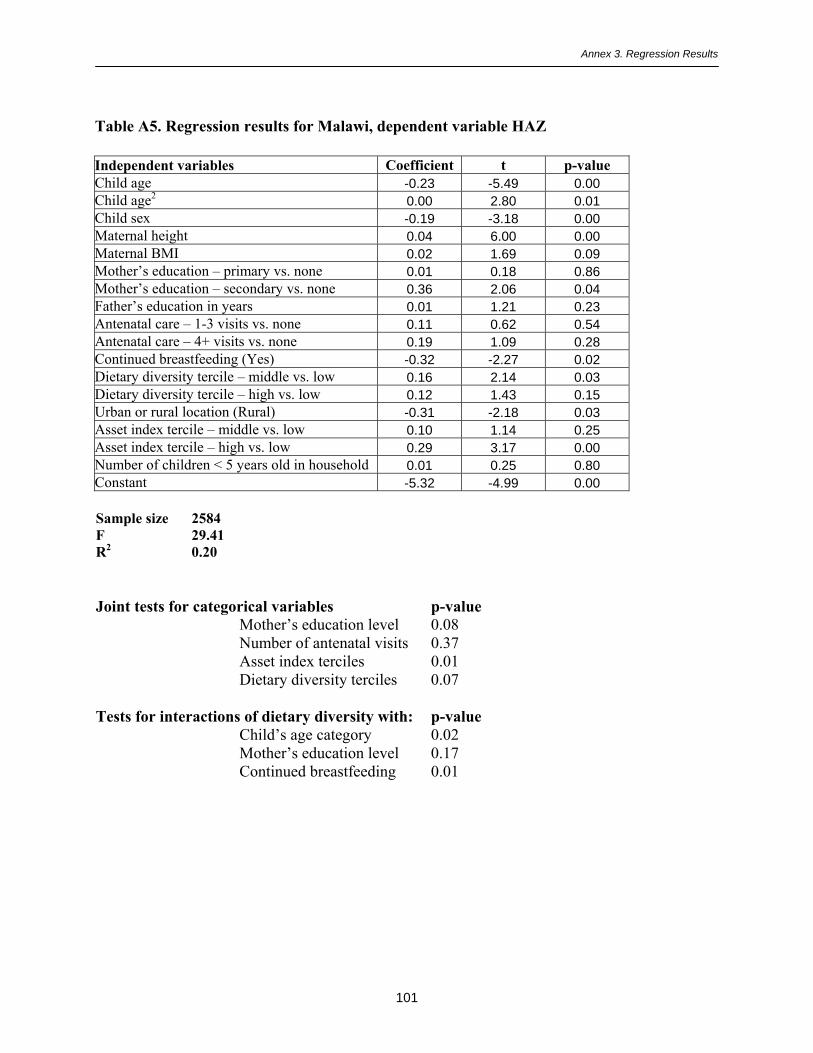
Annex 3. Regression Results
101
Table A5. Regression results for Malawi, dependent variable HAZ
Independent variables Coefficient t p-valueChild age -0.23 -5.49 0.00Child age2 0.00 2.80 0.01Child sex -0.19 -3.18 0.00Maternal height 0.04 6.00 0.00Maternal BMI 0.02 1.69 0.09Mother�s education � primary vs. none 0.01 0.18 0.86Mother�s education � secondary vs. none 0.36 2.06 0.04Father�s education in years 0.01 1.21 0.23Antenatal care � 1-3 visits vs. none 0.11 0.62 0.54Antenatal care � 4+ visits vs. none 0.19 1.09 0.28Continued breastfeeding (Yes) -0.32 -2.27 0.02Dietary diversity tercile � middle vs. low 0.16 2.14 0.03Dietary diversity tercile � high vs. low 0.12 1.43 0.15Urban or rural location (Rural) -0.31 -2.18 0.03Asset index tercile � middle vs. low 0.10 1.14 0.25Asset index tercile � high vs. low 0.29 3.17 0.00Number of children < 5 years old in household 0.01 0.25 0.80Constant -5.32 -4.99 0.00
Sample size 2584F 29.41R2 0.20
Joint tests for categorical variables p-valueMother�s education level 0.08Number of antenatal visits 0.37Asset index terciles 0.01Dietary diversity terciles 0.07
Tests for interactions of dietary diversity with: p-valueChild�s age category 0.02Mother�s education level 0.17Continued breastfeeding 0.01

Annex 3. Regression Results
102
Table A6. Regression results for Mali, dependent variable HAZ
Independent variables Coefficient t p-valueChild age -0.19 -2.90 0.00Child age2 0.00 0.96 0.34Child sex -0.08 -0.78 0.44Maternal height 0.03 3.48 0.00Maternal BMI 0.05 2.34 0.02Mother�s education � primary vs. none 0.11 0.78 0.43Mother�s education � secondary vs. none 0.22 1.00 0.32Father�s education in years 0.00 0.27 0.79Antenatal care � 1-3 visits vs. none 0.17 1.17 0.24Antenatal care � 4+ visits vs. none 0.03 0.20 0.84Continued breastfeeding (Yes) 0.03 0.15 0.88Dietary diversity tercile � middle vs. low 0.11 1.07 0.29Dietary diversity tercile � high vs. low 0.15 1.09 0.28Urban or rural location (Rural) -0.37 -2.72 0.01Asset index tercile � middle vs. low 0.02 0.21 0.84Asset index tercile � high vs. low 0.17 1.21 0.23Number of children < 5 years old in household -0.07 -1.20 0.23Constant -4.62 -3.26 0.00
Sample size 829F 14.19R2 0.26
Joint tests for categorical variables p-valueMother�s education level 0.49Number of antenatal visits 0.49Asset index terciles 0.44Dietary diversity terciles 0.42
Tests for interactions of dietary diversity with p-valueUrban-rural location 0.19Continued breastfeeding 0.19
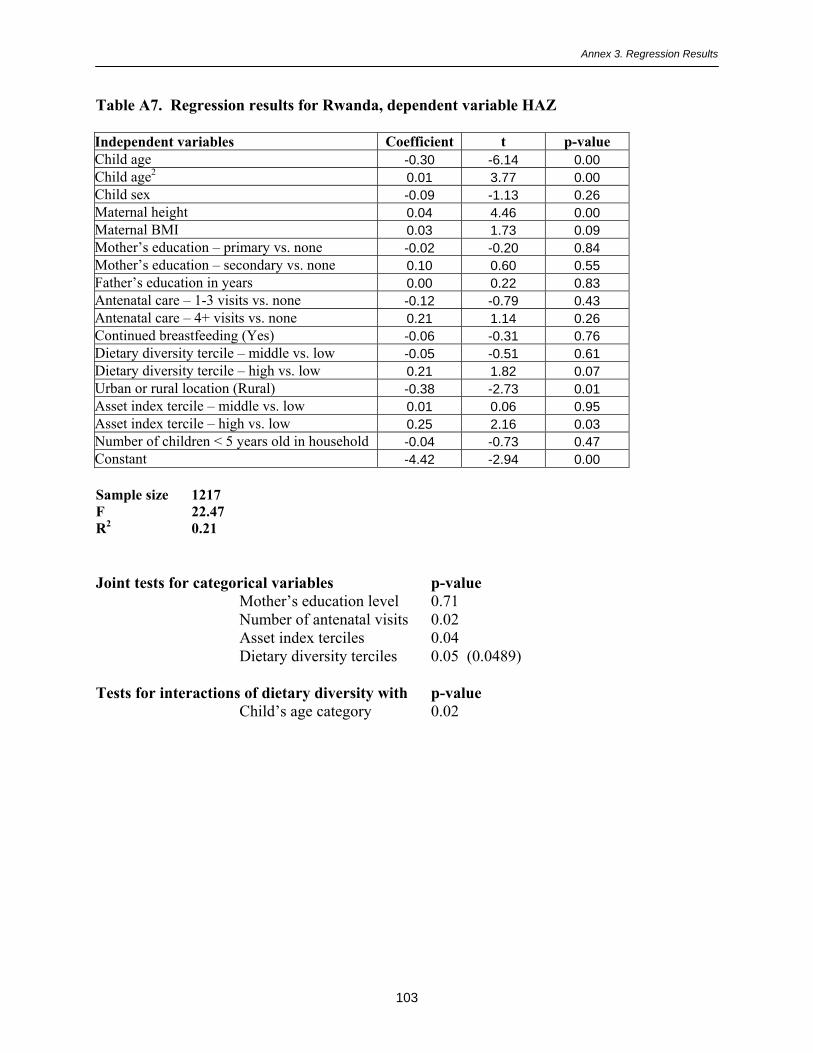
Annex 3. Regression Results
103
Table A7. Regression results for Rwanda, dependent variable HAZ
Independent variables Coefficient t p-valueChild age -0.30 -6.14 0.00Child age2 0.01 3.77 0.00Child sex -0.09 -1.13 0.26Maternal height 0.04 4.46 0.00Maternal BMI 0.03 1.73 0.09Mother�s education � primary vs. none -0.02 -0.20 0.84Mother�s education � secondary vs. none 0.10 0.60 0.55Father�s education in years 0.00 0.22 0.83Antenatal care � 1-3 visits vs. none -0.12 -0.79 0.43Antenatal care � 4+ visits vs. none 0.21 1.14 0.26Continued breastfeeding (Yes) -0.06 -0.31 0.76Dietary diversity tercile � middle vs. low -0.05 -0.51 0.61Dietary diversity tercile � high vs. low 0.21 1.82 0.07Urban or rural location (Rural) -0.38 -2.73 0.01Asset index tercile � middle vs. low 0.01 0.06 0.95Asset index tercile � high vs. low 0.25 2.16 0.03Number of children < 5 years old in household -0.04 -0.73 0.47Constant -4.42 -2.94 0.00
Sample size 1217F 22.47R2 0.21
Joint tests for categorical variables p-valueMother�s education level 0.71Number of antenatal visits 0.02Asset index terciles 0.04Dietary diversity terciles 0.05 (0.0489)
Tests for interactions of dietary diversity with p-valueChild�s age category 0.02

Annex 3. Regression Results
104
Table A8. Regression results for Zimbabwe, dependent variable HAZ
Independent variables Coefficient t p-valueChild age -0.18 -2.58 0.01Child age2 0.00 1.43 0.16Child sex -0.10 -0.65 0.52Maternal height 0.03 2.80 0.01Maternal BMI 0.04 2.15 0.03Mother�s education � primary vs. none -0.08 -0.26 0.80Mother�s education � secondary vs. none -0.41 -1.27 0.21Father�s education in years 0.05 2.34 0.02Antenatal care � 1-3 visits vs. none 0.36 1.06 0.29Antenatal care � 4+ visits vs. none 0.44 1.47 0.14Continued breastfeeding (Yes) 0.03 0.10 0.92Dietary diversity tercile � middle vs. low 0.51 3.15 0.00Dietary diversity tercile � high vs. low 0.70 4.17 0.00Urban or rural location (Rural) 0.18 0.84 0.40Asset index tercile � middle vs. low 0.01 0.07 0.94Asset index tercile � high vs. low -0.03 -0.16 0.87Number of children < 5 years old in household -0.10 -1.14 0.25Constant -6.18 -3.13 0.00
Sample size 560F 5.98R2 0.14
Joint tests for categorical variables p-valueMother�s education level 0.17Number of antenatal visits 0.31Asset index terciles 0.97Dietary diversity terciles 0.00
Tests for interactions of dietary diversity with p-valueUrban-rural location 0.05Continued breastfeeding 0.18

Annex 3. Regression Results
105
Table A9. Regression results for Cambodia, dependent variable HAZ
Independent variables Coefficient t p-valueChild age -0.08 -1.32 0.19Child age2 0.00 -0.05 0.96Child sex -0.09 -0.88 0.38Maternal height 0.05 4.02 0.00Maternal BMI 0.02 0.73 0.47Mother�s education � primary vs. none 0.16 1.33 0.18Mother�s education � secondary vs. none 0.42 2.10 0.04Father�s education in years -0.01 -0.62 0.53Antenatal care � 1-3 visits vs. none -0.10 -0.84 0.40Antenatal care � 4+ visits vs. none 0.18 0.91 0.37Continued breastfeeding (Yes) -0.29 -1.55 0.12Dietary diversity tercile � middle vs. low 0.16 1.34 0.18Dietary diversity tercile � high vs. low 0.46 3.08 0.00Urban or rural location (Rural) 0.36 2.03 0.04Asset index tercile � middle vs. low 0.23 1.80 0.07Asset index tercile � high vs. low 0.06 0.49 0.63Number of children < 5 years old in household -0.22 -2.81 0.01Constant -8.33 -4.08 0.00
Sample size 812F 6.30R2 0.16
Joint tests for categorical variables p-valueMother�s education level 0.10Number of antenatal visits 0.30Asset index terciles 0.19Dietary diversity terciles 0.01
Tests for interactions of dietary diversity with p-valueAsset index terciles 0.11Continued breastfeeding 0.03

Annex 3. Regression Results
106
Table A10. Regression results for Nepal, dependent variable HAZ
Independent variables Coefficient t p-valueChild age -0.21 -6.05 0.00Child age2 0.00 3.85 0.00Child sex -0.01 -0.18 0.86Maternal height 0.05 8.22 0.00Maternal BMI 0.04 3.02 0.00Mother�s education � primary vs. none 0.12 1.54 0.13Mother�s education � secondary vs. none 0.17 1.72 0.09Father�s education in years 0.03 3.45 0.00Antenatal care � 1-3 visits vs. none 0.06 0.90 0.37Antenatal care � 4+ visits vs. none 0.14 1.65 0.10Continued breastfeeding (Yes) 0.06 0.32 0.75Dietary diversity tercile � middle vs. low 0.09 1.22 0.22Dietary diversity tercile � high vs. low 0.25 2.90 0.00Urban or rural location (Rural) -0.29 -3.11 0.00Asset index tercile � middle vs. low 0.18 2.54 0.01Asset index tercile � high vs. low 0.25 3.25 0.00Number of children < 5 years old in household -0.05 -1.36 0.17Constant -7.46 -8.02 0.00
Sample size 1607F 23.88R2 0.24
Joint tests for categorical variables p-valueMother�s education level 0.11Number of antenatal visits 0.26Asset index terciles 0.00Dietary diversity terciles 0.01
Tests for interactions of dietary diversity with p-valueUrban-rural location 0.17Continued breastfeeding 0.01

Annex 3. Regression Results
107
Table A11. Regression results for Colombia, dependent variable HAZ
Independent variables Coefficient t p-valueChild age -0.12 -3.50 0.00Child age2 0.00 2.02 0.04Child sex -0.19 -3.26 0.00Maternal height 0.06 11.29 0.00Maternal BMI 0.02 3.60 0.00Mother�s education � primary vs. none -0.08 -0.49 0.63Mother�s education � secondary vs. none -0.03 -0.18 0.86Father�s education in years 0.01 0.83 0.41Antenatal care � 1-3 visits vs. none -0.01 -0.06 0.95Antenatal care � 4+ visits vs. none 0.21 1.89 0.06Continued breastfeeding (Yes) -0.11 -1.63 0.10Dietary diversity tercile � middle vs. low 0.00 -0.05 0.96Dietary diversity tercile � high vs. low 0.12 1.51 0.13Urban or rural location (Rural) -0.05 -0.76 0.45Asset index tercile � middle vs. low -0.10 -1.35 0.18Asset index tercile � high vs. low -0.16 -2.28 0.02Number of children < 5 years old in household -0.17 -3.99 0.00Constant -8.83 -10.19 0.00
Sample size 1050F 21.66R2 0.26
Joint tests for categorical variables p-valueMother�s education level 0.72Number of antenatal visits 0.06Asset index terciles 0.07Dietary diversity terciles 0.19
No significant interactions with dietary diversity

Annex 3. Regression Results
108
Table A12. Regression results for Haiti, dependent variable HAZ
Independent variables Coefficient t p-valueChild age -0.09 -1.89 0.06Child age2 0.00 0.53 0.59Child sex -0.20 -2.51 0.01Maternal height 0.04 6.51 0.00Maternal BMI 0.05 3.91 0.00Mother�s education � primary vs. none -0.04 -0.34 0.73Mother�s education � secondary vs. none 0.00 0.06 0.95Father�s education in years 0.02 1.48 0.14Antenatal care � 1-3 visits vs. none 0.25 1.95 0.05Antenatal care � 4+ visits vs. none 0.22 2.30 0.02Continued breastfeeding (Yes) -0.00 -0.00 1.00Dietary diversity tercile � middle vs. low 0.11 0.72 0.47Dietary diversity tercile � high vs. low 0.07 0.68 0.50Urban or rural location (Rural) -0.08 -0.87 0.39Asset index tercile � middle vs. low 0.20 1.97 0.05Asset index tercile � high vs. low 0.23 2.18 0.03Number of children < 5 years old in household -0.16 -3.13 0.00Constant -7.76 -6.70 0.00
Sample size 1390F 25.81R2 0.22
Joint tests for categorical variables p-valueMother�s education level 0.93Number of antenatal visits 0.04Asset index terciles 0.06Dietary diversity terciles 0.74
Tests for interactions of dietary diversity with p-valueChild�s age category 0.02Urban-rural location 0.10

Annex 3. Regression Results
109
Table A13. Regression results for Peru, dependent variable HAZ
Independent variables Coefficient t p-valueChild age -0.17 -5.50 0.00Child age2 0.00 3.56 0.00Child sex -0.03 -0.68 0.50Maternal height 0.05 10.97 0.00Maternal BMI 0.01 1.39 0.17Mother�s education � primary vs. none 0.12 1.40 0.16Mother�s education � secondary vs. none 0.22 1.99 0.05Father�s education in years 0.01 1.20 0.23Antenatal care � 1-3 visits vs. none 0.06 0.71 0.48Antenatal care � 4+ visits vs. none 0.03 0.46 0.64Continued breastfeeding (Yes) -0.02 -0.34 0.74Dietary diversity tercile � middle vs. low -0.04 -0.55 0.58Dietary diversity tercile � high vs. low 0.05 0.76 0.45Urban or rural location (Rural) -0.55 -9.01 0.00Asset index tercile � middle vs. low 0.13 1.94 0.05Asset index tercile � high vs. low 0.31 4.33 0.00Number of children < 5 years old in household -0.16 -4.74 0.00Constant -7.30 -9.38 0.00
Sample size 2836F 36.76R2 0.30
Joint tests for categorical variables p-valueMother�s education level 0.13Number of antenatal visits 0.78Asset index terciles 0.00Dietary diversity terciles 0.38
Tests for interactions of dietary diversity with p-valueChild�s age category 0.00Asset index terciles 0.11

Annex 4. Tables Comparing the 24-hour and 7-day Food Group Recalls
110
ANNEX 4. TABLES COMPARING THE 24-HOUR AND 7-DAY FOOD GROUPRECALLS
This annex presents more complete tables for the results presented in Chapter 8. Tables A14-A23 show a four-way comparison for each food group within each country.
Table A14. Benin: Comparing 24-hour and 7-day recalls
Percent of children aged 6-23 months who ate: Last 24 hrs Last 7 days3 or moredays in the
last 7
4 or moredays in the
last 7Food made from grain, roots or tubers 72 82 80 77Food made from legumes 19 38 21 15Dairy 17 26 19 17Meat, poultry, fish, shellfish, eggs 49 63 53 47Vitamin A rich fruits & vegs 38 60 44 34Orange/red vitamin A-rich fruits & vegs 18 38 22 16Other fruits, vegetables or juice 35 52 42 34Foods made with fats or oil 57 64 60 56
Table A15. Ethiopia: Comparing 24-hour and 7-day recalls
Percent of children aged 6-23 months who ate: Last 24 hrs Last 7 days3 or moredays in the
last 7
4 or moredays in the
last 7Food made from grain, roots or tubers 77 80 77 73Food made from legumes 40 51 42 35Dairy 33 40 35 32Meat, poultry, fish, shellfish, eggs 12 24 11 7Vitamin A rich fruits & vegs 10 17 9 6Orange/red vitamin A-rich fruits & vegsOther fruits, vegetables or juice 12 24 9 5Foods made with fats or oil 35 43 34 28
Table A16. Malawi: Comparing 24-hour and 7-day recalls
Percent of children aged 6-23 months who ate: Last 24 hrs Last 7 days3 or moredays in the
last 7
4 or moredays in the
last 7Food made from grain, roots or tubers 96 98 96 95Food made from legumes 28 48 19 9Dairy 8 12 8 6Meat, poultry, fish, shellfish, eggs 37 62 29 15Vitamin A rich fruits & vegs 63 77 58 48Orange/red vitamin A-rich fruits & vegs 23 38 17 11Other fruits, vegetables or juice 32 51 26 17Foods made with fats or oil 8 12 7 5

Annex 4. Tables Comparing the 24-hour and 7-day Food Group Recalls
111
Table A17. Mali: Comparing 24-hour and 7-day recalls
Percent of children aged 6-23 months who ate: Last 24 hrs Last 7 days3 or moredays in the
last 7
4 or moredays in the
last 7Food made from grain, roots or tubers 55 67 63 61Food made from legumes 8 16 8 5Dairy 16 27 19 16Meat, poultry, fish, shellfish, eggs 23 38 26 20Vitamin A rich fruits & vegs 21 33 23 19Orange/red vitamin A-rich fruits & vegs 17 30 19 15Other fruits, vegetables or juice 14 26 15 11Foods made with fats or oil 18 29 19 14
Table A18. Rwanda: Comparing 24-hour and 7-day recalls
Percent of children aged 6-23 months who ate: Last 24 hrs Last 7 days3 or moredays in the
last 7
4 or moredays in the
last 7Food made from grain, roots or tubers 83 92 84 78Food made from legumes 58 69 57 49Dairy 17 14 12 13Meat, poultry, fish, shellfish, eggs 13 25 11 7Vitamin A rich fruits & vegs 56 73 58 47Orange/red vitamin A-rich fruits & vegs 39 55 40 29Other fruits, vegetables or juice 31 53 30 18Foods made with fats or oil 35 48 34 25
Table A19. Zimbabwe: Comparing 24-hour and 7-day recalls
Percent of children aged 6-23 months who ate: Last 24 hrs Last 7 days3 or moredays in the
last 7
4 or moredays in the
last 7Food made from grain, roots or tubers 95 97 95 94Food made from legumes 44 57 42 34Dairy 21 32 20 16Meat, poultry, fish, shellfish, eggs 43 65 38 28Vitamin A rich fruits & vegs 63 73 66 60Orange/red vitamin A-rich fruits & vegs 13 27 11 8Other fruits, vegetables or juice 47 63 46 41Foods made with fats or oil

Annex 4. Tables Comparing the 24-hour and 7-day Food Group Recalls
112
Table A20. Cambodia: Comparing 24-hour and 7-day recalls
Percent of children aged 6-23 months who ate: Last 24 hrs Last 7 days3 or moredays in the
last 7
4 or moredays in the
last 7Food made from grain, roots or tubers 89 91 88 86Food made from legumes 17 25 8 3Dairy 4 5 4 3Meat, poultry, fish, shellfish, eggs 70 74 62 53Vitamin A rich fruits & vegs 55 66 47 35Orange/red vitamin A-rich fruits & vegs 41 53 31 20Other fruits, vegetables or juice 55 67 43 28Foods made with fats or oil 36 46 24 13
Table A21. Nepal: Comparing 24-hour and 7-day recalls
Percent of children aged 6-23 months who ate: Last 24 hrs Last 7 days3 or moredays in the
last 7
4 or moredays in the
last 7Food made from grain, roots or tubers 89 91 90 90Food made from legumes 42 59 42 32Dairy 40 46 41 38Meat, poultry, fish, shellfish, eggs 16 38 9 5Vitamin A rich fruits & vegs 30 50 30 20Orange/red vitamin A-rich fruits & vegs 7 13 5 2Other fruits, vegetables or juice 19 30 17 10Foods made with fats or oil 7 53 46 43
Table A22. Colombia: Comparing 24-hour and 7-day recalls
Percent of children aged 6-23 months who ate: Last 24 hrs Last 7 days3 or moredays in the
last 7
4 or moredays in the
last 7Food made from grain, roots or tubers 92 96 92 89Food made from legumes 33 77 31 15Dairy 82 90 84 79Meat, poultry, fish, shellfish, eggs 80 91 79 68Vitamin A rich fruits & vegs 66 84 69 61Orange/red vitamin A-rich fruits & vegs 66 84 69 61Other fruits, vegetables or juice 73 91 80 72Foods made with fats or oil 46 62 44 33

Annex 4. Tables Comparing the 24-hour and 7-day Food Group Recalls
113
Table A23. Peru: Comparing 24-hour and 7-day recalls
Percent of children aged 6-23 months who ate: Last 24 hrs Last 7 days3 or moredays in the
last 7
4 or moredays in the
last 7Food made from grain, roots or tubers 94 96 94 93Food made from legumes 34 65 33 18Dairy 57 70 59 53Meat, poultry, fish, shellfish, eggs 70 85 69 55Vitamin A rich fruits & vegs 77 86 79 72Orange/red vitamin A-rich fruits & vegs 73 84 74 66Other fruits, vegetables or juice 50 71 51 38Foods made with fats or oil 67 75 68 62
Tables A24-A43, below, compare rankings based on food group diversity yesterday as comparedto food group diversity in the last seven days. There are two sets of tables; the first set uses thecountry-specific diversity terciles, and compares rankings for yesterday to rankings for last week.The second set uses the fixed cut-offs for diversity described in Chapter 6 (0-2, 3-4, and 5-6 foodgroups).
Sample-specific terciles
Diversity in the last week is described both by the number of food groups eaten at least threedays in the last seven and by the number of food groups eaten in the last week. We know that ineach country more food groups were eaten over seven days than yesterday, but in these rankingsthe terciles are defined separately for each variable, and cut-offs for low, middle and high groupsare not necessarily the same for yesterday as for last week. These tables therefore address thequestion: �If a child scored high for diversity yesterday, relative to other children, did they alsoscore high for the last week relative to other children in the sample?� The age-specific diversityterciles are used in this analysis.
The first Table (Table A34), for Benin, was also presented in Chapter 8; it is included here forcompleteness. Beneath each table, the proportion of children classified identically (sum ofdiagonal) is shown, as well as the proportion classified into opposite extremes (for example,those classified as having low diversity yesterday and high diversity over the last week). Wealso assess how well yesterday can �predict� the last week by giving the row percent for low andhigh diversity. For example in Benin, among the children who were classified as having lowdiversity yesterday, 89% also had low diversity for foods eaten three or more days in the lastseven days.

Annex 4. Tables Comparing the 24-hour and 7-day Food Group Recalls
114
Table A24. Benin: Comparing classification into diversity terciles based on the 24-hourfood group recall compared to the 7-day food group recall
Number of food groups eaten 3 ormore days in the last 7 days
Number of food groups eaten inthe last 7 days
Low Middle High Low Middle HighPercent of children (% of total) Percent of children (% of total)
Low 25 6 3 24 6 3Middle 5 21 9 6 20 9
Numberof foodgroupsyesterday High 0 4 28 0 7 25
Total percent classified identically: 74% 69%Total percent in opposite extremes: 3% 3%Percent of low yesterday low last week: 74% 71%Percent of high yesterday high last week: 88% 79%
Table A25. Ethiopia: Comparing classification into diversity terciles based on the 24-hourfood group recall compared to the 7-day food group recall
Number of food groups eaten 3 ormore days in the last 7 days
Number of food groups eaten inthe last 7 days
Low Middle High Low Middle HighPercent of children (% of total) Percent of children (% of total)
Low 26 3 1 23 4 2Middle 12 31 5 11 27 10
Numberof foodgroupsyesterday High 1 4 19 0 4 20
Total percent classified identically: 76% 70%Total percent in opposite extremes: 2% 2%Percent of low yesterday low last week: 90% 80%Percent of high yesterday high last week: 81% 84%
Table A26. Malawi: Comparing classification into diversity terciles based on the 24-hourfood group recall compared to the 7-day food group recall
Number of food groups eaten 3 ormore days in the last 7 days
Number of food groups eaten inthe last 7 days
Low Middle High Low Middle HighPercent of children (% of total) Percent of children (% of total)
Low 25 10 2 26 8 3Middle 9 16 9 9 15 11
Numberof foodgroupsyesterday High 3 7 19 0 7 22
Total percent classified identically: 60% 63%Total percent in opposite extremes: 5% 3%Percent of low yesterday low last week: 68% 72%Percent of high yesterday high last week: 64% 76%

Annex 4. Tables Comparing the 24-hour and 7-day Food Group Recalls
115
Table A27. Mali: Comparing classification into diversity terciles based on the 24-hour foodgroup recall compared to the 7-day food group recall
Number of food groups eaten 3 ormore days in the last 7 days
Number of food groups eaten inthe last 7 days
Low Middle High Low Middle HighPercent of children (% of total) Percent of children (% of total)
Low 34 5 3 31 8 3Middle 11 11 5 7 14 5
Numberof foodgroupsyesterday High 1 5 25 0 8 24
Total percent classified identically: 70% 69%Total percent in opposite extremes: 4% 3%Percent of low yesterday low last week: 82% 75%Percent of high yesterday high last week: 79% 75%
Table A28. Rwanda: Comparing classification into diversity terciles based on the 24-hourfood group recall compared to the 7-day food group recall
Number of food groups eaten 3 ormore days in the last 7 days
Number of food groups eaten inthe last 7 days
Low Middle High Low Middle HighPercent of children (% of total) Percent of children (% of total)
Low 23 6 1 22 5 2Middle 7 25 7 13 17 10
Numberof foodgroupsyesterday High 2 7 23 0 8 24
Total percent classified identically: 71% 63%Total percent in opposite extremes: 3% 2%Percent of low yesterday low last week: 76% 75%Percent of high yesterday high last week: 73% 76%
Table A29. Zimbabwe: Comparing classification into diversity terciles based on the 24-hour food group recall compared to the 7-day food group recall
Number of food groups eaten 3 ormore days in the last 7 days
Number of food groups eaten inthe last 7 days
Low Middle High Low Middle HighPercent of children (% of total) Percent of children (% of total)
Low 25 6 1 25 6 0Middle 8 23 11 10 19 13
Numberof foodgroupsyesterday High 1 4 22 0 6 22Total percent classified identically: 70% 66%Total percent in opposite extremes: 2% 0%Percent of low yesterday low last week: 80% 81%Percent of high yesterday high last week: 82% 79%
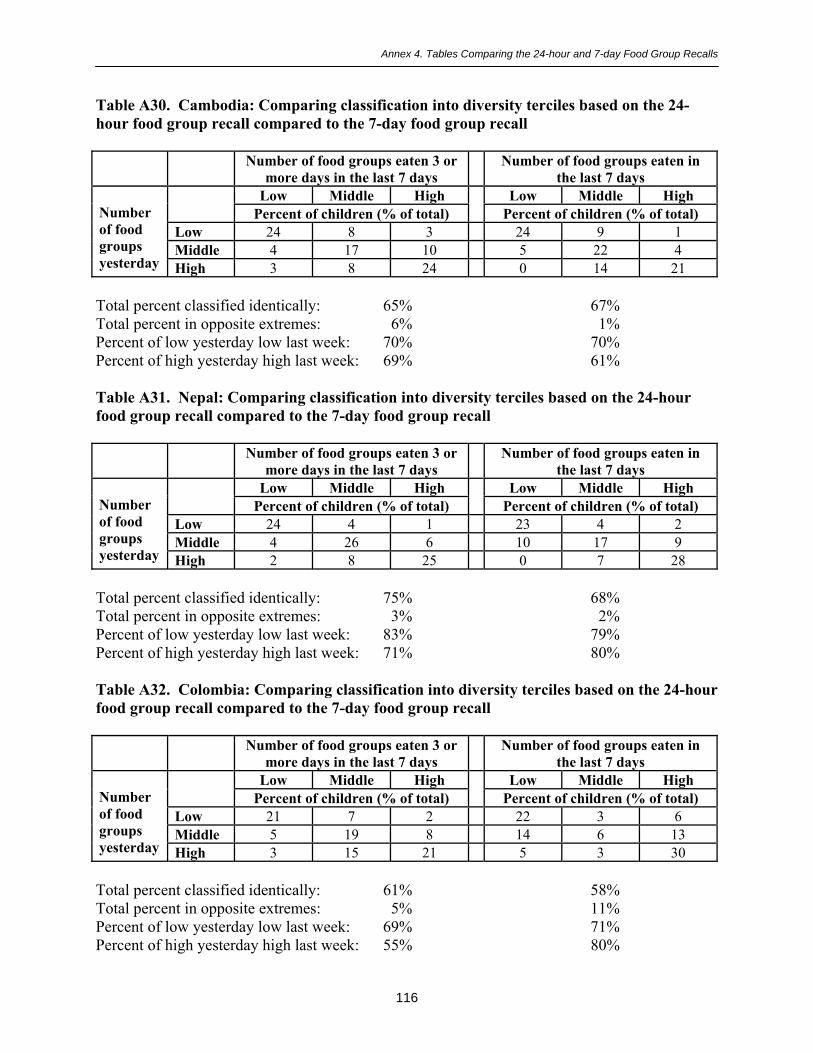
Annex 4. Tables Comparing the 24-hour and 7-day Food Group Recalls
116
Table A30. Cambodia: Comparing classification into diversity terciles based on the 24-hour food group recall compared to the 7-day food group recall
Number of food groups eaten 3 ormore days in the last 7 days
Number of food groups eaten inthe last 7 days
Low Middle High Low Middle HighPercent of children (% of total) Percent of children (% of total)
Low 24 8 3 24 9 1Middle 4 17 10 5 22 4
Numberof foodgroupsyesterday High 3 8 24 0 14 21
Total percent classified identically: 65% 67%Total percent in opposite extremes: 6% 1%Percent of low yesterday low last week: 70% 70%Percent of high yesterday high last week: 69% 61%
Table A31. Nepal: Comparing classification into diversity terciles based on the 24-hourfood group recall compared to the 7-day food group recall
Number of food groups eaten 3 ormore days in the last 7 days
Number of food groups eaten inthe last 7 days
Low Middle High Low Middle HighPercent of children (% of total) Percent of children (% of total)
Low 24 4 1 23 4 2Middle 4 26 6 10 17 9
Numberof foodgroupsyesterday High 2 8 25 0 7 28
Total percent classified identically: 75% 68%Total percent in opposite extremes: 3% 2%Percent of low yesterday low last week: 83% 79%Percent of high yesterday high last week: 71% 80%
Table A32. Colombia: Comparing classification into diversity terciles based on the 24-hourfood group recall compared to the 7-day food group recall
Number of food groups eaten 3 ormore days in the last 7 days
Number of food groups eaten inthe last 7 days
Low Middle High Low Middle HighPercent of children (% of total) Percent of children (% of total)
Low 21 7 2 22 3 6Middle 5 19 8 14 6 13
Numberof foodgroupsyesterday High 3 15 21 5 3 30
Total percent classified identically: 61% 58%Total percent in opposite extremes: 5% 11%Percent of low yesterday low last week: 69% 71%Percent of high yesterday high last week: 55% 80%

Annex 4. Tables Comparing the 24-hour and 7-day Food Group Recalls
117
Table A33. Peru: Comparing classification into diversity terciles based on the 24-hour foodgroup recall compared to the 7-day food group recall
Number of food groups eaten 3 ormore days in the last 7 days
Number of food groups eaten inthe last 7 days
Low Middle High Low Middle HighPercent of children (% of total) Percent of children (% of total)
Low 25 6 2 23 6 3Middle 5 18 9 6 17 9
Numberof foodgroupsyesterday High 2 7 28 0 13 23
Total percent classified identically: 71% 63%Total percent in opposite extremes: 4% 3%Percent of low yesterday low last week: 76% 70%Percent of high yesterday high last week: 77% 64%
Fixed cut-offs for diversity
Finally, Tables A34-A43 present similar comparisons between yesterday and three or more daysusing fixed cut-offs for diversity. These tables address a slightly different question; that is: �If achild ate 0-2 food groups yesterday (or 3-4, or 5-7) how likely are they to be in the same groupover the past week?� In these tables we present results for food groups eaten three or more daysin the last seven.
In general, the tables show that the �prediction� of last week based on yesterday works bestwhen there are a substantial number of children in a given group yesterday. Unlike the tablesabove, where roughly one-third of the children are in each diversity group, in the tables using thefixed cut-offs some cells represent few children. For most countries, this means that lowdiversity yesterday (0-2 groups) predicts low diversity three or more days in the last sevenreasonably well. The range is from 81%-93%, except in Colombia (74%) and Peru (77%); fewchildren are in the low diversity group in these last two countries. In contrast, high diversity is�predicted� better in Colombia (87%) and Peru (87%) where many children are in the highdiversity group (5-7 food groups). In other countries, 45%-82% of the children in the highdiversity group yesterday are also in that group for last week.

Annex 4. Tables Comparing the 24-hour and 7-day Food Group Recalls
118
Table A34. Benin: Comparing classification using fixed cut-offs, 24-hour food group recallcompared to the 7-day food group recall
Number of food groups eaten 3 or moredays in the last 7 days
0-2 3-4 5-7Percent of children (% of total)
0-2 35 6 23-4 3 20 10
Number of foodgroups yesterday
5-7 0 4 20
Total percent classified identically: 75%Total percent in opposite extremes: 2%Percent of low yesterday low last week: 82%Percent of high yesterday high last week: 82%
Table A35. Ethiopia: Comparing classification using fixed cut-offs, 24-hour food grouprecall compared to the 7-day food group recall
Number of food groups eaten 3 or moredays in the last 7 days
0-2 3-4 5-7Percent of children (% of total)
0-2 56 5 03-4 5 25 2
Number of foodgroups yesterday
5-7 0 3 4
Total percent classified identically: 85%Total percent in opposite extremes: 0%Percent of low yesterday low last week: 92%Percent of high yesterday high last week: 58%
Table A36. Malawi: Comparing classification using fixed cut-offs, 24-hour food grouprecall compared to the 7-day food group recall
Number of food groups eaten 3 or moredays in the last 7 days
0-2 3-4 5-7Percent of children (% of total)
0-2 40 6 03-4 16 27 2
Number of foodgroups yesterday
5-7 1 4 4
Total percent classified identically: 71%Total percent in opposite extremes: 1%Percent of low yesterday low last week: 87%Percent of high yesterday high last week: 45%

Annex 4. Tables Comparing the 24-hour and 7-day Food Group Recalls
119
Table A37. Mali: Comparing classification using fixed cut-offs, 24-hour food group recallcompared to the 7-day food group recall
Number of food groups eaten 3 or moredays in the last 7 days
0-2 3-4 5-7Percent of children (% of total)
0-2 67 8 13-4 3 11 2
Number of foodgroups yesterday
5-7 1 2 5
Total percent classified identically: 83%Total percent in opposite extremes: 2%Percent of low yesterday low last week: 88%Percent of high yesterday high last week: 63%
Table A38. Rwanda: Comparing classification using fixed cut-offs, 24-hour food grouprecall compared to the 7-day food group recall
Number of food groups eaten 3 or moredays in the last 7 days
0-2 3-4 5-7Percent of children (% of total)
0-2 33 7 13-4 8 31 5
Number of foodgroups yesterday
5-7 0 5 10
Total percent classified identically: 74%Total percent in opposite extremes: 1%Percent of low yesterday low last week: 81%Percent of high yesterday high last week: 66%
Table A39. Zimbabwe: Comparing classification using fixed cut-offs, 24-hour food grouprecall compared to the 7-day food group recall
Number of food groups eaten 3 or moredays in the last 7 days
0-2 3-4 5-7Percent of children (% of total)
0-2 30 6 03-4 8 32 5
Number of foodgroups yesterday
5-6 0 6 13
Total percent classified identically: 75%Total percent in opposite extremes: 0%Percent of low yesterday low last week: 83%Percent of high yesterday high last week: 68%

Annex 4. Tables Comparing the 24-hour and 7-day Food Group Recalls
120
Table A40. Cambodia: Comparing classification using fixed cut-offs, 24-hour food grouprecall compared to the 7-day food group recall
Number of food groups eaten 3 or moredays in the last 7 days
0-2 3-4 5-7Percent of children (% of total)
0-2 30 2 03-4 11 29 2
Number of foodgroups yesterday
5-7 3 10 13
Total percent classified identically: 72%Total percent in opposite extremes: 3%Percent of low yesterday low last week: 93%Percent of high yesterday high last week: 51%
Table A41. Nepal: Comparing classification using fixed cut-offs, 24-hour food group recallcompared to the 7-day food group recall
Number of food groups eaten 3 or moredays in the last 7 days
0-2 3-4 5-7Percent of children (% of total)
0-2 36 5 03-4 7 35 3
Number of foodgroups yesterday
5-7 1 5 8
Total percent classified identically: 79%Total percent in opposite extremes: 1%Percent of low yesterday low last week: 86%Percent of high yesterday high last week: 59%
Table A42. Colombia: Comparing classification using fixed cut-offs, 24-hour food grouprecall compared to the 7-day food group recall
Number of food groups eaten 3 or moredays in the last 7 days
0-2 3-4 5-7Percent of children (% of total)
0-2 8 2 13-4 3 15 9
Number of foodgroups yesterday
5-7 0 8 55
Total percent classified identically: 78%Total percent in opposite extremes: 1%Percent of low yesterday low last week: 74%Percent of high yesterday high last week: 87%

Annex 4. Tables Comparing the 24-hour and 7-day Food Group Recalls
121
Table A43. Peru: Comparing classification using fixed cut-offs, 24-hour food group recallcompared to the 7-day food group recall
Number of food groups eaten 3 or moredays in the last 7 days
0-2 3-4 5-7Percent of children (% of total)
0-2 9 3 03-4 3 20 8
Number of foodgroups yesterday
5-7 0 7 49
Total percent classified identically: 78%Total percent in opposite extremes: 0%Percent of low yesterday low last week: 77%Percent of high yesterday high last week: 87%
Copyright © 2022 FDOKUMEN