Dietary and nutritional biomarkers of lens degeneration, oxidative stress and micronutrient...
9
ORIGINAL ARTICLE Dietary and nutritional biomarkers of lens degeneration, oxidative stress and micronutrient inadequacies in Indian cataract patients * Kirtan V. Tarwadi, Shashi A. Chiplonkar, Vaishali Agte* Biometry and Nutrition, Agharkar Research Institute, G.G. Agarkar Road, Pune 411004, India Received 30 October 2006; accepted 25 January 2008 KEYWORDS Cataract; Antioxidants; Micronutrients; Oxidative stress; Polyphenols; Phytic acid Summary Background & aims: Habitual food and nutrient intakes of 140 Indian cataract patients and 100 age- and sex-matched controls (50e75 years), from high income group and low income groups, were assessed. Methods: Food intake was recorded by food frequency questionnaire and data were examined for linkages with blood/lens parameters of oxidative stress through a casee control study. Results: Intake of animal foods and fried snacks was significantly higher while vegetables, green leafy vegetables, fruit, tea and micronutrient intakes were lower in patients than in controls (p < 0.001). Lens oxidative stress and opacity showed a significant negative association with fruit intake (p < 0.05). Multiple regression analysis indicated association of intakes of iron, beta-carotene, ascorbic acid, tannic acid and inositol pentaphosphate with plasma oxidative stress (p < 0.01) and association of intakes of iron, ascorbic acid and inositol triphosphate with lens oxidative stress (p < 0.01). Weighted least square regres- sion for lens opacity revealed that intakes of ascorbic acid, folic acid and inositol pentaphosphate explained 59.7% of the total variation (p < 0.01). Non-standard abbreviations: HIG, high income group; LIG, low income group; ICMR, Indian Council of Medical Research, FFQ, food fre- quency questionnaire; RDA, recommended daily allowance; GLV, green leafy vegetables; IP1eIP6, inositol phosphate fractions; TBARS, thi- obarbituric acid reactive substances; MDA, malondialdehyde adducts; TG, triglycerides; TC, total cholesterol; HDL, high density lipoprotein cholesterol; EGRAC, erythrocyte glutathione reductase activity coefficient; ETKAC, erythrocyte transketolase activity coefficient; SOD, super oxide dismutase; MZn, erythrocyte membrane zinc; S:T, soluble to total protein ratio. * This paper was presented at the IX Asian Congress of Nutrition held at New Delhi, India, February 23e27, 2003. * Corresponding author. Tel.: þ91 (0)20 2565 4357; fax: þ91 (0)20 2565 1542. E-mail address: [email protected] (V. Agte). 0261-5614/$ - see front matter ª 2008 Elsevier Ltd and European Society for Clinical Nutrition and Metabolism. All rights reserved. doi:10.1016/j.clnu.2008.01.014 available at www.sciencedirect.com http://intl.elsevierhealth.com/journals/clnu Clinical Nutrition (2008) 27, 464e472
-
Upload
independent -
Category
Documents
-
view
2 -
download
0
Transcript of Dietary and nutritional biomarkers of lens degeneration, oxidative stress and micronutrient...

Clinical Nutrition (2008) 27, 464e472
ava i lab le a t www.sc iencedi rec t .com
ht tp : / / in t l . e l sev ie rhea l th .com/ j ourna l s /c lnu
ORIGINAL ARTICLE
Dietary and nutritional biomarkers of lensdegeneration, oxidative stress and micronutrientinadequacies in Indian cataract patients*
Kirtan V. Tarwadi, Shashi A. Chiplonkar, Vaishali Agte*
Biometry and Nutrition, Agharkar Research Institute, G.G. Agarkar Road, Pune 411004, India
Received 30 October 2006; accepted 25 January 2008
KEYWORDSCataract;Antioxidants;Micronutrients;Oxidative stress;Polyphenols;Phytic acid
Non-standard abbreviations: HIG, hquency questionnaire; RDA, recommeobarbituric acid reactive substances; Mcholesterol; EGRAC, erythrocyte glutsuper oxide dismutase; MZn, erythroc
* This paper was presented at the IX* Corresponding author. Tel.: þ91 (0
E-mail address: vaishaliagte@hotm
0261-5614/$ - see front matter ª 200doi:10.1016/j.clnu.2008.01.014
Summary
Background & aims: Habitual food and nutrient intakes of 140 Indian cataract patients and 100age- and sex-matched controls (50e75 years), from high income group and low income groups,were assessed.Methods: Food intake was recorded by food frequency questionnaire and data wereexamined for linkages with blood/lens parameters of oxidative stress through a casee
control study.Results: Intake of animal foods and fried snacks was significantly higher while vegetables,green leafy vegetables, fruit, tea and micronutrient intakes were lower in patients thanin controls (p < 0.001). Lens oxidative stress and opacity showed a significant negativeassociation with fruit intake (p < 0.05). Multiple regression analysis indicated associationof intakes of iron, beta-carotene, ascorbic acid, tannic acid and inositol pentaphosphatewith plasma oxidative stress (p < 0.01) and association of intakes of iron, ascorbic acidand inositol triphosphate with lens oxidative stress (p < 0.01). Weighted least square regres-sion for lens opacity revealed that intakes of ascorbic acid, folic acid and inositolpentaphosphate explained 59.7% of the total variation (p < 0.01).
igh income group; LIG, low income group; ICMR, Indian Council of Medical Research, FFQ, food fre-nded daily allowance; GLV, green leafy vegetables; IP1eIP6, inositol phosphate fractions; TBARS, thi-
DA, malondialdehyde adducts; TG, triglycerides; TC, total cholesterol; HDL, high density lipoproteinathione reductase activity coefficient; ETKAC, erythrocyte transketolase activity coefficient; SOD,yte membrane zinc; S:T, soluble to total protein ratio.Asian Congress of Nutrition held at New Delhi, India, February 23e27, 2003.
)20 2565 4357; fax: þ91 (0)20 2565 1542.ail.com (V. Agte).
8 Elsevier Ltd and European Society for Clinical Nutrition and Metabolism. All rights reserved.

Dietary biomarkers of cataract 465
Conclusions: Dietary deficiency of antioxidant micronutrients was greater for patients thancontrols. Deficiency of beta-carotene, ascorbic acid, folic acid, iron, phytate and polyphe-nols increased oxidative stress in blood and lens.ª 2008 Elsevier Ltd and European Society for Clinical Nutrition and Metabolism. All rightsreserved.
Introduction
Currently, cataract has become one of the importantpublic health problems across the globe. In all the SouthEast Asian countries, India has the highest prevalence ofcataract-related blindness.1 In India, there are about9.5 million blind people, and at least twice as many suffer-ing from various stages of development of this sight-threatening condition.2 Oxidative stress as a result ofincreased generation of active species of oxygen andfree radicals in the lens has been implicated in the etio-pathogenesis of age-related cataract.2e5 The extensiveoxidation of lens protein and lipid is associated with hu-man cataract in older individuals whereas little oxidation(only in membrane components) has been found in controlsubjects of similar age.5 Further, the non-enzymatic Mail-lard reactions are also thought to contribute to aging andcataract formation in the lens, as demonstrated in therat model.6
A dietary deficiency of antioxidants and reactive oxygenscavengers may be involved in the pathogenesis of cata-ract, as demonstrated in some experimental cataracts.7e9
Diets in Indian sub-continent are mostly vegetarian in na-ture with contribution of whole, unprocessed cerealsamounting to 60% of total energy intake. However, theconsumption of fruits and vegetables being sub-optimal,10
Indian diets may perhaps not supply adequate amounts ofantioxidants. Such diet-related factors are likely to predis-pose micronutrient deficiencies, which in turn can triggeroxidative stress and associated disorders such as lensdegeneration as seen in cataract.
A number of epidemiological as well as clinical studieshave reported association between nutrition and cata-ract2e4,8 with deficiency of either a single or multiplenutrients5,8 and possible protective roles for dietary anti-oxidants in threat of nuclear cataracts have been indi-cated.5,6,11 However, these factors are population specificand most of these studies have been conducted on Westernpopulations that have a distinct lifestyle from Indians.Further, use of multivariate models can not only evaluatethe relative role of dietary factors in lens degeneration,but also explore the linkages between diet/nutrients,with cataractogenesis. Nevertheless, uses of multivariatemodels are limited. A few studies have emphasized theneed to increase the total antioxidant intake in generalby inclusion of more fruits and vegetables. Yet, awarenessis well desired to be created for specific foods rather thanemphasizing quantity of fruits and vegetables since popula-tion-specific micronutrients and antioxidants impede len-ticular opacities. Findings based on previous studies byour group indicated lower plasma levels of micronutrientsin cataract patients as compared to controls, and higheroxidative stress and opacity in lens.12 To explore the link-age of lens opacification with diet, individual foods/food
classes/nutrients were examined as the biomarkers forcataract. The main objectives of the study were:
1. To assess and compare the habitual dietary intake ofcommonly consumed foods and estimate the dailyintakes of micronutrients and antioxidants in cataractpatients and controls
2. To examine the linkages of the foods and nutrientintakes with the blood levels of oxidative stress, antiox-idant micronutrients and degree of lens degenerationas biomarkers for predisposition of cataract
Materials and methods
Subjects
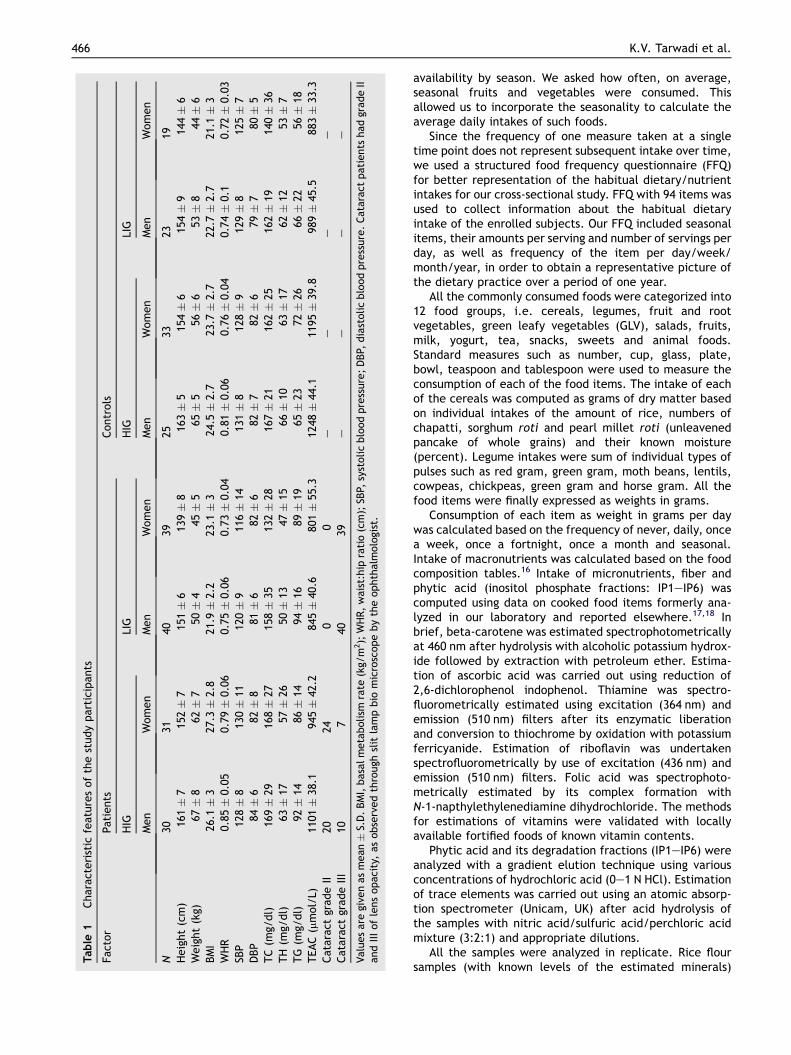
The subjects (n Z 240) were residing in and around Punecity in the age group of 50e75 years, and representedhigher and lower socio economic classes. The particularson study subjects have been described earlier.12 Subjectswere registered for participation in the study on a voluntarybasis, with written informed consent duly signed by eachone of them. Protocols followed throughout the studywere in accordance with Ethical Guidelines for BiomedicalResearch on Human Subjects of the Indian Council ofMedical Research, New Delhi, India, ICMR (2000).13 Thework plan of the entire study was approved by ICMR. Thecharacteristics of the study population are given in Table 1.
Information records
Complete information about each enrolled subject wasnoted as previously described.12 Additional informationconcerning each patient who underwent eye examinationthrough a slit-lamp biomicroscope for the status of cataractas gradings of lens opacity was noted. The lenses come onlyfrom surgical removals that had been performed for thesole benefit of the patients. The eyes of the controlsubjects showed no signs of progression of cataract.
Dietary and nutrient intake of the subjects
In contrast to 24 h diet recall, the Food Frequency Ques-tionnaire (FFQ) is the most common dietary assessmenttool used in large epidemiologic studies of diet and healthbecause it measures long-term diet, is quick and compara-tively inexpensive to administer, and provides quantitativeinformation on nutrients and foods.14,15 In the presentstudy, subjects were interviewed to obtain informationfor FFQ. This not only improved the responses but alsorequired special effort by the investigators in recollectinginformation on seasonal items like fruit and vegetable
Table
1Chara
cteri
stic
featu
res
of
the
study
part
icip
ants
Fact
or
Pati
ents
Contr
ols
HIG
LIG
HIG
LIG
Men
Wom
en
Men
Wom
en
Men
Wom
en
Men
Wom
en
N30
3140
3925
3323
19H
eig
ht
(cm
)16
1�
715
2�
715
1�
613
9�
816
3�
515
4�
615
4�
914
4�
6W
eig
ht
(kg)
67�
862�
750�
445�
565�
556�
653�
844�
6BM
I26
.1�
327
.3�
2.8
21.9�
2.2
23.1�
324
.5�
2.7
23.7�
2.7
22.7�
2.7
21.1�
3W
HR
0.85�
0.05
0.79�
0.06
0.75�
0.06
0.73�
0.04
0.81�
0.06
0.76�
0.04
0.74�
0.1
0.72�
0.03
SBP
128�
813
0�
1112
0�
911
6�
1413
1�
812
8�
912
9�
812
5�
7D
BP
84�
682�
881�
682�
682�
782�
679�
780�
5TC
(mg/
dl)
169�
2916
8�
2715
8�
3513
2�
2816
7�
2116
2�
2516
2�
1914
0�
36TH
(mg/
dl)
63�
1757�
2650�
1347�
1566�
1063�
1762�
1253�
7TG
(mg/
dl)
92�
1486�
1494�
1689�
1965�
2372�
2666�
2256�
18TEAC
(mm
ol/
L)11
01�
38.1
945�
42.2
845�
40.6
801�
55.3
1248�
44.1
1195�
39.8
989�
45.5
883�
33.3
Cata
ract
grade
II20
240
0e
ee
e
Cata
ract
grade
III
107
4039
ee
ee
Valu
es
are
give
nas
mean�
S.D
.BM
I,basa
lm
eta
bolism
rate
(kg/
m2);
WH
R,
wai
st:h
ipra
tio
(cm
);SB
P,sy
stolic
blo
od
pre
ssure
;D
BP,
dia
stolic
blo
od
pre
ssure
.C
ata
ract
pati
ents
had
grade
IIand
III
of
lens
opaci
ty,
as
obse
rved
thro
ugh
slit
lam
pbio
mic
rosc
ope
by
the
ophth
alm
olo
gist
.
466 K.V. Tarwadi et al.
availability by season. We asked how often, on average,seasonal fruits and vegetables were consumed. Thisallowed us to incorporate the seasonality to calculate theaverage daily intakes of such foods.
Since the frequency of one measure taken at a singletime point does not represent subsequent intake over time,we used a structured food frequency questionnaire (FFQ)for better representation of the habitual dietary/nutrientintakes for our cross-sectional study. FFQ with 94 items wasused to collect information about the habitual dietaryintake of the enrolled subjects. Our FFQ included seasonalitems, their amounts per serving and number of servings perday, as well as frequency of the item per day/week/month/year, in order to obtain a representative picture ofthe dietary practice over a period of one year.
All the commonly consumed foods were categorized into12 food groups, i.e. cereals, legumes, fruit and rootvegetables, green leafy vegetables (GLV), salads, fruits,milk, yogurt, tea, snacks, sweets and animal foods.Standard measures such as number, cup, glass, plate,bowl, teaspoon and tablespoon were used to measure theconsumption of each of the food items. The intake of eachof the cereals was computed as grams of dry matter basedon individual intakes of the amount of rice, numbers ofchapatti, sorghum roti and pearl millet roti (unleavenedpancake of whole grains) and their known moisture(percent). Legume intakes were sum of individual types ofpulses such as red gram, green gram, moth beans, lentils,cowpeas, chickpeas, green gram and horse gram. All thefood items were finally expressed as weights in grams.
Consumption of each item as weight in grams per daywas calculated based on the frequency of never, daily, oncea week, once a fortnight, once a month and seasonal.Intake of macronutrients was calculated based on the foodcomposition tables.16 Intake of micronutrients, fiber andphytic acid (inositol phosphate fractions: IP1eIP6) wascomputed using data on cooked food items formerly ana-lyzed in our laboratory and reported elsewhere.17,18 Inbrief, beta-carotene was estimated spectrophotometricallyat 460 nm after hydrolysis with alcoholic potassium hydrox-ide followed by extraction with petroleum ether. Estima-tion of ascorbic acid was carried out using reduction of2,6-dichlorophenol indophenol. Thiamine was spectro-fluorometrically estimated using excitation (364 nm) andemission (510 nm) filters after its enzymatic liberationand conversion to thiochrome by oxidation with potassiumferricyanide. Estimation of riboflavin was undertakenspectrofluorometrically by use of excitation (436 nm) andemission (510 nm) filters. Folic acid was spectrophoto-metrically estimated by its complex formation withN-1-napthylethylenediamine dihydrochloride. The methodsfor estimations of vitamins were validated with locallyavailable fortified foods of known vitamin contents.
Phytic acid and its degradation fractions (IP1eIP6) wereanalyzed with a gradient elution technique using variousconcentrations of hydrochloric acid (0e1 N HCl). Estimationof trace elements was carried out using an atomic absorp-tion spectrometer (Unicam, UK) after acid hydrolysis ofthe samples with nitric acid/sulfuric acid/perchloric acidmixture (3:2:1) and appropriate dilutions.
All the samples were analyzed in replicate. Rice floursamples (with known levels of the estimated minerals)

Dietary biomarkers of cataract 467
from the National Institute of Environmental Studies(NIES, Japan) were used as biological standards as qualitycontrol.
Blood analysis
Fasting blood samples were used for estimation of all thebiochemical parameters. Oxidative stress was estimatedas thiobarbituric acid reactive substances (TBARS) aspreviously described.12 Although the lipid peroxidationmethod is thought to have poor specificity, being a rela-tively simple measurement it is preferred in clinicalstudies. Plasma levels of ascorbic acid, beta-carotene,retinol, zinc, iron, manganese and selenium, serum levelsof ceruloplasmin, triglycerides (TG), total cholesterol (TC)and HDL were estimated as previously described.12 Thestatus of riboflavin and thiamine were assessed as erythro-cyte glutathione reductase activity coefficient (EGRAC)and erythrocyte transketolase activity coefficient (ETKAC)wherein the values higher than 1.2 indicated poor statusof the two vitamins. EGRAC, ETKAC, superoxide dismutase(SOD), and levels of erythrocyte membrane zinc (MZn)were determined from the erythrocytes. The total antiox-idant activity was estimated from the plasma using theABTSþ system (2,20 azinobis 3-ethylbenzothiazoline 6-sulfonic acid).
Lens analysis
The weight of the lens received as homogenates wasmeasured by noting down the weights of the containerswith and without the lens homogenate using an electronicone pan balance with accuracy of 0.01 mg (AFCOSET,India). The intact lenses were sonicated with ice-colddeionized 0.85% sodium chloride solution (normal saline)and processed on the same day for further biochemicalestimations as previously described.12
Results on antioxidant micronutrient status of blood andlens as well as oxidative stress and parameters of lensdegeneration have been reported previously by us.12 In thepresent study the main focus has been the linkages of dietand nutrients with oxidative stress and parameters for lensdegeneration for cataract patients and controls.
Statistical methods
One-way ANOVA with post hoc Tukey’s multiple comparisontests was carried out to compare several control groupswith corresponding patient groups after testing the initialsignificance of F test of ANOVA. Nonparametric equivalentof t-test, viz. ManneWhitney test, was used to assess thedifferences in various groups of patients with correspondingcontrol groups since the distributions of blood and lensparameters were not normal.
For further statistical analysis, suitable transformationswere made for the non-normal variables. Multiple weightedleast-square regression of plasma micronutrient levels andmicronutrient intakes adjusted for energy intake wasperformed. Results were considered significant at p <0.05. The entire statistical analysis was done using SPSSversion 11.0 for Windows.
Results
The range of age for the study population was 50e75 yearsfor all the eight classes. Subjects outside this age rangewere excluded from the study in order to avoid anyintrusion due to senility-related health problems. Thecharacteristic features of the study participants are shownin Table 1. LIG men and women were shorter in height byabout 10 cm and weighed less by 10e12 kg than their HIGcounterparts. Total cholesterol and HDL were higher inHIG subjects than LIG subjects except LIG control men.
For each of the 240 subjects, intakes of 12 food groups, 9micronutrients, fiber and 6 forms of phytate werecomputed while previously analyzed data of blood andlens for these subjects12 was used for the present investiga-tion. Differences between patients and controls for dietaryand nutrient intakes were examined along with theassociations of dietary and nutrient intakes with oxidativestress (TBARS), lens degeneration (TBARS, opacity and S:Tratio) as well as the blood levels of micronutrients aspossible biomarkers.
Comparison of food and nutrient intakebetween two socioeconomic classes
Average intakes of food classes for patients and controls areshown in Table 2. The consumption of salads was found tobe absent among all the LIG subjects irrespective of genderand incidence of cataract. Intakes of fruits were highest inHIG control men, moderate in HIG men and women patientsand LIG men controls, but least in LIG control women. GLVintakes were highest in LIG control men followed by HIGcontrol men and women, and lowest in LIG men patients.Intakes of fruit/root vegetables were highest in HIG controlmen and women and lowest in LIG men patients. Milkconsumption was lowest and comparable within LIG menpatients and LIG women controls, whereas it was highestfor HIG men patients. No significant differences wereseen between intakes of milk products for patients andcontrols in both classes other than LIG men patients andcontrols. Intake of tea in controls exceeded that inpatients, with significant differences between LIG patientsand controls (p < 0.01).
Legume intakes of HIG women patients were signifi-cantly higher than the HIG women controls (p Z 0.001).Intakes of GLV and fruits of LIG men patients were signifi-cantly lower than the LIG control men (p < 0.01). Therewere no significant differences between GLV or fruit intakesof other patients group and their corresponding controlgroups.
Comparison of food and nutrient intakefor patients and controls
Further analysis using one-way ANOVA with post hoc Tukey’smultiple comparison tests revealed that (1) intake of animalfoods for the controls was significantly lower than thepatients (p < 0.001), (2) cereal intake was higher in controlsthan patients (p < 0.001) especially in men, (3) vegetableintakes were higher in controls than patients (F Z 26.5,p < 0.001), (4) intakes of GLV and fruits were higher in

Table 2 Daily food intake of patients and controls
Food intake Patients Controls
HIG LIG HIG LIG
Men Women Men Women Men Women Men Women
Cereals 244 � 37 211 � 30 171 � 49 154 � 45 272 � 76 217 � 49 196 � 51 170 � 59Legumes 89 � 35 89 � 37 68 � 37 64 � 15 52 � 51 84 � 54 61 � 26 39 � 26Vegetables 29 � 11 35 � 15 18 � 11 29 � 15 57 � 14 52 � 12 33 � 16 26 � 7GLV 21 � 9 22 � 9 10 � 7 24 � 11 25 � 13 25 � 11 26 � 13 22 � 13Salads 11 � 7 11 � 8 0 0 15 � 4 20 � 8 0 0Fruits 39 � 8 32 � 14 21 � 12 22 � 17 45 � 14 35 � 17 37 � 24 15 � 8Milk 60 � 45 50 � 35 8 � 18 10 � 23 30 � 40 35 � 24 16 � 24 9 � 16Yogurt 87 � 34 91 � 50 39 � 30 46 � 35 85 � 50 92 � 35 52 � 26 42 � 31Tea 185 � 40 190 � 45 180 � 25 135 � 57 215 � 45 200 � 50 250 � 60 225 � 30Snacks 12 � 15 8 � 8 32 � 35 23 � 28 8 � 8 8 � 15 15 � 25 11 � 23Sweets 18 � 6 15 � 5 5 � 6 5 � 4 6 � 7 8 � 5 7 � 8 6 � 6Animal foods 14 � 10 9 � 7 13 � 8 13 � 8 8.6 � 5.6 7.0 � 6 8 � 6 8 � 5
Milk and tea intake: ml/day; other commodities: g/day. Values are given as mean � S.D.
468 K.V. Tarwadi et al.
controls than patients (F Z 14.04, F Z 9.71, p < 0.001), thedifference being more prominent in men than in women, and(5) intake of fried snacks was higher in the patients anddiffered in men but not in women (F Z 4.57, p Z 0.004).
Macronutrient intakes of all the subjects were below therecommended daily allowances (RDA) for Indians but thedifferences between energy and protein intakes of patientsand controls were not statistically significant (p > 0.1). De-spite this fact, intakes of all the micronutrients (Table 3)were lower in patients than their corresponding controls.ANOVA for micronutrient intake data indicated significantlyhigher values in all the controls than patients for calcium(F Z 10.1, p < 0.001), beta-carotene (F Z 14.47, p <0.001), ascorbic acid (F Z 9.46, p < 0.01), folic acid (F Z15.68, p < 0.001) and polyphenols (F Z 38.7, p < 0.0001).When the same exercise was done separately for men andwomen, significant differences were observed betweencontrols and patients only among men for intakes of ribo-flavin (F Z 7.2, p < 0.01), thiamine (F Z 7.8, p < 0.01),
Table 3 Daily micronutrient intake of subjects
Micronutrient Patients
HIG LIG
Men Women Men Wo
Beta-carotene 1313 1307 690 618Ascorbic acid 21.5 17.5 11.4 9Riboflavin 260 262 182 160Thiamine 426 408 298 266Folic acid 55.9 51.8 35.34 32Zinc 3.8 4.1 3.3 2Copper 1.1 1.1 0.71 0Iron 7.1 7.4 5.7 4Calcium 392 381 258 294Phytate 411 429 304 287Fiber 19.5 17.3 15.5 11
Intake for beta-carotene, riboflavin, thiamine and folic acid: mg/day; ovalues under each category.
copper (F Z 4.98, p Z 0.002), iron (F Z 5.18, p Z 0.002),niacin (F Z 16.25, p < 0.001), phytate (F Z 4.04, p Z0.008), fiber (F Z 11.1, p < 0.01) and zinc (F Z 3.2,p Z 0.023).
Univariate analysis for associations betweenoxidative stress and dietary intakes
Correlations between plasma TBARS and nutrient intakeswere computed separately for patients and controls andalso for the pooled data, i.e. all the eight study groups. Inthe pooled data, plasma TBARS showed a significant nega-tive correlation with fruit (r Z �0.34, p < 0.01) and vege-table (r Z �0.32, p < 0.01) intakes and a higher value ofr, separately computed, was seen in controls than inpatients. Also, lens TBARS in patients showed a significantnegative association with fruit intake (r Z �0.33, p <0.01). Further, there were significant differences between
Controls
HIG LIG
men Men Women Men Women
1577 1437 1064 675.6 22.5 20.7 15.3 12.3
279 247 248 180487 398 363 300
.2 66.4 58.4 51.1 36.6
.6 4.2 3.5 3.9 2.9
.62 1.1 1.1 0.87 0.59
.3 8.4 7.0 6.8 5.7400 406 358 245478 404 422 314
.1 23.3 19.3 19.7 17.7
ther nutrients: mg/day, fiber g/day. Figures represent the median

Dietary biomarkers of cataract 469
HIG and LIG groups for TEAC. This seems to be due to signif-icant differences in micronutrient intakes between HIG andLIG groups.
Dietary intakes of beta-carotene (r Z �0.40), ascorbicacid (r Z �0.44), folic acid (r Z � 0.32), manganese (r Z�0.32) and zinc (r Z �0.30) were significantly andnegatively correlated with plasma TBARS in controls. In pa-tients, negative correlations of plasma TBARS were seen forintakes of copper (r Z �0.36), riboflavin (r Z �0.31), thia-mine (r Z �0.31), beta-carotene (r Z �0.25) and ascorbicacid (r Z � 0.26). Ex vivo lens opacity was significantlylinked with intakes of beta-carotene (r Z �0.37), ascorbicacid (r Z �0.40), riboflavin (r Z �0.27), folic acid(r Z �0.37), thiamine (r Z �0.36) and copper (r Z �0.27).
Multivariate analysis for influencing factors
To investigate relative role of micronutrients and antioxi-dants in generating oxidative stress and lens degenerationand to study influence of dietary intakes on plasma status,multiple regression analysis for nutrient intakes weightedfor energy intakes was performed.
The dietary intakes of iron, beta-carotene, ascorbicacid, polyphenols and inositol pentaphosphate (IP5) wereassociated with plasma TBARS (R2 Z 0.476, p < 0.01).Fig. 1aec indicate the levels of micronutrient intakes inrelation to three classes based on high, medium and low
.00
5.00
10.00
15.00
20.00
VITC IP5 iron
plasma TBARS class
mg
/d
ay
LowMediumHigh
.00
50.00
100.00
Low Medium HighPlasma TBARS
mg
/d
ay
.00200.00400.00600.00800.00
1000.001200.001400.00
Low Medium HighPlasma TBARS
micro
gram
/d
ay
a
b
c
Figure 1 (a) Dietary intake of vitamin C, IP5 and iron in threeclasses of subjects according to plasma TBARS. (b) Polyphenolintake in three classes of subjects according to plasma TBARS.(c) Beta-carotene intake in three classes of subjects accordingto plasma TBARS. Low: 4e8 nmol/ml, Medium: 8e12 nmol/ml,High: 12e16 nmol/ml.
levels of plasma TBARS (4e8, 8e12, 12e16). When lensTBARS was regressed on dietary nutrient intakes adjustedfor energy intake, intakes of iron, ascorbic acid and IP3were found to be associated (R2 Z 0.58, p < 0.01).Weighted least-square regression for lens opacity revealedthat dietary intakes of ascorbic acid, folic acid and IP5were associated with lens opacity and explained 59.7% ofthe total variation (R2 Z 0.597, p < 0.01). Fig 2a and b rep-resent the intakes based on high, medium and low levels oflens opacity (median value 0.34, 0.59, 0.69). Logisticregression analysis indicated association of lens S:T ratiowith intake of fruits (r Z 0.98, p < 0.001) and yogurt(r Z 1.01, p < 0.001).
Log-transformed plasma beta-carotene levels wereassociated with dietary intakes of beta-carotene, ascorbicacid and polyphenols (R2 Z 0.611, p < 0.01). Serum cerulo-plasmin levels were associated with dietary intakes ofcopper, ascorbic acid, folic acid, polyphenols and fiber(R2 Z 0.471, p < 0.01). R2 values for other blood parame-ters were not statistically significant (p > 0.05).
Discussion
Several dietary and non-dietary factors, viz. age, sex,education, smoking, alcohol and exposure to sunlight, areknown to play a significant role in the development ofcataract. Secondly, cataract is equally prevalent in low aswell as high economic classes. The present study washowever aimed at assessment of the dietary patterns and
.002.004.006.008.00
10.0012.0014.0016.0018.0020.00
Vit C IP5
lens turbidity class
mg/
day
LowMediumHigh
.00
10.00
20.00
30.00
40.00
50.00
60.00
Low Medium HighLens turbidity
folic
aci
d (m
cg/d
ay)
a
b
Figure 2 (a) Nutrient intakes in three classes of subjects ac-cording to lens turbidity. Turbidity as optical density of lens ho-mogenized in 8 ml saline. Low: 0.34; Medium: 0.49; High: 0.68.(b) Folic acid intake in three classes of subjects according tolens turbidity. Low: 0.34; Medium: 0.49; High: 0.68.

470 K.V. Tarwadi et al.
nutrient intake and their linkages with the parameters oflens degeneration among Indian cataract patients.
Deficiencies of antioxidants and micronutrients as wellas chronic exposure to high levels of glucose and galactosehave been considered to play a key role in cataracto-genesis.5 A number of epidemiological studies have beenconducted regarding the linkage between intake of antiox-idant vitamins and risk of cataract in older individuals.There has been limited research on specific micro- andmacronutrient deficiencies in Indian cataract patients andit was felt necessary to undertake research on this aspectin order to comprehend the relative role of diet incataractogenesis among Indians.
The nucleus of the lens is particularly sensitive tonutrient deficiencies.5 This may be partially attributed toa change in the dietary habits with more choice for instantand ready-to-eat foods over traditional meals, due toimpact of the lifestyle.19 For the HIG subjects, we noticedmore preference for refined and carry-home foods, low inmicronutrients. On the other hand, for LIG subjects,economic constraints resulted in lower consumption offruits and vegetables. The end result probably was ofreduced intake of protective factors such as antioxidantsand micronutrients in both these socioeconomic classes,which might have predisposed disorders like cataract.
The average macronutrient intakes for all the patientsand controls were much lower than the RDA for energy. Theage group of our study population being 50e75 years, itrepresents an elderly class. The reported data on nutrientintakes of elderly Indians is limited. However, available In-dian data and other data suggest that older adults have sig-nificantly lower nutrient intakes than younger adults.20e24
These studies collectively suggest imbalanced nutrition inthe elderly irrespective of the presence or absence ofcataract.
In India, cereals being the staple food, they constitutethe major source of some micronutrients like zinc, iron andcopper.25 In cereals, pearl millet has good amounts ofriboflavin, thiamine, folic acid and fiber as well as the high-est bioavailable form of iron and zinc.26 Millet is a fairlyinexpensive commodity in India, hence its consumption isreasonable for LIG. In the present study, higher intake ofmillet was observed in LIG controls than in patients, whichseem to have resulted in higher intake of micronutrients.The consumption of millet might be supportive to mainte-nance of blood micronutrient levels.
Food classes such as leafy and non-leafy vegetables andfruits are rich in antioxidants and micronutrients.27 In thepresent study, intake of fruits, vegetables and GLV, whichare the protective food groups, were higher in controlsthan in patients and a significant negative correlationexisted between oxidative stress and fruit/vegetableintakes. In the Indian context, it is well documentedthrough National Nutrition Monitoring Bureau surveys in 12different states28,29 that lower income populations eatlesser amounts of fruits, vegetables and milk due to lackof affordability. Parallel observations were noted for ourdata pertaining to lower intakes of fruits, milk and yogurt,salads and sweets among the LIG than the HIG subjects.
Salads in Indian cuisine represent preparations of rawvegetables comprising mostly cabbage, lettuce, carrots,radish, onions, tomatoes and cucumber. Intake of salads
was absent in the LIG and a higher intake of salads wasfound in HIG controls than in HIG patients. These protectivefoods seem to influence the lens opacity and TBARS besidesimproving plasma status of ascorbic acid and beta-carotene.
Negative and significant correlations between plasmaTBARS and intake of fruits and vegetables were found inboth patients and controls. However, the value of thecorrelation coefficient was higher in controls. Dietaryintakes of beta-carotene and ascorbic acid showed stron-ger association with plasma TBARS in controls than inpatients. Further, the intakes of these two micronutrientsshowed association with lens TBARS and opacity. Multipleregression analysis confirmed the role of beta-carotene,ascorbic acid, with addition of polyphenols and IP5 asinfluential factors with plasma TBARS, lens TBARS and lensopacity. These observations together indicate lessinfluence of non-dietary factors in controls than inpatients and the importance of dietary antioxidants inthe prevention of cataract.
Legume intakes of HIG women patients were signifi-cantly higher than in HIG women controls (p Z 0.001).Legumes are the chief sources of proteins and amino acidsamong the vegetarian population. It seems likely thatplant proteins act differently in vivo as compared toanimal protein in exerting the protective effects; forexample milk protein (casein) is considered atherogenic,whereas soy protein has anti-atherogenic effects. Al-though average intakes animal food and milk were lowin both groups, intakes of these two commodities weresignificantly higher in patients than their respectivecontrols. Galactose, the sugar present in milk, has beenreported to be cataractogenic.29 In another parallel study,lactose consumption through milk was associated withhigh incidence of cataract, and galactose absorbed afterhydrolysis of lactase from milk in individuals with normallactase activity was considered responsible for thiseffect.30
Plasma beta-carotene levels were associated withdietary intakes of beta-carotene, ascorbic acid andpolyphenols (R2 Z 0.611, p < 0.01) showing strong inter-relationships between individual antioxidants of dietaryorigin in determining their plasma levels. Similarly, serumceruloplasmin levels were associated not only with dietaryintakes of copper but also with ascorbic acid, folic acid,polyphenols and fiber. In one reported study,31 the preva-lence of nuclear opacification was significantly lower inthe highest nutrient intake quintile category relative tothe lowest quintile category for vitamin C (p < 0.001),vitamin E (p Z 0.02), riboflavin (p Z 0.005), folic acid(p Z 0.009), beta-carotene (p Z 0.04), and lutein/zeaxan-thin (p Z 0.03). After adjustment for other nutrients, onlyvitamin C intake remained significantly associated(p Z 0.003 for trend) with the prevalence of nuclear opac-ities. The present study, though caseecontrol, supports theabove findings.
Lower S:T ratio (threshold of 0.54) has been indicated asa marker of cataract in animals.32 Our data on lens S:T ratioshowed associations with intake of fruits and yogurt for allthe patients. Higher intake of stale fried foods (low-pricedunbranded snacks) with tea was seen in the worker cate-gory of LIG. Longer storage of fried foods leads to higher

Dietary biomarkers of cataract 471
levels of peroxidation products. Secondly, during the inter-view it was noted that LIG subjects mostly ingested tea asstrongly boiled decoction of tealeaf dust with very lowmilk content, which was available with the roadside ven-dors. The utensils used for tea preparation were by andlarge unpolished brass or aluminum. Repeated boiling ofthe tea in such vessels is likely to result in higher metalleaching into the beverage thereby exerting deleteriouseffects on lens solubility. However, further investigationsare necessary to confirm such speculations to derive anyoutcome.
Cataract is by and large considered as an age-relatedhealth disorder but there was no association of age withlens opacity in the present study group. This seems to bedue to inclusion of HIG patients who underwent PHACOsurgery long before the lens reached its maturity, with theirlenses of intermediate opacity. On the other hand, the LIGpatients, out of financial restraint, opted for low-cost IOLsurgery and waited until the cataract was fully grown.Although age was not a significant factor influencing lensopacity in our study population, the final regression modelremained same even after adjusting for age.
HPLC methods furnish more accurate estimates ofvitamins. Nevertheless, the spectrophotometric and fluo-rescence-based estimations of plasma vitamins have alsobeen used in the present results. These were thought tosuffice for the present paper for relative comparisonbetween the patient and control groups, although theymay not be accurate enough to detect the extent ofdeficiency. Nevertheless, a reference serum sample wasalso simultaneously run for each estimated parameter toverify the reproducibility of the results. Similarly, mea-surement of TBARS also has poor specificity.33 We have usedTBARS in the present paper for relative comparisons ofoxidative stress in patients and controls of a study popula-tion involving 240 subjects.
It appears that lower intakes of fruits and vegetablesseem to be related to lower status of antioxidant micro-nutrients. Additionally, increased consumption of animalfood, milk and fried snacks was associated positively withlens opacity. The present results, though not sufficient toestablish a causal relationship between diet and cataract inan Indian scenario, are suggestive that intakes of antioxi-dant micronutrients beta-carotene, ascorbic acid, poly-phenols and phytate are influential factors for cataract;yet additional data from other parts of the country aredeemed necessary to obtain a broader conclusion.
Conflict of interest statement
There is no financial conflict of interest for any of theauthors.
Acknowledgments
The authors are thankful to the ophthalmologists of PuneNetra Seva Pratishtan, Parvathi Eye Clinic, Sardesai Hospi-tal and National Institute of Ophthalmology for access tocataract patients. The help from Director, ARI for facilitiesand encouragement is gratefully acknowledged. The finan-cial aid in terms of SRF to KT from ICMR is appreciated.
Author’s contributions and declarations: KVT carried outthe surveys, laboratory analyses, data analyses and draftedthe manuscript. SAC participated in the statistical analysis.VVA conceived the study, participated in its design andcoordination as a research guide and senior author, helpedin setting up laboratory method protocols and significantlycontributed in drafting the manuscript. All authors haveread and approved the final manuscript. There is no conflictof interest or any financial or personal relationships withthe company or organization sponsoring the research at thetime the research was performed.
References
1. Bulletin of the National Information Center of The University ofStallenbosch (NICUS); 2001.
2. Balasubramanian D. Molecular and cellular approaches tounderstand and treat some of the disease of the eye. CurrSci 2002;82:948e57.
3. Balasubramanian D, Bhat KS, Rao GN. Factors in the prevalenceof cataract in India - analysis of the recent Indo-US study ofage-related cataracts. Curr Sci 1990;59:498e505.
4. Bhat KS, John A, Reddy PS, Reddy PR, Reddy VN. Effect ofpigmentation on glutathione redox cycle antioxidant defensein whole as well as different regions of human extractedlens. Exp Eye Res 1991;52:715e21.
5. Taylor A, Nowell T. Oxidative stress and antioxidant function inrelation to risk for cataract. Adv Pharmacol 1997;38:515e36.
6. Shansi F, Sharkey E, Creighton D, Nagaraj R. Maillard reactionsin lens proteins: Methyl-glycoxal mediated modifications in ratlens. Exp Eye Res 2000;70(3):369e80.
7. Bhat KS. Nutritional status of thiamine, riboflavin and pyridox-ine in cataract patients. Nutr Rep Int 1987;36:685e92.
8. Mohan M, Sperduto RD, Angra SK, Milton RC, Mathur RL,Underwood BA, et al. India-US case-control study of age-related cataracts. Arch Ophthalmol 1989;107:670e6.
9. Balasubramanian D. Molecular and cellular approaches tounderstand and treat some diseases of the eye. Curr Sci2002;82:948e57.
10. Kumar P, Mathur VC. Structural changes in the demand for foodin India. Ind J Agric Ecol 1996;51:644e73.
11. Cumming RG, Mitchell P, Smith W. Diet and cataract. The BlueMountains eye study. Ophthalmology 2000;107:450e6.
12. Tarwadi KV, Agte VV. Linkages of antioxidant, micronutrientand socio-economic status with the degree of oxidative stressand lens opacity in Indian cataract patients. Nutrition 2004;20(3):261e7.
13. Ethical guidelines for biomedical research on human subjectsof Indian Council of Medical Research. New Delhi, India:ICMR; 2000. p. 1e77.
14. Merchant AT, Dehghan M, Chifamba J, Terera G, Yusuf S. Nutri-ent estimation from an FFQ developed for a black Zimbabweanpopulation. Nutr J 2005;4:37e41.
15. Shahar D, Fraser D, Shai I, Vardi H. Development of a foodfrequency questionnaire (FFQ) for an elderly population basedon a population survey. J Nutr 2003;133:3625e9.
16. Gopalan C, Ramashastri BV, Balasubramanian SC Nutritivevalue of Indian foods. 2nd ed. Hyderabad; 2000.
17. Agte VV, Tarwadi KV, Mengale SS, Chiplonkar SA. Potential oftraditionally cooked green leafy vegetables as natural sourcesfor supplementation of 8 micronutrients in vegetarian diets. JFood Comp Anal 2000;13:885e91.
18. Agte VV, Tarwadi KV, Chiplonkar SA. Phytate degradationduring traditional cooking: significance of phytic acid profilein cereal based vegetarian meals. J Food Comp Anal 1999;12:161e7.
472 K.V. Tarwadi et al.
19. Agte VV, Tarwadi KV, Mengale SS, Hinge A, Chiplonkar SA.Vitamin Profile of cooked foods: how healthy is the practiceof eating ready to eat foods? Int J Food Sci Nutr 2002;53(3):197e208.
20. National Nutrition Monitoring Bureau (NNMB report). NationalInstitute of Nutrition NIN. Hyderabad: ICMR; 1994e1995.
21. Vijayaraghavan K, Rao DH. Diet and nutrition situation in ruralIndia. Ind J Med Res 1998;108:243e53.
22. Sreenivas V, Prabhakar AK, Badrinath SS, Fernandez T,Roy IS, Sharma T, et al. A rural population based case-con-trol study of senile cataract in India. Epidemiology 1999;5:327e36.
23. Charlton KE, Wolmarans P, Marais AD, Lombard CJ. Macronutri-ent intake and cardiovascular risk factors in older SouthAfricans. East Africa Med J 1997;74(8):478e86.
24. Zephier EM, Ballew C, Mokdad A, Mendlein J, Smith C, Yeh JL,et al. Intake of nutrients related to cardiovascular disease riskin three groups of American Indians: The Strong Heart DietaryStudy. Prev Med 1997;26(4):508e15.
25. Chiplonkar SA, Agte VV, Gokhale MK. Zinc, copper and ironcontents in cooked foods and estimates of their daily intakesin young hostel residents. Ind J Med Res 1993;98:283e9.
26. Agte VV, Gokhale MK, Paknikar KM, Chiplonkar SA. Assessmentof pearl millet vs rice based diets for bioavailability of tracemetals. Plant Foods Hum Nutr 1995;48(2):149e58.
27. Tarwadi KV, Agte VV. Potential of commonly consumed greenleafy vegetables for their antioxidant capacity and theirlinkage with micronutrient profile. Int J Food Sci Nutr 2003;56:417e25.
28. National Nutrition Monitoring Bureau (NNMB report), NationalInstitute of Nutrition NIN. Hyderabad: ICMR; 1995e1996.
29. Bhat KS, Gopalan C. Human cataract and galactose metabo-lism. Nutr Metab 1974;7:1e8.
30. Birlouez-Aragon I, Ravelontseheno L, Villate-Cathelineau B,Cathelineau G, Abitbol G. Disturbed galactose metabolism inelderly and diabetic humans is associated with cataractformation. J Nutr 1993;123(8):1370e6.
31. Jacques PF, Chylack Jr LT, Hankinson SE, Khu PM, Rogers G,Friend J, et al. Long-term nutrient intake and early age-relatednuclear lens opacities. Arch Ophthalmol 2001;119(7):1009e19.
32. Taylor A, Zuliani AM, Hopkins RE. Moderate caloric restrictiondelays Cataract formation in Emory mouse. FASEB J 1989;3:1741e5.
33. National Institute of Nutrition. Annual report; 1999e2000.