Household Farm Production Diversity and Micronutrient Intake
21
sustainability Article Household Farm Production Diversity and Micronutrient Intake: Where Are the Linkages? Panel Data Evidence from Uganda Haruna Sekabira 1, * , Shamim Nalunga 2 , Yves Didier Umwungerimwiza 3 , Lydia Nazziwa 2 and Stanley Peter Ddungu 2 Citation: Sekabira, H.; Nalunga, S.; Umwungerimwiza, Y.D.; Nazziwa, L.; Ddungu, S.P. Household Farm Production Diversity and Micronutrient Intake: Where Are the Linkages? Panel Data Evidence from Uganda. Sustainability 2021, 13, 4041. https://doi.org/10.3390/su13074041 Academic Editor: Harpinder Sandhu Received: 3 March 2021 Accepted: 30 March 2021 Published: 5 April 2021 Publisher’s Note: MDPI stays neutral with regard to jurisdictional claims in published maps and institutional affil- iations. Copyright: © 2021 by the authors. Licensee MDPI, Basel, Switzerland. This article is an open access article distributed under the terms and conditions of the Creative Commons Attribution (CC BY) license (https:// creativecommons.org/licenses/by/ 4.0/). 1 International Institute of Tropical Agriculture (IITA), Kacyiru, KG 563 Street #3, Kigali P.O. Box 1269, Rwanda 2 Department of Agricultural Research, LADS Consult, Kampala P.O. Box 7106, Uganda; [email protected] (S.N.); [email protected] (L.N.); [email protected] (S.P.D.) 3 Department of Human Nutrition and Dietetics, University of Rwanda, Kigali P.O. Box 7279, Rwanda; [email protected] * Correspondence: [email protected]; Tel.: +250-781-338-650 Abstract: Hunger and malnutrition are key global challenges whose understanding is instrumental to their elimination, thus realization of important sustainable development goals (SDGs). However, understanding linkages between farm production diversity (FPD) and household micronutrient intake is important in mapping micronutrient deficiencies and hidden hunger. Such understanding would inform appropriate interventions against malnutrition. Unfortunately, empirical literature is scarce to sufficiently inform such understanding. Using nationally representative panel survey data covering about 3300 households, we study linkages between FPD and nutrition, and associated impact pathways. We analyze data using panel regression models. Results show that at least half of sample was deficient in daily energy, iron, zinc, and vitamin A intake vis-à-vis FAO recommendations. Deficiencies were most severe (85%) with vitamin A. Positive and significant associations (about 1% for each added crop/livestock species) exist between FPD and daily household energy, iron, zinc, and vitamin A intake. FPD impacts energy and micronutrient intake via two main consumption pathways; markets (about 0.01% for each shilling), and own farm production (about 0.1% for each shilling). Therefore, own farm production yields better outcomes. Gender effects also exist. Male-headed households exhibited better nutrition outcomes (energy—11%, iron—8%, and zinc—12%) mostly via markets. Effects on Vitamin A were also positive although insignificant. Keywords: farm production diversity; panel data; nutrition; energy; iron; zinc; vitamin A; Uganda 1. Introduction The 2030 Sustainable Development Goals (SDGs) agenda of the United Nations (UN) targets to attain a global population that is liberated from hunger, food insecurity, and malnutrition. However, globally—about two billion people still lack access to adequate and quality food [1]. Therefore, households consistently experience food insecurity from moderate to severe magnitudes, hence exposing them to malnutrition and its related health problems [2]. Hunger has ravaged mostly the world’s low-developed regions especially Africa. Almost all Africa’s sub-regions are experiencing increases in hunger, which implies that affected populations lack access to enough food [1]. Therefore, these populations are undernourished, since they cannot have adequate dietary energy required for a healthy living [1,2]. Moreover, prevalence of undernourishment in some African countries whose populations are dominantly dependent on smallholder farming mostly in Sub Sahara Africa (SSA) does exceed 35%, the highest prevalence globally [1]. Yet, to achieve the 2030 SDGs’ agenda of zero hunger, inclusive appropriate effective and pro-poor mechanisms against hunger, food insecurity and malnutrition need to be realized amidst increasing global Sustainability 2021, 13, 4041. https://doi.org/10.3390/su13074041 https://www.mdpi.com/journal/sustainability
-
Upload
khangminh22 -
Category
Documents
-
view
0 -
download
0
Transcript of Household Farm Production Diversity and Micronutrient Intake

sustainability
Article
Household Farm Production Diversity and MicronutrientIntake: Where Are the Linkages? Panel Data Evidence fromUganda
Haruna Sekabira 1,* , Shamim Nalunga 2, Yves Didier Umwungerimwiza 3 , Lydia Nazziwa 2
and Stanley Peter Ddungu 2
�����������������
Citation: Sekabira, H.; Nalunga, S.;
Umwungerimwiza, Y.D.; Nazziwa, L.;
Ddungu, S.P. Household Farm
Production Diversity and
Micronutrient Intake: Where Are the
Linkages? Panel Data Evidence from
Uganda. Sustainability 2021, 13, 4041.
https://doi.org/10.3390/su13074041
Academic Editor: Harpinder Sandhu
Received: 3 March 2021
Accepted: 30 March 2021
Published: 5 April 2021
Publisher’s Note: MDPI stays neutral
with regard to jurisdictional claims in
published maps and institutional affil-
iations.
Copyright: © 2021 by the authors.
Licensee MDPI, Basel, Switzerland.
This article is an open access article
distributed under the terms and
conditions of the Creative Commons
Attribution (CC BY) license (https://
creativecommons.org/licenses/by/
4.0/).
1 International Institute of Tropical Agriculture (IITA), Kacyiru, KG 563 Street #3, Kigali P.O. Box 1269, Rwanda2 Department of Agricultural Research, LADS Consult, Kampala P.O. Box 7106, Uganda;
[email protected] (S.N.); [email protected] (L.N.); [email protected] (S.P.D.)3 Department of Human Nutrition and Dietetics, University of Rwanda, Kigali P.O. Box 7279, Rwanda;
[email protected]* Correspondence: [email protected]; Tel.: +250-781-338-650
Abstract: Hunger and malnutrition are key global challenges whose understanding is instrumentalto their elimination, thus realization of important sustainable development goals (SDGs). However,understanding linkages between farm production diversity (FPD) and household micronutrientintake is important in mapping micronutrient deficiencies and hidden hunger. Such understandingwould inform appropriate interventions against malnutrition. Unfortunately, empirical literatureis scarce to sufficiently inform such understanding. Using nationally representative panel surveydata covering about 3300 households, we study linkages between FPD and nutrition, and associatedimpact pathways. We analyze data using panel regression models. Results show that at least half ofsample was deficient in daily energy, iron, zinc, and vitamin A intake vis-à-vis FAO recommendations.Deficiencies were most severe (85%) with vitamin A. Positive and significant associations (about 1%for each added crop/livestock species) exist between FPD and daily household energy, iron, zinc, andvitamin A intake. FPD impacts energy and micronutrient intake via two main consumption pathways;markets (about 0.01% for each shilling), and own farm production (about 0.1% for each shilling).Therefore, own farm production yields better outcomes. Gender effects also exist. Male-headedhouseholds exhibited better nutrition outcomes (energy—11%, iron—8%, and zinc—12%) mostly viamarkets. Effects on Vitamin A were also positive although insignificant.
Keywords: farm production diversity; panel data; nutrition; energy; iron; zinc; vitamin A; Uganda
1. Introduction
The 2030 Sustainable Development Goals (SDGs) agenda of the United Nations (UN)targets to attain a global population that is liberated from hunger, food insecurity, andmalnutrition. However, globally—about two billion people still lack access to adequateand quality food [1]. Therefore, households consistently experience food insecurity frommoderate to severe magnitudes, hence exposing them to malnutrition and its related healthproblems [2]. Hunger has ravaged mostly the world’s low-developed regions especiallyAfrica. Almost all Africa’s sub-regions are experiencing increases in hunger, which impliesthat affected populations lack access to enough food [1]. Therefore, these populations areundernourished, since they cannot have adequate dietary energy required for a healthyliving [1,2]. Moreover, prevalence of undernourishment in some African countries whosepopulations are dominantly dependent on smallholder farming mostly in Sub Sahara Africa(SSA) does exceed 35%, the highest prevalence globally [1]. Yet, to achieve the 2030 SDGs’agenda of zero hunger, inclusive appropriate effective and pro-poor mechanisms againsthunger, food insecurity and malnutrition need to be realized amidst increasing global
Sustainability 2021, 13, 4041. https://doi.org/10.3390/su13074041 https://www.mdpi.com/journal/sustainability

Sustainability 2021, 13, 4041 2 of 21
challenges to sufficient food supplies like; climate change, increasing global population(144 million babies born per year), and conflict [2]. In general, the UN believe that hunger,food insecurity and malnutrition can be resolved through ensuring proper food systems.However, food systems are a complex nexus involving key components, for instance: foodcrops/livestock identification, food production, food processing and marketing, marketaccess and purchasing power (income), and food consumption and utilization [1,3–6].Moreover, different factors can be responsible for determining intended outcomes of eachcomponent [2]. Therefore, food systems are characteristic of several interlinkages—which ifnot well understood, designing appropriate, inclusive, effective and pro-poor interventionsagainst hunger may be impossible.
Unfortunately, empirical literature that would facilitate the understanding of thesefood system linkages is fragmented. Most literature studies individual components offood systems, yet studying the nexus for instance interlinkages between farm production(agriculture) and nutrition would provide a more comprehensive understanding [4,6,7].Moreover, most empirical literature has only highlighted importance of certain mecha-nisms through which these interlinkages manifest their impact on food consumption andnutrition, leaving the nexus limitedly understood. For example, some of the key mech-anisms or pathways put forward through which smallholder farmers can enhance theirnutrition while relying on their farm production diversity is access to markets [8–10]. Theseauthors argue that enabling households to access markets where they can sell their producecompetitively, enables households to galvanize incomes, which they in turn use to smoothconsumption. Moreover, other evidence has also linked markets to better food security andnutrition outcomes [11,12]. However, other evidence suggests that if households are ableto produce various crops or livestock (farm production diversity), households can thendirectly consume this produce thus resolving hunger, food insecurity and malnutritionproblems [2,5,7,13–17]. Therefore, evidence is mixed and it would be an oversight to as-sume that mechanisms through which farm production diversity interlinks with nutritionoutcomes can be universally deployed to produce similar nutrition outcomes. Moreover,country- or region-specific contextual factors could be important in determining what farmproduction diversity mechanisms would more effectively improve household food security,and nutrition outcomes [6,8–10,13,18,19].
Therefore, we contribute to the gap in knowledge around the nexus of agriculture(farm production diversity) and nutrition, by studying interlinkages between farm pro-duction diversity (FPD) and nutrition outcomes. We also study various impact pathwaysconcurrently to give a more comprehensive understanding of the nexus of these inter-linkages. Previous literature mostly focused on individual components in the nexus. Weuse nationally representative panel data on farm production and food consumption fromUganda to answer these questions: (1) Does FPD impact on household daily energy andmicronutrient intake? (2) Through what pathways does FPD impact daily energy andmicronutrient intake? (3) Does FPD impact differently on daily energy and micronutrientintake, attained via different consumption pathways (own production, and markets)? (4) Ifyes in 3, which pathway is more effectively?
Moreover, most studies on FPD and nutrition have studied FPD impacts on householdnutrition using household dietary diversity scores (HDDS) which is a dietary quality indica-tor that provides no clear understanding of the magnitudes of dietary components [18,20].Therefore, as a novelty, to the best of our knowledge, this is the first study exploring empir-ical associations of farm production diversity with regards to energy and micronutrientintake among smallholder farmers.
Conceptual Framework
We conceptualize that farm production diversity (FPD) impacts daily energy andmicronutrients available to households positively, hence those that are subsequently con-sumed. In our study, we focus on energy and strategic micronutrients that are indispensable

Sustainability 2021, 13, 4041 3 of 21
for human growth and development (iron, zinc, and vitamin A), yet often deficient acrosspopulations especially in developing economies [21].
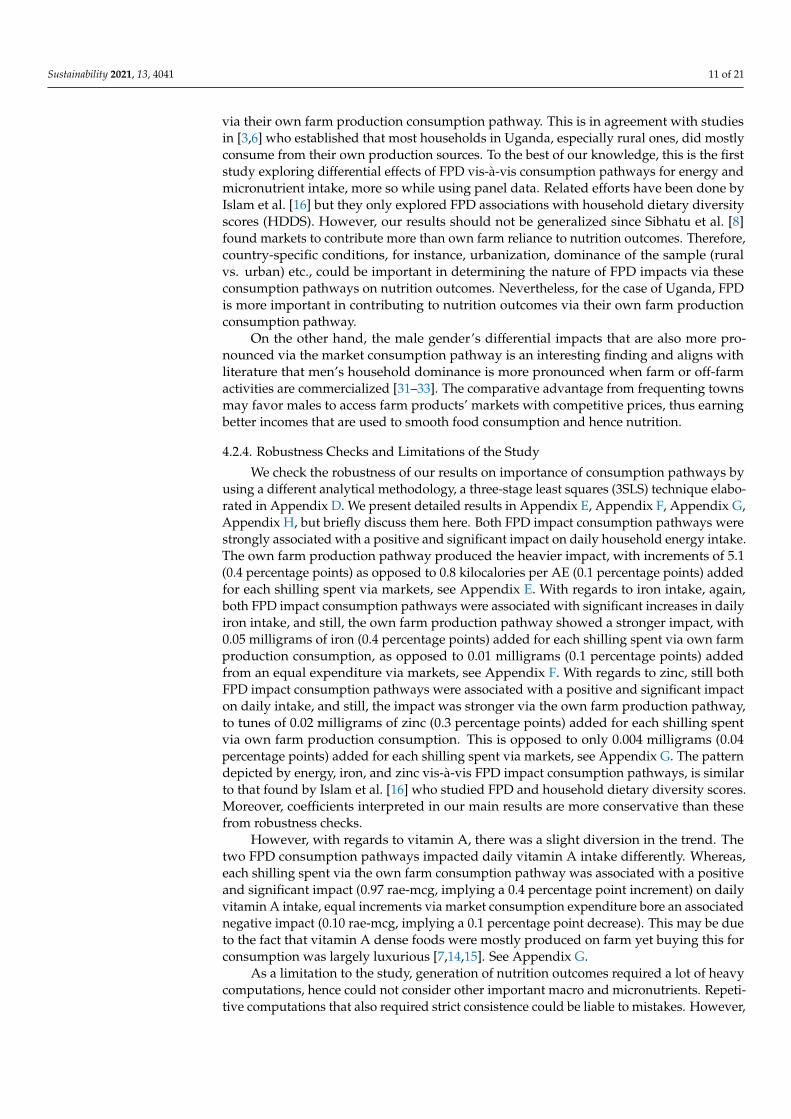
If assessed via different consumption pathways (own farm production, and markets),there could be differential effects of FPD on food consumption, and subsequently on dailyenergy and micronutrient intake. We depict these potential differences using differentthickness of the arrows between FPD and the two perceived consumption pathways(Figure 1). Nevertheless, we hypothesize that these differential impacts are stronger viatheir own farm production consumption pathway, since our sample is largely of subsistencesmallholder farmers.
Sustainability 2021, 13, x FOR PEER REVIEW 3 of 24
1.1. Conceptual Framework We conceptualize that farm production diversity (FPD) impacts daily energy and mi-
cronutrients available to households positively, hence those that are subsequently con-sumed. In our study, we focus on energy and strategic micronutrients that are indispen-sable for human growth and development (iron, zinc, and vitamin A), yet often deficient across populations especially in developing economies [21].
If assessed via different consumption pathways (own farm production, and markets), there could be differential effects of FPD on food consumption, and subsequently on daily energy and micronutrient intake. We depict these potential differences using different thickness of the arrows between FPD and the two perceived consumption pathways (Fig-ure 1). Nevertheless, we hypothesize that these differential impacts are stronger via their own farm production consumption pathway, since our sample is largely of subsistence smallholder farmers.
Figure 1. FPD (farm production diversity) impact consumption pathways for energy and micronutrients intake.
Theoretically, when households produce crops and livestock on their farms (farm production diversity), we assume that there are two main pathways through which farm production contributes to household food consumption namely: (1) own farm production, and (2) market’s consumption pathways. Under the own farm consumption pathway, we hypothesize that households produce crops and livestock and consume them directly, hence contributing to daily per capita household energy and micronutrient requirements. On the other hand, we hypothesize that households produce crops and livestock, and in-stead sell them and earn incomes, which are used to purchase food for daily energy and micronutrient requirements. We rely on such conceptualization to answer the research questions above.
2. Materials and Methods 2.1. Data
We used panel survey data from Uganda collected by Uganda Bureau of Statistics (UBOS) that is representative nationally. This data is composed of the Uganda National Panel Survey (UNPS) collected annually with support from the World Banks’s Living Standards Measurement Study-Integrated Surveys on Agriculture (LSMS-ISA) segment
Figure 1. FPD (farm production diversity) impact consumption pathways for energy and micronutrients intake.
Theoretically, when households produce crops and livestock on their farms (farmproduction diversity), we assume that there are two main pathways through which farmproduction contributes to household food consumption namely: (1) own farm production,and (2) market’s consumption pathways. Under the own farm consumption pathway,we hypothesize that households produce crops and livestock and consume them directly,hence contributing to daily per capita household energy and micronutrient requirements.On the other hand, we hypothesize that households produce crops and livestock, andinstead sell them and earn incomes, which are used to purchase food for daily energy andmicronutrient requirements. We rely on such conceptualization to answer the researchquestions above.
2. Materials and Methods2.1. Data
We used panel survey data from Uganda collected by Uganda Bureau of Statistics(UBOS) that is representative nationally. This data is composed of the Uganda NationalPanel Survey (UNPS) collected annually with support from the World Banks’s Living Stan-dards Measurement Study-Integrated Surveys on Agriculture (LSMS-ISA) segment [22].We used three (3) panel waves (2009/10, 2010/11, and 2011/12) that uninterruptedlycomprised of about 3300 households. The UNPS is a subsection of the 2005/6 UgandaNational Household Survey (UNHS) that is nationally representative and comprisingof 6775 households. Uganda was selected for this study because LSMS-ISA data wavesconsecutively existed to comprise a panel. Furthermore, we have used the same datato study farm production diversity and household dietary diversity. In brief, we usedthe Stata SE 16.0 software and its programming algorithms to identify and select data oncrops and livestock species farmed in interviewed households, and other demographicdata like age, education, and gender of household heads and other variables. Using these

Sustainability 2021, 13, 4041 4 of 21
algorithms, we also selected and retained data on household consumption for food typesand quantities that we later used to calculate energy and other micronutrients’ quantitiesused in this study. Essentially, all households that reported consumption data (nearly allhouseholds) were selected. After identifying and filtering the needed data variables, weused the algorithm to drop all other data variables that were not needed for this study, sothat data files could be managed easily.
2.2. Measurement of Farm Production Diversity and Nutrition Variables
We measured farm production diversity (FPD) using the household biodiversity index(HBI) which is a simple count of all crops and livestock species produced on farms. Theindex has been previously used by Di Falco and Chavas [23], Jones et al. [13], and morerecently by Sibhatu et al. [8]. Daily per capita consumption was measured as consumptionexpenditure in Uganda shilling (UGX), (1 US$ = 3500 UGX). Earlier years’ consumptionvalues were deflated using a certified consumer price index (CPI) provided by UBOS [24]to make comparison across years possible. Nutrition has been measured using energyand selected micronutrients including iron, zinc, vitamin A, on a daily intake per adultequivalent (AE) basis, computed by basing on guidelines of Hotz et al. [25] and theUnited Nations [26]. Studying energy and micronutrients help assess households’ nutritionstatus. Nearly two billion people globally, most of who are in developing countries sufferdeficiencies in these micronutrients, yet these are central to mental and physical humandevelopment, hence reducing vulnerabilities to diseases and early deaths [21].
2.3. Empirical Strategy
To analyze the descriptive nature of our data, we use descriptive measures, for in-stance, the mean to report averages of continuous variables, and percentages to report oncategorical variables like energy and micronutrient deficiencies.
However, to analyze linkages between farm production diversity (FPD) and dailyhousehold energy and micronutrient intake, we employ panel regression models illustratedin Equation (1).
EMit = α0 + α1FPDit + α2Tt + αiXit + εit (1)
where EMit indicates a nutrition outcome (daily energy or micronutrient intake) of house-hold i during year t. α0 is a constant, and α1 is the farm production diversity FPDit effectto be determined. α2 is a parameter for time fixed effects, while αi is a vector of coefficientsto be determined for household and contextual characteristics. T is a year identifier. εitis normally distributed error term. Xit is a vector of observed household (age, education,household size, etc.), and contextual (distance to town centers, locality, etc.) characteristics,that along with FPD affect nutrition outcomes. Due to households self-selected into farmingor not farming given species of livestock or crops, this could have bred endogeneity due toobserved and unobserved heterogeneity thus biases. Henceforth, instead of using a fixedeffects (FE) estimator, we instead used the random effects (RE) estimator. However, be-cause the RE estimator strongly assumes that FPD is uncorrelated with unobserved factors(that may affect nutrition outcomes), the assumption may be violated due to self-selectionthus yielding biased estimates. We control for this potential violation of the RE estimatorassumption by estimating the Mundlak (MK) estimator, which is a pseudo fixed-effectsmodel [27]. The MK estimator controls for mean values of independent variables alongsideother covariates, thus limiting potential biases stemming from time-invariant unobservedheterogeneity [28], as would have been achieved with a normal fixed-effects (FE) estima-tor [29]. Hence, we interpret our results following MK estimators. However, we presentboth RE and MK models for comparison.
To analyze impact pathways, we estimated Equation (2), which is a modificationof Equation (1), but controlling for potential impact consumption pathways including:(1) own farm production, and (2) market purchases, for nutrition outcomes. Since we only

Sustainability 2021, 13, 4041 5 of 21
interpreted MK estimator results after Equation (1), we only estimated Equation (2) usingan MK estimator.
EMit = δ0 + δ1OwnFarmit + δ2Marketsit + δ3FPDit + δ4Tt + δiXit + εit (2)
where OwnFarmit is daily household food consumption from own farm production, and δ1is the effect of such consumption on nutrition outcomes. Marketsit is daily household foodconsumption from markets, and δ2 is its effect. Non-defined variables under Equation (2),are the same as those defined under Equation (1), and their respective parameters to beestimated; to minimize space, we do not redefine them.
To analyze potential differential effects of FPD on nutrition outcomes sourced viadifferent consumption pathways, we estimated Equation (3), a modification of Equation (1),only that nutrition outcomes are disaggregated by source consumption pathway.
EM_OwnFarm or EM_Marketsit = ϑ0 + ϑ1FPDit + ϑ2Tt + ϑiXit + εit (3)
where EM_OwnFarm orEM_Marketsit is daily household energy or micronutrients intakegenerated from either own farm production consumption pathway or markets respectively.ϑ1 is the effect of FPD on respective nutrition outcomes. Non-defined variables underEquation (3), are the same as those defined under Equation (1), and their respectiveparameters to be estimated, but to minimize space, we do not redefine them. We onlypresent and discuss MK estimator results. To further ascertain robustness of our results, weestimated a three-stage least squares regression (see Appendix D for the detailed analyticalmethodology), and present results after discussions.
3. Results3.1. Descriptive Results
We present descriptive statistics in Table 1 for variables used in regressions. Onaverage, household consumption expenditure was higher on market-sourced foods (1820UGX) compared to that from own farms (888 UGX). Households were mostly rural (77%),and located about 30 km from the nearest main markets. Furthermore, sample householdswere mostly male-headed (70%), with an average size of 7 persons who generally nevercompleted primary school (7 years).
Table 1. Descriptive statistics for variables of the pooled sample (N = 8617).
Variables Mean Std. Dev.
Daily per capita consumption via markets (UGX) 1819.62 2204.26Daily per capita consumption from own production (UGX) 888.24 841.14Distance to nearest major market (kilometers) 29.543 20.016Annual precipitation (millimeters) 1237.61 182.572Elevation (meters) 1228.23 231.368Urban households (percentage) 22.995 42.082Male-headed households (percentage) 70.286 45.703Household size (persons) 6.956 3.639Household size (adult equivalents) 4.241 2.285Education (years) 5.335 3.996Household heads using mobile phones (percentage) 55.971 49.645Productive assets (millions UGX) 19.700 93.900Experienced shocks (percentage) 46.854 49.904Land size (acres by GPS) 3.282 20.217Free/lease land holders (percentage) 33.678 47.264Accessed extension services (percentage) 18.255 38.632
Source: Authors’ calculations. UGX is Uganda shilling (1 US$ = 3500 UGX); GPS is Global Positioning System.
About 56% of household heads owned and used mobile phones, however, only 18%accessed extension services. Households had a productive assets’ value of nearly 20 millionUGX, and a land size of 3 acres, with about 34% of households possessing free or lease hold

Sustainability 2021, 13, 4041 6 of 21
land titles. Nearly half of the sample (47%) experienced shocks to household well-beingincluding death of the head, severe illnesses, floods, famine or drought.
In Table 2, we present mean values of nutrition outcome variables. We disaggregatethese variables by respective consumption pathways (markets versus own farm sources).Generally, the sample average for daily energy and iron intake was slightly above FAOrecommended thresholds, while that for zinc and vitamin A was clearly below FAOthresholds. About 50% of the sample was deficient in energy and zinc, while a whopping67% and 85% were deficient in iron and vitamin A respectively.
Table 2. Descriptive statistics for nutrition outcome variables.
Daily Household Energy and Micronutrients Intake per AE Mean Std. Dev.
Total from all sources (N = 8574)Energy (Kilocalories) 2636 1567Iron (milligrams) 19.70 11.02Zinc (milligrams) 13.36 8.156Vitamin A (RAE—micrograms) 331.9 329.7Markets sourced (N = 8311)Energy (Kilocalories) 1726 1481Iron (milligrams) 11.74 10.66Zinc (milligrams) 9.270 8.302Vitamin A (RAE—micrograms) 145.7 205.9Own farm sourced (N = 6374)Energy (Kilocalories) 1227 1133Iron (milligrams) 11.26 9.403Zinc (milligrams) 5.914 5.490Vitamin A (RAE—micrograms) 249.0 314.1Consumption Deficiency, 0–1 scale (N = 8574)Energy 0.502 0.500Iron 0.504 0.500Zinc 0.655 0.476Vitamin A 0.849 0.358FAO recommended minimum thresholds per AEEnergy (Kilocalories) 2400Iron (milligrams) 18.27Zinc (milligrams) 15.00Vitamin A (RAE—micrograms) 625.0
Source: Authors’ calculations. RAE is retinal activity equivalents. AE is adult equivalent. N is numberof observations.
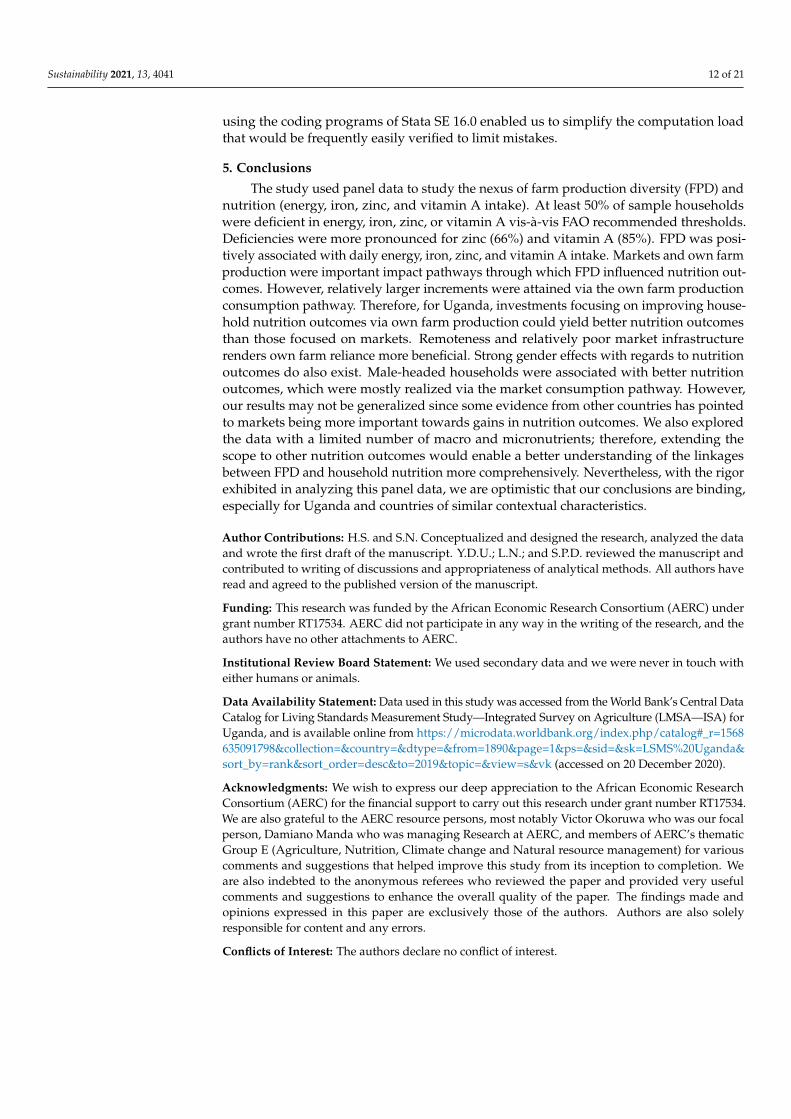
From Table 2, energy, iron, and zinc were mainly sourced from markets unlike vitaminA, and we use this data to make graphical illustrations of energy and micronutrient sourcesin Figure 2.
Sustainability 2021, 13, x FOR PEER REVIEW 7 of 24
From Table 2, energy, iron, and zinc were mainly sourced from markets unlike vita-min A, and we use this data to make graphical illustrations of energy and micronutrient sources in Figure 2.
Figure 2. Source (markets or own farm) mean percentage contribution to total daily energy and micronutrient intake per AE.
3.2. Empirical Results In Table 3, we present results after estimating Equation (1). As had been hypothe-
sized, columns 2, 4, 6, and 8 showed that FPD was positively and significantly associated with household daily energy, iron, zinc, and vitamin A intake. Specifically, a one species increase in the number of crops and livestock produced on farm was associated with in-crements in daily intake of 6.5 kilocalories, 0.1 milligrams, 0.06 milligrams, and 4.7 RAE—micrograms of energy, iron, zinc, and vitamin A respectively. These incremental associa-tions imply a 0.3, 0.5, 0.4, and 1.4 percentage point increases in daily household energy, iron, zinc, and vitamin A intake, respectively.
Table 3. Regression results for the impact of FPD on daily household energy and micronutrient intake.
Variables Energy (Kilocalo-ries)
Iron (Milligrams) Zinc (Milli-grams)
Vitamin A (Rae−Mc)
RE (1) MK (2) RE (3) MK (4) RE (5) MK (6) RE (7) MK (8)
FPD (biodiversity index) 7.711 ** 6.535 * 0.114 *** 0.102 *** 0.066 *** 0.058 ** 5.004 *** 4.704 *** (3.868) (3.906) (0.030) (0.031) (0.022) (0.023) (0.873) (0.900)
Distance nearest main market (km)
−1.493 * 2.275 0.005 −0.006 −0.003 −0.0001 0.963 *** −1.408 (0.897) (3.918) (0.007) (0.032) (0.005) (0.021) (0.182) (1.087)
Head uses mobile phone (dummy)
217.8 *** −23.11 0.627 ** −0.557 1.442 *** −0.007 −27.05
*** −7.935
(35.10) (50.66) (0.276) (0.420) (0.203) (0.292) (7.991) (13.51)
Household size (adult equiva-lent)
−126.9 *** −194.5 *** −0.877
*** −1.382
*** −0.691
*** −0.994
*** −9.353
*** −15.16
*** (7.907) (18.45) (0.061) (0.145) (0.045) (0.100) (1.696) (4.266)
Male head (dummy) 23.79 279.9 ** −0.046 1.642 ** 0.352 1.574 ** −6.288 0.855
(39.41) (110.5) (0.302) (0.783) (0.224) (0.627) (8.148) (31.37)
Age of head (years) 1.905 15.58 ** 0.0325 0.129 ** 0.001 0.084 ** −0.919 2.078
(4.593) (7.575) (0.034) (0.065) (0.026) (0.041) (1.025) (2.282)
Age squared of head (years) −0.028 −0.214 ** −0.0004 −0.001 −0.0001 −0.001
** 0.015 −0.025
01020304050607080
Energy Iron Zinc Vitamin A
Mea
n %
con
tribu
tion
Energy and other Micronutrients
Market sourced
Own farm sourced
Figure 2. Source (markets or own farm) mean percentage contribution to total daily energy andmicronutrient intake per AE.
3.2. Empirical Results
In Table 3, we present results after estimating Equation (1). As had been hypothesized,

Sustainability 2021, 13, 4041 7 of 21
columns 2, 4, 6, and 8 showed that FPD was positively and significantly associated withhousehold daily energy, iron, zinc, and vitamin A intake. Specifically, a one species increasein the number of crops and livestock produced on farm was associated with increments indaily intake of 6.5 kilocalories, 0.1 milligrams, 0.06 milligrams, and 4.7 RAE—microgramsof energy, iron, zinc, and vitamin A respectively. These incremental associations imply a0.3, 0.5, 0.4, and 1.4 percentage point increases in daily household energy, iron, zinc, andvitamin A intake, respectively.
Table 3. Regression results for the impact of FPD on daily household energy and micronutrient intake.
VariablesEnergy (Kilocalories) Iron (Milligrams) Zinc (Milligrams) Vitamin A (Rae−Mc)
RE (1) MK (2) RE (3) MK (4) RE (5) MK (6) RE (7) MK (8)
FPD (biodiversity index) 7.711 ** 6.535 * 0.114 *** 0.102 *** 0.066 *** 0.058 ** 5.004 *** 4.704 ***(3.868) (3.906) (0.030) (0.031) (0.022) (0.023) (0.873) (0.900)
Distance nearest mainmarket (km)
−1.493 * 2.275 0.005 −0.006 −0.003 −0.0001 0.963 *** −1.408(0.897) (3.918) (0.007) (0.032) (0.005) (0.021) (0.182) (1.087)
Head uses mobile phone(dummy)
217.8 *** −23.11 0.627 ** −0.557 1.442 *** −0.007 −27.05 *** −7.935(35.10) (50.66) (0.276) (0.420) (0.203) (0.292) (7.991) (13.51)
Household size (adultequivalent)
−126.9 *** −194.5 *** −0.877 *** −1.382 *** −0.691 *** −0.994 *** −9.353 *** −15.16 ***(7.907) (18.45) (0.061) (0.145) (0.045) (0.100) (1.696) (4.266)
Male head (dummy) 23.79 279.9 ** −0.046 1.642 ** 0.352 1.574 ** −6.288 0.855(39.41) (110.5) (0.302) (0.783) (0.224) (0.627) (8.148) (31.37)
Age of head (years) 1.905 15.58 ** 0.0325 0.129 ** 0.001 0.084 ** −0.919 2.078(4.593) (7.575) (0.034) (0.065) (0.026) (0.041) (1.025) (2.282)
Age squared of head(years)
−0.028 −0.214 ** −0.0004 −0.001 −0.0001 −0.001 ** 0.015 −0.025(0.047) (0.097) (0.0004) (0.001) (0.0003) (0.001) (0.010) (0.031)
Education of head (years) −16.53 −36.64 ** 0.004 −0.274 ** −0.097 −0.300 *** 2.884 0.999(11.45) (17.24) (0.089) (0.137) (0.066) (0.099) (2.587) (4.353)
Educ. squared of head(years)
2.625 *** 3.696 ** 0.007 0.027 ** 0.016 *** 0.024 *** −0.155 0.100(0.893) (1.441) (0.007) (0.011) (0.005) (0.008) (0.200) (0.344)
Shock experience(dummy)
−69.56 ** −45.74 0.007 −0.107 −0.219 −0.197 −5.570 −16.05(30.80) (37.53) (0.245) (0.308) (0.180) (0.226) (7.406) (10.23)
Land size (acres by GPS) 1.188 −0.926 0.026 −0.002 0.027 * −0.001 0.650 −0.195(2.449) (2.930) (0.019) (0.026) (0.014) (0.017) (0.572) (0.791)
Land size squared (acresby GPS)
−0.004 −0.002 −5 × 10⁻⁵ * −2 × 10⁻⁵ −5 × 10⁻⁵ ** −1 × 10⁻⁵ −0.001 −0.0001(0.004) (0.004) (3 × 10⁻⁵) (4 × 10⁻⁵) (2 × 10⁻⁵) (3 × 10⁻⁵) (0.001) (0.001)
Year 201034.99 57.38 * 0.264 0.295 −0.018 0.049 −18.11 ** −21.14 **
(33.28) (33.87) (0.271) (0.271) (0.197) (0.197) (8.868) (9.143)
Year 20119.166 49.32 0.227 0.301 −0.146 −0.006 −16.91 * −21.48 **
(33.37) (34.52) (0.271) (0.277) (0.197) (0.203) (8.818) (9.088)Mean values Yes Yes Yes Yes
4757 *** 4795 *** 20.53 *** 21.33 *** 14.76 *** 14.74 *** 322.5 *** 337.8 ***Constant (115.1) (145.8) (0.892) (1.196) (0.657) (0.900) (25.50) (31.11)
Observations 8574 8574 8574 8574 8574 8574 8574 8574No. of households 3258 3258 3258 3258 3258 3258 3258 3258Wald Chi2 value 358.80 *** 368.45 *** 229.67 *** 262.13 *** 344.79 *** 409.63 *** 138.00 *** 158.75 ***
Standard errors in parentheses; *** p < 0.01, ** p < 0.05, * p < 0.1; FPD is farm production diversity; GPS is Global Positioning System;rae-mcg is Retinal Activity Equivalents—micrograms; KM is kilometer; MK is Mundlak estimation; RE is random effects estimation. SeeAppendix A for details.
Table 3 results also unearthed other factors that were important determinants of nutri-tion outcomes. For instance, increments in normal age of household heads, as well as highereducation (squared normal education years) were positively and significantly associatedwith increases in daily energy and micronutrient intake. An increasing household sizewas also negatively and significantly associated with all nutrition outcomes. Surprisingly,gender effects were also explicit, whereby male-headed households were associated withsignificantly better nutrition outcomes. For instance, male-headed households had anassociated increase in their daily energy, iron, and zinc intake of 11% (279.9 kilocalories),8% (1.642 milligrams) and 12% (1.574 milligrams) respectively. Associated increments forvitamin A were also positive even though they were not significant.
In Table 4, we present results after estimating Equation (2). However, now, for eachadded livestock or crop species, daily intake reduced from 6.5 to 1.8 kilocalories, 0.1to 0.05 milligrams, 0.06 to 0.05 milligrams, and 4.7 to 1.9 RAE—micrograms for energy,

Sustainability 2021, 13, 4041 8 of 21
iron, zinc, and vitamin A respectively. Therefore, food consumption via markets andown farm impact pathways helped households attain about 72%, 50%, 17%, and 60% oftheir daily intake for energy, iron, zinc, and vitamin A respectively based on averages inTable 2. Essentially, with each Uganda shilling (UGX) spent via markets, consumption wasassociated with increments of 0.007% (0.181 kilocalories), 0.005% (0.001 milligrams), 0.007%(0.001 milligrams), and 0.001% (0.004 rae-mcg) in daily energy, iron, zinc, and vitamin Arespectively. However, a similar size of expenditure via own-farm production consumptionwas associated with increments of 0.055% (1.441 kilocalories), 0.061% (0.012 milligrams),0.059% (0.008 milligrams), and 0.089% (0.0297 rae-mcg) in daily energy, iron, zinc, andvitamin A respectively.
Table 4. Regression results for impact pathways of FPD on daily energy and micronutrient intake.
Variables
Energy(Kilocalories)
Iron(Milligrams)
Zinc(Milligrams)
Vitamin A(Rae−Mcg)
MK (1) MK (2) MK (3) MK (4)
Farm Production Diversity (biodiversity index) 1.758 0.050 0.047 ** 1.962 **(3.788) (0.031) (0.022) (0.920)
Daily per AE consumption via markets (Uganda shilling) 0.181 *** 0.001 *** 0.001 *** 0.004 *(0.011) (8 × 10⁻⁵) (6 × 10⁻⁵) (0.002)
Daily per AE consumption from home production (Uganda shilling) 1.441 *** 0.012 *** 0.008 *** 0.297 ***(0.122) (0.001) (0.001) (0.024)
Distance nearest main market (kilometers) −5.469 −0.064 * −0.051 ** −2.286 **(4.576) (0.034) (0.025) (1.114)
Head uses mobile phone (dummy) −58.08 −0.806 * −0.265 −9.416(51.44) (0.427) (0.304) (13.50)
Household size (adult equivalent) −112.8 *** −0.802 *** −0.403 *** −10.38 **(18.82) (0.146) (0.103) (4.244)
Male head (dummy) 309.7 *** 1.857 ** 1.804 *** 2.094(111.4) (0.800) (0.660) (31.19)
Age of head (years) −1.416 0.005 −0.034 0.608(8.259) (0.069) (0.046) (2.287)
Age squared of head (years) −0.053 3 × 10⁻⁵ 7 × 10⁻⁵ −0.009(0.105) (0.001) (0.001) (0.031)
Education of head (years) −51.98 *** −0.381 *** −0.412 *** 0.340(17.98) (0.142) (0.104) (4.392)
Educ. squared of head (years) 4.650 *** 0.033 *** 0.031 *** 0.158(1.511) (0.012) (0.009) (0.347)
Shock experience (dummy) −79.47 ** −0.348 −0.420 * −19.31 *(38.32) (0.312) (0.232) (10.29)
Land size (acres by GPS) −0.738 −4 × 10⁻⁵ 0.001 −0.182(3.100) (0.028) (0.019) (0.765)
Land size squared (acres by GPS) −0.002 −2 × 10⁻⁵ −2 × 10⁻⁵ −0.0002(0.005) (4 × 10⁻⁵) (3 × 10⁻⁵) (0.001)
Year 201014.86 −0.006 −0.254 −24.18 ***
(34.57) (0.276) (0.202) (9.125)
Year 2011−86.24 ** −0.670 ** −0.951 *** −32.36 ***
(35.73) (0.286) (0.212) (9.157)Mean values Yes Yes Yes Yes
3921 *** 15.36 *** 7.858 *** 327.3 ***Constant (148.0) (1.178) (0.844) (33.22)
Observations 8574 8574 8574 8574No. of households 3258 3258 3258 3258Wald Chi2 value 694.19 *** 579.94 *** 947.38 *** 325.80 ***
Robust standard errors in parentheses; *** p < 0.01, ** p < 0.05, * p < 0.1; AE is adult equivalent; GPS is Global Positioning System; rae-mcg isRetinal Activity Equivalents—micrograms; MK is Mundlak estimation. See Appendix B for details.
In Table 5, we present results after estimating Equation (3). FPD is negatively andsignificantly associated with daily energy and micronutrient intake sourced via the marketsconsumption pathway, whereas such impact is positive and significant for these nutritionoutcomes sourced via the own farm consumption pathway.

Sustainability 2021, 13, 4041 9 of 21
There were also differential impacts of gender towards nutrition outcomes vis-à-visconsumption pathways. Gender (household male headship) effects with regards to energy,iron, and zinc intake were more pronounced via the market consumption pathway.
Table 5. Differential FPD impacts on daily energy, iron, zinc, and vitamin A intake given consumption pathways.
Variables
Energy (Kilocalories) Iron (Milligrams) Zinc (Milligrams) Vitamin A (Rae-Mcg)
Markets Own Farm Markets Own Farm Markets Own Farm Markets Own Farm
MK (1) MK (2) MK (3) MK (4) MK (5) MK (6) MK (7) MK (8)
FPD (biodiversity index) −74.58 *** 20.75 *** −0.208 *** 0.179 *** −0.099 *** 0.098 *** −2.535 *** 4.057 ***(10.94) (2.423) (0.029) (0.023) (0.020) (0.012) (0.507) (0.927)
Distance to nearest market(kilometers)
−8.043 4.222 * −0.017 0.014 −0.015 0.014 0.291 −2.215(10.43) (2.450) (0.028) (0.026) (0.019) (0.013) (0.995) (1.636)
Head uses mobile phone(dummy)
104.7 −34.70 0.224 −0.391 0.272 −0.158 4.798 −10.80(142.4) (33.79) (0.378) (0.303) (0.256) (0.161) (7.200) (14.71)
Household size (Adultequivalents)
−358.7 *** −98.36 *** −0.519 *** −0.932 *** −0.434 *** −0.493 *** −13.84 *** −7.768(45.89) (10.69) (0.114) (0.099) (0.077) (0.053) (2.444) (4.779)
Male heads (dummy) 444.7 111.8 1.232 * 0.652 0.825 * 0.529 1.182 11.39(280.4) (76.69) (0.740) (0.690) (0.495) (0.374) (14.91) (36.30)
Age of head (years) 15.90 1.514 0.005 0.059 0.008 0.021 0.824 0.368(21.55) (4.757) (0.058) (0.047) (0.039) (0.024) (1.499) (2.331)
Age squared of head (years) −0.215 −0.002 −9 × 10⁻⁵ −0.0003 −8 × 10⁻⁵ −0.0002 −0.016 0.008(0.263) (0.060) (0.001) (0.001) (0.001) (0.0003) (0.022) (0.027)
Education of head (years) −33.75 −8.453 −0.090 −0.115 −0.123 −0.049 −2.612 3.381(47.40) (11.47) (0.124) (0.106) (0.084) (0.056) (2.686) (4.895)
Education squared of head(years)
6.028 0.535 0.012 0.007 0.012 * 0.003 0.467 ** −0.357(3.925) (1.002) (0.010) (0.009) (0.007) (0.005) (0.226) (0.397)
Shock experience (dummy) 5.254 −54.36 ** −0.009 −0.389 * −0.009 −0.227 * −5.863 −9.351(103.6) (24.82) (0.273) (0.228) (0.189) (0.119) (6.238) (10.59)
Land size (acres by GPS) 5.714 −2.876 0.024 −0.027 * 0.017 −0.015 ** 0.216 −1.185 *(6.710) (1.777) (0.020) (0.015) (0.013) (0.007) (0.779) (0.660)
Land size squared (acres byGPS)
−0.015 0.004 −5 × 10⁻⁵ 4 × 10⁻⁵ * −4 × 10−5 * 2 × 10−5 ** −5 × 10⁻⁵ 0.001(0.009) (0.003) (3 × 10⁻⁵) (2 × 10⁻⁵) (2 × 10⁻⁵) (1 × 10⁻⁵) (0.001) (0.001)
Year 2010−25.37 61.01 *** −0.232 0.363 * −0.219 0.304 *** −11.41 ** −17.34 *(92.81) (23.16) (0.248) (0.210) (0.169) (0.111) (5.689) (10.08)
Year 2011184.9 * −18.24 0.371 −0.220 0.173 −0.078 −9.840 * −19.02 *(95.15) (23.09) (0.252) (0.211) (0.171) (0.110) (5.869) (9.923)
Mean values Yes Yes Yes Yes Yes Yes Yes YesConstant 13,104 *** 1632 *** 18.97 *** 9.411 *** 11.15 *** 3.092 *** 250.4 *** 270.6 ***
(437.1) (103.4) (1.183) (0.927) (0.829) (0.499) (19.40) (37.68)
Observations 8310 6373 8310 6373 8310 6373 8310 6373No. of households 3207 2633 3207 2633 3207 2633 3207 2633Wald Chi2 value 929.55 *** 278.44 *** 542.38 *** 275.79 *** 623.55 *** 275.61 *** 347.1 *** 337.03 ***
Robust standard errors in parentheses; *** p < 0.01, ** p < 0.05, * p < 0.1; FPD is farm production diversity; GPS is Global Positioning System;MK is Mundlak estimation; rae-mcg is Retinal Activity Equivalents—micrograms. See Appendix C for details.
4. Discussion4.1. Descriptive Results Discussions
High consumption expenditure on market-sourced foods does not necessarily meanthat food volumes from respective sources followed a similar trend but may only reflectprices; moreover, market prices are usually higher than farm gate prices. However, by thefact that most household heads had not studied beyond the primary level of educationcould point to high sample illiteracy levels, which is typical of subsistence farmers. Onthe other hand, the high micronutrient deficiency levels depicted a serious hidden hungerproblem. Moreover, this has been persistent, for instance, the Uganda demographic house-hold survey (UDHS) of 2006 in a supplementary study revealed that 88% of women wereiron deficient [7]. The disparity in dominance of sources (markets or own farm production)of micronutrients may be explained by samples’ cultural and social behavior, concurringwith evidence which points to home production of fruits and vegetables (dominant sourcesof vitamin A) being associated with more diversity in dietary intakes [14,15]. Foods likevegetables and fruits are also not usually bought by most consumers in Uganda [7]. Fur-thermore, consumption of such foods is usually seen as a reflection of poverty, while other

Sustainability 2021, 13, 4041 10 of 21
households would mostly grow them for selling [14]. However, we may not conclude thatmarkets are the more reliable consumption pathway for nutrition outcomes. Moreover,as a novelty, to the best of our knowledge, this is the first study exploring disaggregationof daily household energy and micronutrient intake by source. Such disaggregation isinstrumental in establishing appropriate sustainable interventions.
4.2. Empirical Results Discussions4.2.1. The Impact of FPD on Daily Household Energy and Micronutrient Intake
Although the associated FPD impact on nutrition outcomes was positive and signifi-cant, it was less pronounced on daily household energy, iron, zinc, and vitamin A intake,respectively. The trend may not be surprising since, generally, the most consumed foodswere the energy dense ones (staple foods), hence the unit incremental effects are smallest forenergy, and largest for micronutrients because micronutrient rich foods are less consumed,most notably vitamin A. Our findings are in agreement with McKinney [30] who found thatUgandan households dominantly consume staples (cereals, roots and tubers or banana)on a daily basis, but micronutrient dense foods like milk, eggs, meat, vegetables, and fruitwere consumed infrequently. FANTA-2 [7] also found that meals were inadequately variedin Uganda especially for children, and fruits and vegetables were rarely fed to children.The positive effects of age and education of the household heads on nutrition outcomescould be achieved through the income pathway for education, and the knowledge pathwayfor old age. With better education, households can access better paying jobs and earn betterincomes to smooth consumption, while with old age, household heads garner experienceon nutrition concepts which may inform proper allocation of resources to optimize nutri-tional benefits. However, with more persons, available food per capita decreases, hencereductions in nutrition outcomes. Positive male gender effects on nutrition outcomes couldbe related to increasingly available nutrition information. Besides, households with malesusually have better incomes since both man and woman contribute, unlike female-headedhouseholds where males have either died or divorced.
4.2.2. Impact Pathways of FPD on Daily Energy and Micronutrient Intake
When we control for consumption pathways, the effect of FPD on daily householdenergy and micronutrient intake ceases to be significant (energy and iron), and/or reducesin magnitude and significance level (zinc and vitamin A). This confirms that indeed marketsor own farm impact pathways are FPD impact pathways for household nutrition outcomes.Moreover, daily consumption from either source exhibited a strong significant and positiveassociation with nutrition outcomes. However, by the fact that FPD remained positiveand, in some instances, significant after controlling for studied consumption pathways, itimplies that there are other pathways through which FPD impacts nutrition outcomes, forinstance, nutrition information and knowledge pathways.
4.2.3. Differential FPD Impacts on Daily Energy, Iron, Zinc, and Vitamin A Intake GivenConsumption Pathways
The fact that FPD effects on nutrition outcomes via the market consumption pathwaywere negative but positive via their own farm production pathway is not surprising. Oursample was predominantly made of subsistence smallholder farmers, who do not sellproduce to markets for income towards food consumption. Instead, when such producewas sold, as Kabunga et al. [14] established, incomes were mostly diverted to other non-foodconsumption needs like: school fees, housing, healthcare, etc. On the other hand, becausesubsistence farmers mostly consumed what they produced, the strong positive associationswith nutrition outcomes via their own farm production pathway were logical. Essentially,FPD reduced household market reliance for both daily energy and micronutrient intake,while FPD enhanced daily intake of energy and micronutrients via own farm produceconsumption pathway. Therefore, indeed, differential FPD impacts on daily energy andmicronutrient intake vis-à-vis the consumption pathway do exist, and are more pronounced
Sustainability 2021, 13, 4041 11 of 21
via their own farm production consumption pathway. This is in agreement with studiesin [3,6] who established that most households in Uganda, especially rural ones, did mostlyconsume from their own production sources. To the best of our knowledge, this is the firststudy exploring differential effects of FPD vis-à-vis consumption pathways for energy andmicronutrient intake, more so while using panel data. Related efforts have been done byIslam et al. [16] but they only explored FPD associations with household dietary diversityscores (HDDS). However, our results should not be generalized since Sibhatu et al. [8]found markets to contribute more than own farm reliance to nutrition outcomes. Therefore,country-specific conditions, for instance, urbanization, dominance of the sample (ruralvs. urban) etc., could be important in determining the nature of FPD impacts via theseconsumption pathways on nutrition outcomes. Nevertheless, for the case of Uganda, FPDis more important in contributing to nutrition outcomes via their own farm productionconsumption pathway.
On the other hand, the male gender’s differential impacts that are also more pro-nounced via the market consumption pathway is an interesting finding and aligns withliterature that men’s household dominance is more pronounced when farm or off-farmactivities are commercialized [31–33]. The comparative advantage from frequenting townsmay favor males to access farm products’ markets with competitive prices, thus earningbetter incomes that are used to smooth food consumption and hence nutrition.
4.2.4. Robustness Checks and Limitations of the Study
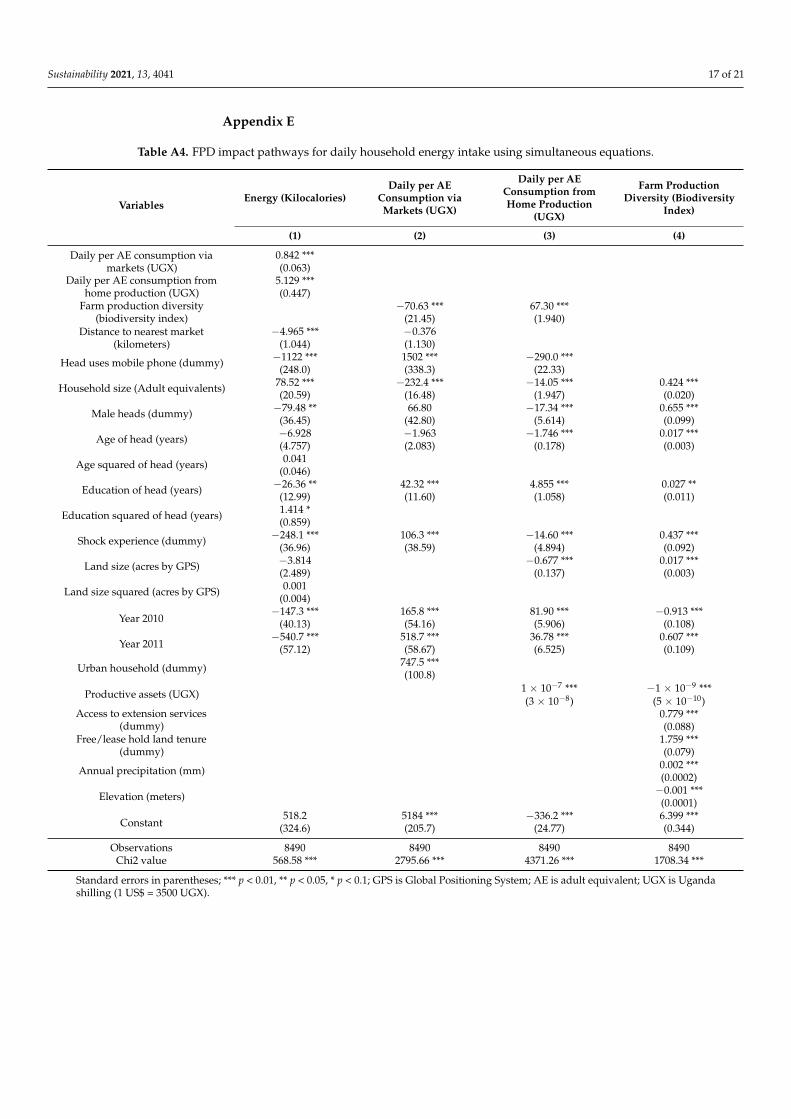
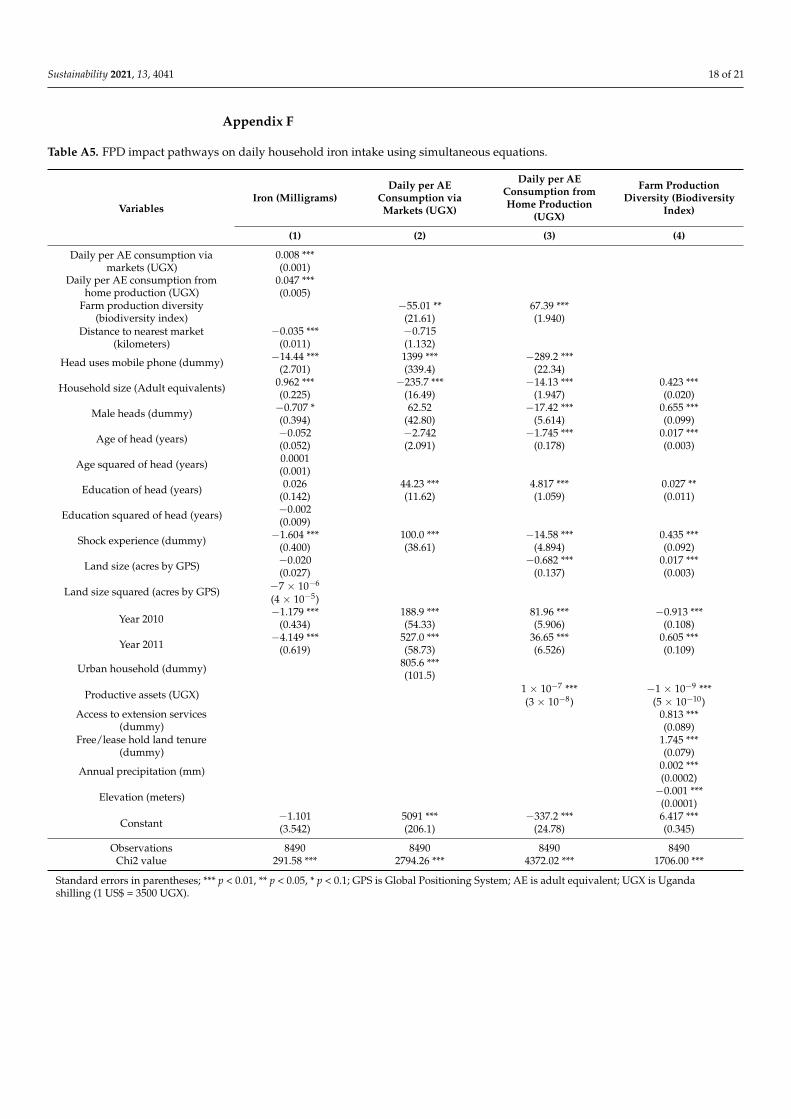
We check the robustness of our results on importance of consumption pathways byusing a different analytical methodology, a three-stage least squares (3SLS) technique elabo-rated in Appendix D. We present detailed results in Appendix E, Appendix F, Appendix G,Appendix H, but briefly discuss them here. Both FPD impact consumption pathways werestrongly associated with a positive and significant impact on daily household energy intake.The own farm production pathway produced the heavier impact, with increments of 5.1(0.4 percentage points) as opposed to 0.8 kilocalories per AE (0.1 percentage points) addedfor each shilling spent via markets, see Appendix E. With regards to iron intake, again,both FPD impact consumption pathways were associated with significant increases in dailyiron intake, and still, the own farm production pathway showed a stronger impact, with0.05 milligrams of iron (0.4 percentage points) added for each shilling spent via own farmproduction consumption, as opposed to 0.01 milligrams (0.1 percentage points) addedfrom an equal expenditure via markets, see Appendix F. With regards to zinc, still bothFPD impact consumption pathways were associated with a positive and significant impacton daily intake, and still, the impact was stronger via the own farm production pathway,to tunes of 0.02 milligrams of zinc (0.3 percentage points) added for each shilling spentvia own farm production consumption. This is opposed to only 0.004 milligrams (0.04percentage points) added for each shilling spent via markets, see Appendix G. The patterndepicted by energy, iron, and zinc vis-à-vis FPD impact consumption pathways, is similarto that found by Islam et al. [16] who studied FPD and household dietary diversity scores.Moreover, coefficients interpreted in our main results are more conservative than thesefrom robustness checks.
However, with regards to vitamin A, there was a slight diversion in the trend. Thetwo FPD consumption pathways impacted daily vitamin A intake differently. Whereas,each shilling spent via the own farm consumption pathway was associated with a positiveand significant impact (0.97 rae-mcg, implying a 0.4 percentage point increment) on dailyvitamin A intake, equal increments via market consumption expenditure bore an associatednegative impact (0.10 rae-mcg, implying a 0.1 percentage point decrease). This may be dueto the fact that vitamin A dense foods were mostly produced on farm yet buying this forconsumption was largely luxurious [7,14,15]. See Appendix G.
As a limitation to the study, generation of nutrition outcomes required a lot of heavycomputations, hence could not consider other important macro and micronutrients. Repeti-tive computations that also required strict consistence could be liable to mistakes. However,
Sustainability 2021, 13, 4041 12 of 21
using the coding programs of Stata SE 16.0 enabled us to simplify the computation loadthat would be frequently easily verified to limit mistakes.
5. Conclusions
The study used panel data to study the nexus of farm production diversity (FPD) andnutrition (energy, iron, zinc, and vitamin A intake). At least 50% of sample householdswere deficient in energy, iron, zinc, or vitamin A vis-à-vis FAO recommended thresholds.Deficiencies were more pronounced for zinc (66%) and vitamin A (85%). FPD was posi-tively associated with daily energy, iron, zinc, and vitamin A intake. Markets and own farmproduction were important impact pathways through which FPD influenced nutrition out-comes. However, relatively larger increments were attained via the own farm productionconsumption pathway. Therefore, for Uganda, investments focusing on improving house-hold nutrition outcomes via own farm production could yield better nutrition outcomesthan those focused on markets. Remoteness and relatively poor market infrastructurerenders own farm reliance more beneficial. Strong gender effects with regards to nutritionoutcomes do also exist. Male-headed households were associated with better nutritionoutcomes, which were mostly realized via the market consumption pathway. However,our results may not be generalized since some evidence from other countries has pointedto markets being more important towards gains in nutrition outcomes. We also exploredthe data with a limited number of macro and micronutrients; therefore, extending thescope to other nutrition outcomes would enable a better understanding of the linkagesbetween FPD and household nutrition more comprehensively. Nevertheless, with the rigorexhibited in analyzing this panel data, we are optimistic that our conclusions are binding,especially for Uganda and countries of similar contextual characteristics.
Author Contributions: H.S. and S.N. Conceptualized and designed the research, analyzed the dataand wrote the first draft of the manuscript. Y.D.U.; L.N.; and S.P.D. reviewed the manuscript andcontributed to writing of discussions and appropriateness of analytical methods. All authors haveread and agreed to the published version of the manuscript.
Funding: This research was funded by the African Economic Research Consortium (AERC) undergrant number RT17534. AERC did not participate in any way in the writing of the research, and theauthors have no other attachments to AERC.
Institutional Review Board Statement: We used secondary data and we were never in touch witheither humans or animals.
Data Availability Statement: Data used in this study was accessed from the World Bank’s Central DataCatalog for Living Standards Measurement Study—Integrated Survey on Agriculture (LMSA—ISA) forUganda, and is available online from https://microdata.worldbank.org/index.php/catalog#_r=1568635091798&collection=&country=&dtype=&from=1890&page=1&ps=&sid=&sk=LSMS%20Uganda&sort_by=rank&sort_order=desc&to=2019&topic=&view=s&vk (accessed on 20 December 2020).
Acknowledgments: We wish to express our deep appreciation to the African Economic ResearchConsortium (AERC) for the financial support to carry out this research under grant number RT17534.We are also grateful to the AERC resource persons, most notably Victor Okoruwa who was our focalperson, Damiano Manda who was managing Research at AERC, and members of AERC’s thematicGroup E (Agriculture, Nutrition, Climate change and Natural resource management) for variouscomments and suggestions that helped improve this study from its inception to completion. Weare also indebted to the anonymous referees who reviewed the paper and provided very usefulcomments and suggestions to enhance the overall quality of the paper. The findings made andopinions expressed in this paper are exclusively those of the authors. Authors are also solelyresponsible for content and any errors.
Conflicts of Interest: The authors declare no conflict of interest.
Sustainability 2021, 13, 4041 13 of 21
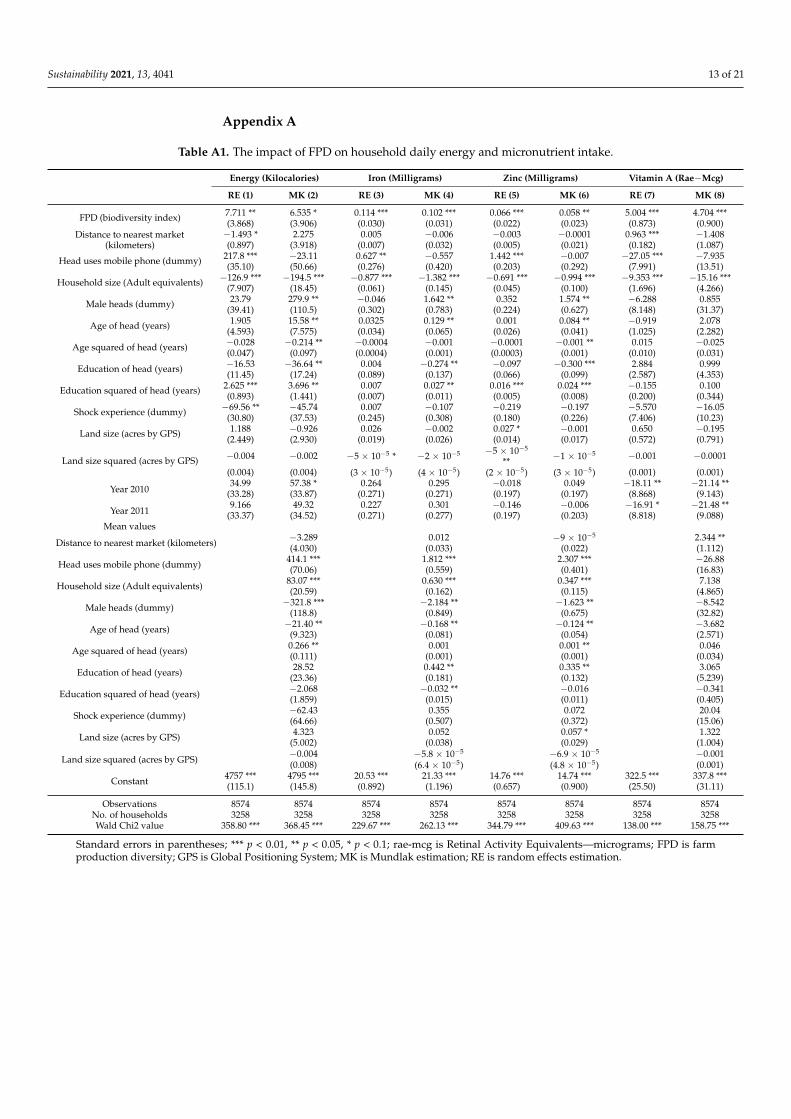
Appendix A
Table A1. The impact of FPD on household daily energy and micronutrient intake.
Energy (Kilocalories) Iron (Milligrams) Zinc (Milligrams) Vitamin A (Rae−Mcg)
RE (1) MK (2) RE (3) MK (4) RE (5) MK (6) RE (7) MK (8)
FPD (biodiversity index) 7.711 ** 6.535 * 0.114 *** 0.102 *** 0.066 *** 0.058 ** 5.004 *** 4.704 ***(3.868) (3.906) (0.030) (0.031) (0.022) (0.023) (0.873) (0.900)
Distance to nearest market(kilometers)
−1.493 * 2.275 0.005 −0.006 −0.003 −0.0001 0.963 *** −1.408(0.897) (3.918) (0.007) (0.032) (0.005) (0.021) (0.182) (1.087)
Head uses mobile phone (dummy) 217.8 *** −23.11 0.627 ** −0.557 1.442 *** −0.007 −27.05 *** −7.935(35.10) (50.66) (0.276) (0.420) (0.203) (0.292) (7.991) (13.51)
Household size (Adult equivalents) −126.9 *** −194.5 *** −0.877 *** −1.382 *** −0.691 *** −0.994 *** −9.353 *** −15.16 ***(7.907) (18.45) (0.061) (0.145) (0.045) (0.100) (1.696) (4.266)
Male heads (dummy) 23.79 279.9 ** −0.046 1.642 ** 0.352 1.574 ** −6.288 0.855(39.41) (110.5) (0.302) (0.783) (0.224) (0.627) (8.148) (31.37)
Age of head (years) 1.905 15.58 ** 0.0325 0.129 ** 0.001 0.084 ** −0.919 2.078(4.593) (7.575) (0.034) (0.065) (0.026) (0.041) (1.025) (2.282)
Age squared of head (years) −0.028 −0.214 ** −0.0004 −0.001 −0.0001 −0.001 ** 0.015 −0.025(0.047) (0.097) (0.0004) (0.001) (0.0003) (0.001) (0.010) (0.031)
Education of head (years) −16.53 −36.64 ** 0.004 −0.274 ** −0.097 −0.300 *** 2.884 0.999(11.45) (17.24) (0.089) (0.137) (0.066) (0.099) (2.587) (4.353)
Education squared of head (years) 2.625 *** 3.696 ** 0.007 0.027 ** 0.016 *** 0.024 *** −0.155 0.100(0.893) (1.441) (0.007) (0.011) (0.005) (0.008) (0.200) (0.344)
Shock experience (dummy) −69.56 ** −45.74 0.007 −0.107 −0.219 −0.197 −5.570 −16.05(30.80) (37.53) (0.245) (0.308) (0.180) (0.226) (7.406) (10.23)
Land size (acres by GPS) 1.188 −0.926 0.026 −0.002 0.027 * −0.001 0.650 −0.195(2.449) (2.930) (0.019) (0.026) (0.014) (0.017) (0.572) (0.791)
Land size squared (acres by GPS) −0.004 −0.002 −5 × 10⁻⁵ * −2 × 10⁻⁵ −5 × 10⁻⁵
** −1 × 10⁻⁵ −0.001 −0.0001
(0.004) (0.004) (3 × 10⁻⁵) (4 × 10⁻⁵) (2 × 10⁻⁵) (3 × 10⁻⁵) (0.001) (0.001)
Year 201034.99 57.38 * 0.264 0.295 −0.018 0.049 −18.11 ** −21.14 **
(33.28) (33.87) (0.271) (0.271) (0.197) (0.197) (8.868) (9.143)
Year 20119.166 49.32 0.227 0.301 −0.146 −0.006 −16.91 * −21.48 **
(33.37) (34.52) (0.271) (0.277) (0.197) (0.203) (8.818) (9.088)Mean values
−3.289 0.012 −9 × 10⁻⁵ 2.344 **Distance to nearest market (kilometers) (4.030) (0.033) (0.022) (1.112)414.1 *** 1.812 *** 2.307 *** −26.88Head uses mobile phone (dummy) (70.06) (0.559) (0.401) (16.83)83.07 *** 0.630 *** 0.347 *** 7.138Household size (Adult equivalents) (20.59) (0.162) (0.115) (4.865)−321.8 *** −2.184 ** −1.623 ** −8.542Male heads (dummy) (118.8) (0.849) (0.675) (32.82)−21.40 ** −0.168 ** −0.124 ** −3.682Age of head (years) (9.323) (0.081) (0.054) (2.571)0.266 ** 0.001 0.001 ** 0.046Age squared of head (years) (0.111) (0.001) (0.001) (0.034)
28.52 0.442 ** 0.335 ** 3.065Education of head (years) (23.36) (0.181) (0.132) (5.239)−2.068 −0.032 ** −0.016 −0.341Education squared of head (years) (1.859) (0.015) (0.011) (0.405)−62.43 0.355 0.072 20.04Shock experience (dummy) (64.66) (0.507) (0.372) (15.06)4.323 0.052 0.057 * 1.322Land size (acres by GPS) (5.002) (0.038) (0.029) (1.004)−0.004 −5.8 × 10⁻⁵ −6.9 × 10⁻⁵ −0.001
Land size squared (acres by GPS) (0.008) (6.4 × 10⁻⁵) (4.8 × 10⁻⁵) (0.001)4757 *** 4795 *** 20.53 *** 21.33 *** 14.76 *** 14.74 *** 322.5 *** 337.8 ***Constant (115.1) (145.8) (0.892) (1.196) (0.657) (0.900) (25.50) (31.11)
Observations 8574 8574 8574 8574 8574 8574 8574 8574No. of households 3258 3258 3258 3258 3258 3258 3258 3258Wald Chi2 value 358.80 *** 368.45 *** 229.67 *** 262.13 *** 344.79 *** 409.63 *** 138.00 *** 158.75 ***
Standard errors in parentheses; *** p < 0.01, ** p < 0.05, * p < 0.1; rae-mcg is Retinal Activity Equivalents—micrograms; FPD is farmproduction diversity; GPS is Global Positioning System; MK is Mundlak estimation; RE is random effects estimation.

Sustainability 2021, 13, 4041 14 of 21
Appendix B
Table A2. Impact pathways of FPD on household daily energy and micronutrient intake.
Energy(Kilocalories)
Iron(Milligrams)
Zinc(Milligrams)
Vitamin A(Rae−Mcg)
MK (1) MK (2) MK (3) MK (4)
Farm production diversity (biodiversity index) 1.758 0.050 0.047 ** 1.962 **(3.788) (0.031) (0.022) (0.920)
Daily per adult equivalent consumption via markets (Ugandashilling)
0.181 *** 0.001 *** 0.001 *** 0.004 *(0.011) (8 × 10⁻⁵) (6 × 10⁻⁵) (0.002)
Daily per adult equivalent consumption from home production(Uganda shilling)
1.441 *** 0.012 *** 0.008 *** 0.297 ***(0.122) (0.001) (0.001) (0.024)
Distance nearest market (kilometers) −5.469 −0.064 * −0.051 ** −2.286 **(4.576) (0.034) (0.025) (1.114)
Head uses mobile phone (dummy) −58.08 −0.806 * −0.265 −9.416(51.44) (0.427) (0.304) (13.50)
Household size (adult equivalent) −112.8 *** −0.802 *** −0.403 *** −10.38 **(18.82) (0.146) (0.103) (4.244)
Male heads (dummy) 309.7 *** 1.857 ** 1.804 *** 2.094(111.4) (0.800) (0.660) (31.19)
Age of head (years) −1.416 0.005 −0.034 0.608(8.259) (0.069) (0.046) (2.287)
Age squared of head (years) −0.053 3 × 10⁻⁵ 7 × 10⁻⁵ −0.009(0.105) (0.001) (0.001) (0.031)
Education of head (years) −51.98 *** −0.381 *** −0.412 *** 0.340(17.98) (0.142) (0.104) (4.392)
Educ. squared of head (years) 4.650 *** 0.033 *** 0.031 *** 0.158(1.511) (0.012) (0.009) (0.347)
Shock experience (dummy) −79.47 ** −0.348 −0.420 * −19.31 *(38.32) (0.312) (0.232) (10.29)
Land size (acres by GPS) −0.738 −4 × 10⁻⁵ 0.001 −0.182(3.100) (0.028) (0.019) (0.765)
Land size squared (acres by GPS) −0.002 −2 × 10⁻⁵ −2 × 10⁻⁵ −0.0002(0.005) (4 × 10⁻⁵) (3 × 10⁻⁵) (0.001)
Year 201014.86 −0.006 −0.254 −24.18 ***
(34.57) (0.276) (0.202) (9.125)
Year 2011−86.24 ** −0.670 ** −0.951 *** −32.36 ***
(35.73) (0.286) (0.212) (9.157)Mean values
3.501 0.061 * 0.048 * 2.864 **Distance nearest market (kilometers) (4.647) (0.034) (0.025) (1.136)315.4 *** 1.210 ** 1.406 *** −18.56Head uses mobile phone (dummy) (67.68) (0.549) (0.388) (16.74)33.76 * 0.264 * 0.019 2.247Household size (adult equivalent) (20.41) (0.159) (0.113) (4.808)
−369.5 *** −2.534 *** −1.959 *** −12.27Male heads (dummy) (118.2) (0.857) (0.695) (32.58)−9.029 −0.078 −0.037 −2.614Age of head (years) (9.408) (0.081) (0.054) (2.542)0.151 0.001 0.001 0.032Age squared of head (years) (0.114) (0.001) (0.001) (0.033)36.06 0.462 ** 0.421 *** 0.013Education of head (years) (22.98) (0.180) (0.130) (5.222)
−3.404 * −0.039 *** −0.029 *** −0.071Educ. squared of head (years) (1.848) (0.015) (0.011) (0.403)−70.67 0.268 0.115 13.27Shock experience (dummy) (61.18) (0.486) (0.346) (14.86)1.005 0.024 0.041 0.492Land size (acres by GPS) (4.885) (0.038) (0.028) (0.914)0.001 −2 × 10⁻⁵ −5 × 10⁻⁵ 5 × 10⁻⁵
Land size squared (acres by GPS) (0.007) (7 × 10⁻⁵) (5 × 10⁻⁵) (0.001)3921 *** 15.36 *** 7.858 *** 327.3 ***Constant (148.0) (1.178) (0.844) (33.22)
Observations 8574 8574 8574 8574No. of households 3258 3258 3258 3258Wald Chi2 value 694.19 *** 579.94 *** 947.38 *** 325.80 ***
Robust standard errors in parentheses; *** p < 0.01, ** p < 0.05, * p < 0.1; rae-mcg is Retinal Activity Equivalents—micrograms; GPS is GlobalPositioning System; MK is Mundlak estimation.
Sustainability 2021, 13, 4041 15 of 21
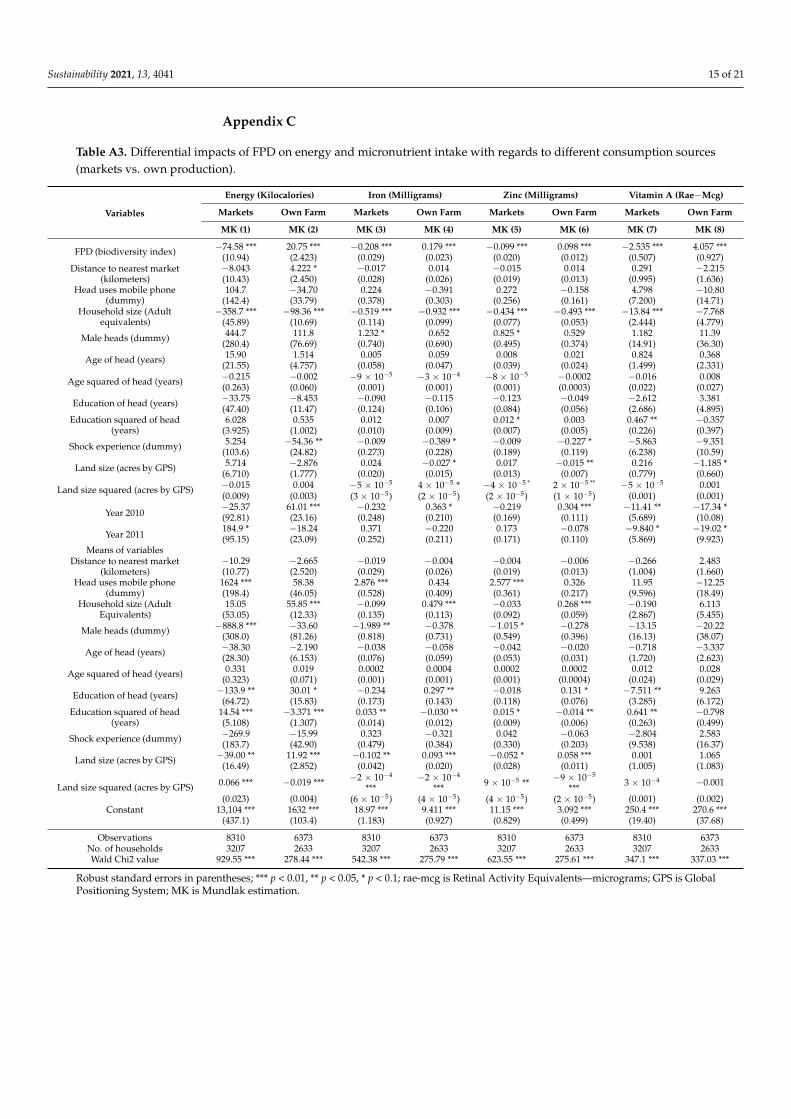
Appendix C
Table A3. Differential impacts of FPD on energy and micronutrient intake with regards to different consumption sources(markets vs. own production).
Variables
Energy (Kilocalories) Iron (Milligrams) Zinc (Milligrams) Vitamin A (Rae−Mcg)
Markets Own Farm Markets Own Farm Markets Own Farm Markets Own Farm
MK (1) MK (2) MK (3) MK (4) MK (5) MK (6) MK (7) MK (8)
FPD (biodiversity index) −74.58 *** 20.75 *** −0.208 *** 0.179 *** −0.099 *** 0.098 *** −2.535 *** 4.057 ***(10.94) (2.423) (0.029) (0.023) (0.020) (0.012) (0.507) (0.927)
Distance to nearest market(kilometers)
−8.043 4.222 * −0.017 0.014 −0.015 0.014 0.291 −2.215(10.43) (2.450) (0.028) (0.026) (0.019) (0.013) (0.995) (1.636)
Head uses mobile phone(dummy)
104.7 −34.70 0.224 −0.391 0.272 −0.158 4.798 −10.80(142.4) (33.79) (0.378) (0.303) (0.256) (0.161) (7.200) (14.71)
Household size (Adultequivalents)
−358.7 *** −98.36 *** −0.519 *** −0.932 *** −0.434 *** −0.493 *** −13.84 *** −7.768(45.89) (10.69) (0.114) (0.099) (0.077) (0.053) (2.444) (4.779)
Male heads (dummy) 444.7 111.8 1.232 * 0.652 0.825 * 0.529 1.182 11.39(280.4) (76.69) (0.740) (0.690) (0.495) (0.374) (14.91) (36.30)
Age of head (years) 15.90 1.514 0.005 0.059 0.008 0.021 0.824 0.368(21.55) (4.757) (0.058) (0.047) (0.039) (0.024) (1.499) (2.331)
Age squared of head (years) −0.215 −0.002 −9 × 10⁻⁵ −3 × 10⁻⁴ −8 × 10⁻⁵ −0.0002 −0.016 0.008(0.263) (0.060) (0.001) (0.001) (0.001) (0.0003) (0.022) (0.027)
Education of head (years) −33.75 −8.453 −0.090 −0.115 −0.123 −0.049 −2.612 3.381(47.40) (11.47) (0.124) (0.106) (0.084) (0.056) (2.686) (4.895)
Education squared of head(years)
6.028 0.535 0.012 0.007 0.012 * 0.003 0.467 ** −0.357(3.925) (1.002) (0.010) (0.009) (0.007) (0.005) (0.226) (0.397)
Shock experience (dummy) 5.254 −54.36 ** −0.009 −0.389 * −0.009 −0.227 * −5.863 −9.351(103.6) (24.82) (0.273) (0.228) (0.189) (0.119) (6.238) (10.59)
Land size (acres by GPS) 5.714 −2.876 0.024 −0.027 * 0.017 −0.015 ** 0.216 −1.185 *(6.710) (1.777) (0.020) (0.015) (0.013) (0.007) (0.779) (0.660)
Land size squared (acres by GPS) −0.015 0.004 −5 × 10⁻⁵ 4 × 10⁻⁵ * −4 × 10−5 * 2 × 10−5 ** −5 × 10⁻⁵ 0.001(0.009) (0.003) (3 × 10⁻⁵) (2 × 10⁻⁵) (2 × 10⁻⁵) (1 × 10⁻⁵) (0.001) (0.001)
Year 2010−25.37 61.01 *** −0.232 0.363 * −0.219 0.304 *** −11.41 ** −17.34 *(92.81) (23.16) (0.248) (0.210) (0.169) (0.111) (5.689) (10.08)
Year 2011184.9 * −18.24 0.371 −0.220 0.173 −0.078 −9.840 * −19.02 *(95.15) (23.09) (0.252) (0.211) (0.171) (0.110) (5.869) (9.923)
Means of variablesDistance to nearest market
(kilometers)−10.29 −2.665 −0.019 −0.004 −0.004 −0.006 −0.266 2.483(10.77) (2.520) (0.029) (0.026) (0.019) (0.013) (1.004) (1.660)
Head uses mobile phone(dummy)
1624 *** 58.38 2.876 *** 0.434 2.577 *** 0.326 11.95 −12.25(198.4) (46.05) (0.528) (0.409) (0.361) (0.217) (9.596) (18.49)
Household size (AdultEquivalents)
15.05 55.85 *** −0.099 0.479 *** −0.033 0.268 *** −0.190 6.113(53.05) (12.33) (0.135) (0.113) (0.092) (0.059) (2.867) (5.455)
Male heads (dummy) −888.8 *** −33.60 −1.989 ** −0.378 −1.015 * −0.278 −13.15 −20.22(308.0) (81.26) (0.818) (0.731) (0.549) (0.396) (16.13) (38.07)
Age of head (years) −38.30 −2.190 −0.038 −0.058 −0.042 −0.020 −0.718 −3.337(28.30) (6.153) (0.076) (0.059) (0.053) (0.031) (1.720) (2.623)
Age squared of head (years) 0.331 0.019 0.0002 0.0004 0.0002 0.0002 0.012 0.028(0.323) (0.071) (0.001) (0.001) (0.001) (0.0004) (0.024) (0.029)
Education of head (years) −133.9 ** 30.01 * −0.234 0.297 ** −0.018 0.131 * −7.511 ** 9.263(64.72) (15.83) (0.173) (0.143) (0.118) (0.076) (3.285) (6.172)
Education squared of head(years)
14.54 *** −3.371 *** 0.033 ** −0.030 ** 0.015 * −0.014 ** 0.641 ** −0.798(5.108) (1.307) (0.014) (0.012) (0.009) (0.006) (0.263) (0.499)
Shock experience (dummy) −269.9 −15.99 0.323 −0.321 0.042 −0.063 −2.804 2.583(183.7) (42.90) (0.479) (0.384) (0.330) (0.203) (9.538) (16.37)
Land size (acres by GPS) −39.00 ** 11.92 *** −0.102 ** 0.093 *** −0.052 * 0.058 *** 0.001 1.065(16.49) (2.852) (0.042) (0.020) (0.028) (0.011) (1.005) (1.083)
Land size squared (acres by GPS) 0.066 *** −0.019 *** −2 × 10⁻⁴
***−2 × 10⁻⁴
*** 9 × 10⁻⁵ ** −9 × 10⁻⁵
*** 3 × 10⁻⁴ −0.001
(0.023) (0.004) (6 × 10⁻⁵) (4 × 10⁻⁵) (4 × 10⁻⁵) (2 × 10⁻⁵) (0.001) (0.002)Constant 13,104 *** 1632 *** 18.97 *** 9.411 *** 11.15 *** 3.092 *** 250.4 *** 270.6 ***
(437.1) (103.4) (1.183) (0.927) (0.829) (0.499) (19.40) (37.68)
Observations 8310 6373 8310 6373 8310 6373 8310 6373No. of households 3207 2633 3207 2633 3207 2633 3207 2633Wald Chi2 value 929.55 *** 278.44 *** 542.38 *** 275.79 *** 623.55 *** 275.61 *** 347.1 *** 337.03 ***
Robust standard errors in parentheses; *** p < 0.01, ** p < 0.05, * p < 0.1; rae-mcg is Retinal Activity Equivalents—micrograms; GPS is GlobalPositioning System; MK is Mundlak estimation.
Sustainability 2021, 13, 4041 16 of 21
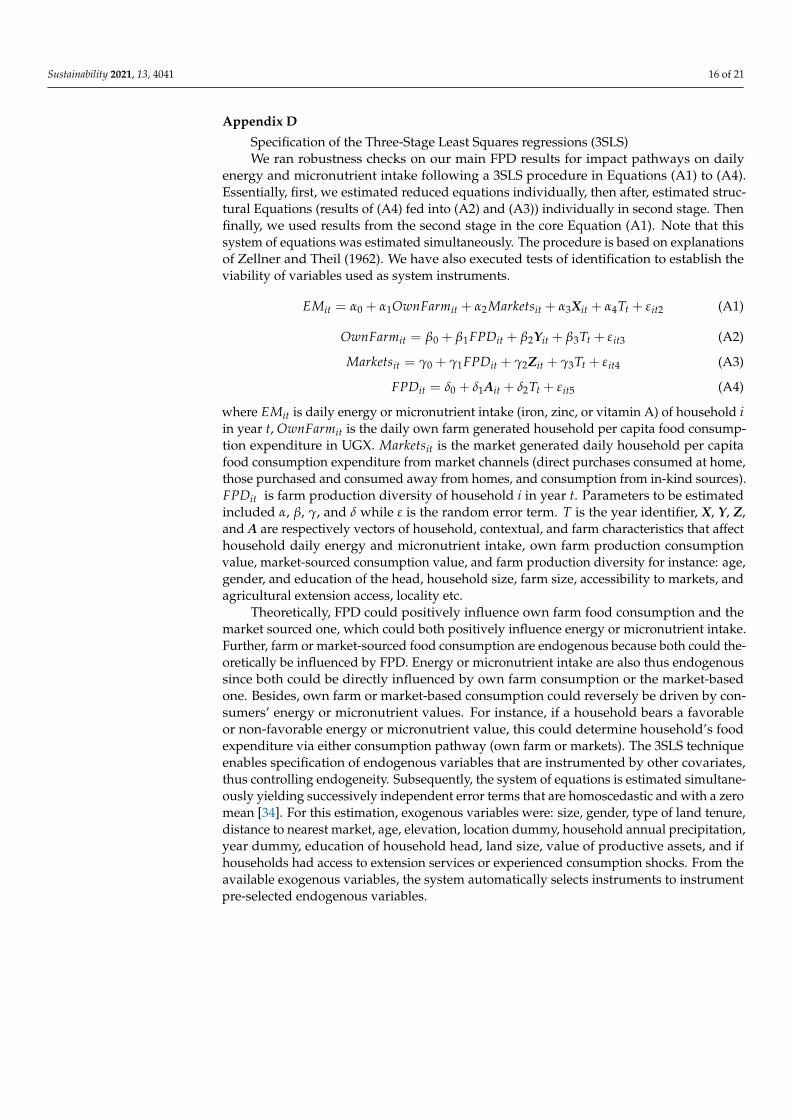
Appendix D
Specification of the Three-Stage Least Squares regressions (3SLS)We ran robustness checks on our main FPD results for impact pathways on daily
energy and micronutrient intake following a 3SLS procedure in Equations (A1) to (A4).Essentially, first, we estimated reduced equations individually, then after, estimated struc-tural Equations (results of (A4) fed into (A2) and (A3)) individually in second stage. Thenfinally, we used results from the second stage in the core Equation (A1). Note that thissystem of equations was estimated simultaneously. The procedure is based on explanationsof Zellner and Theil (1962). We have also executed tests of identification to establish theviability of variables used as system instruments.
EMit = α0 + α1OwnFarmit + α2Marketsit + α3Xit + α4Tt + εit2 (A1)
OwnFarmit = β0 + β1FPDit + β2Yit + β3Tt + εit3 (A2)
Marketsit = γ0 + γ1FPDit + γ2Zit + γ3Tt + εit4 (A3)
FPDit = δ0 + δ1Ait + δ2Tt + εit5 (A4)
where EMit is daily energy or micronutrient intake (iron, zinc, or vitamin A) of household iin year t, OwnFarmit is the daily own farm generated household per capita food consump-tion expenditure in UGX. Marketsit is the market generated daily household per capitafood consumption expenditure from market channels (direct purchases consumed at home,those purchased and consumed away from homes, and consumption from in-kind sources).FPDit is farm production diversity of household i in year t. Parameters to be estimatedincluded α, β, γ, and δ while ε is the random error term. T is the year identifier, X, Y, Z,and A are respectively vectors of household, contextual, and farm characteristics that affecthousehold daily energy and micronutrient intake, own farm production consumptionvalue, market-sourced consumption value, and farm production diversity for instance: age,gender, and education of the head, household size, farm size, accessibility to markets, andagricultural extension access, locality etc.
Theoretically, FPD could positively influence own farm food consumption and themarket sourced one, which could both positively influence energy or micronutrient intake.Further, farm or market-sourced food consumption are endogenous because both could the-oretically be influenced by FPD. Energy or micronutrient intake are also thus endogenoussince both could be directly influenced by own farm consumption or the market-basedone. Besides, own farm or market-based consumption could reversely be driven by con-sumers’ energy or micronutrient values. For instance, if a household bears a favorableor non-favorable energy or micronutrient value, this could determine household’s foodexpenditure via either consumption pathway (own farm or markets). The 3SLS techniqueenables specification of endogenous variables that are instrumented by other covariates,thus controlling endogeneity. Subsequently, the system of equations is estimated simultane-ously yielding successively independent error terms that are homoscedastic and with a zeromean [34]. For this estimation, exogenous variables were: size, gender, type of land tenure,distance to nearest market, age, elevation, location dummy, household annual precipitation,year dummy, education of household head, land size, value of productive assets, and ifhouseholds had access to extension services or experienced consumption shocks. From theavailable exogenous variables, the system automatically selects instruments to instrumentpre-selected endogenous variables.
Sustainability 2021, 13, 4041 17 of 21
Appendix E
Table A4. FPD impact pathways for daily household energy intake using simultaneous equations.
VariablesEnergy (Kilocalories)
Daily per AEConsumption viaMarkets (UGX)
Daily per AEConsumption fromHome Production
(UGX)
Farm ProductionDiversity (Biodiversity
Index)
(1) (2) (3) (4)
Daily per AE consumption viamarkets (UGX)
0.842 ***(0.063)
Daily per AE consumption fromhome production (UGX)
5.129 ***(0.447)
Farm production diversity(biodiversity index)
−70.63 *** 67.30 ***(21.45) (1.940)
Distance to nearest market(kilometers)
−4.965 *** −0.376(1.044) (1.130)
Head uses mobile phone (dummy) −1122 *** 1502 *** −290.0 ***(248.0) (338.3) (22.33)
Household size (Adult equivalents) 78.52 *** −232.4 *** −14.05 *** 0.424 ***(20.59) (16.48) (1.947) (0.020)
Male heads (dummy) −79.48 ** 66.80 −17.34 *** 0.655 ***(36.45) (42.80) (5.614) (0.099)
Age of head (years) −6.928 −1.963 −1.746 *** 0.017 ***(4.757) (2.083) (0.178) (0.003)
Age squared of head (years) 0.041(0.046)
Education of head (years) −26.36 ** 42.32 *** 4.855 *** 0.027 **(12.99) (11.60) (1.058) (0.011)
Education squared of head (years) 1.414 *(0.859)
Shock experience (dummy) −248.1 *** 106.3 *** −14.60 *** 0.437 ***(36.96) (38.59) (4.894) (0.092)
Land size (acres by GPS) −3.814 −0.677 *** 0.017 ***(2.489) (0.137) (0.003)
Land size squared (acres by GPS) 0.001(0.004)
Year 2010−147.3 *** 165.8 *** 81.90 *** −0.913 ***
(40.13) (54.16) (5.906) (0.108)
Year 2011−540.7 *** 518.7 *** 36.78 *** 0.607 ***
(57.12) (58.67) (6.525) (0.109)
Urban household (dummy) 747.5 ***(100.8)
Productive assets (UGX) 1 × 10⁻⁷ *** −1 × 10⁻⁹ ***(3 × 10⁻⁸) (5 × 10⁻¹⁰)
Access to extension services(dummy)
0.779 ***(0.088)
Free/lease hold land tenure(dummy)
1.759 ***(0.079)
Annual precipitation (mm) 0.002 ***(0.0002)
Elevation (meters) −0.001 ***(0.0001)
Constant518.2 5184 *** −336.2 *** 6.399 ***
(324.6) (205.7) (24.77) (0.344)
Observations 8490 8490 8490 8490Chi2 value 568.58 *** 2795.66 *** 4371.26 *** 1708.34 ***
Standard errors in parentheses; *** p < 0.01, ** p < 0.05, * p < 0.1; GPS is Global Positioning System; AE is adult equivalent; UGX is Ugandashilling (1 US$ = 3500 UGX).
Sustainability 2021, 13, 4041 18 of 21
Appendix F
Table A5. FPD impact pathways on daily household iron intake using simultaneous equations.
VariablesIron (Milligrams)
Daily per AEConsumption viaMarkets (UGX)
Daily per AEConsumption fromHome Production
(UGX)
Farm ProductionDiversity (Biodiversity
Index)
(1) (2) (3) (4)
Daily per AE consumption viamarkets (UGX)
0.008 ***(0.001)
Daily per AE consumption fromhome production (UGX)
0.047 ***(0.005)
Farm production diversity(biodiversity index)
−55.01 ** 67.39 ***(21.61) (1.940)
Distance to nearest market(kilometers)
−0.035 *** −0.715(0.011) (1.132)
Head uses mobile phone (dummy) −14.44 *** 1399 *** −289.2 ***(2.701) (339.4) (22.34)
Household size (Adult equivalents) 0.962 *** −235.7 *** −14.13 *** 0.423 ***(0.225) (16.49) (1.947) (0.020)
Male heads (dummy) −0.707 * 62.52 −17.42 *** 0.655 ***(0.394) (42.80) (5.614) (0.099)
Age of head (years) −0.052 −2.742 −1.745 *** 0.017 ***(0.052) (2.091) (0.178) (0.003)
Age squared of head (years) 0.0001(0.001)
Education of head (years) 0.026 44.23 *** 4.817 *** 0.027 **(0.142) (11.62) (1.059) (0.011)
Education squared of head (years) −0.002(0.009)
Shock experience (dummy) −1.604 *** 100.0 *** −14.58 *** 0.435 ***(0.400) (38.61) (4.894) (0.092)
Land size (acres by GPS) −0.020 −0.682 *** 0.017 ***(0.027) (0.137) (0.003)
Land size squared (acres by GPS) −7 × 10⁻⁶
(4 × 10⁻⁵)
Year 2010−1.179 *** 188.9 *** 81.96 *** −0.913 ***
(0.434) (54.33) (5.906) (0.108)
Year 2011−4.149 *** 527.0 *** 36.65 *** 0.605 ***
(0.619) (58.73) (6.526) (0.109)
Urban household (dummy) 805.6 ***(101.5)
Productive assets (UGX) 1 × 10⁻⁷ *** −1 × 10⁻⁹ ***(3 × 10⁻⁸) (5 × 10⁻¹⁰)
Access to extension services(dummy)
0.813 ***(0.089)
Free/lease hold land tenure(dummy)
1.745 ***(0.079)
Annual precipitation (mm) 0.002 ***(0.0002)
Elevation (meters) −0.001 ***(0.0001)
Constant−1.101 5091 *** −337.2 *** 6.417 ***(3.542) (206.1) (24.78) (0.345)
Observations 8490 8490 8490 8490Chi2 value 291.58 *** 2794.26 *** 4372.02 *** 1706.00 ***
Standard errors in parentheses; *** p < 0.01, ** p < 0.05, * p < 0.1; GPS is Global Positioning System; AE is adult equivalent; UGX is Ugandashilling (1 US$ = 3500 UGX).

Sustainability 2021, 13, 4041 19 of 21
Appendix G
Table A6. FPD impact pathways towards daily household zinc intake using simultaneous equations.
VariablesZinc (Milligrams)
Daily per AEConsumption viaMarkets (UGX)
Daily per AEConsumption fromHome Production
(UGX)
Farm ProductionDiversity (Biodiversity
Index)
(1) (2) (3) (4)
Daily per AE consumption viamarkets (UGX)
0.004 ***(0.0003)
Daily per AE consumption fromhome production (UGX)
0.019 ***(0.002)
Farm production diversity(biodiversity index)
−61.46 *** 67.35 ***(21.70) (1.940)
Distance to nearest market(kilometers)
−0.011 ** −0.547(0.005) (1.133)
Head uses mobile phone (dummy) −4.276 *** 1466 *** −289.8 ***(1.277) (340.0) (22.34)
Household size (Adult equivalents) 0.383 *** −235.3 *** −14.10 *** 0.423 ***(0.107) (16.49) (1.947) (0.020)
Male heads (dummy) −0.079 63.01 −17.38 *** 0.655 ***(0.185) (42.80) (5.614) (0.099)
Age of head (years) −0.025 −2.308 −1.748 *** 0.0167 ***(0.025) (2.095) (0.178) (0.003)
Age squared of head (years) 0.0001(0.0002)
Education of head (years) −0.058 42.68 *** 4.838 *** 0.027 **(0.067) (11.63) (1.059) (0.011)
Education squared of head (years) 0.003(0.005)
Shock experience (dummy) −0.799 *** 103.2 *** −14.59 *** 0.435 ***(0.189) (38.62) (4.894) (0.092)
Land size (acres by GPS) 0.002 −0.681 *** 0.017 ***(0.013) (0.137) (0.003)
Land size squared (acres by GPS) −1.9 × 10⁻⁵
(2.1 × 10⁻⁵)
Year 2010−0.793 *** 178.0 *** 81.95 *** −0.913 ***
(0.204) (54.43) (5.906) (0.108)
Year 2011−2.386 *** 520.4 *** 36.75 *** 0.605 ***
(0.292) (58.77) (6.526) (0.109)
Urban household (dummy) 774.5 ***(102.0)
Productive assets (UGX) 1 × 10⁻⁷ *** −1 × 10⁻⁹ ***(3 × 10⁻⁸) (5 × 10⁻¹⁰)
Access to extension services(dummy)
0.810 ***(0.089)
Free/lease hold land tenure(dummy)
1.746 ***(0.079)
Annual precipitation (mm) 0.002 ***(0.0002)
Elevation (meters) −0.001 ***(0.0002)
Constant−2.381 5121 *** −336.5 *** 6.427 ***(1.677) (206.4) (24.78) (0.345)
Observations 8490 8490 8490 8490Chi2 value 432.04 *** 2791.94 *** 4372.63 *** 1706.12 ***
Standard errors in parentheses; *** p < 0.01, ** p < 0.05; GPS is Global Positioning System; AE is adult equivalent; UGX is Uganda shilling (1US$ = 3500 UGX).

Sustainability 2021, 13, 4041 20 of 21
Appendix H
Table A7. FPD impact pathways towards daily household vitamin A intake using simultaneous equations.
VariablesVitamin A
(RAE—Micrograms)
Daily per AEConsumption via Markets
(UGX)
Daily per AEConsumption from Home
Production (UGX)
Farm Production Diversity(Biodiversity Index)
(1) (2) (3) (4)
Daily per AE consumption via markets(UGX)
−0.102 **(0.044)
Daily per AE consumption from homeproduction (UGX)
0.972 ***(0.302)
Farm production diversity (biodiversityindex)
−59.20 *** 67.38 ***(22.01) (1.940)
Distance to nearest market (kilometers) 1.862 *** −0.604(0.696) (1.137)
Head uses mobile phone (dummy) 223.8 1444 *** −289.6 ***(168.2) (342.1) (22.35)
Household size (Adult equivalents) −63.20 *** −235.5 *** −14.12 *** 0.423 ***(14.11) (16.51) (1.947) (0.020)
Male heads (dummy) −6.315 62.77 −17.40 *** 0.655 ***(24.06) (42.81) (5.614) (0.099)
Age of head (years) 0.246 −2.454 −1.747 *** 0.017 ***(3.303) (2.109) (0.178) (0.003)
Age squared of head (years) 0.002(0.032)
Education of head (years) −17.96 ** 43.19 *** 4.829 *** 0.027 **(8.908) (11.66) (1.059) (0.011)
Education squared of head (years) 1.991 ***(0.600)
Shock experience (dummy) −24.47 102.1 *** −14.59 *** 0.435 ***(24.54) (38.66) (4.894) (0.092)
Land size (acres by GPS) 1.435 −0.682 *** 0.017 ***(1.715) (0.137) (0.003)
Land size squared (acres by GPS) −0.003(0.003)
Year 2010−56.89 ** 181.7 *** 81.97 *** −0.913 ***
(26.53) (54.77) (5.906) (0.108)
Year 2011−57.21 522.6 *** 36.71 *** 0.605 ***(38.15) (58.90) (6.526) (0.109)
Urban household (dummy) 785.0 ***(103.5)
Productive assets (UGX) 1 × 10⁻⁷ *** −1 × 10⁻⁹ ***(3 × 10⁻⁸) (5 × 10⁻¹⁰)
Access to extension services (dummy) 0.814 ***(0.089)
Free/lease hold land tenure (dummy) 1.744 ***(0.079)
Annual precipitation (mm) 0.002 ***(0.0002)
Elevation (meters) −0.001 ***(0.0002)
Constant3435 *** 5110 *** −336.8 *** 6.409 ***(221.6) (207.3) (24.78) (0.346)
Observations 8490 8490 8490 8490Chi2 value 234.77 *** 2791.83 *** 4373.51 *** 1705.59 ***
Standard errors in parentheses; *** p < 0.01, ** p < 0.05; rae-mcg is Retinal Activity Equivalents—micrograms; GPS is Global PositioningSystem; AE is adult equivalent; UGX is Uganda shilling (1 US$ = 3500 UGX).
References1. WFP. World Hunger Map; WFP: Rome, Italy, 2019; Available online: https://docs.wfp.org/api/documents/WFP-0000108355
/download/?_ga=2.168856609.1887230557.1605775526-251624598.1597932958 (accessed on 19 November 2020).2. FAO; IFAD; UNICEF; WFP; WHO. The State of Food Security and Nutrition in the World 2019. In Safeguarding against Economic
Slowdowns and Downturns; FAO: Rome, Italy, 2019.3. Benson, T. Improving Nutrition as a Development Priority: Addressing under Nutrition in National Policy Processes in Sub-Saharan Africa;
Research Report 156; International Food Policy Research Institute (IFPRI): Washington, DC, USA, 2008; pp. 42–68.4. Godfray, H.C.J.; Beddington, J.R.; Crute, I.R.; Haddad, L.; Lawrence, D.; Muir, J.F.; Pretty, J.; Robinson, S.; Thomas, S.M.;
Toulmin, C.; et al. Food Security: The Challenge of Feeding 9 Billion People. Science 2010, 327, 812–818. [CrossRef] [PubMed]5. Haddinott, J. Agriculture, health, and nutrition: Towards conceptualizing the linkages. In Reshaping Agriculture for Nutrition
and Health; Fan, S., Pandya-Lorch, R., Eds.; International Food Policy Research Institute (IFPRI): Washington, DC, USA, 2012;Chapter 2; pp. 13–20. ISBN 978-0-8962-9673-2.
6. Webb, P.; Kennedy, E. Impacts of Agriculture on Nutrition: Nature of the evidence and research gaps. Food Nutr. Bull. 2014, 35,126–132. [CrossRef] [PubMed]
Sustainability 2021, 13, 4041 21 of 21
7. Food and Nutrition Technical Assistance II Project (FANTA-2). The Analysis of the Nutrition Situation in Uganda; FHI 360:Washington, DC, USA, 2010.
8. Sibhatu, K.T.; Krishna, V.V.; Qaim, M. Production diversity and dietary diversity in smallholder farm households. Proc. Natl.Acad. Sci. USA 2015, 112, 10657–10662. [CrossRef] [PubMed]
9. Koppmair, S.; Kassie, M.; Qaim, M. Farm production, market access and dietary diversity in Malawi. Public Health Nutr. 2017, 20,325–335. [CrossRef] [PubMed]
10. Sibhatu, K.T.; Qaim, M. Review: Meta-analysis of the association between production diversity, diets, and nutrition in smallholderfarm households. Food Policy 2018, 77, 1–18. [CrossRef]
11. Wanyama, R.; Gödecke, T.; Qaim, M. Food Security and Dietary Quality in African Slums. Sustainability 2019, 11, 5999. [CrossRef]12. Khonje, M.G.; Olivier, E.; Qaim, M. Effects of Modern Food Retailers on Adult and Child Diets and Nutrition. Nutrients 2020, 12,
1714. [CrossRef]13. Jones, A.D.; Shrinivas, A.; Bezner-Kerr, R. Farm production diversity is associated with greater household dietary diversity in
Malawi: Findings from nationally representative data. Food Policy 2014, 46, 1–12. [CrossRef]14. Kabunga, N.; Ghosh, S.; Griffiths, J. Can Smallholder Fruit and Vegetable Production Systems Improve Household Food Security and
Nutritional Status of Women? Evidence from Rural Uganda; (IFPRI Discussion Paper No. 01346); International Food Policy ResearchInstitute (IFPRI): Washington, DC, USA, 2014.
15. Whitney, C.W.; Luedeling, E.; Hensel, O.; Tabuti, J.R.S.; Krawinkel, M.; Gebauer, J.; Kehlenbeck, K. The role of home gardens forfood and nutrition security in Uganda. Hum. Ecol. 2018, 46, 497–514. [CrossRef]
16. Islam, A.H.M.S.; von Braun, J.; Thorne-Lyman, L.A.; Ahmed, U.A. Farm diversification and food and nutrition security inBangladesh: Empirical evidence from nationally representative household panel data. Food Secur. 2018, 10, 701–720. [CrossRef]
17. Sassi, M. Seasonality and Nutrition-Sensitive Agriculture in Kenya: Evidence from Mixed-Methods Research in Rural LakeNaivasha Basin. Sustainability 2019, 11, 6223. [CrossRef]
18. Sibhatu, K.T.; Qaim, M. Farm production diversity and dietary quality: Linkages and measurement issues. Food Secur. 2018, 10,47–59. [CrossRef]
19. Sekabira, H.; Nalunga, S. Farm Production Diversity: Is it Important for Dietary Diversity? Panel Data Evidence from Uganda.Sustainability 2020, 12, 1028. [CrossRef]
20. Fongar, A.; Gödecke, T.; Aseta, A.; Qaim, M. How well do different dietary and nutrition assessment tools match? Insights fromrural Kenya. Public Health Nutr. 2018, 22, 391–403. [CrossRef] [PubMed]
21. International Food Policy Research Institute (IFPRI). Global Nutrition Report 2016. From Promise to Impact: Ending Malnutrition by2030; IFPRI: Washington, DC, USA, 2016.
22. World Bank. Central Data Catalog: Living Standards Measurement Study, Uganda. Available online: https://microdata.worldbank.org/index.php/catalog#_r=1568635091798&collection=&country=&dtype=&from=1890&page=1&ps=&sid=&sk=LSMS%20Uganda&sort_by=rank&sort_order=desc&to=2019&topic=&view=s&vk= (accessed on 21 January 2017).
23. Di Falco, S.; Chavas, J.P. On crop biodiversity, risk exposure, and food security in the highlands of Ethiopia. Am. J. Agric. Econ.2009, 91, 599–611. [CrossRef]
24. UBOS. Statistical Abstract; Uganda Bureau of Statistics: Kampala, Uganda, 2015.25. Hotz, C.; Lubowa, A.; Sison, C.; Moursi, M.; Loechl, C.A. Food Composition Table for Central and Eastern Uganda. Harvest Plus
Technical Monograph 9; Harvest Plus: Washington DC, USA, 2012.26. FAO; WHO; UNU. Human Energy Requirements: Report of a Joint FAO/WHO/UNU (Food and Agriculture Organization, World Health
Organization and United Nations University); FAO: Rome, Italy, 2001.27. Mundlak, Y. On the pooling of time series and cross section data. Econometrica 1978, 46, 69–85. [CrossRef]28. Cameron, A.C.; Trivedi, P.K. Microeconometrics: Methods and Applications; Cambridge University Press: Cambridge, UK, 2005.29. Wooldridge, J.M. Econometric Analysis of Cross Section and Panel Data, 2nd ed.; MIT: Cambridge, London, 2010.30. McKinney, P. Comprehensive Food Security and Vulnerability Assessment: Uganda. VAM Food Security Analysis; World Food Pro-
gramme: Rome, Italy, 2009.31. Njuki, J.; Kaaria, S.; Chamunorwa, A.; Chiuri, W. Linking Smallholder Farmers to Markets, Gender and Intra-Household
Dynamics: Does the Choice of Commodity Matter? Eur. J. Dev. Res. 2011, 23, 426–443. [CrossRef]32. Bjornlund, H.; Zuo, A.; Wheeler, S.A.; Parry, K.; Pittock, J.; Mdemu, M.; Moyo, M. The dynamics of the relationship between
household decision-making and farm household income in small-scale irrigation schemes in southern Africa. Agric. Water Manag.2019, 213, 135–145. [CrossRef]
33. Sekabira, H.; Qaim, M. Mobile money, agricultural marketing, and off-farm income in Uganda. Agric. Econ. 2017, 48, 597–611.[CrossRef]
34. Zellner, A.; Theil, H. Three-Stage Least Squares: Simultaneous estimation of simultaneous equations. Econometrica 1962, 30, 54–78.[CrossRef]