THE IMPACT OF MICROINSURANCE ON HOUSEHOLD ...
158
THE IMPACT OF MICROINSURANCE ON HOUSEHOLD WELFARE IN GHANA Joseph Oscar Akotey Dissertation presented for the Degree of Doctor of Philosophy in Development Finance in the Faculty of Economic and Management Sciences at Stellenbosch University Supervisor: Professor Charles Adjasi March 2015
-
Upload
khangminh22 -
Category
Documents
-
view
1 -
download
0
Transcript of THE IMPACT OF MICROINSURANCE ON HOUSEHOLD ...

THE IMPACT OF MICROINSURANCE
ON HOUSEHOLD WELFARE IN GHANA
Joseph Oscar Akotey
Dissertation presented for the Degree of Doctor of Philosophy
in Development Finance in the
Faculty of Economic and Management Sciences
at Stellenbosch University
Supervisor: Professor Charles Adjasi
March 2015

i
Declaration
By submitting this dissertation, I, Joseph Oscar Akotey, declare that the entirety of the work
contained therein is my own, original work, that I am the owner of the copyright thereof (unless to
the extent explicitly otherwise stated) and that I have not previously in its entirety or in part
submitted it for obtaining any qualification.
J.O. Akotey 31 January 2015
Copyright © 2015 Stellenbosch University All rights reserved
Stellenbosch University https://scholar.sun.ac.za

ii
Dedication
With great gratitude to the Almighty God, I dedicate this work to my lovely wife, Anita and my
beautiful daughter, Josepha.
Stellenbosch University https://scholar.sun.ac.za

iii
Acknowledgements
Bless the Almighty God oh my soul and all that is within me bless the Lord Jesus Christ and the
Holy Spirit for giving me good health, strength, knowledge and wisdom to complete this thesis.
Thank you Almighty God for without you I could not have finished this work.
I thank my Supervisor, Prof. Charles Adjasi, for his guidance, counselling, supervision and the very
good relationship we had throughout this thesis. I also thank the faculty of the University of
Stellenbosch Business School (USB) for the various inputs they made into my studies at the
various colloquia. I sincerely appreciate USB for the Bursary Award to complete my PhD study.
I am also very grateful to my lovely wife, Mrs. Anita Nana Abla Oscar Akotey, my beautiful
daughter, Josepha Somakyie Yaaba Eyram Oscar-Akotey, and my household members: Brother
Kumi, Clement, Eric, Felicity, Angela and Angelina for their prayers, moral support and
encouragement.
My appreciation also goes to Finmark Trust for making available to me the 2010 FINSCOPE data
set on Ghana. I thank Mrs. Sheila Hicks for meticulously editing my work.
To my PhD colleagues and friends, especially Marwa, Deon, Nicolene, Thomas, Tita, Mccpowell,
Akisola, Pieter, Luvuyo and the whole 2013 cohort, I say thank you for the diverse assistance you
gave me to complete my studies. I am also grateful to Mrs. van Zyl Marietjie and Mrs. Saayman
Norma for the administrative support they gave me.
I thank the Doctors and medical staff at the Respiratory Clinic at Tygerberg Hospital for the medical
assistance and treatment I received during my studies at University of Stellenbosch.
My immense thanks go to the Our Lady of Fatima and Holy Family Roman Catholic Church at
Bellville, especially Rev. Fr. Bogdan Buksa, and the Choir, for being a family to me during my stay
here. I sincerely appreciate the help given to me by Susan, Dominica, Jackie, Rose, the Men and
Women Prayer groups, Wednesday and Friday morning Mass worshippers. I also thank the Pastor
and congregation of the Redeemed Christian Church of God. And to all who assisted me in diverse
ways I say thank you.
Stellenbosch University https://scholar.sun.ac.za

iv
Abstract
Microinsurance services have been operating in Ghana for the last decade, but the question
whether they have enhanced the welfare of low-income households, mostly in the informal sector,
is largely unresearched. In particular the study asks: does microinsurance improve the welfare of
households through asset retention, consumption smoothing and inequality reduction? This
question has been examined through the use of the 2010 FINSCOPE survey which contains in-
depth information on 3 642 households across the rural and urban settings of the country. In order
to control for selection bias and endogeneity bias, Heckman sample selection, instrumental
variable and treatment effect models were employed for the evaluation. The results of the
assessment have been compiled into four empirical essays.
The first essay investigates the impact of microinsurance on household asset accumulation. The
findings show that microinsurance has a positive welfare impact in terms of household asset
accumulation. This suggests that microinsurance prevents asset pawning and liquidation of
essential household assets at ‘give away’ prices. By absorbing the risk of low-income households,
insurance equips them to cope effectively with risk, empowers them to escape poverty and
sustains the welfare gains achieved.
The second essay examines the impact of microinsurance on consumption smoothing. It delves
into the capacity of microinsurance to enable households to avoid costly risk-coping methods
which are detrimental to health and well-being. The results reveal that insured households are less
likely to reduce the daily intake of meals, which is an indication that microinsurance is a better
option for managing consumption smoothing among low-income households.
The third essay investigates the effect of microinsurance on households’ asset inequality. The
findings indicate that the asset inequality of insured households is less than that of uninsured
households. Insured female-headed households have much lower asset inequality than male-
headed households, but uninsured female-headed households are worse off than both uninsured
and insured male-headed households. The regional trend reveals that developmental gaps impede
the capacity of microinsurance to bridge the asset inequality gap.
The fourth essay asks: Does microcredit improve the well-being of low-income households in the
absence of microinsurance? The findings show a weak influence of microcredit on household
welfare. However households using microcredit in combination with microinsurance derive
significant gains in terms of welfare improvement. Microcredit may be good, but its real benefits to
the poor is best realised if the poverty trapping risks are covered with microinsurance. To this
extent, combining microcredit with microinsurance will empower the poor to make a sustainable
Stellenbosch University https://scholar.sun.ac.za

v
exit from poverty. The findings of this thesis have pertinent policy implications for the government,
the development community and stakeholders in the insurance industry. Microinsurance is a good
instrument for improving the welfare of households and thus this research recommends its
integration into the poverty reduction strategy of Ghana and a greater insurance inclusion for the
lower end of the market.
Key words: Microinsurance; Welfare; Asset, Households; Ghana
Stellenbosch University https://scholar.sun.ac.za
vi
Table of contents
Declaration i
Dedication ii
Acknowledgements iii
Abstract iv
List of tables x
List of figures xii
List of acronyms and abbreviations xiii
CHAPTER 1 INTRODUCTION 1
1.1. BACKGROUND OF THE STUDY 1
1.2. THE MOTIVATION 2
1.3. OBJECTIVES OF THE STUDY 4
1.4. RESEARCH QUESTIONS 4
1.5. RATIONAL FOR EACH ESSAY 4
1.6. AN OVERVIEW OF WELFARE IN GHANA 5
1.7. CHAPTER ORGANIZATIONS 8
REFERENCES 9
CHAPTER 2 OVERVIEW OF THE MICROINSURANCE SECTOR IN GHANA 13
2.1. INTRODUCTION 13
2.2. DEVELOPMENTS IN THE FORMAL INSURANCE SECTOR 13
2.3. THE MICROINSURANCE SECTOR 16
2.3.1. Clients’ Characteristics 16
2.3.2. Examples of Microinsurance Providers 20
2.3.3. Microinsurance Distribution Model 24
2.3.4. Challenges of the Microinsurance Sector 26
2.4. CONCLUSION 27
REFERENCES 28
CHAPTER 3 THE IMPACT OF MICROINSURANCE ON HOUSEHOLD ASSET
ACCUMULATION IN GHANA: AN ASSET INDEX APPROACH 32
3.1. INTRODUCTION 32
3.2. LITERATURE REVIEW 34
Stellenbosch University https://scholar.sun.ac.za

vii
3.2.1. The Theory of Insurance 34
3.2.2. Empirical Literature 34
3.3. OVERVIEW OF THE MICROINSURANCE INDUSTRY OF GHANA 36
3.3.1. Examples of Private Microinsurance Schemes 37
3.4. THE METHODOLOGY 38
3.4.1. The Data 38
3.4.2. The Profile and Characteristics of Households 39
3.4.3. The Estimation Techniques 40
3.4.3.1. The Heckman Sample Selection Model 41
3.4.3.2. The Treatment Effect Model 42
3.4.3.3. The Instrumental Variable Model 42
3.4.4. The Construction of the Asset Index 43
3.4.5. Justification of the Control Variables 44
3.4.5.1. Household Characteristics 44
3.4.5.2. Risk Profiles 45
3.4.5.3. Interaction with the Financial Institutions 45
3.4.5.4. Trade Credit and Microcredit 46
3.4.5.5. Economic Activity 46
3.4.5.6. Rural and Urban Locations 47
3.5. DISCUSSION OF THE RESULTS 47
3.5.1. Test for Multicollinearity: Correlation Analysis 47
3.5.2. The Summary Statistics 49
3.5.3. The Empirical Results 50
3.6. CONCLUSIONS AND POLICY RECOMMENDATION 53
REFERENCES 54
CHAPTER 4 RISK COPING STRATEGIES AND CONSUMPTION SMOOTHING AMONG
LOW-INCOME HOUSEHOLDS IN GHANA: DOES MICROINSURANCE MATTER? 61
4.1. INTRODUCTION 61
4.2. LITERATURE REVIEW 62
4.2.1. Theoretical Literature 62
4.2.1.1. The Life Cycle Theory 62
4.2.1.2. The Permanent Income Theory 63
Stellenbosch University https://scholar.sun.ac.za

viii
4.2.2. The Empirical Literature 63
4.3. OVERVIEW OF CONSUMPTION POVERTY AND MICROINSURANCE IN GHANA 66
4.4. METHODOLOGY 69
4.4.1. The Data 69
4.4.2. The Profile and Features of the Sampled Households 70
4.4.3. The Empirical Estimations 71
4.4.3.1. Heckman Sample Selection Model 72
4.4.3.2. The Treatment Effect Model 73
4.4.3.3. Instrumental Variable Model (IV Model) 73
4.5. RESULTS AND DISCUSSION 75
4.6. CONCLUSION AND POLICY RECOMMENDATIONS 78
REFERENCES 79
CHAPTER 5 EXPLORING THE EFFECT OF MICROINSURANCE ON ASSET
INEQUALITY AMONG HOUSEHOLDS IN GHANA 84
5.1. INTRODUCTION 84
5.2. LITERATURE REVIEW 86
5.3. OVERVIEW OF POVERTY AND INEQUALITY TRENDS IN GHANA 89
5.4. BRIEF OVERVIEW OF THE MICROINSURANCE INDUSTRY IN GHANA 92
5.5. THE METHODOLOGY 93
5.5.1. The Data 93
5.5.2. The Construction of the Asset Index 94
5.5.3. The Asset Inequality Estimations through the Gini Coefficient 97
5.6. RESULTS AND DISCUSSION 98
5.6.1. The Profile and Characteristics of the Sampled Households 98
5.6.2. Tests for Selection Bias 100
5.6.3. Asset Inequality 100
5.6.4. The Effect of Microinsurance on Asset Inequality 103
5.7. CONCLUSION AND POLICY RECOMMENDATIONS 106
REFERENCES 108
CHAPTER 6 DOES MICROCREDIT INCREASE HOUSEHOLD WELFARE IN THE
ABSENCE OF MICROINSURANCE? 113
6.1. INTRODUCTION 113
6.2. LITERATURE REVIEW 115
Stellenbosch University https://scholar.sun.ac.za

ix
6.2.1. The Empirical Literature 116
6.3. AN OVERVIEW OF THE MICROFINANCE INDUSTRY IN GHANA 119
6.4. THE METHODOLOGY 120
6.4.1. The Data 120
6.4.2. The Profile and Characteristics of the Sampled Households 121
6.4.3. The Estimation Techniques 121
6.4.3.1. The Heckman Sample Selection Model 122
6.4.3.2. The Treatment Effect Model 123
6.4.3.3. Instrumental Variable Model (IV Model) 123
6.4.4. The Construction of the Asset Index 124
6.5. RESULTS AND DISCUSSION 125
6.5.1. Uses of the Microcredit 125
6.6. CONCLUSION AND IMPLICATIONS 130
REFERENCES 131
CHAPTER 7 THE CONCLUSION AND POLICY RECOMMENDATIONS 136
7.1. INTRODUCTION 136
7.2. SUMMARY OF THE FINDINGS 137
7.3. CONCLUSION 138
7.4. RECOMMENDATIONS 138
APPENDIX A: ROBUST STANDARD ERRORS: ASSET ACCUMULATION 141
APPENDIX B: SELECTION BIAS TEST 142
APPENDIX C: ROBUST STANDARD ERRORS: MICROCREDIT AND
MICROINSURANCE 143
Stellenbosch University https://scholar.sun.ac.za

x
List of tables
Table 2.1: Licensed insurance entities as at December, 2011 14
Table 2.2: Market Shares of Life Companies 14
Table 2.3: Market Shares of Non-life Companies 14
Table 2.4: Key Indicators of the Life and Non-life Sectors, 2011 15
Table 2.5: Premium Growth and Insurance Penetration 16
Table 2.6: Market Indicators of the Microinsurance Sector, 2011 19
Table 2.7: Microinsurance Products 20
Table 2.8: Summary Statistics of the NHIS, 2010 23
Table 2.9: Groups and Percentage of Registered Members, 2010 23
Table 2.10: Distribution Models and Policies Sold, 2011 26
Table 3.1: Distribution Models and Policies Sold, 2011 37
Table 3.2: The Number of Insured Households 39
Table 3.3: Chi-Square Test on the Profile of Insured and Uninsured Households 40
Table 3.4: Correlation Matrix 48
Table 3.5: Descriptive Statistics of the Asset Index 49
Table 3.6: Percentile Distribution of the Asset Index 49
Table 3.7: The Results of the Probit Model 50
Table 3.8: The Empirical Results 52
Table 4.1: Microinsurance Products 69
Table 4.2: Chi-Square Test on the Profile of Insured and Uninsured Households 71
Table 4.3: The Impact of Microinsurance on Consumption Smoothing 77
Table 5.1: Access to Sanitation and Water Facilities from 1990-2010, Ghana 90
Table 5.2: Weights Generated from the MCA 96
Table 5.3: Chi-Square Test on the Profile of Insured and Uninsured Households 99
Table 5.4: Asset Gini Coefficient 101
Table 5.5: Percentiles Distribution of Assets by Gender. 102
Table 5.6: Distribution of Assets, Rural-Urban Divide 102
Stellenbosch University https://scholar.sun.ac.za
xi
Table 5.7: Gini Coefficient of the Asset Index 105
Table 6.1: Types and Number of Registered MFIs in Ghana 119
Table 6.2: Chi-Square Test on the Profile of Microcredit participants and Non-participants 121
Table 6.3: Use of the Microcredit 125
Table 6.4: The Probit Model Result for Microcredit 127
Table 6.5: The Estimations of Microcredit and Microinsurance 129
Table A.1: Heteroskedasticity Robust Standard Errors: Asset Accumulation 141
Table B.1: The Selection Bias Test, Heckman Model 142
Table C.1: Heteroskedasticity Robust Standard Errors: Microcredit and Microinsurance 143
Stellenbosch University https://scholar.sun.ac.za

xii
List of figures
Figure 2.1: Poverty Line and Size of the Microinsurance Market 18
Figure 2.2: Microinsurance Distribution Models 25
Figure 5.1: Effect of Microinsurance on Asset Inequality – The Conceptual Framework 87
Figure 5.2: Literacy Rates of Females and Males 91
Figure 5.3: The Lorenz Curve 98
Figure 5.4: Lorenz Curve for Household Assets 100
Stellenbosch University https://scholar.sun.ac.za

xiii
List of acronyms and abbreviations
AfDB African Development Bank
AST Asset Index
AYII Area Yield Index Insurance
BECE Basic Education Certificate Examinations
BOG Bank of Ghana
CBOs Community Based Organizations
CSB Complaints and Settlements Bureau
Death_B’winner Death of a Bread Winner
EDU Education
FAO Food and Agriculture Organization
FNGOs Financial Non-governmental Organizations
G.MI Government Microinsurance
GAIP Ghana Agricultural Insurance Program
GCSCA Ghana Cooperative Susu Collectors Association
GDHS Ghana Demographic and Health Survey
GDP Gross Domestic Product
Ghana Re Ghana Reinsurance Organization
GHS Ghanaian Cedi
GIA Ghana Insurers Association
GIGA German Institute of Global and Area Studies
GIZ Gesellschaft für Internationale Zusammenarbeit
GLICO Gemini Life Insurance Company
GLSS Ghana Living Standard Surveys
GMet Ghana Meteorological Agency
GNA Ghana News Agency
GSS Ghana Statistical Service
HH.Size Household Size
HH_Credit Households using Microcredit
HH_No_Credit Households without Microcredit
ID Card Identity Card
IFAD International Fund for Agricultural Development
ILO International Labour Organization
INSURED HH Insured Households
IV Instrumental Variable
Kno’dge_Insurance Knowledge of Insurance
Stellenbosch University https://scholar.sun.ac.za
xiv
LEAP Livelihood Empowerment Against Poverty
MCA Multiple Correspondence Analysis
MDGs Millennium Development Goals
MFIs Microfinance Institutions
MSLC Middle School Leaving Certificate
NGOs Non-governmental Organizations
NHIA National Health Insurance Authority
NHIS National Health Insurance Scheme
NIC National Insurance Commission
P.MI Private Microinsurance
PCA Principal Component Analysis
PIH Permanent Income Hypothesis
PKSF Bangladesh Rural Employment Support Foundation
PNDC Provisional National Defence Council
PPP Public Private Partnership
Proxim_Fin_Inst Proximity to Financial Institutions
RCBs Rural and Community Banks
Require_Fin_Inst Requirement of Financial Institutions
ROSCAs Rotating, Savings and Credit Associations
SAT Sinapi Aba Trust
SIC State Insurance Corporation
SIDBI Small Industries Development Bank of India
SLCs Savings and Loans Companies
SMEs Small and Medium-sized Enterprises
SSNIT Social Security and National Insurance Trust
TMU Technical Management Unit
UKAid United Kingdom Agency for International Development
UN United Nations
UNDP United Nations Development Programme
UNINSURED HH Uninsured Households
USA United States of America
USAID United States Agency for International Development
VAT Value Added Tax
WDI World Development Indicators
WELF Welfare
Stellenbosch University https://scholar.sun.ac.za
1
CHAPTER 1
INTRODUCTION
1.1. BACKGROUND OF THE STUDY
Exposure to risks such as fire, floods, sickness, disability and death of a breadwinner can have
adverse effect on the welfare of an entire household1. Again, bad weather conditions (eg. severe
drought) and lack of a ready market for the produce of smallholder farmers impact negatively on
the capacity of rural households to deal with poverty traps. These risks do not only impede the
economic capacity of the poor from breaking the vicious cycle of poverty (Guha-Khasnobis &
Ahuja, 2004), but they also reinforce households’ vulnerability to income shocks in an escalating
downward spiral (Churchill, 2007).
Indeed the failure of most sub-Saharan Africa countries to reduce extreme poverty by half as
stipulated by the Millennium Development Goals (MDGs) has largely been attributed to uninsured
risks (Loewe, 2006). The International Labour Organization (ILO, 2014) has also estimated that 75
countries do not have any social protection for households and that in developing countries 18 000
children die daily mainly due to lack of sufficient social protection. So can microinsurance be used
to address such life-cycle and business risks associated with low-income households and enhance
their standard of living?
The theoretical framework based on Von Neumann and Morgenstern (1944) expected utility theory
indicates that microinsurance may reduce vulnerability as low-income households replace the
uncertainty of incurring huge losses with the certainty of making small, regular premium payments
(Brown & Churchill, 1999). By insuring households against future welfare losses, microinsurance
helps in the reduction of vulnerability and poverty. A poverty reduction strategy needs to address
not only those currently experiencing poverty, but those who may also be vulnerable to it over the
longer term. Thus, the use of microinsurance in addressing poverty becomes very important.
Vulnerability and poverty go hand in hand, but microinsurance can break a part of the cycle that
ties them together. According to Dercon (2003), insurance removes the risk of worsening poverty
or poverty traps.
Microinsurance also serves as an effective tool for the separation of fluctuations in consumption
from fluctuations in earnings and wealth (consumption smoothing) (Arun & Steiner, 2008). The
presence of uninsured risk results in welfare losses. This may lead to substantial hardships for the
low-income earners (Dercon, 2003). Microinsurance prevents welfare losses as low-income
1 Low-income households, the poor and informal sectors workers are used interchangeable throughout this
study.
Stellenbosch University https://scholar.sun.ac.za

2
households are indemnified by insurers against events that may force them to sink below the
poverty line.
Microinsurance as a social protection tool can also reduce the incidence of child labour by
eliminating economic vulnerability of households, enabling children to access education
(Chakrabarty, 2012; ILO, 2014). Many social protection stakeholders such as the ILO regard
microinsurance as a priceless tool for the improvement in the welfare of millions of people in the
informal economy worldwide.
Despite the strong theoretical foundation, the empirical literature is limited in depth and
inconclusive in evidence. Whereas some studies discovered that microinsurance leads to
counterintuitive tendencies such as moral hazard, adverse selection and inertia in investment
among households and microenterprises (Gine & Yang, 2009; Giesbert et al., 2011), others such
as Guha-Khasnobis and Ahuja (2004) and Nicola (2011) argued that microinsurance facilitates
households’ and microenterprises’ investments into high yielding projects which improve their
productivity and welfare. A third group of authors (Gumber, 2001; Smith & Sulzbach, 2008;
Wagstaff et al., 2009; Lei & Lin, 2009; Dercon et al., 2012) report of either mixed results or no
effect at all.
Also the experience of Europe and America shows a positive relationship between insurance,
savings levels and economic well-being (Starr-McCluer, 1996; Guariglia & Rossi, 2004), but that of
some Asian countries is said to be negative (Cheung & Padieu, 2011; Hsu et al., 2011). The
inconclusive empirical evidence from the various regions of the world and the many gaps in the
existing literature calls for a very rigorous country-specific study that will test the real impacts of
microinsurance on households’ welfare.
1.2. THE MOTIVATION
The global microinsurance industry has since 2000 recorded increasing market activity with rapid
growth observed in almost all regional markets (Swiss Re, 2010). The potential global coverage of
the market is estimated at 4 billion low-income persons with the likelihood of generating US$40
billion (Swiss Re, 2010). Out of the estimated market of 4 billion people only 78 million were
covered in 2007 (Roth et al., 2007). This has however grown quite remarkable to 174 million lives
in India, 44.4 million in Africa and 45 million in Latin America (McCord et al., 2012; ILO, 2013). The
African market in particular has experienced fast growth in covered lives and value of premiums. It
insured 14.7 million lives and collected US$257 million as premium income in 2010 (Matul et al.,
2010). This coverage has grown tremendously from 0.3 percent of Africa’s population in 2007 to
4.4 percent in 2012 translating into 44.4 million policyholders (Roth et al., 2007; McCord et al.,
2012). In Ghana the private microinsurance market covers about 1.26 million policyholders and
Stellenbosch University https://scholar.sun.ac.za
3
generates premium income of about GHS11.70 million (US$6.09 million) (Buabeng & Gruijters,
2012). The government health insurance scheme also covers about 4.5 million low-income
households living and working in the informal sector (NHIS, 2010).
In spite of the impressive growth in the market size, empirical research into the African experience
has been limited. The case of Ghana has seen some studies mostly in the area of access to
microinsurance. For instances, in assessing low-income earners access to microinsurance
Giesbert (2008) delved into the demand for microinsurance by Ghana’s rural folks. Similarly Arun
and Steiner (2008), Bendig et al (2009) and Giesbert and Steiner (2011) have all researched into
how access to microinsurance services by low-income earners can be made flexible and
affordable. The focus of these researchers and the attention of practitioners as well as regulators
have tended to be on how access to microinsurance can be increased. However no impact study
exists on the link between microinsurance and welfare in Ghana. More importantly when
juxtaposed with the poverty situation in Ghana, it is imperative to ascertain whether the intervention
of microinsurance schemes have improved on household welfare through proper consumption
smoothing and asset retention.
Practically, microinsurance could lead to different outcomes. It could have counterintuitive effects
due to adverse selection and moral hazards. Adverse selection describes a state of affairs where
those who have a high probability of being negatively affected by a risky event are the ones who
purchase insurance (Brown & Churchill, 1999; McConnell & Brue, 2008; Roth & McCord, 2008).
Adverse selection can have a destabilizing effect on an insurance system, because the mechanism
of risk-pooling will not function effectively if only those adversely affected by a risky event buy the
insurance product.
Moral hazard is the situation where the indemnity enjoyed under insurance creates an incentive for
a policyholder to act in an irresponsible manner. That is, due to their protection under the
insurance contract, they behave carelessly and this generates greater likelihood of the insured
event occurring. For instance, households’ savings behaviour might change for the worse due to
the uptake of microinsurance products such as life and disability products. Microenterprises may
be less aggressive in undertaking new investments with the uptake of microinsurance. For
example, agro-based microenterprises that have taken animal insurance policies might be less
proactive in undertaking new investments such as the immunization of their animals.
Another counterintuitive debate about microinsurance is its possible crowding-out effect of existing
informal social protection mechanisms such as the extended family support and mutual funeral
contributions (Dercon et al., 2008). These are counterintuitive arguments which may or may not
make microinsurance have a positive impact on households’ welfare. There is therefore a need to
investigate the real benefits or otherwise of microinsurance schemes.
Stellenbosch University https://scholar.sun.ac.za

4
This study provides new evidence by examining the impact of microinsurance on the welfare of
low-income households in Ghana. Indeed the effect of microinsurance on consumption smoothing,
asset accumulation and asset inequality are important for the design of microinsurance and welfare
schemes. This study therefore fills the apparent empirical gap by assessing the impact of
microinsurance schemes in Ghana on the welfare of poor households. The study is organized
around four stand-alone essays each of which unwinds a particular empirical labyrinth.
1.3. OBJECTIVES OF THE STUDY
The primary objective of the study is to analyse the effect of microinsurance on household welfare.
This objective is specified under the following areas:
1. Determine the impact of microinsurance on households’ asset accumulation.
2. Evaluate the impact of microinsurance on households’ consumption smoothing.
3. Explore the effect of microinsurance on asset inequality among low-income households.
4. Determine whether there is a positive synergy between microinsurance and microcredit in
enhancing households’ welfare.
1.4. RESEARCH QUESTIONS
1. What is the impact of microinsurance on households’ assets accumulation?
2. How does microinsurance impact on households’ consumption smoothing?
3. What is the impact of microinsurance on asset inequality?
4. How does the synergy between microinsurance and microcredit improve on households’
welfare?
1.5. RATIONAL FOR EACH ESSAY
As noted earlier four stand-alone essays have been put together to answer the research questions.
First, it is expected that microinsurance will indemnify households against risks such as fire, crop
failure, flood, illness and theft. This indemnity cover is expected to influence the ex-ante investment
outlook of households by giving them “a peace of mind” and encouragement to engage in
productive activities that can increase asset accumulation. Similarly the pay-out that households
receive if an insurable loss occurs has the potential to reduce the use of costly coping strategies
such as the disposal of productive assets. This dual role of microinsurance is expected to equip
households to accumulate essential assets necessary for welfare improvements. Thus the first
essay examines whether the uptake of microinsurance has been beneficial to households in terms
of asset accumulation.
Low-income households have diverse strategies for coping with risks. Among such mechanisms
for coping with income shocks is the reduction in daily food intake. However reduction in daily
Stellenbosch University https://scholar.sun.ac.za
5
meals can lead to malnourishment with pernicious health conditions. Children are particularly very
vulnerable since reduced nutrition can lead to irreversible impairment in health such as stunted
growth, slower cognitive and motor development and high morbidity rates (Ray, 1998; Martorell,
1999). As a risk management tool, microinsurance is expected to facilitate proper consumption
smoothing by separating shocks in current earnings from current consumption. Therefore the
second essay examines the strength of microinsurance as a viable alternative for smoothing
consumption among low-income households.
It is also argued that the level of asset inequality between the poor and the non-poor keeps on
widening partly due to insufficient economic opportunities for the poor and their inability to deal with
risks associated with household and or productive assets. All other things being equal, uninsured
risks can increase the level of asset inequality among groups of people. This is more so since
assets may have to be sold off to raise money to address emergency shocks. Hence, asset
pawning, asset poverty and asset inequality move in tandem, but microinsurance can break a part
of the cycle that ties them together. By insuring households against asset loss, microinsurance is
expected to close the asset gap between the poor and the non-poor. Hence the third essay
explores the asset inequality levels within and between insured and uninsured households as
separate cohorts.
Another important factor that can improve upon the welfare of low-income households and
microenterprises is access to affordable credit. However, most low-income households have
limited access to bank credit due to their perceived high levels of default risks. Some of these risks
can be eliminated through microinsurance products. Through microinsurance products such as
credit life the rate of default among low-income households and microenterprises can be minimized
and this will facilitates the release of more credits to low-income households. It is also argued that
the trap of poverty is not only the lack of credit, but also life-cycle and economic risks that threaten
the very survival of the poor. Therefore combining microcredit with microinsurance as a financing
package will empower them to make sustainable exit from chronic poverty. The fourth essay thus
simulates a discussion into how the synergy between microinsurance and microcredit can be
explored to improve upon the welfare of low-income households.
1.6. AN OVERVIEW OF WELFARE IN GHANA
The last three decades has seen increasing economic growth in Ghana. Her gross domestic
product (GDP) for a period of 15 years grew by 4.65 percent between 1991 and 1999, and by 4.98
during the 1999-2006 periods (GSS, 2007). Her average annual GDP growth rate for the period
2005 to 2013 was 7.8 percent (GSS, 2014). This is 68 percent greater than the average for the
1991-1999 periods. The Africa Development Bank (2012) has also reported that since 2003 the
economy of Ghana has been growing faster than the growth rate of the entire African continent.
Stellenbosch University https://scholar.sun.ac.za
6
This remarkable growth has translated into drastic reduction of both extreme poverty2 and
moderate poverty by more than 50 percent each over the last two decades. For instance the
incidence of extreme poverty has declined from 36.5 percent in 1991/92 to 18.2 percent in 2005/06
and further down to 8.4 percent in 2012/13 (GSS, 2007, 2008 & 2014). The level of moderate
poverty has also reduced from a staggering rate of 51.7 percent in 1991/92 to 28.5 in 2005/06 and
to 24.2 in 2012/13 (GSS, 2007, 2008 & 2014). Despite this progress, poverty is still widespread in
Ghana and is a predominately a rural phenomenon.
The welfare situation incorporates income levels, health, education and access to basic social
amenities. These dimensions of poverty interact to consign households to lower welfare levels or
standards of living (GSS, 2007). In this regard we examine the trend in these key indicators in
Ghana. The geographical dimension of poverty shows a persistent of extreme poverty in the rural
areas. As at 2006, as high as 86 percent of the population considered poor were residing in rural
communities (GSS, 2007). This has however declined by 8 percentage points in 2012/13 to 78
percent.
The distribution of poverty incidence by main economic activity also indicates that farmers, private
informal sector wage employees and the non-farm self-employed are the poorest segments of the
population (GSS, 2007 & 2014). The latest nation-wide living standards survey, GLSS VI, reports
that “household heads who are farmers are not just the poorest in Ghana, but they contribute the
most to Ghana’s poverty” (GSS, 2014:25). A major reason underlying the poverty situation of this
population segment is their investment in low risk production at the expense of higher returns. The
concept of microinsurance can be used as a catalyst to empower these economically active, but
poor people to make a sustainable exit from poverty. The indemnity cover under microinsurance
can be used to encourage these people to invest in high risk high yielding economic activities. That
is the indemnity provision which serves as a guaranteed safety net and thus eliminates the anxiety
about future economic shocks, can empower this segment to engage in high yielding productions.
For example, smallholder farmers are likely to increase their scale of production if they are covered
under an agricultural microinsurance against crop failure. In addition to microinsurance,
government programs that address the challenges of post-harvest losses along the agricultural
value chain can equip farmers to overcome poverty. It is also argued that providing a guarantee
market for the goods of smallholder farmers at competitive prices can lifts them up from poverty.
2 According to the Ghana Statistical Service (2014:12), extreme poverty refers to “those whose standard of
living is insufficient to meet their basic nutritional requirements even if they devoted their entire consumption budget to food”. The extreme poverty line is living on GHS792.05 per year (approximately US$1.10 a day). The moderate poverty refers to individuals who are “able to purchase enough food to meet their nutritional requirements and their basic non-food needs” (GSS, 2014:7). The moderate poverty line is at GHS1 314.00 per year (US$1.83 a day).
Stellenbosch University https://scholar.sun.ac.za

7
In terms of the degree of access to essential services such as electricity, potable water and
hygienic toilet facilities, access of rural households to potable water has increased substantially
with about three-quarters having access to good drinking water in 2005/06 (GSS, 2007). The last
two decades has recorded increasing investment in the water sub-sector resulting in 122
percentage improvement in the rural areas (World Bank, 2011). This has reduced the rural-urban
disparity in access to safe water very significantly (GSS, 2007). However development in sanitation
facilities has been minimal. Households in the urban areas, on the other hand, witnessed sharp
increases in improved toilet facilities from 1991 to 2006 (GSS, 2007). Indeed, since 1990 the
average sanitation facilities in the urban dwellings have consistently been two and three times
more than the national and rural average respectively (World Bank, 2011). Similarly access to
electricity in the urban centres is about three times that of rural dwellers. Despite the gap, efforts by
the central government through the rural electrification program are expected to improve access to
electricity in the rural areas.
With regard to health issues the trend of key health indicators points to marked improvement in
general health outcomes, however some issues relating to children and women health care are still
undesirable. Between 2003 and 2008, 57 percent of births took place in recognized health facilities
(GSS et al., 2009). Professionally assisted delivery has also increased from 47 percent in 2003 to
59 percent in 2008 (GSS et al., 2009). Although this performance is good, it is quite lower than the
global average of 56 percent in 1990 to 68 percent in 2012 (UN, 2014). Quite disturbingly 41
percent deliveries occurred without a professional medical assistance and a sizable minority of 11
percent used relatives or no assistance at all during delivery (GSS et al., 2009). Deliveries without
professional medical assistance can increase the rate of child and maternal mortality. To this
extent expansion of professional health facilities especially into rural areas will be very critical for
the reduction of maternal mortality by three quarters as specified in the MDGs. Although the
government offers free health insurance to pregnant women, access to this facility is very limited in
the rural areas.
Globally child mortality has reduced by 48 percent from 12.6 million in 1990 to 6.6 million in 2012
(UN, 2014). Notwithstanding this global progress, sub-Saharan Africa and Southern Asia have high
levels of child mortality. These two regions account for four out of every five child deaths worldwide
(UN, 2014). The case of Ghana is relatively better than both the sub-Saharan Africa and the global
performance. For example, childhood mortality has decreased quite substantially from 111 per
1 000 live births in 2003 to 80 per 1 000 live births in 2008. This means “one in every thirteen
children dies before reaching the age of five. Over two-thirds of these deaths occur in the first year
of life” (GSS et al., 2009:24). Though this is lower than the average of sub-Saharan African,
improved access to reproductive health care such as early visits to clinics for antenatal and
postnatal care as well as maternal education can eliminate child mortality.
Stellenbosch University https://scholar.sun.ac.za

8
The well-being of households can also be gauged from the consumption of food containing the
required amount of nutrients. Nutrient deficiency especially iron deficiency poses significant threat
to the health of children and nursing mothers. The Ghana Demographic and Health Survey
(GDHS) report an increase in the rate of anaemia in children from 76 percent in 2003 to 78 percent
in 2008. It further indicates that 23 percent, 48 percent and 7 percent are mildly, moderately and
severely anaemic respectively. The level of iron deficiency among women also increased sharply
from 45 percent in 2003 to 59 percent in 2008. The Upper East region has the lowest percentage
of anaemic women (48 percent) while the Western region has the highest level of 71 percent (GSS
et al., 2009).
Such levels of nutrient deficiency can lead to weakness in bodily growth and development
especially in children. For example, 28 percent of children below the age of five are stunted and 10
percent are severely stunted. A further 9 percent and 14 percent are wasted and underweight
respectively (GSS et al., 2009). This situation can disrupt not only the bodily growth of children, but
more importantly their emotional and cognitive faculties. Microinsurance can be used as part of
policy interventions to address the nutrient deficiencies through proper consumption smoothing.
This will ensures that even during periods of income shocks, households’ food consumption at
required calories is not compromised by lack of sufficient funds.
1.7. CHAPTER ORGANIZATIONS
The thesis is organized around four main themes under household welfare: asset accumulation,
consumption smoothing, asset inequality and welfare synergy between microinsurance and
microcredit. Each theme has been developed into a stand-alone essay. The first chapter
introduces the research and highlights some of the debates surrounding the impact of
microinsurance on welfare.
The second chapter reviews past and current issues in the Ghanaian microinsurance sector and
discusses the major market trends and patterns of the formal insurance markets. The third chapter
begins the empirical investigation by evaluating the impact of microinsurance on household asset
accumulation. The fourth chapter assesses the impact of microinsurance on consumption
smoothing among low-income households.
The fifth chapter explores the effect of microinsurance on asset inequality among low-income
households. Chapter 6 investigates the synergy between microinsurance and microcredit in the
improvement of households’ welfare. The thesis ends with chapter seven which summarises the
conclusions and policy recommendations.
Stellenbosch University https://scholar.sun.ac.za

9
REFERENCES
African Development Bank (ADB). 2012. Republic of Ghana: Country strategy paper 2012-2016.
Accra: Africa Development Bank, Country Operations Department.
Arun, T. & Steiner, S. 2008. Microinsurance in the context of social protection. BWPI Working
Paper No. 55. Manchester: Brooks World Poverty Institute.
Bendig, M., Giesbert, L. & Steiner, S. 2009. Savings, credit, and insurance: Household demand for
formal financial services in rural Ghana. GIGA Research Programme: Transformation in the
Process of Globalisation, Working Paper No. 94/2009. Hamburg: German Institute of Global and
Area Studies.
Brown, W. & Churchill, C.F. 1999. Providing insurance to low-income households - Part I: A primer
on insurance principles and products. Microenterprise Best Practice Project, Bethesda, MD
DAI/USAID, pages 1-92.
Buabeng, I.Y. & Gruijters, R. 2012. Market survey: The supply of microinsurance products in
Ghana. In NIC & GIZ (eds.), Promoting microinsurance in Ghana: Microinsurance as a means of
insurance sector development, 102-109. Accra: QualiType Limited.
Chakrabarty, S. 2012. Does microcredit increase child labour in absence of microinsurance? ILO
Microinsurance Innovation Facility Research Paper No. 12. Geneva: International Labour
Organization (ILO).
Cheung, D. & Padieu, Y. 2011. Impacts of health insurance on saving and consumption expenses
by income groups in rural China. Centre d’Economie de la Sorbonne (CES) Working Paper 13056,
Paris: University of Paris.
Churchill, C. 2007. Insuring the low-income market challenges and solution for commercial
insurers. The Geneva Papers, 32(3), 401–412.
Dercon, S. 2003. Insurance against poverty. Helsinki: United Nations University, World Institute for
Development Economics Research.
Dercon, S., Gunning, J.W., Zeitlin, A. & Lombardini, S. 2012. The impact of a health insurance
programme: Evidence from a randomized controlled trial in Kenya. ILO Microinsurance Innovation
Facility Research Paper No. 24. Geneva: International Labour Organization (ILO).
Dercon, S., Kirchberger, M., Gunning, J.W. & Platteau, J.P. 2008. Literature review on
microinsurance. Microinsurance Paper No. 1. Geneva: International Labour Organization.
Stellenbosch University https://scholar.sun.ac.za

10
Ghana Statistical Service (GSS). 2014. Ghana living standards survey round six (GLSS VI):
Poverty profile in Ghana (2005-2013). Accra: Ghana Statistical Service.
Ghana Statistical Service (GSS). 2008. Ghana living standards survey report of the fifth round
(GLSS V). Accra: Ghana Statistical Service. Available: http://www.statsghana.gov.gh. Accessed:
23 March 2011.
Ghana Statistical Service (GSS). 2007. Pattern and trends of poverty in Ghana, 1991-2006. Accra:
Ghana Statistical Service.
Ghana Statistical Service (GSS), Ghana Health Service (GHS) & ICF Macro. 2009. Ghana
demographic and health survey 2008. Accra: GSS, GHS, and ICF Macro.
Giesbert, L. 2008. The demand for microinsurance in rural Ghana: Household survey report on the
Anidaso policy of the Gemini Life Insurance Company (GLICO). Hamburg: German Institute of
Global and Area Studies.
Giesbert, L. & Steiner, S. 2011. Perceptions of (micro) insurance in southern Ghana: The role of
information and peer effects. Working Papers No. 183/2011. Hamburg: German Institute of Global
and Area Studies.
Giesbert, L., Steiner, S. & Bendig, M. 2011. Participation in micro life insurance and the use of
other financial services in Ghana. Journal of Risk and Insurance, 78(1), 7-35.
Gine, X. & Yang, D. 2009. Insurance, credit, and technology adoption: Field experimental evidence
from Malawi. Journal of Development Economics, 89(1), 1-11.
Guariglia, A. & Rossi, M. 2004. Private medical insurance and saving: Evidence from the British
household panel survey. Journal of Health Economics, 23(4), 761-783.
Guha-Khasnobis, B. & Ahuja, R. 2004. Extending formal insurance to the informal economy
workers in India. EGDI and UNU-WIDER Conference, 17-18 September, 2004, Helsinki, Finland
Gumber, A. 2001. Hedging the health of the poor: The case for community financing in India.
Health, Nutrition and Population discussion paper. Washington, DC: World Bank.
Hsu, M., Liao, P.L. & Lin, C.C. 2011. Revisiting private health insurance and precautionary saving:
A theoretical and empirical analysis. Tokyo: National Graduate Institute for Policy Studies (GRIPS),
and Taipei, Taiwan: Academia Sinica.
International Labour Organization (ILO). 2014. World social protection report 2014/15: Building
economic recovery, inclusive development and social justice. Geneva: ILO.
Stellenbosch University https://scholar.sun.ac.za
11
International Labour Organization (ILO). 2013. Microinsurance innovation facility: Protecting the
working poor. Annual Report 2012. Geneva: ILO.
Lei, X. & Lin, W. 2009. The new cooperative medical scheme in rural China: Does more coverage
mean more service and better health? Health Economics, 18(S2): S25-S46.
Loewe, M. 2006. Downscaling, upgrading or linking? Ways to realise microinsurance. International
Social Security Review, 59(2), 37-59.
Martorell, R. 1999. The nature of child malnutrition and its long-term implications. Food & Nutrition
Bulletin, 20(3), 288-292.
Matul, M., McCord, M.J., Phily, C. & Harms, J. 2010. The landscape of microinsurance in Africa.
ILO Microinsurance Working Paper No. 4. Geneva: International Labour Office.
McConnell, C.R. & Brue, S.L. 2008. Economics: Principles, problems and policies. 17th edition.
Boston, MA: McGraw-Hill Irwin.
McCord, M.J., Steimann, R., Tatin-Jaleran, C., Ingram, M. & Mateo, M. 2012. The landscape of
microinsurance in Africa 2012. Munich Re Foundation and GIZ. Available at http://www.a2ii.org
accessed on 22 August, 2014.
National Health Insurance Authority. 2010. Summary statistics of the national health insurance
scheme. Accra: National Health Insurance Authority.
Nicola, F.D. 2011. The impact of weather insurance on consumption, investment, and welfare. Job
Society for Economic Dynamics Meeting Papers No. 548. St. Louis, MO: Federal Reserve Bank.
Ray, D. 1998. Development economics. Princeton: Princeton University Press.
Roth, J. & McCord, M.J. 2008. Agricultural microinsurance: Global practices and prospects.
Appleton, WI: The Microinsurance Centre.
Roth, J., McCord, M.J. & Liber, D. 2007. The landscape of microinsurance in the world’s 100
poorest countries. Appleton, WI: The Microinsurance Centre.
Smith, K.V. & Sulzbach, S. 2008. Community-based health insurance and access to maternal
health services: Evidence from three West African countries. Social Science and Medicine, 66(12),
2460-2473.
Starr-McCluer, M. 1996. Health insurance and precautionary savings. American Economic Review,
86(1), 285-295.
Stellenbosch University https://scholar.sun.ac.za
12
Swiss Re. 2010. Microinsurance: Risk protection for 4 billion people. Sigma No. 6/2010. Zurich:
Swiss Reinsurance Company.
United Nations. 2014. The millennium development goals report. New York, NY: United Nations.
Von Neumann, J. & Morgenstern, O. 1944. Theory of games and economic behaviour. Princeton,
NJ: Princeton University Press.
Wagstaff, A., Lindelow, M., Jun, G., Ling, X. & Juncheng, Q. 2009. Extending health insurance to
the rural population: An impact evaluation of China’s new cooperative medical scheme. Journal of
Health Economics, 28(1), 1-19.
World Bank. 2011. The World Development Indicators: 2011. Washington, DC: The World Bank.
Stellenbosch University https://scholar.sun.ac.za

13
CHAPTER 2
OVERVIEW OF THE MICROINSURANCE SECTOR IN GHANA
2.1. INTRODUCTION
This chapter reviews the market patterns and trends of the microinsurance sector in Ghana. Since
the microinsurance sector is embedded in the mainstream insurance industry, a general overview
of the insurance market is provided so as to situate the institutional arrangements in which
microinsurance companies operate.
2.2. DEVELOPMENTS IN THE FORMAL INSURANCE SECTOR
Formal insurance market operations started in Ghana in the 1920s with a foreign-owned insurance
company, Guardian Royal Exchange Assurance (Gh) Limited now known as Enterprise Insurance
Company, as the first insurance firm to be established in 1924. In 1955 the first local insurance
firm, the Gold Coast Insurance Company, was also started to insure life business (Ansah-Adu et
al., 2012). The State Insurance Corporation (SIC) was also established by the government of
Ghana in 1962. It was granted statutory monopoly over the underwriting of all government
businesses. In 1972 Ghana Reinsurance Organization (Ghana Re) was set up as a subsidiary of
SIC to provide reinsurance services to all insurers operating in the country. All insurers were
required by law to cede not less than 20 percent of all general businesses written locally and 5
percent of international non-life policies to Ghana Re (Ansah-Adu et al., 2012).
During the last two decades regulatory reforms have been initiated which have transformed the
industry from a state-led monopoly to a market-driven industry. Now the industry operates under a
new law, Insurance Acts 724 (2006), which has aligned the sector’s operations to the core
principles of the International Association of Insurance Supervisors. In order to promote sound risk
management and actuarial practices, accountability and effective corporate governance, the new
insurance law prohibits composite insurance businesses. Thus all insurance companies have been
separated into life and non-life businesses. The law has not only empowered the National
Insurance Commission (NIC) to provide effective regulatory supervision of the industry, but it has
also enhanced the entry of many foreign-owned insurers unto the market.
The regulatory and institutional reforms have increased market activity which has resulted in the
increase of licensed insurance entities3 (see Table 2.1) by 31 percent from 74 in 2007 to 97 in
2011 (NIC, 2007 and 2011). This has engendered keen competition among the various insurers in
both the life and non-life businesses. Although SIC is the dominant insurer in both subsectors, its
performance has been declining while Enterprise Insurance Ltd has seen continuous growth at an
3 This is excluding agents
Stellenbosch University https://scholar.sun.ac.za

14
average of 2 percent since 2003. The market shares measured by premiums underwritten by the
industry leaders in both the life and non-life subsectors are presented in Tables 2.2 and 2.3.
Table 2.1: Licensed insurance entities as at December, 2011
Insurance Entity Number Licensed
Non-Life companies 24
Life companies 18
Reinsurance companies 2
Insurance brokers 51
Reinsurance brokers 1
Loss adjusters 1
Agents 1 200
Table 2.2: Market Shares of Life Companies
Company Percentage of market share (%)
2003 2004 2005 2006 2007 2008 2009 2010
State Insurance Company Ltd 22 24 26 29 32 30 28 26
Gemini Life Insurance Company Ltd 18 16 15 14 16 13 14 11
Enterprise Life Assurance Ltd 8 10 12 13 15 17 19 21
Star Life Company 13 10 10 7 8 9 10 10
Metropolitan Life Insurance Ltd 14 10 9 7 7 7 6 6
Vanguard Life Insurance Ltd 6 8 4 9 6 6 7 9
Others 19 22 24 21 16 18 16 17
Total 100 100 100 100 100 100 100 100
Source: NIC, 2007, 2010.
Table 2.3: Market Shares of Non-life Companies
Company Percentage of market share (%)
2003 2004 2005 2006 2007
State Insurance Company Ltd 38 37 40 39 37
Enterprise Insurance Company Ltd 16 14 15 12 12
Metropolitan Insurance Company Ltd 12 10 10 10 9
Vanguard Insurance Company Ltd 8 9 8 9 8
Star Insurance Company Ltd 5 7 7 7 7
Ghana Union Insurance Company Ltd 5 5 5 4 4
Others 16 18 15 19 23
Total 100 100 100 100 100
Source: NIC, 2007, 2010.
Source: NIC, 2009, 2010, 2011.
Stellenbosch University https://scholar.sun.ac.za

15
In 2001 the industry recorded an annual gross premium income of GHS32.254 million, accounting
for 0.85 percent of Ghana’s gross domestic product. This was quite low compared with 17.34
percent for South Africa. However, since 2001 the sector has recorded an increase of about 20
times in gross premiums, reaching GHS628.53 million in 2011. The non-life subsector, which
generates much of the total industry premiums, has total assets of GHS651 million while the life
sector has GHS492 million (NIC, 2011). The key indicators of both the life and non-life subsectors
are illustrated in Table 2.4. The growth in the industry and the premiums mobilized by both sectors
of the industry has long-term positive effects on the economic growth of Ghana (Alhassan &
Fiador, 2014).
Table 2.4: Key Indicators of the Life and Non-life Sectors, 2011
Indicators 2011 (GHS million) 2010 (GHS million) Growth (%)
Life Companies
Total Assets 492 367 34
Total Investments 371 273 36
Actuarial Liabilities 346 243 42
Total Capitalization 104 90 17
Non-life Companies
Total Assets 651 582 12
Total Investments 309 301 3
Actuarial Liabilities 184 140 31
Total Capitalization 324 313 4
Source: NIC, 2011.
The increased market activity and the growing competition have exposed the industry to
operational abuses such as price undercutting, unethical underwriting and marketing practices and
over-reliance on credit (NIC, 2010). The industry is also plagued with a growing number of
complaints by policyholders against almost every insurer. Since 2005 the Complaints and
Settlements Bureau (CSB)5 has received a staggering total of 1 981 complaints from policyholders
against various insurance companies for reasons such as:
1. Disparity between benefits promised by insurers verbally from stated benefits in policy
documents;
2. Unauthorised deductions of premiums from a policyholder’s bank account even after policy
has been surrendered;
4 This amounts to US$32.25 million in 2006, using the then exchange rate between the GHS and the US$
5 The CSB is the arbitration arm of the NIC.
Stellenbosch University https://scholar.sun.ac.za

16
3. Disagreements regarding claims settlement, quantum of claims and payments (NIC, 2010 &
2008).
The many complaints and the reasons underlying them have adverse effects on the confidence of
the public about the trustworthiness of insurance firms, and this can reduce the already low levels
of insurance penetration in the country. It is therefore not surprising that the level of insurance
penetration has reduced from 1.89 percent in 2010 to 1.06 percent in 2011 as against 14.8 percent
in South Africa, 7.3 percent in Namibia, 2.8 percent in Kenya and 4.8 percent in Malaysia (Swiss
Re, 2010a). The level of insurance penetration for the past ten years is presented in Table 2.5.
In terms of risk management and cost efficiency, Ansah-Adu et al. (2012) indicated that out of 30
insurers 25 have inconsistent efficiency scores and 2 have retrogressive efficiency scores. Their
findings suggest that non-life firms are less efficient in the management of their cost structures.
The presence of cost inefficiencies in risk management may impede effective underwriting
regarding what risk to absorb, what to avoid and what to transfer to a reinsurer.
Table 2.5: Premium Growth and Insurance Penetration
Year Premiums (GHS) Growth (%) Penetration (%GDP)
2001 32 251 600 26.0 0.85
2002 47 205 989 46.3 0.95
2003 71 283 978 51.0 1.08
2004 92 583 146 29.8 1.16
2005 122 925 795 24.7 1.26
2006 164 207 266 33.5 1.40
2007 209 457 409 27.5 1.49
2008 276 494 733 32.0 1.58
2009 343 072 874 23.2 1.58
2010 458 694 769 33.0 1.89
2011 628 528 775 37.2 1.06
Source: NIC, 2005, 2007, 2011.
2.3. THE MICROINSURANCE SECTOR
2.3.1. Clients’ Characteristics
The clients of microinsurance scheme are mostly households living and working in the informal
sector. The economically active ones are smallholder farmers, fruits and vegetables sellers,
fishmongers, dressmakers and tailors, carpenters, truck pushers, “head-porters”, chop-bar6
6 Local restaurant
Stellenbosch University https://scholar.sun.ac.za
17
operators and provisions7 sellers. The income flow of these workers is mostly seasonal in timing
and uneven in amount. For instance farmers may record significant increase in income during the
harvesting period, but can face drastic decline in income during the planting season. This is why
most successful microinsurance schemes structure the insurance premium payments according to
the cash flow of the clients.
With regard to the level of income, microinsurance clients have been classified into two levels by
Swiss Re (2010b). These are: (1) persons living above US$1.258 per day up to US$4 per day, and
(2) those whose daily consumption is below US$1.25. Those in the first category are the
economically active persons and represent the target market for commercial viable microinsurance
(Swiss Re, 2010b). Almost all the microinsurance products on the Ghanaian market fall within this
category. Examples of such products are: Anidaso, Edwadifu ahobanbo, Sika plan, Abusua
nkyemfa, and Tigo family care. Table 2.7 provides more examples and details of these products.
The second category however consists of the extremely poor with little or no earnings to meet the
basic necessities of life. Providing market-based microinsurance to this category may not be viable
and sustainable (Swiss Re, 2010b). Nevertheless, the extremely poor can be insured through
government sponsored schemes such as providing country-wide social protection policy such as
health insurance and unemployment insurance (Swiss Re, 2010b). An example of such a policy is
the National Health Insurance Scheme (NHIS) of Ghana which has relieved the poor of out-of-
pocket health care costs. Governments can also enter into a public private partnership (PPP)
agreement for the provision of microinsurance to the extremely poor at subsidised premiums by
government (Swiss Re, 2010b). An example of microinsurance PPP agreement is the current
partnership between the government and the Ghana Insurers Association (GIA) under the Ghana
Agricultural Insurance Programme (GAIP) for the provision of microinsurance services to farmers
at subsidised premiums.
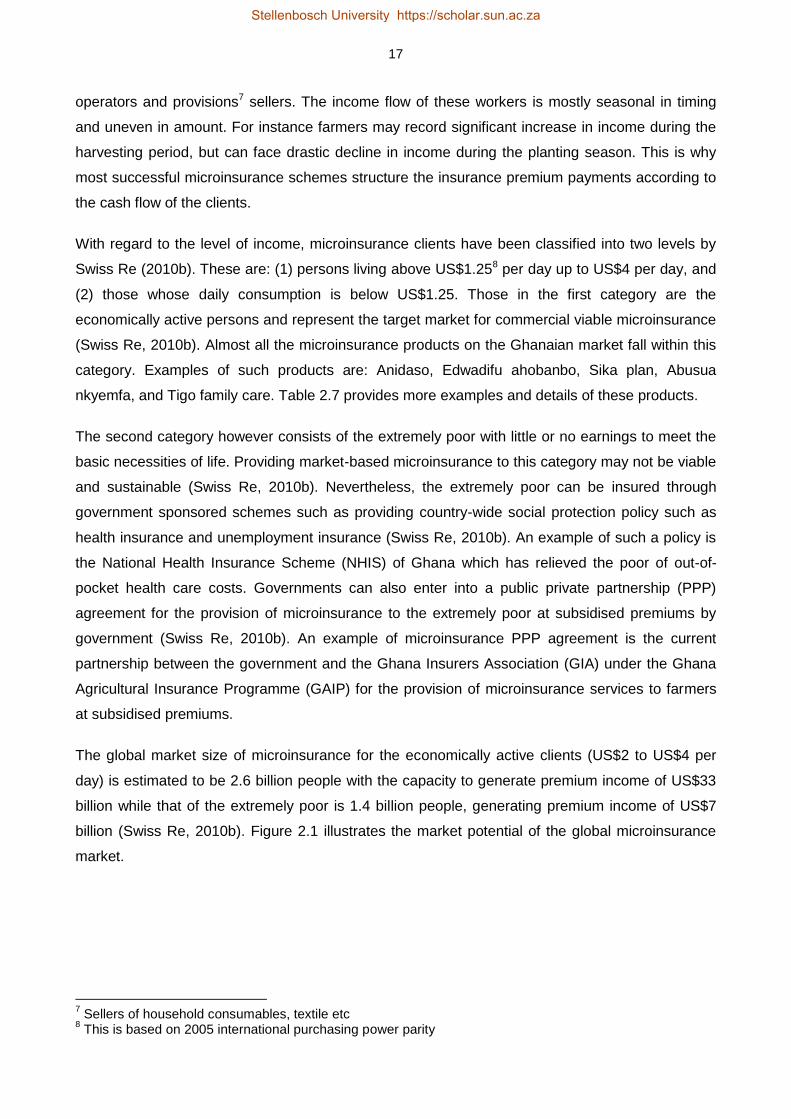
The global market size of microinsurance for the economically active clients (US$2 to US$4 per
day) is estimated to be 2.6 billion people with the capacity to generate premium income of US$33
billion while that of the extremely poor is 1.4 billion people, generating premium income of US$7
billion (Swiss Re, 2010b). Figure 2.1 illustrates the market potential of the global microinsurance
market.
7 Sellers of household consumables, textile etc
8 This is based on 2005 international purchasing power parity
Stellenbosch University https://scholar.sun.ac.za

18
Medium to Conventional insurance high income market
US$2 – 4/day Microinsurance market 2.6 billion people (commercially viable) US$33 billion market
US$1.25/day Microinsurance through 1.4 billion people aid/government support (US$7 billion market
Figure 2.1: Poverty Line and Size of the Microinsurance Market
Source: Swiss Re (2010b); Chen and Ravallion (2010); http://iresearch.worldbank.org/PovcalNet.
The market in Ghana though in a nascent stage has witnessed impressive growth in the number of
firms, policyholders and underwriting activities. The National Insurance Commission uses the
concept of down-scaling to promote the extension of insurance services to the lower end of the
market. Its policy document on microinsurance states that “insurers cannot designate a product as
microinsurance unless it considers that the product satisfied the following criteria: (1) target at low-
income households; (2) affordable for low-income households and (3) accessible to low-income
households” (NIC, 2011:3). It also requires insurers to make microinsurance contract very simple
to understand with less legalese and no or few exceptions. It further requires claims to be dealt
with expeditiously within 7 to 10 days (NIC, 2011). The operational definition of microinsurance in
this study takes from both Churchill (2007) and NIC (2011).
From the early 2000s, the NIC begun to address the institutional and market barriers relating to the
demand for and supply of microinsurance. The demand barriers have been identified as negative
perception about insurers, lack of knowledge about how insurance works and affordability (Bendig
et al., 2009; Steiner & Giesbert, 2010; Finmark Trust, 2010; Owusu et al., 2012; Ackah & Owusu,
2012). The NIC together with other stakeholders has instituted a national insurance literacy
campaign to resolve some of these barriers to the uptake of microinsurance services.
On the supply side, the Commission has reviewed its microinsurance policy by removing certain
restrictions in order to incentivize formal insurance companies to enter the microinsurance market.
For instance, formal insurance firms do not need approval before rolling out a microinsurance
P
overt
y lin
e
Stellenbosch University https://scholar.sun.ac.za

19
product, but the product needs to be filed with the Commission (NIC, 2011). This is intended to
reduce the time and cost that formal insurers incur in getting product approval. It is also intended to
encourage insurers to direct attention to the lower end of the market. In addition the NIC, with
technical support from the Deutsche Gesellschaft für Internationale Zusammenarbeit (GIZ), has
trained insurers on the benefits of the microinsurance market and how to adopt cost effective ways
to enter and stay profitable in the microinsurance market.
Through such policy facilitations many commercial insurers have shown increased interest in
getting further involved in microinsurance provision (Buabeng & Gruijters, 2012). As at July 2012
11 insurers comprising 8 life and 3 non-life insurance companies have rolled out 16 microinsurance
schemes across the rural and urban areas of the country (NIC & GIZ, 2012; Buabeng & Gruijters,
2012). These schemes covered a total of 66 241 policyholders in 2010 and 1 259 055 in 2011,
indicating a whopping percentage growth of more than 1 800 percent (Buabeng & Gruijters, 2012).
The product portfolio of the market is dominated by health, savings-linked and funeral/term life
policies. Other policies are drought index, credit-linked and property policies. Term life, also called
a funeral policy, is the most patronized product with a total of 319 244 policies covering more than
half a million policyholders. Credit-linked products, which indemnify a borrower against an
outstanding loan amount, are the second most patronized schemes, with coverage of more than
400 000 policyholders. Though the country is predominantly agrarian, the agricultural schemes
have the lowest number of policies covering a little more than 3 000 farmers.
In 2011, the microinsurance sector’s annual premium stood at GHS11 703 488. The savings-linked
or endowment products have about 80 percent share of the premiums paid, making it the largest
scheme in terms of financial value. This may be explained by the scheme’s features which allow
the insurable loss to be covered and also provide a savings component for the insured. More than
GHS4 million valid claims were paid to various policyholders most of whom were traders whose
goods were destroyed by fire in some market centres in the country. Table 2.6 presents the types
of microinsurance products on the market, the number of policies, number of insured persons,
premiums and claims paid.
Table 2.6: Market Indicators of the Microinsurance Sector, 2011
Product No. of No. of No. of Premiums Claims
Products Policies Policyholders (GHS) (GHS)
Funeral/Term Life 4 319 244 626 582 903 169 269 121
Savings-linked/endow 7 106 461 130 346 9 255 396 3 935 629
Credit-linked 3 257 507 497 197 1 206 135 158 341
Agricultural 1 10 3 073 36 209 0
Property 1 1 857 1 857 302 579 58 403
Total 16 685 078 1 259 055 11 703 488 4 421 494
Source: Buabeng and Gruijters, 2012; NIC and GIZ, 2012.
Stellenbosch University https://scholar.sun.ac.za

20
2.3.2. Examples of Microinsurance Providers
This section provides a review of the major providers of microinsurance services and their
products. Examples of the major providers are: Gemini Life Insurance Company (GLICO),
MicroEnsure, SIC Life, Star Life, Ghana Agricultural Insurance Program (GAIP) (see Table 2.7).
GLICO’s Anidaso9 Policy10
The Anidaso insurance policy was developed by Gemini Life Insurance Company (GLICO) with
technical assistance from CARE International in 2003 to meet the insurance needs of low-income
earners. The policy is a term insurance plan and it is offered as a joint product with the Edwa
Nkosuo11 product. The Anidaso policy and the Edwa Nkosuo product together provide a savings
avenue and insurance protection for low-income households and SMEs at very affordable
premiums.
Table 2.7: Microinsurance Products
Insurer Microinsurance Product Class of Policy
GLICO Anidaso Life, Family Life, Endowment,
Hospital Cash, Children’s Education
Donewell Insurance Edwadifu Life, Savings-linked
Ahobanbo
SIC Life Sika Plan Life, Savings-linked, Funeral
Star Life Assurance Various Life, Health, Funeral, Property
Vanguard Insurance Shop Owner’s Property, Goods in Transit
Policy
Ghana Agricultural Drought-Index Crop insurance, Food Chain Policy
Insurance Pool
Credit Unions Life Savings Life
The Anidaso Policy can be taken out as a stand-alone policy or together with the savings benefit. It
covers the life of the policyholder and his/her immediate dependents such as a spouse. Other
benefits of the policy include hospitalization income, accident and disability benefit. The product is
sold by GLICO in partnership with 26 rural and community banks (RCBs) and a number of
microfinance firms in five administrative regions of Ghana. The distribution partnership with RCBs
and MFIs has helped the company to increase the number of its policyholders by 471 percent, from
14 000 in 2005 to 80 000 in 2009.
9 Anidaso means hope.
10 http://www.glicolife.com
11 Edwa Nkosuo means successful market.
Source: Adapted from Wiedmaier-Pfister and McCord, 2009.
Stellenbosch University https://scholar.sun.ac.za

21
MicroEnsure Products12
MicroEnsure is a USA based microinsurance intermediary which has partnered certain local
insurers to provide affordable insurance services to SMEs and low-income households.
Established in 2005, it is now operating in Ghana, Kenya and Tanzania. Among others it offers the
Obra Pa, Tigo Family Care, savings-linked and Package policies. The Obra Pa policy covers credit
life, fire, flood and property loss. The Tigo Family Care policy extends free life cover to subscribers
of Tigo13 depending on the amount of airtime used within a month.
In addition to the airtime usage, policyholders desiring to enjoy extra benefits under the life cover
are required to pay GHS1 per month as insurance premiums. The savings-linked policy provides
free life cover to a depositor who saves a minimum of US$25 per month in designated banks or
microfinance firms. The life cover benefit increases with the level of savings made over a specified
period. The Package policy combines a number of products to meet a specific need. It covers all
the benefits under the Obra Pa policy in addition to funeral, health and disability into a single ‘care’
policy. This reduces clients’ subscription cost and facilitates easier administration.
The Star Microinsurance Products
Star Life Assurance has established a subsidiary called Star Microinsurance Services Limited
which is dedicated to the provision of only microinsurance services to the informal sector and low-
income households. It offers investment and funeral policy, micro-health plan, childcare plan,
abusua nkyemfa14, banc assurance, uni-mobile, savings-linked and credit protection plan. The uni-
mobile is a life policy sold in partnership with a commercial bank (Unibank Limited) and a mobile
phone company (Airtel Limited). It is an innovative product that allows clients to use mobile phones
to pay insurance premiums, make bank deposits, transfer money and top-up mobile phone credit15.
Star Microinsurance Services Limited distributes its products in partnership with 25 rural banks, 6
microfinance companies, 35 savings and loans companies, 11 direct market agencies and on the
extensive platform of Ghana Post Company. It has also partnered the Ghana Cooperative of Susu
Collectors Association (GCSCA) to provide microinsurance products to GCSCA’s members16.
The Drought Index Product
This product indemnifies crop farmers and other entities in the crop production chain against crop
failure due to drought experienced during a cropping cycle. It is intended to empower smallholder
farmers to overcome crop failure and financial consequences of drought and erratic rainfall
patterns (Appenteng-Mensah & Gille, 2012). The product was introduced in 2011 by the Ghana
Agricultural Insurance Programme (GAIP) for maize farmers in the three northern regions of
12
http://www.microensure.com 13
Tigo is a mobile telecommunications provider. 14
Abusua nkyemfa is a local parlance which translates as contribution for the wellbeing of the family 15
(www.starmicroinsurance.gh.com) 16
(www.starmicroinsurance.gh.com)
Stellenbosch University https://scholar.sun.ac.za
22
Ghana. Since drought is a covariant risk, it can destroy several hectares of crops owned by many
farmers. This widespread impact of drought makes it financially difficult for a single insurer to
insure farmers against drought. In order to overcome this, GAIP put together a pool of 19 non-life
insurers to underwrite this product. The underwriters group, known as the Technical Management
Unit (TMU), operates under the auspices of the Ghana Insurers Association (GIA) to underwrite the
drought index product (NIC, 2011).
As at the end of 2011, over 3 000 farmers with a total crop area of 5 045 acres had been insured
under the drought index scheme (Appenteng-Mensah & Gille, 2012). In all a total premium of
GHS36 000, translating into a total sum assured of GHS0.58 million, has been paid (Appenteng-
Mensah & Gille, 2012). The GAIP has expanded coverage of the product to the farming
communities in six regions: Northern, Upper East, Upper West, Brong Ahafo, Ashanti and Eastern.
The drought index product uses the level of rainfall measured at Ghana Meteorological Agency’s
(GMet) weather stations as the basis to trigger claims pay-outs. As explained by Appenteng-
Mensah and Gille (2012) and GlobalAgRisk (2006), claims pay-outs are triggered if during the
contract period there is a shortfall of the calibrated rainfall below a pre-determined threshold. For
instance, from May to September 2012, the weather stations at Tamale and Pong Tamale
recorded rainfalls which were below the contractual pre-defined thresholds (i.e. less than 2.5mm
per day). This triggered a pay-out to 136 maize farmers in the Northern, Upper East and Upper
West regions of the country (GNA, 2012).
The area yield index insurance (AYII) is another agricultural microinsurance product which the
GAIP is currently piloting in three districts in the Upper West region (Stutley, 2012). The AYII uses
the average yield of a defined geographical area to indemnify the shortfall in crop yields (Stutley,
2012). Unlike the drought index, the AYII provides extensive coverage of weather-related risks
such as drought, excess rainfall or flooding, windstorms, pest and diseases as well as risks that
affect crop yield at a district level (Appenteng-Mensah & Gille, 2012).
The National Health Insurance Scheme17
The National Health Insurance Scheme (NHIS) was started in 2003 by the government of Ghana to
provide health insurance to all Ghanaians. It operates through 145 district mutual health insurance
schemes. Each district distributes its scheme at designated places in rural and urban areas
through registered agents and scheme officers who call at homes and work places to register and
collect premiums from policyholders. It has over 5 000 service providers which are drawn from
public and private hospitals, clinics and pharmacies. For beneficiaries to access health care they
17
According to the operational definition of microinsurance by the NIC and as adopted in this study, only the information on the informal sector clients of the NHIS is covered in this study.
Stellenbosch University https://scholar.sun.ac.za

23
are required to follow the “gate-keeper system”, that is, to first report to a primary care facility, and
subsequently to the second and third levels of health care by way of referral (NHIA, 2010).
The scheme is funded by a combination of VAT levy and compulsory monthly premiums from the
social security contributions of formal sector workers. This entitles formal sector workers access to
the scheme upon registration. Informal sector workers are however not bound to join the scheme,
but may do so voluntarily after paying the required premiums which range from GHS12 to GHS15
(US$6 to US$7.5) per person yearly (Matul et al., 2010). Currently, about 66 percent of the
population has signed up for this scheme, of which 29.2 percent (4.5 million) are from the informal
sector (NHIS, 2010). Persons below 18 years, the aged (above 70 years), pensioners under the
Social Security and National Insurance Trust (SSNIT) and indigents are exempted from paying
premiums under the scheme, but they are required to pay a registration fee of GHS5.00 (US$2.00)
per annum. Tables 2.8 and 2.9 provide summary statistics of the scheme.
With increasing coverage, health services utilization has also grown, averaging two visits per head
per year for insured persons, compared to the national level estimated at 0.5 (Matul et al., 2010).
Indeed, by removing the out-of-pocket expenditures on health, the NHIS has improved access to
professional health care facilities and skilled birth attendants.
Table 2.8: Summary Statistics of the NHIS, 2010
Members/Items Numbers
Schemes in Operation 145
Total Registered Members (% of Population) 66.4%
Active Members as % of Total Registered Members 80.6%
Medical Conditions Covered 95%
Number of Service Providers Over 5 000
Source: The Ghana National Health Insurance Authority, 2010.
Table 2.9: Groups and Percentage of Registered Members, 2010
Category Number Registered Percentage (%)
Informal Adult 4 546 059 29.2
Aged (≥70 years) 1 006 529 6.5
Under 18 years 7 604 324 48.9
SSNIT Contributors 915 924 5.9
SSNIT Pensioners 81 604 0.5
Indigents 350 035 2.3
Expectant Mothers 1 051 41 6.7
Source: The Ghana National Health Insurance Authority, 2010.
Stellenbosch University https://scholar.sun.ac.za

24
2.3.3. Microinsurance Distribution Model
The most significant issue for the achievement of sustainable expansion in microinsurance
services is proper distribution which ensures that microinsurance products reach the target market
in a cost effective manner (McCord, 2012). Microinsurance distribution is not just sales, but careful
management of clients’ trust and expectation levels, and delivery of products that meet the specific
socio-economic circumstances of the clients. As noted by Helms (2006), the distribution model
must address (1) scale – increasing financial access to a greater percentage of the population; (2)
depth – reaching both the urban and rural poor in remote locations; (3) cost – lowering transaction
costs through technology. In addition, claims must be assessed, approved if valid and paid very
timeously (Steinmann, 2012).
Achieving scale, depth and cost effectiveness by selling many “tiny” policies to millions of
prospective clients spread across large geographical areas is mostly beyond the existing branch
network and cost structures of most traditional insurance firms (Steinmann, 2012). In order to
overcome this hurdle most insurers have adopted four main models for the distribution of
microinsurance products: partner-agent model, nodal societies, direct sales agents and telecom
operators.
Under the partner-agent model, commercial insurers enter into partnerships with rural and
community banks as well as microfinance institutions for the delivery of microinsurance products to
the target communities (McCord, 2006). The benefits to an insurer under this model include easy
access to an existing client base otherwise difficult to reach, easy access to infrastructure such as
a client information database, and increased access points and physical footprint (Angove et al.,
2012). The delivery partner is usually responsible for the day-to-day business activities such as
sales, premium collections, claims processing and settlement and timely communication with
policyholders (Steinmann, 2012). The partner-agent model is the most widely used distribution
channel in Ghana with more than 300 000 policies currently being managed under it. Some
providers who are using this model have increased their market shares and are beginning to reap
the benefits of economies of scale.
Under the nodal societies model insurers deliver the microinsurance services through mutual
organizations such as churches, market women associations and civil societies such as
community-based organizations (CBOs) and NGOs (Guha-Khasnobis & Ahuja (2004). Being
member-based, nodal societies exert peer influence and group monitoring which are essential for
the reduction of moral hazards, adverse selection and fraud associated with microinsurance
demand. Nodal societies also help to reduce transaction costs by making bulk payments of
premiums on behalf of members as well as the speedy determination and settlement of valid
claims.
Stellenbosch University https://scholar.sun.ac.za
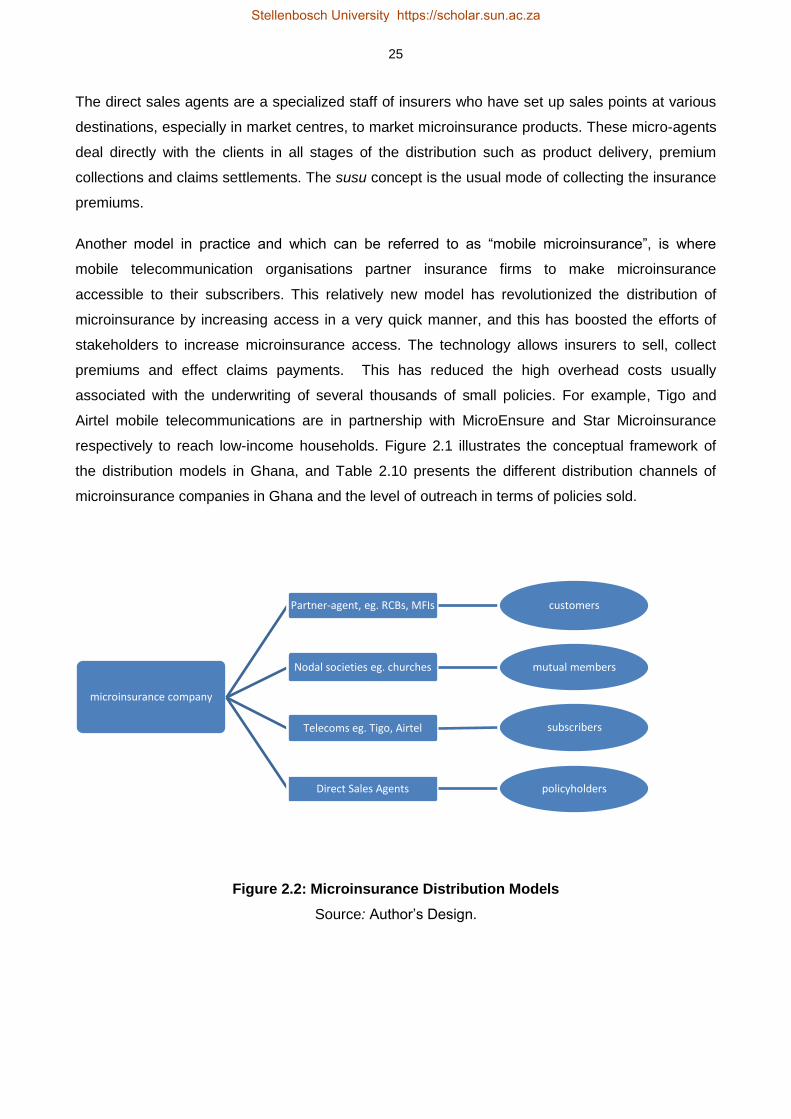
25
The direct sales agents are a specialized staff of insurers who have set up sales points at various
destinations, especially in market centres, to market microinsurance products. These micro-agents
deal directly with the clients in all stages of the distribution such as product delivery, premium
collections and claims settlements. The susu concept is the usual mode of collecting the insurance
premiums.
Another model in practice and which can be referred to as “mobile microinsurance”, is where
mobile telecommunication organisations partner insurance firms to make microinsurance
accessible to their subscribers. This relatively new model has revolutionized the distribution of
microinsurance by increasing access in a very quick manner, and this has boosted the efforts of
stakeholders to increase microinsurance access. The technology allows insurers to sell, collect
premiums and effect claims payments. This has reduced the high overhead costs usually
associated with the underwriting of several thousands of small policies. For example, Tigo and
Airtel mobile telecommunications are in partnership with MicroEnsure and Star Microinsurance
respectively to reach low-income households. Figure 2.1 illustrates the conceptual framework of
the distribution models in Ghana, and Table 2.10 presents the different distribution channels of
microinsurance companies in Ghana and the level of outreach in terms of policies sold.
Figure 2.2: Microinsurance Distribution Models
Source: Author’s Design.
microinsurance company
Partner-agent, eg. RCBs, MFIs customers
Nodal societies eg. churches mutual members
Telecoms eg. Tigo, Airtel subscribers
Direct Sales Agents policyholders
Stellenbosch University https://scholar.sun.ac.za

26
Table 2.10: Distribution Models and Policies Sold, 2011
Distribution Models Total Policies Distributed
Direct Sales (Company Agents) 24 668
RCBs and MFIs 343 243
Telecoms Providers 302 194
Nodal Societies:
Churches 13 116
Others 1 857
Source: Buabeng and Gruijters, 2012; NIC, 2012.
2.3.4. Challenges of the Microinsurance Sector
The NIC’s microinsurance strategy being implemented through the down-scaling concept has
increased the scale and outreach of microinsurance to more than 1 million lives, nevertheless, the
down-scaling concept does not promote policyholders’ input into product design nor their
involvement in the governance and risk management structures of the schemes. This situation may
create mistrust in insurers by prospective policyholders.
Another challenge of the sector is lack of sufficient knowledge about how the risk pooling concept
of microinsurance works. Difficulty in understanding this concept and its implications creates the
misconception that microinsurance and bank savings are the same. This situation, which can
obscure the true value of microinsurance, according to Baidoo and Buss (2012:90) “is further
exacerbated by the inability of some agents to explain policy terms and conditions to prospective
clients”. Indeed the 2010 FINSCOPE Household Survey of Ghana reports the obstacles to the
demand for insurance services as lack of knowledge about how insurance works, the perception
that risks are by providence and lack of trust in insurers (Finmark Trust, 2010).
Currently the sector is not covered by the Insurance Law, Act 724 (2006). This lack of legislative
backing has restricted the entry of more insurers into the microinsurance market. It is however
noteworthy that the NIC has prepared a transitional framework and market guidelines to streamline
the activities of the sector. It has also incorporated it in the proposed amendments to the insurance
law.
The sector is also challenged by certain market abuses such as moral hazards, adverse selection
and fraud. These abuses can render an insurer insolvent and destroy the already low confidence
that the public has in insurance services. Adverse selection and moral hazards can be controlled
through due diligence and screening during the underwriting process, co-payments and
deductibles and waiting periods (Roth & McCord, 2008).
Stellenbosch University https://scholar.sun.ac.za
27
2.4. CONCLUSION
This review has highlighted some stylized facts and current trends of the Ghanaian insurance
industry with particular focus on the microinsurance sector. The review shows that although the
microinsurance sector is at the teething stage, it has recorded impressive growth with about one
million lives insured under different policies. Recognizing its immense potential to facilitate
insurance inclusiveness to the informal economy, the NIC has initiated a policy amendment to
provide legislative backing to it.
The major challenges of the microinsurance sector are how to achieve large scale expansion in a
cost effective manner, low levels of insurance literacy, the negative perception that risks are by
fate, and lack of trust in insurers.
Challenges surrounding the determination and payments of valid claims on time have also
undermined the growth of the microinsurance sector. Microinsurance can add more to household
welfare if the delicate issues concerning claims determination and payment are handled very
timeously as stipulated in the market guidelines by the NIC. Judging from the economic
background of the policyholders, every single pesewa is valued dearly, hence any administrative
process that unduly delays the settlement of valid claims may undermine the positive impacts of
microinsurance on welfare. For example, in an emergency situation, microinsurance can prevent
asset loss and emergency borrowing if valid claims are paid expeditiously.
Addressing the thorny issues surrounding insurance claims will also correct the negative
perception that the public has about insurers. Appropriate market education targeted at the
informal economy and risk-based supervision of insurers by the NIC can help to resolve some of
these challenges.
Stellenbosch University https://scholar.sun.ac.za
28
REFERENCES
Ackah, C. & Owusu, A. 2012. Assessing the knowledge of and attitude towards insurance in
Ghana. Available at http://www.utwente.nl, accessed on 1 August 2014.
Alhassan, A.L. & Fiador, V. 2014. Insurance-growth nexus in Ghana: An autoregressive distributed
lag bounds co-integration approach. Review of Development Finance, 4(2), 83-96.
Angove, J., Herrndorf, M. & Mathews, B. 2012. Teaching elephants to dance: The experience of
commercial insurers in low-income markets. In Churchill, C. & Matul, M. (eds.), Protecting the poor:
A microinsurance compendium, Volume II, 399-426. Geneva: International Labour Organization.
Ansah-Adu, K., Adnoh, C. & Abor, J. 2012. Evaluating the cost efficiency of insurance companies
in Ghana. Journal of Risk Finance, 13(1), 61-76.
Appenteng-Mensah, K. & Gille, S. 2012. Ghana agricultural insurance programme: Providing
innovative insurance solutions for Ghanaian farmers. In National Insurance Commission (NIC) &
Deutsche Gesellschaft für Internationale Zusammenarbeit (GIZ) (eds.), Promoting microinsurance
in Ghana: Microinsurance as a means of insurance sector development, 186-200. Accra:
QualiType Limited.
Baidoo, I. & Buss, M. 2012. Literature review: Barriers to microinsurance uptake. In National
Insurance Commission (NIC) & Deutsche Gesellschaft für Internationale Zusammenarbeit (GIZ)
(eds.), Promoting microinsurance in Ghana: Microinsurance as a means of insurance sector
development, 89-101. Accra: QualiType Limited.
Bendig, M., Giesbert, L. & Steiner, S. 2009. Savings, credit and insurance: Household demand for
formal financial services in rural Ghana. GIGA Research Programme: Transformation in the
Process of Globalisation, Working Paper No. 94/2009. Hamburg: German Institute of Global and
Area Studies.
Buabeng, I.Y. & Gruijters, R. 2012. Market survey: The supply of microinsurance products in
Ghana. In National Insurance Commission (NIC) & Deutsche Gesellschaft für Internationale
Zusammenarbeit (GIZ) (eds.), Promoting microinsurance in Ghana: Microinsurance as a means of
insurance sector development, 102-109. Accra: QualiType Limited.
Chen, S.& Ravallion, M. 2010.The developing world is poorer than we thought, but no less
successful in the fight against poverty. Quarterly Journal of Economics, 125(4), 1577-1625.
Stellenbosch University https://scholar.sun.ac.za

29
Churchill, C. 2007. Insuring the low-income market challenges and solution for commercial
insurers. The Geneva Papers, 32(3), 401–412.
Finmark Trust. 2010. FinScope Ghana 2010 report: Making financial markets work for the poor.
Accra: Finmark Trust Household Survey.
Ghana News Agency. 2012. Ghana agricultural insurance pays first claims to farmers. Available:
http://ghananewsagency.org/social/ghana-agricultural-insurance-pays-first-claims-to-farmers-
50404 Accessed: 21 May 2014.
GlobalAgRisk. 2006. Index insurance for weather risk in lower-income countries. Lexington, KY:
United States Agency for International Development (USAID).
Guha-Khasnobis, B. & Ahuja, R. 2004. Extending formal insurance to the informal economy
workers in India. EGDI and UNU-WIDER Conference, 17-18 September, 2004, Helsinki, Finland.
Helms, B. 2006. Access for all: Building inclusive financial systems. Washington, DC: The
International Bank for Reconstruction and Development/The World Bank.
Matul, M., McCord, M.J., Phily, C. & Harms, J. 2010. The landscape of microinsurance in Africa.
ILO Microinsurance Working Paper No. 4. Geneva: International Labour Office.
McCord, M. 2012. Distribution channels for microinsurance: Introduction. In National Insurance
Commission (NIC) & Deutsche Gesellschaft für Internationale Zusammenarbeit (GIZ) (eds.),
Promoting microinsurance in Ghana: Microinsurance as a means of insurance sector development,
143-145. Accra: QualiType Limited.
McCord, M. 2006. The partner-agent model: Challenges and opportunities. In Churchill, C. & Matul,
M. (eds.), Protecting the poor: A microinsurance compendium, Volume II, 357-377. Geneva:
International Labour Organization.
National Health Insurance Authority. 2010. Summary statistics of the national health insurance
scheme. Accra: National Health Insurance Authority.
National Insurance Commission (NIC). 2011. The 2011 annual report. Accra: National Insurance
Commission. Available: http://www.nicgh.org. Accessed: 31 March 2014.
National Insurance Commission (NIC). 2010. The 2010 annual report. Accra: National Insurance
Commission. Available: http://www.nicgh.org. Accessed: 12 November 2012.
National Insurance Commission (NIC). 2009. The 2009 annual report. Accra: National Insurance
Commission. Available: http://www.nicgh.org. Accessed: 27 September 2011.
Stellenbosch University https://scholar.sun.ac.za
30
National Insurance Commission (NIC). 2008. The 2008 annual report. Accra: National Insurance
Commission. Available: http://www.nicgh.org. Accessed: 27 September 2011.
National Insurance Commission (NIC). 2007. The 2007 annual report. Accra: National Insurance
Commission. Available: http://www.nicgh.org. Accessed: 27 September 2011.
National Insurance Commission (NIC). 2005. The 2005 annual report. Accra: National Insurance
Commission. Available: http://www.nicgh.org. Accessed: 27 September 2011.
National Insurance Commission (NIC) & Deutsche Gesellschaft für Internationale Zusammenarbeit
(GIZ). 2012. Promoting microinsurance in Ghana: Microinsurance as a means of insurance sector
development. Accra: QualiType Limited.
Owusu, A.Y., Ackah, C. & Gruijters, R. 2012. Market survey: The demand-side: Results from a
survey of microinsurance clients. In National Insurance Commission (NIC) & Deutsche
Gesellschaft für Internationale Zusammenarbeit (GIZ) (eds.), Promoting microinsurance in Ghana:
Microinsurance as a means of insurance sector development, 110-124. Accra: QualiType Limited.
Roth, J. & McCord, M.J. 2008. Agricultural microinsurance: Global practices and prospects.
Agricultural Microinsurance Working Group, Appleton, WI: Microinsurance Centre.
Steiner, S. & Giesbert, L. 2010. Microinsurance: A large untapped market. German Institute for
Economic Research Weekly Report, 6(33), 245-249.
Steinmann, R. 2012. General aspects of microinsurance distribution in Ghana. In National
Insurance Commission (NIC) & Deutsche Gesellschaft für Internationale Zusammenarbeit (GIZ)
(eds.), Promoting microinsurance in Ghana: Microinsurance as a means of insurance sector
development, 146-153. Accra: QualiType Limited.
Stutley, C. 2012. Report on outstanding planning of area yield index insurance (AYII) for
implementation in 2013. Accra: National Insurance Commission.
Swiss Re. 2010a. Global risk 2010: A global risk network report. Geneva: World Economic Forum.
Swiss Re. 2010b. Microinsurance: Risk protection for 4 billion people. Sigma no. 6/2010. Zurich:
Swiss Reinsurance Company.
Wiedmaier-Pfister, M. & McCord, M.J. 2009. Feasibility study on support to the microinsurance
sector in Ghana with a financial systems approach. Accra: National Insurance Commission of
Ghana.
Stellenbosch University https://scholar.sun.ac.za
31
Websites:
http://iresearch.worldbank.org/PovcalNet.
http://www.glicolife.com
http://www.microensure.com
http://www.starmicroinsurance.gh.com
Stellenbosch University https://scholar.sun.ac.za

32
CHAPTER 3
THE IMPACT OF MICROINSURANCE ON HOUSEHOLD ASSET
ACCUMULATION IN GHANA: AN ASSET INDEX APPROACH18
3.1. INTRODUCTION
The first of the Millennium Development Goals (MDGs) is to halve extreme poverty and famine
across the world by the year 2015 (UN, 2010). Although the target period is just one year many
developing nations are far off-track in achieving this objective. One major cause for this is that
millions of the citizens of such countries do not have sufficient insurance cover and thus are very
susceptible to the financial consequences of manifold risks such as illness, unemployment and old
age (Loewe, 2006; Binnendijk et al., 2012).
Risks impede the capacity of poor people from breaking the vicious cycle of poverty (Guha-
Khasnobis & Ahuja, 2004). According to Churchill (2007:402), “poverty and vulnerability reinforce
each other in an escalating downward spiral”. Microinsurance can help the poor to deal with risk
effectively by reducing uncertainties associated with losses (Brown and Churchill, 1999). It fulfills
the needs of those previously excluded from formal insurance coverage by protecting them against
the financial consequences of life-cycle risks (Dror & Jacquier, 1999). By insuring households
against future welfare losses, microinsurance helps in the reduction of vulnerability and poverty.
According to Dercon (2003), insurance removes the risk of worsening poverty or poverty traps.
Unlike bank credit, microinsurance may not necessarily lead to the direct acquisitions of more
assets, however, in the absence of microinsurance households may lose critical assets to risks.
Thus one may assume that microinsurance facilitates stability and steady growth of household
assets through the prevention of asset loss and the release of available savings for the acquisition
of essential assets.
However the available evidence about the impact of microinsurance on household asset retention
and accumulation is inconclusive. Whereas some studies discovered that microinsurance leads to
counterintuitive tendencies such as moral hazard and adverse selection among microenterprises
(Giné & Yang, 2009; Giesbert et al., 2011), others argue that microinsurance facilitates
microenterprises’ investments into high yielding projects which improve their productivity and
welfare (Nicola, 2011). Also the experience of Europe and America shows a positive relationship
between insurance, savings levels and economic well-being (Starr-McCluer, 1996; Guariglia &
18
This paper has been published in the Geneva Papers on Risk and Insurance-Issues and Practice, (2014) 39, 304–321. doi:10.1057/gpp.2014.6. An extract from this paper was also presented at the Economic Society of South Africa Biennial Conference, 25-27 September, 2013, University of the Free State, Bloemfontein, South Africa.
Stellenbosch University https://scholar.sun.ac.za

33
Rossi, 2004), but that of some Asian countries is said to be negative (Cheung & Padieu, 2011; Hsu
et al., 2011). The inconclusive empirical evidence from the various regions of the world and the
many gaps in the existing literature calls for a very rigorous country-specific study that will test the
real impacts of microinsurance on households’ welfare.
This study provides new evidence by examining the impact of microinsurance on asset
accumulation of low-income households in Ghana. In particular we ask: can microinsurance
prevent asset loss and thus lead to asset accumulation among low-income households? Some
microinsurance services have been operating in Ghana for the last decade, but the question of
whether they have led to asset accumulation and enhanced welfare gains of households
concerned, mostly in the informal sector, is largely unresearched. More importantly, when
juxtaposed with the poverty situation in Ghana, it is imperative to ascertain whether the intervention
of microinsurance schemes have helped in increasing welfare of beneficiaries. In this study we
show that microinsurance can have a positive influence on households’ asset accumulation and
hence improves welfare.
We examine this research question by creating a composite asset index as a measure of
household welfare. The use of the asset-index is not a novelty, it has been used quite extensively
in the mainstream poverty or welfare literature to measure country-level poverty reduction efforts
(e.g. see Sahn & Stifel, 2000; Booysen et al., 2008; Njong & Ningaye, 2008; Echevin, 2011; Filmer
& Scott, 2012; Harttgen et al., 2013). The missing link in both the microinsurance and the
mainstream welfare literature is this: the microinsurance literature has so far not used asset index
as a measure of households’ welfare19 and the mainstream welfare literature has not assessed the
effects of microinsurance usage on households’ asset index. Practically, using household assets
instead of income or expenditure to measure welfare levels is more accurate and reliable. The
measurement of the income of households in the informal sector is hindered by seasonality, recall
bias and households’ reluctance to divulge sensitive information concerning their income and
expenditure levels. Yet it is much easier for households to provide correct answers on asset
ownership questions such as whether the household has radio, television, piped water, electricity
etc. Thus the use of assets to measure welfare helps us to overcome the challenges associated
with accurate measurement of income and expenditure.
The rest of the chapter is structured as follows: the relevant literature is reviewed in section 3.1;
section 3.2 provides a brief overview of the microinsurance industry in Ghana; section 3.3
describes the methodology; section 3.4 discusses the results and section 3.5 provides conclusions
and policy recommendations.
19
Janzen and Carter (2013) created a non-livestock index and used it as an independent variable to estimate the impact of microinsurance on risk coping strategies of households in Kenya. The difference is that we are using the asset index as the dependent variable in our analysis.
Stellenbosch University https://scholar.sun.ac.za

34
3.2. LITERATURE REVIEW
3.2.1. The Theory of Insurance
The economic theory of insurance is based on the expected utility theory advanced by Von
Neumann-Morgenstern. This theory assumes that the utility of a person is a concave function of
wealth. This implies that risk averse individuals have a diminishing marginal utility of wealth (Frank,
2004) and so they buy insurance product in order to replace the uncertainty of incurring large
financial loss (in the event of a shock) with the certainty of making regular premium payments
(Mossin, 1968; Brown & Churchill, 1999). Thus insurance enables individuals to transfer risk from a
state of uncertainty to another state of certainty.
It is however argued by psychologists that the risk transfer principle of insurance does not reflect
actual behaviour because individuals actually seek for the risk of no loss at all, instead of the
certainty of paying insurance premiums (Nyman, 1998). Therefore the reason people buy
insurance is not to transfer risk, but as argued by Nyman (1998) to obtain extra income if the
insurable loss occurs.
Despite the seemingly disagreements regarding the motive for insurance demand, the end effect of
the two strands of the insurance theory indicates that insurance can increase welfare by preventing
asset loss. The implication of these theories for low-income households – the target market of
microinsurance – is that they may benefit from insurance in two ways: (1) by replacing the
uncertainty of future loss with the certainty of paying small premiums; and (2) make a claim on
additional income when the insurable risk occurs. As to whether this theoretical implication
manifest in the lives of insured households is a matter of an empirical test.
3.2.2. Empirical Literature
The growth and development of the microinsurance market is still at the nascent stage with very
little research into its impact on households’ welfare. The few empirical studies about the
microinsurance market in Ghana have tended to focus mainly on access to microinsurance rather
than on the financial impact of microinsurance services. The evidence from other countries largely
focused on micro health insurance (see Dong et al., 1999; Gruber & Yelowitz, 1999; Gumber,
2001; Chou et al., 2004; Wagstaff & Pradhan, 2005; Dror et al., 2006).
Summaries of the available literature have been compiled by De Bock and Ontiveros (2013) and
Dercon et al. (2008). De Bock and Ontiveros’s compilation reveals three strands of literature about
the impact of microinsurance on poor households. Whereas one group of researchers (Aggarwal,
2010; Fitzpatrick et al., 2011; Mahal et al., 2013; Binagwaho et al., 2012) provides evidence of
improved health and beneficial socio-economic impacts of microinsurance on poor households,
others such as Gnawali et al. (2009) indicate otherwise. The third group of authors (Gumber, 2001;
Stellenbosch University https://scholar.sun.ac.za

35
Smith & Sulzbach, 2008; Wagstaff et al., 2009; Lei & Lin, 2009; Dercon et al., 2012) report either
mixed results or no effect at all.
Dercon et al. (2008) explained that microinsurance services have a direct impact on the ex-post
and ex-ante behaviours and decisions of households. Its positive effects on ex-post risk coping
strategies enables individuals and small business entities to maintain a stable consumption pattern
and avoid asset loss. Dercon et al. (2008:8) further assert that “the impact of microinsurance on
consumption, assets or other dimensions of welfare (such as health, nutrition, school enrolment) is
a useful indicator to investigate the role of microinsurance in allowing individuals to avoid further
poverty and hardship”.
Wagstaff and Pradhan (2005) investigated the impact of health insurance on health outcomes,
health care utilization and non-medical consumption expenditure for households in Vietnam. The
results of their study revealed a positive influence of health insurance on height-for-age and
weight-for-age of young school children. They also showed that micro health insurance has led to a
rise in households’ consumption of non-medical services and goods. The study further indicates a
decrease in precautionary savings meant for out-of-pocket health expenditures.
Janzen and Carter (2013) employed difference-in-difference, matching, Heckman sample selection
and instrumental variables techniques to evaluate the impacts of microinsurance on households’
asset accumulation and human capital investments in Kenya. Their findings indicate: (1) insured
households are about 50 percent less likely to sell off livestock to cope with severe drought; (2) the
insured households are about 36 percent less likely to forgo food as a coping strategy. This
reduces the incidence of malnourishment among insured households; and (3) insured households
are about 50 percent less dependent on food aid and external support. They concluded that
microinsurance protects households against the liquidation of productive assets and reduction of
meals. Thus microinsurance reduces the tendency of engaging in harmful behaviours which have
long-term adverse consequences on wealth and human capital development.
Mosley (2009) reports that microinsurance improves clients’ loan repayment rates and has a direct
impact on physical and human capital expenditures. That is, since the microinsured rely less on
emergency borrowing, their expenditure levels are more predictable and reliable. Evidence
provided by Levine and Polimeni (2012) and Dercon et al. (2008) confirm Mosley’s findings that
microinsurance reduces emergency borrowing.
With the aid of ordinal probit regression, Morsink et al. (2011) analysed the impact of
microinsurance on 215 households in the Philippines. Their findings indicate that microinsurance
reduces vulnerability and lowers the households’ probability of falling into a poverty trap. Similarly,
Stellenbosch University https://scholar.sun.ac.za

36
Hamid et al. (2010) argue that microinsurance has a significant impact on household food
sufficiency.
As a result of the stability in income flow and expenditure alluded to by Mosley, clients of (micro)
insurance are theoretically expected to save more than those without coverage. Although Hsu et
al. (2011) agree to this theoretical foundation of a positive impact of insurance on saving, they
disagree with it on the basis of contrary empirical evidence. Specifically, Hsu et al. (2011) argued
that in countries where the social welfare system is small, households covered by insurance save
less than those without coverage.
Another study from the Asian region, specifically on China by Cheung and Padieu (2011) confirms
the results of Hsu et al (2011). In particular, Cheung and Padieu (2011) posit that even though
health insurance may facilitate household consumption, it reduces savings. They also claim that
health insurance does not have a significant impact on poverty reduction.
However, other empirical studies from the West, especially in the USA and UK, have provided
evidence which contradicts that of the Asian region. For instance, Starr-McCluer (1996) showed
that households in the USA who have taken health insurance policies save more than those
without coverage. This finding has been supported by Guariglia and Rossi (2004) in a similar study
of the UK insurance market.
Even though the literature suggests that microinsurance may have positive impacts on low-income
households, there are clearly significant gaps in the existing literature. Important questions have
not been answered, especially questions regarding how microinsurance is used by low-income
earners to protect their assets against financial shocks have not been dealt with.
3.3. OVERVIEW OF THE MICROINSURANCE INDUSTRY OF GHANA
Ghana has performed relatively well in the fight against extreme poverty. The percentage of people
living on less than US$1.25 a day declined from 51.7 percent in 1991 to 28.5 percent in 2006
(GSS, 2008). The most recent living standards survey reports of a further decline in the poverty
rate to 24.2 percent (GSS, 2014). Nevertheless, poverty is still widespread, with an estimated 10.6
percent of urban and 37.9 percent of rural dwellers living below the poverty line (GSS, 2014;
UNDP, 2011). Also, the rates of poverty of the three northern regions and rural areas within the
savannah belt are above the national average.
Among the efforts to accelerate the reduction of poverty to the minimum level is the rolling out of
microinsurance schemes by the government and private insurers. Microinsurance is the provision
of insurance services to low-income households mostly living and working in the informal sector. It
covers low-income persons against specific risks in exchange for premium payments. Most of the
Stellenbosch University https://scholar.sun.ac.za

37
microinsurance schemes on the Ghanaian markets are provided by subsidiaries/agencies of
commercial insurance companies in partnership with microfinance institutions to low-income
households. The difference between the microinsurance schemes and the “formal” insurance
services is the structure of the premium payments, levels of premiums, distribution channels and
the target market. The premium payment is structured according to the traditional susu20
mechanism, under which the insurance agents undertake regular visits (say three times a week) to
the work place or house of the policyholders to collect the premiums. Although the premiums are
in proportion to the probability and cost of the risk involved, they are relatively affordable, ranging
from GHS1.00 to GHS10.00 (US$0.33 to US$3.33) per month. Another unique feature of the
microinsurance schemes is its community based distributions channels through nodal agencies
such as local churches, microfinance institutions, community or rural banks, NGOs and market
women associations. The flexibility in the distribution and the premium payments is the backbone
of the extension of microinsurance to low-income households. Table 3.1 presents the different
distribution channels of microinsurance companies in Ghana and the level of outreach in terms of
policies sold (Buabeng & Gruijters, 2012).
Table 3.1: Distribution Models and Policies Sold, 2011
Distribution Models Total Policies Distributed
Direct Sales (Company Agents) 24 668
RCBs and MFIs 343 243
Telecoms Providers 302 194
Nodal Societies:
Churches 13 116
Others 1 857
Source: Buabeng and Gruijters, 2012; NIC and GIZ, 2012.
3.3.1. Examples of Private Microinsurance Schemes
Through policy facilitation by the National Insurance Commission, many commercial insurers have
shown increased interest in getting further involved in microinsurance provision. Some providers
who have been able to partner with rural banks to provide the microinsurance services at the
grassroots have increased their market shares and are beginning to reap the benefits of
economies of scale. For instance, Gemini Life Insurance Company’s (GLICO) Anidaso21 Policy,
which is distributed through 26 rural banks, has been able to expand its operations to five of the
ten regions of Ghana. This has helped the company to increase the number of its policyholders by
471 percent from 14 000 in 2005 to 80 000 in 2009.
20 The regular contribution of smaller amounts of money towards a specified target. 21
Anidaso means hope.
Stellenbosch University https://scholar.sun.ac.za
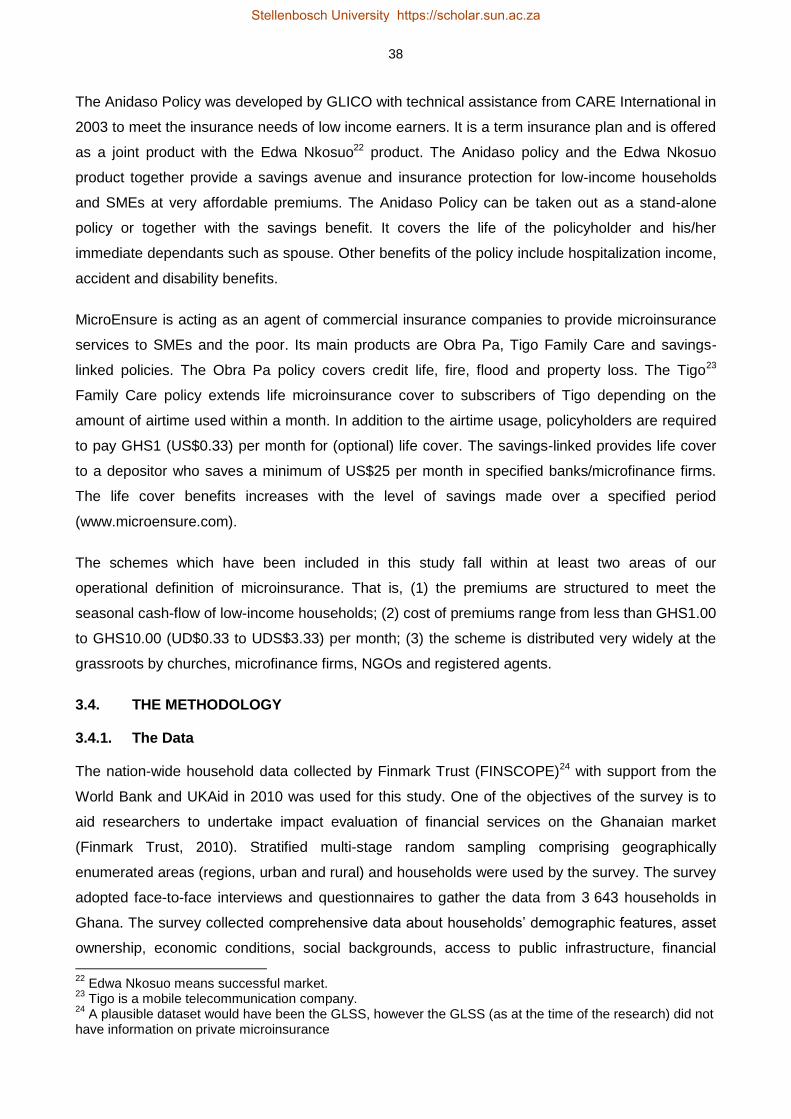
38
The Anidaso Policy was developed by GLICO with technical assistance from CARE International in
2003 to meet the insurance needs of low income earners. It is a term insurance plan and is offered
as a joint product with the Edwa Nkosuo22 product. The Anidaso policy and the Edwa Nkosuo
product together provide a savings avenue and insurance protection for low-income households
and SMEs at very affordable premiums. The Anidaso Policy can be taken out as a stand-alone
policy or together with the savings benefit. It covers the life of the policyholder and his/her
immediate dependants such as spouse. Other benefits of the policy include hospitalization income,
accident and disability benefits.
MicroEnsure is acting as an agent of commercial insurance companies to provide microinsurance
services to SMEs and the poor. Its main products are Obra Pa, Tigo Family Care and savings-
linked policies. The Obra Pa policy covers credit life, fire, flood and property loss. The Tigo23
Family Care policy extends life microinsurance cover to subscribers of Tigo depending on the
amount of airtime used within a month. In addition to the airtime usage, policyholders are required
to pay GHS1 (US$0.33) per month for (optional) life cover. The savings-linked provides life cover
to a depositor who saves a minimum of US$25 per month in specified banks/microfinance firms.
The life cover benefits increases with the level of savings made over a specified period
(www.microensure.com).
The schemes which have been included in this study fall within at least two areas of our
operational definition of microinsurance. That is, (1) the premiums are structured to meet the
seasonal cash-flow of low-income households; (2) cost of premiums range from less than GHS1.00
to GHS10.00 (UD$0.33 to UDS$3.33) per month; (3) the scheme is distributed very widely at the
grassroots by churches, microfinance firms, NGOs and registered agents.
3.4. THE METHODOLOGY
3.4.1. The Data
The nation-wide household data collected by Finmark Trust (FINSCOPE)24 with support from the
World Bank and UKAid in 2010 was used for this study. One of the objectives of the survey is to
aid researchers to undertake impact evaluation of financial services on the Ghanaian market
(Finmark Trust, 2010). Stratified multi-stage random sampling comprising geographically
enumerated areas (regions, urban and rural) and households were used by the survey. The survey
adopted face-to-face interviews and questionnaires to gather the data from 3 643 households in
Ghana. The survey collected comprehensive data about households’ demographic features, asset
ownership, economic conditions, social backgrounds, access to public infrastructure, financial
22
Edwa Nkosuo means successful market. 23
Tigo is a mobile telecommunication company. 24
A plausible dataset would have been the GLSS, however the GLSS (as at the time of the research) did not have information on private microinsurance
Stellenbosch University https://scholar.sun.ac.za

39
status, financial knowledge and risk management, perception about financial institutions and usage
of financial products and remittances.
In terms of access to financial services, the dataset can broadly be classified into three sectors: (1)
access to formal financial services – notably commercial banks, stock market etc.; (2) access to
other formal and informal financial services – microfinance, savings club, susu schemes, insurance
companies, retail credit providers, remittance service providers; and (3) no access at all. For the
purpose of this study we extracted the dataset concerning households in the informal and other
formal sectors for the analysis. As a result 682 observations comprising 438 insured and 244
uninsured households were extracted for the study. The 438 insured households is an aggregate
of the products presented in Table 3.2. The ideal situation is to treat each microinsurance product
separately in the regression estimation. However none of the products has the required
observations to aid regression analysis appropriately. Nevertheless, the aggregation has no
adverse effect on our analysis because the focus of the study is not on specific products, but rather
on the comparison between insured and uninsured cohorts.
Table 3.2: The Number of Insured Households
Microinsurance Product No. Observations
Life 73
Property 62
Funeral and others 26
Education 23
Retirement and investment 19
Health (private) 28
Health (public; NHIS) 368
Total* 599
Source: Author’s computation based on the 2010 FINSCOPE Data of Ghana.
3.4.2. The Profile and Characteristics of Households
In order to be sure that we are dealing with households with relatively similar characteristics we
present a chi-square test25 on the socio-economic characteristics for both insured and uninsured
households. Whereas the insured has more access to the credit market, the uninsured receives
more remittances. Also the insured appears to have a larger family size and has attained
secondary educational level. Apart from these (credit, remittances, education), the trend observed
25
The chi-square test was used for the categorical variables while the t-test was used for the continuous variables.
Note*: The total is more than the 438 insured households because some clients have more than one product. .
Stellenbosch University https://scholar.sun.ac.za
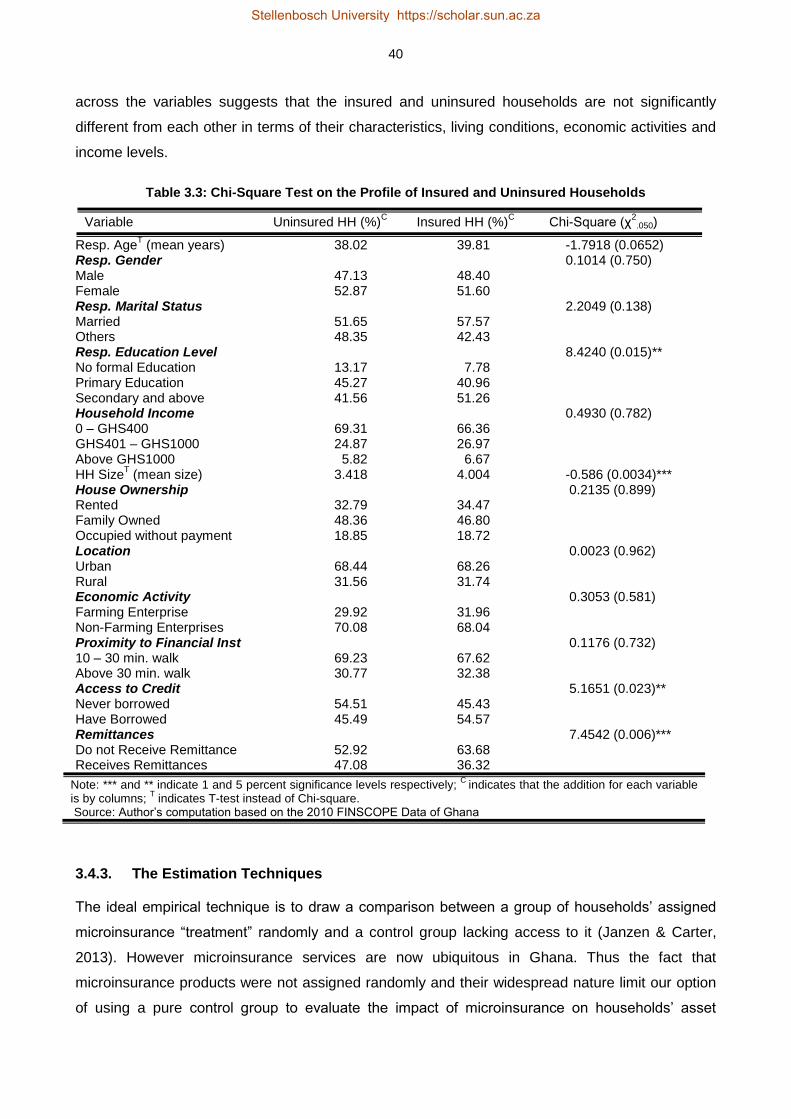
40
across the variables suggests that the insured and uninsured households are not significantly
different from each other in terms of their characteristics, living conditions, economic activities and
income levels.
Table 3.3: Chi-Square Test on the Profile of Insured and Uninsured Households
Variable Uninsured HH (%)C Insured HH (%)
C Chi-Square (χ
2.050)
Resp. AgeT (mean years) 38.02 39.81 -1.7918 (0.0652)
Resp. Gender 0.1014 (0.750) Male 47.13 48.40 Female 52.87 51.60 Resp. Marital Status 2.2049 (0.138) Married 51.65 57.57 Others 48.35 42.43 Resp. Education Level 8.4240 (0.015)** No formal Education 13.17 7.78 Primary Education 45.27 40.96 Secondary and above 41.56 51.26 Household Income 0.4930 (0.782) 0 – GHS400 69.31 66.36 GHS401 – GHS1000 24.87 26.97 Above GHS1000 5.82 6.67 HH Size
T (mean size) 3.418 4.004 -0.586 (0.0034)***
House Ownership 0.2135 (0.899) Rented 32.79 34.47 Family Owned 48.36 46.80 Occupied without payment 18.85 18.72 Location 0.0023 (0.962) Urban 68.44 68.26 Rural 31.56 31.74 Economic Activity 0.3053 (0.581) Farming Enterprise 29.92 31.96 Non-Farming Enterprises 70.08 68.04 Proximity to Financial Inst 0.1176 (0.732) 10 – 30 min. walk 69.23 67.62 Above 30 min. walk 30.77 32.38 Access to Credit 5.1651 (0.023)** Never borrowed 54.51 45.43 Have Borrowed 45.49 54.57 Remittances 7.4542 (0.006)*** Do not Receive Remittance 52.92 63.68 Receives Remittances 47.08 36.32
Note: *** and ** indicate 1 and 5 percent significance levels respectively; C
indicates that the addition for each variable is by columns;
T indicates T-test instead of Chi-square.
Source: Author’s computation based on the 2010 FINSCOPE Data of Ghana
3.4.3. The Estimation Techniques
The ideal empirical technique is to draw a comparison between a group of households’ assigned
microinsurance “treatment” randomly and a control group lacking access to it (Janzen & Carter,
2013). However microinsurance services are now ubiquitous in Ghana. Thus the fact that
microinsurance products were not assigned randomly and their widespread nature limit our option
of using a pure control group to evaluate the impact of microinsurance on households’ asset
Stellenbosch University https://scholar.sun.ac.za

41
accumulation. So the empirical framework in this study is confined to a sample population in which
all households have access to microinsurance services, but where some households decided not
to take up these services. The option to take up these services creates self-selection and
endogeneity problems which can blur the actual impact of microinsurance, hence the estimation is
done to account for selection bias issues by estimating Heckman sample selection and treatment
effect models.
3.4.3.1. The Heckman Sample Selection Model
Heckman’s (1974, 1978 and 1979) model for sample selection has made essential contributions to
the estimation of impact evaluations. The model which is designed for evaluating nonrandomized
programs uses a two-step estimation approach to correct for participants’ self-selection bias and
selection bias due to program placement (Heckman, 1979). These two-step equations are the
selection equation and the outcome (regression) equation.
In the first stage (the selection equation), we run a probit model for microinsurance on factors that
determine the uptake of microinsurance. The probit function for microinsurance is a dummy
variable which takes the value of one (1) if household i has taken up microinsurance and zero (0)
otherwise. This is given as follows:
𝐼𝑁𝑆𝑈𝑅𝐸𝑖 = {1 𝑖𝑓 ℎ𝑜𝑢𝑠𝑒ℎ𝑜𝑙𝑑 𝑖 ℎ𝑎𝑠 𝑚𝑖𝑐𝑟𝑜𝑖𝑛𝑠𝑢𝑟𝑎𝑛𝑐𝑒 0 𝑖𝑓 ℎ𝑜𝑢𝑠𝑒ℎ𝑜𝑙𝑑 𝑖 𝑛𝑒𝑣𝑒𝑟 ℎ𝑎𝑑 𝑚𝑖𝑐𝑟𝑜𝑖𝑛𝑠𝑢𝑟𝑎𝑛𝑐𝑒
3.1
The first-step equation or the selection equation is thus given as:
𝐼𝑁𝑆𝑈𝑅𝐸𝑖 = 𝑧𝑖𝛿 + 𝜇𝑖 3.2
Where 𝑃𝑟𝑜𝑏(𝐼𝑁𝑆𝑈𝑅𝐸𝑖 = 1|𝑧𝑖) = Φ(𝑧𝑖𝛿) and 𝑃𝑟𝑜𝑏(𝐼𝑁𝑆𝑈𝑅𝐸𝑖 = 0|𝑧𝑖) = 1 − Φ(𝑧𝑖𝛿)
Where 𝑧𝑖 is a vector of exogenous variables determining treatment (the uptake of microinsurance)
and 𝚽(∙) is the standard normal cumulative distribution function and 𝜇𝑖 is the error term. The
inverse Mills ratio is then constructed from the estimated coefficients of the probit model. The
inverse Mills ratio, also referred to as ‘hazard lambda’ or ‘control function’, controls for selection
bias and accounts for the omitted variables or the unexplained variations in the error term. The
inverse Mills ratio is given as:
𝜆𝑖 =𝜙(𝑧𝑖�̂�)
𝛷(𝑧𝑖�̂�) 3.3
Stellenbosch University https://scholar.sun.ac.za

42
Where 𝝀𝒊 is the inverse Mills ratio, 𝝓 is standard normal density function, and 𝚽 is as defined in the
probit model above. In the second step, the outcome equation (that is, the impact of
microinsurance on asset accumulation) is then estimated with the inverse Mills ratio as an
additional independent variable (Lin, 2007; Janzen & Carter, 2013).
𝐴𝑆𝑇𝑖 = 𝛽0 + 𝛽1𝐼𝑁𝑆𝑈𝑅𝐸𝑖 + 𝛽2𝜆𝑖 + 휀𝑖 3.4
Where 𝐴𝑆𝑇𝑖 is the asset index, the error terms (µi and 𝜺𝒊) of both the selection and the outcome
equations are bivariate normal with mean zero.
3.4.3.2. The Treatment Effect Model
In the treatment effect model a binary variable representing the treatment condition INSUREi that is
INSUREi = 1 if household i is insured (received “treatment”) and INSUREi = 0 if household i is
uninsured (not “treated”) is directly captured in the outcome equation and thus the outcome
variable – the asset index – is observed for both the treated and the untreated. The selection and
outcome models are specified in equations (5) and (6) respectively.
𝐼𝑁𝑆𝑈𝑅𝐸𝑖∗ = 𝑧𝑖𝛿 + 𝜇𝑖 , 𝐼𝑁𝑆𝑈𝑅𝐸𝑖 = 1 𝑖𝑓𝐼𝑁𝑆𝑈𝑅𝐸𝑖
∗ > 0, 𝑎𝑛𝑑 𝐼𝑁𝑆𝑈𝑅𝐸𝑖 = 0 𝑜𝑡ℎ𝑒𝑟𝑤𝑖𝑠𝑒 3.5
𝐴𝑆𝑇𝑖 = 𝑥𝑖𝛽 + 𝐼𝑁𝑆𝑈𝑅𝐸𝑖𝛾 + 휀𝑖 3.6
Where 𝜇𝑖 and 휀𝑖 are the error terms which are bivariate normal with zero mean. Since 𝐼𝑁𝑆𝑈𝑅𝐸𝑖, is
an endogenous binary variable and given the assumption of sample selection, the impact
evaluation under this model uses the observed features of households to estimate the parameters
of β and also to account for selection bias due to non-ignorable placement of the insurance
service. In order to obtain the regression models for the two regimes, the treated and the
untreated, we substitute INSUREi in equation (3.6) with equation (3.5) as follows:
When 𝐼𝑁𝑆𝑈𝑅𝐸𝑖∗ > 0, 𝐼𝑁𝑆𝑈𝑅𝐸𝑖 = 1: 𝐴𝑆𝑇𝑖 = 𝑥𝑖𝛽 + (𝑧𝑖𝛿 + 𝜇𝑖)𝛾 + 휀𝑖 3.7
And when 𝐼𝑁𝑆𝑈𝑅𝐸𝑖∗ ≤ 0, 𝐼𝑁𝑆𝑈𝑅𝐸𝑖 = 0: 𝐴𝑆𝑇𝑖 = 𝑥𝑖𝛽 + 휀𝑖 3.8
This implies that for treated households the outcome equation is 𝐴𝑆𝑇𝑖 = 𝑥𝑖𝛽 + (𝑧𝑖𝛿 + 𝜇𝑖)𝛾 + 휀𝑖 and
for the untreated households the outcome equation is 𝐴𝑆𝑇𝑖 = 𝑥𝑖𝛽 + 휀𝑖. These two equations are
estimated in a two-step approach just like the Heckman model.
3.4.3.3. The Instrumental Variable Model
Although the Heckman sample selection and the treatment effects models may help us to control
for selection bias, the uptake of microinsurance service may be influenced by certain unobserved
features such as fear, motivation or entrepreneurial skills (Janzen & Carter, 2013). Hence we use
instrumental variable (IV) model not only to capture the unobserved variables, but also to check the
Stellenbosch University https://scholar.sun.ac.za

43
consistency and the rigor of our estimates. As noted by Janzen and Carter (2013:10), the IV
accounts for “endogenous insurance participation”.
To address the challenge of endogeneity bias, the IV model demands the usage of an observed
variable that is (1) correlated with the uptake of microinsurance; and (2) uncorrelated with the error
term or the unobserved factors influencing asset accumulation. We selected three instruments,
namely insurance identity card, proximity to insurance company and whether or not one has heard
of an insurance product. The uptake of microinsurance is highly correlated with one’s knowledge
about insurance (e.g. see Akotey et al., 2011) and the proximity to an insurance firm has the
potential of reinforcing households’ awareness of microinsurance services. The insurance identity
card is also a pre-requisite for all households intending to take up insurance, especially the health
insurance scheme. Thus these three instruments have direct and substantial correlation with a
decision to buy microinsurance, but with little or no association with asset accumulation.
Following the theoretical exposition of Wooldridge (2002) about IV, we used these instruments to
estimate the local average treatment effect of microinsurance on households’ asset index. Similar
steps of the treatment effect model above and the IV’s two-stage least squares were used to obtain
the estimations of the IV model.
It is noteworthy that the analysis of impact evaluation involves the estimation of several models
such as OLS, Heckman sample selection, treatment effect model and instrumental variables
(direct-2SLS, IVprobit and probit_2SLS). However some of these have problems with bias and
consistency. For instance, the OLS does not address the problems of selection and endogeneity
biases. Though the instrumental variable model can deal with the problems of endogeneity bias,
the IVprobit (a variant of the IV model) is designed to fit a model with a binary dependent variable
and a continuous endogenous variable which is not the case in this study. Hence the estimates of
the IVprobit were dropped. Therefore only the models that yield the most consistent and robust
results have been reported. These are Heckman sample selection, treatment effect model and
instrumental variable modelling (direct-2SLS and probit-2SLS)26 have been reported.
3.4.4. The Construction of the Asset Index
An asset index is a welfare composite indicator constructed from specific underlying households’
assets (Johnston & Abreu, 2013; Booysen et al., 2008). Hence, an asset index ASTi is a function of
specific underlying variables (properties) Pij, such that Pij represents household i’s ownership or
lack of asset/property j.
𝐴𝑆𝑇𝑖 = 𝑓{𝑃𝑖𝑗} 3.9
26
The direct-2SLS was used to estimate the results of Chapters 3 and 6 while the probit-2SLS was used to estimate the results of Chapter 4.
Stellenbosch University https://scholar.sun.ac.za

44
This is expanded as: 𝐴𝑆𝑇𝑖 = 𝑃𝑖1 + 𝑃𝑖2 + … + 𝑃𝑖𝑚 3.10
Where Pij is a binary or categorical variable and takes the value 1 if household i owns asset j, and
0 if otherwise. Following the methods of Benzecri (1973), van Kerm (1998), Booysen et al. (2008),
Asselin (2009) and Echevin (2011), the weights of the individual assets were then computed using
multiple correspondence analysis (MCA). The basic form of the asset index is given as:
𝑎𝑖 = ∑ 𝐹1𝑘𝑘𝑘=1 𝑑𝑘𝑖 3.11
The ith household asset index is αi, dki is the kth value of the categorical variables (with k=1,…, K)
indicating the households’ assets variables included in the index construction. F1k is the MCA
weights generated for the analysis. The extended form of the asset index for this study is given as:
𝐴𝑆𝑇𝑖 = 𝑃𝑖1𝑊1 + 𝑃𝑖2𝑊2 + ⋯ 𝑃𝑖𝑗𝑊𝑗 3.12
Where ASTi is the welfare composite index of household i, the response of household i to
category/asset j is represented by Pij and Wj is the MCA weight for dimension one applied to
category j (Booysen et al., 2008).
3.4.5. Justification of the Control Variables
3.4.5.1. Household Characteristics
Personal characteristics of a household head and the living conditions of the household can
influence the demand for microinsurance. In particular age is an important determining factor for
the uptake of micro life insurance policies. As observed by Arun et al. (2012), older households
increase their demand for life insurance in order to indemnify their family in the event of death. The
effect of age on other types of microinsurance is however mixed. For instance, whereas Gaurav et
al. (2011), Dercon (2011) and Jehu-Appiah (2011) have indicated that older persons are more
likely to increase their demand for insurance schemes, Cole et al. (2013) found mixed results for
selected villages in India. So we expect the age of the household head to have either a direct or
indirect correlation with the uptake of microinsurance.
Gender is also reported to have mixed effect on the demand for microinsurance. Jehu-Appiah et al.
(2011) and Owusu et al. (2012) report from studies on Ghana that females are most likely to buy
microinsurance products. This may be due to the fact that pregnancy and childbearing exposes
females to more risks than males (Banthia et al., 2009). However, Schneider and Diop (2004), De
Allegri et al. (2006) and Bonan et al. (2011) have indicated that males are more likely to demand
microinsurance than females. Marriage has also been found to exert a positive influence on the
demand for microinsurance as married couples tend to cover their children against socio-economic
Stellenbosch University https://scholar.sun.ac.za

45
risks. In addition the size of a household has been shown to increase the uptake of microinsurance
(Chankova et al., 2008; Nketiah-Amponsah, 2009).
Many empirical works have reported a positive link between level of education and microinsurance
demand especially health insurance (Chankova et al. 2009; Brugiavini & Pace, 2011; Jehu-Appiah
et al., 2011). However, Akotey et al. (2011) provide evidence that the level of education do not
have a significant effect on microinsurance demand. They argue that one’s years of schooling is
not enough to lead to the purchase of microinsurance, but rather one’s knowledge or awareness
about microinsurance is the most vital factor for microinsurance demand.
An individual’s level of income and wealth is expected to enhance the likelihood for microinsurance
demand. For instance, Akotey et al. (2011) report that income has a positive significant influence
on the demand for microinsurance. Similarly Bhat and Jain (2006), Hwang and Gao (2003), Jehu-
Appiah et al. (2011) and Nketiah-Amponsah (2009) have shown that income and wealth have
positive correlation with insurance demand.
In terms of asset accumulation, these personal characteristics: age, education, income and being
married, are expected to have a positive correlation with increase stock of household assets.
However, household size may lead to lower asset build up if many of the household members are
dependents (especially children and elderly persons) and thus do not earn income.
3.4.5.2. Risk Profiles
According to the expected utility theory, the aversion for uncertain outcomes induce risk averse
individuals to buy insurance to protect themselves against the uncertainty of incurring future
financial losses. We thus expect the risk profiles of households to have a positive association with
microinsurance demand.
3.4.5.3. Interaction with the Financial Institutions
Under this we look at the interactions between households and financial institutions especially
insurance companies and how such interactions influence the demand for microinsurance. For
instance, the proximity of households to a financial institution can enhance their awareness and
knowledge about microinsurance schemes. This may thus lead to the take up of microinsurance
services. Prospective policyholders are also required to provide certain documents as part of the
conditions for buying microinsurance. The nature of such documentation and legal requirements
can either enhance or discourage the demand for microinsurance. According to Dror and Jacquier
(1999), the simplicity of the procedure for joining a microinsurance scheme and for making claims
can enhance the purchase of microinsurance. Due to this the market guidelines of NIC (2011)
requires microinsurance providers to make microinsurance contract very simple to understand with
Stellenbosch University https://scholar.sun.ac.za

46
less legalese and no or few exceptions. It further requires claims to be dealt with expeditiously
within 7 to 10 days.
Trust is also another interactive variable that can influence the perception of households about the
ability of insurers to pay valid claims when the need arises. The trust that policyholders have in
insurers, in the product itself and in peers (Patt et al., 2009) can have a great deal of influence on
the uptake of microinsurance (De Allegri et al., 2006; Bhat & Jain, 2006; McCord, 2008; Akotey et
al., 2011; Cole et al., 2011; Dercon et al., 2011).
The price of microinsurance products is the most important variable that influences the decision of
many low-income households to buy microinsurance. It has also been argued by several studies
that the crucial aspects of price as far as microinsurance is concerned are affordability of premiums
in terms of absolute levels and periodicity of payments (Dror & Jacquier, 1999; Churchill, 2007;
Akotey et al., 2011). Therefore aligning insurance premiums payments with the uneven cash flow
and relatively low income levels of households living and working in the informal sector can lead to
high demand for microinsurance products.
3.4.5.4. Trade Credit and Microcredit
Trade credit allows households owning small enterprises such as petty traders and smallholder
farmers to buy certain items including household assets on credit. On the other hand, microcredit is
small loans given to households by microfinance institutions for the financing of household assets,
consumption smoothing and for productive purposes. It is therefore expected that trade credit and
microcredit can lead to the accumulation of more assets.
3.4.5.5. Economic Activity
The economic activities of low-income households can be categorised into farm-based and non-
farm based enterprises. The farm-based include smallholder farmers, fishmongers, fruits and
vegetables sellers while the non-farm enterprises consist of dressmakers and tailors, carpenters,
truck pushers, “head-porters”, chop-bar operators and provisions sellers.
The GLSS VI (GSS, 2014) reports that the incidence of poverty is highest among households
engaged in farm-based enterprises while those involved in non-farm businesses are less likely to
be poor. It is thus expected that households engaged in farm-based enterprises may accumulate
less assets than those involved in non-farm enterprises. They may however be able to achieve
better food consumption smoothing since they are involved in subsistence farming.
Stellenbosch University https://scholar.sun.ac.za

47
3.4.5.6. Rural and Urban Locations
Both the GLSS V and VI Reports (GSS, 2008 & 2014) indicate that poverty in Ghana is still a
disproportionately rural phenomenon. It has also been argued severally that rural dwellers are
unambiguously disadvantaged in terms of acquisition of critical assets for welfare enhancement
(see e.g. Sahn & Stifel, 2003; Ravallion et al., 2007; Booysen et al., 2008; Echevin, 2011). It is
therefore expected that rural households may have low level of assets, high asset inequality and
poor smoothing of consumption.
3.5. DISCUSSION OF THE RESULTS
3.5.1. Test for Multicollinearity: Correlation Analysis
The strength of relationship among the explanatory variables can influence the validity of the
estimations. A correlation matrix is thus estimated to test for multicollinearity and the robustness of
the regression results. The correlation matrix presented in Table 3.4 shows strong multicollinearity
of 82 percent between private microinsurance and government microinsurance. Hence we have
dropped the government microinsurance from the empirical analysis.
Stellenbosch University https://scholar.sun.ac.za
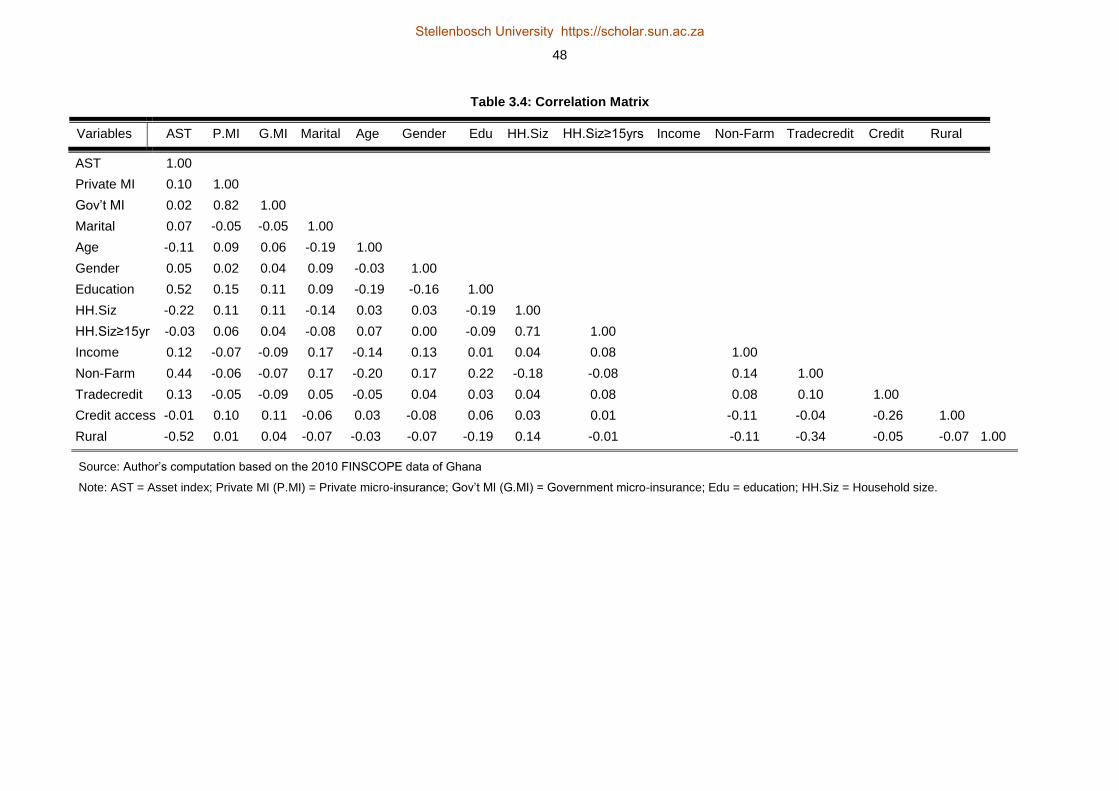
48
Table 3.4: Correlation Matrix
Variables AST P.MI G.MI Marital Age Gender Edu HH.Siz HH.Siz≥15yrs Income Non-Farm Tradecredit Credit Rural
AST 1.00
Private MI 0.10 1.00
Gov’t MI 0.02 0.82 1.00
Marital 0.07 -0.05 -0.05 1.00
Age -0.11 0.09 0.06 -0.19 1.00
Gender 0.05 0.02 0.04 0.09 -0.03 1.00
Education 0.52 0.15 0.11 0.09 -0.19 -0.16 1.00
HH.Siz -0.22 0.11 0.11 -0.14 0.03 0.03 -0.19 1.00
HH.Siz≥15yr -0.03 0.06 0.04 -0.08 0.07 0.00 -0.09 0.71 1.00
Income 0.12 -0.07 -0.09 0.17 -0.14 0.13 0.01 0.04 0.08 1.00
Non-Farm 0.44 -0.06 -0.07 0.17 -0.20 0.17 0.22 -0.18 -0.08 0.14 1.00
Tradecredit 0.13 -0.05 -0.09 0.05 -0.05 0.04 0.03 0.04 0.08 0.08 0.10 1.00
Credit access -0.01 0.10 0.11 -0.06 0.03 -0.08 0.06 0.03 0.01 -0.11 -0.04 -0.26 1.00
Rural -0.52 0.01 0.04 -0.07 -0.03 -0.07 -0.19 0.14 -0.01 -0.11 -0.34 -0.05 -0.07 1.00
Source: Author’s computation based on the 2010 FINSCOPE data of Ghana
Note: AST = Asset index; Private MI (P.MI) = Private micro-insurance; Gov’t MI (G.MI) = Government micro-insurance; Edu = education; HH.Siz = Household size.
Stellenbosch University https://scholar.sun.ac.za
Stellenbosch University https://scholar.sun.ac.za

49
3.5.2. The Summary Statistics
Tables 3.5 and 3.6 respectively report the descriptive statistics and percentile distributions of the
asset index. Although the uninsured households have higher maximum assets, their average asset
holding (mean) is lower than that of insured households. Both households have a negatively
skewed asset distribution, an indication that majority of the households have assets worth insuring.
However, one group of households (the uninsured) chose not to take up the microinsurance
policies offered. Some of the reasons underlying their inability to buy microinsurance policies (as
captured by the survey) are: (1) inability to afford the premium payments; (2) lack of knowledge
about how insurance functions; (3) no need for insurance since risk are destined by providence;
and (4) lack of trust in insurers.
Table 3.5: Descriptive Statistics of the Asset Index
Statistic Insured Households Uninsured Households
Mean Asset Holdings27
2.8629 2.6777
Skewness -0.5783 -0.3953
Kurtosis 2.6130 2.3310
Standard Deviation 0.9774 1.0321
Minimum 0.3197 0.0026
Maximum 4.3930 4.4946
Observations 438 244
Source: Author’s computation based on the 2010 FINSCOPE dataset of Ghana.
The percentile distribution indicates that the insured households at the bottom percentile levels
(1% to 25%) have relatively more assets than the uninsured households. Both households’ asset
holdings however converge at the top from the 90th to 99th percentile.
Table 3.6: Percentile Distribution of the Asset Index
Percentile Insured Households Uninsured Households
Bottom Percentiles
1% 0.5459 0.3714
5% 0.9520 0.9027
10% 1.2998 1.0402
25% 2.2846 1.9644
Medium Percentile
50% 3.0253 2.8569
Top Percentiles
75% 3.5449 3.4357
90% 4.0808 3.9559
95% 4.2464 4.2464
99% 4.3343 4.3343
Source: Author’s computation using the 2010 FINSCOPE data of Ghana
27
The mean is the average units of physical assets owned by a household.
Stellenbosch University https://scholar.sun.ac.za
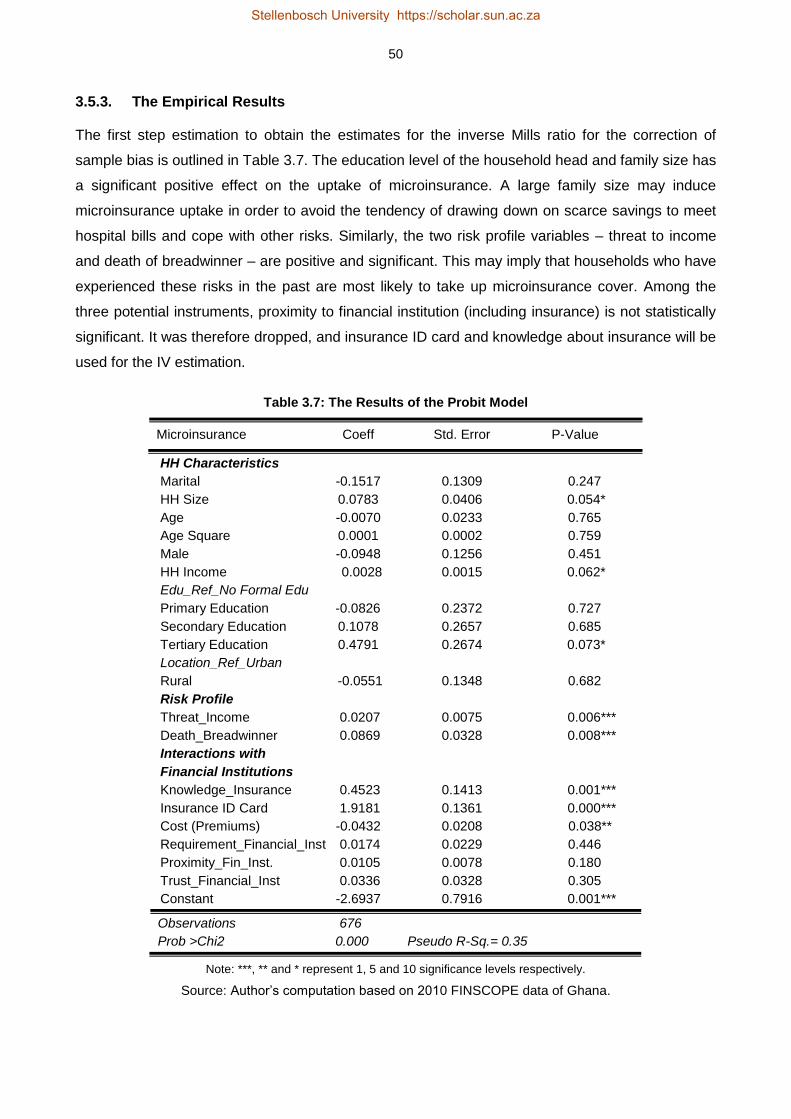
50
3.5.3. The Empirical Results
The first step estimation to obtain the estimates for the inverse Mills ratio for the correction of
sample bias is outlined in Table 3.7. The education level of the household head and family size has
a significant positive effect on the uptake of microinsurance. A large family size may induce
microinsurance uptake in order to avoid the tendency of drawing down on scarce savings to meet
hospital bills and cope with other risks. Similarly, the two risk profile variables – threat to income
and death of breadwinner – are positive and significant. This may imply that households who have
experienced these risks in the past are most likely to take up microinsurance cover. Among the
three potential instruments, proximity to financial institution (including insurance) is not statistically
significant. It was therefore dropped, and insurance ID card and knowledge about insurance will be
used for the IV estimation.
Table 3.7: The Results of the Probit Model
Microinsurance Coeff Std. Error P-Value
HH Characteristics
Marital -0.1517 0.1309 0.247
HH Size 0.0783 0.0406 0.054*
Age -0.0070 0.0233 0.765
Age Square 0.0001 0.0002 0.759
Male -0.0948 0.1256 0.451
HH Income 0.0028 0.0015 0.062*
Edu_Ref_No Formal Edu
Primary Education -0.0826 0.2372 0.727
Secondary Education 0.1078 0.2657 0.685
Tertiary Education 0.4791 0.2674 0.073*
Location_Ref_Urban
Rural -0.0551 0.1348 0.682
Risk Profile
Threat_Income 0.0207 0.0075 0.006***
Death_Breadwinner 0.0869 0.0328 0.008***
Interactions with
Financial Institutions
Knowledge_Insurance 0.4523 0.1413 0.001***
Insurance ID Card 1.9181 0.1361 0.000***
Cost (Premiums) -0.0432 0.0208 0.038**
Requirement_Financial_Inst 0.0174 0.0229 0.446
Proximity_Fin_Inst. 0.0105 0.0078 0.180
Trust_Financial_Inst 0.0336 0.0328 0.305
Constant -2.6937 0.7916 0.001***
Observations 676
Prob >Chi2 0.000 Pseudo R-Sq.= 0.35
Note: ***, ** and * represent 1, 5 and 10 significance levels respectively.
Source: Author’s computation based on 2010 FINSCOPE data of Ghana.
Stellenbosch University https://scholar.sun.ac.za

51
The detailed results of the three estimation techniques are presented in Table 3.8. Each model
makes a unique contribution to the whole impact evaluation. They do not necessarily address the
same issues, however their combined effects facilitate impact outcomes which are rigorous and
resilient. For instance, the Heckman model resolves the problems of selection bias by using the
observed variables of only the treatment group for the estimation. The treatment effect model
moves the Heckman model further in two ways: (1) it accounts for selection bias through the
inverse Mills ratio (hazard lambda); and (2) it undertakes the estimation for both the treatment and
control groups simultaneously. The results show a statistically insignificant inverse Mills ratio
(hazard lambda): an indication that the sample size does not suffer from selection bias. The result
of the treatment effect model indicates a significant positive impact of microinsurance on
household asset accumulation. This suggests that microinsurance may equip low-income
households to prevent asset loss and thus accumulate more assets.
Even though selection bias, as reported by the inverse Mills ratio (hazard lambda), is not
associated with our sample and thus may not blur the findings, we still have cause for concern
about crucial unobserved variables such as motivation, risk appetite and entrepreneurial passion
which may influence the demand for microinsurance and its subsequent impacts. However, the
Heckman and treatment effect models are not able to account for such situations. The IV corrects
this shortcoming by capturing the essential unobserved variables and account for the endogeneity
bias inherent in microinsurance uptake. The IV results indicate that microinsurance has a positive
impact at the 5 percent significance level on households’ asset accumulation. That is, the insured
households stand a better chance of preventing asset loss and thus increase their asset holdings
by about 19 percent.
All together these findings imply that having microinsurance cover reduces asset loss and
enhances welfare. This is in line with the assumption that microinsurance prevents asset loss and
promotes households’ asset growth and stability due to the indemnity under the insurance cover.
As noted by Smith (1998), depletion of accumulated assets is the most likely first step to cope with
life-cycle risks by people without insurance. However, under microinsurance cover, assets
depletion is minimized or eliminated entirely. More importantly, microinsurance that covers the
healthcare cost of households prevents asset pawning and liquidation of essential household
assets at ‘give away’ prices. In other words, insurance policies, especially medical insurance,
reduce the tendency of disposing off important household assets to raise money for medical
treatment and care. Although this result confirms the findings of Janzen and Carter (2013), Morsink
et al. (2011), Mosley (2009) and Wagstaff and Pradhan (2005), it contradicts that of Cheung and
Padieu (2011).
Stellenbosch University https://scholar.sun.ac.za

52
Table 3.8: The Empirical Results28
Variables Heckman Treatment IV
Microinsurance 0.0712 0.1843 0.1899
(0.338) (0.048) ** (0.050)**
Microcredit -0.0035 -0.0019 -0.0082
(0.951) (0.972) (0.887)
Inv.Mills ratio -0.0589 -0.0619
(0.333) (0.350)
Not Married -0.0938 -0.0981 -0.0935
(0.118) (0.098)* (0.119)
Education 0.1772 0.1775 0.1772
(0.000)*** (0.000)*** (0.000)***
T_HH_Size -0.0605 -0.0610 -0.0614
(0.000)*** (0.000)*** (0.000)***
HH Size≥15 0.0706 0.0731 0.0712
(0.005)*** (0.003)*** (0.004)***
Resp.Age -0.0076 -0.0078 -0.0072
(0.495) (0.482) (0.520)
Resp.Age Sq 0.0001 0.0000 0.0001
(0.446) (0.430) (0.469)
Male 0.0786 0.0743 0.0772
(0.166) (0.188) (0.175)
Income 0.0666 0.0727 0.0732
(0.398) (0.353) (0.356)
Tradecredit 0.1895 0.1911 0.1927
(0.009)*** (0.007)*** (0.008)***
Rural -0.7700 -0.7721 -0.7703
(0.000)*** (0.000)*** (0.000)***
Non-Farming 0.4313 0.4331 0.4318
(0.000)*** (0.000)*** (0.000)***
Constant 1.1240 1.009 1.3547
(0.003)*** (0.004)*** (0.002)***
Observations 667 667 667
Adj. R-Squ. 0.51 0.51
P>F 0.000 P>Chi2=0.000 P>F=0.000
Note: ***, ** and * indicate 1%, 5% and 10% significance levels respectively.
Source: Author’s computation based on the 2010 FINSCOPE data of Ghana
28
In order to ensure consistency of results and heteroskedastic consistent estimates, robust standard errors have been
performed on the variables. The results of the robust standard errors do not statistically differ from what is reported here. See Table A.1 in appendix A for the results of the robust standard errors.
Stellenbosch University https://scholar.sun.ac.za

53
3.6. CONCLUSIONS AND POLICY RECOMMENDATION
The study has assessed the strength of microinsurance services in reducing the risk of insured
households to have to resort to asset loss to pay for risks that are not insured and to accumulate
assets. Three empirical techniques, namely Heckman sample selection, treatment effects and
instrumental variable models, were employed for the impact assessment. In line with theoretical
and empirical postulations the results show that microinsurance schemes enable households to
reduce asset loss and even increase their asset holdings.
In the event of substantial negative shocks such as fire, motor accidents, severe illness or even
death, households without the necessary insurance cover liquidate essential assets in order to
raise money for the mitigation of the risky event. Some of these assets, which are mostly liquidated
below market prices, might have taken low-income households a considerable number of years to
accumulate. Such a situation has the tendency to worsen the economic status of uninsured
households. This underscores the need to integrate this financial package into private and public
welfare interventions directed at low-income households. To the extent that microinsurance is
inextricably linked to households’ livelihood, integrating it into the various poverty interventions for
low-income households will empower them to make steady asset build-up in order to escape
poverty and sustain the welfare gains achieved. Indeed, microinsurance can equip households to
break the interconnection between risks, vulnerability and asset loss, and turn the vicious-cycle of
poverty into a virtuous cycle of well-being.
Stellenbosch University https://scholar.sun.ac.za

54
REFERENCES
Aggarwal, A. 2010. Impact evaluation of India’s Yeshasvini community-based health insurance
programme. Health Economics, 19, 5-35.
Akotey, J.O., Osei, K.A. & Gemegah, A. 2011. The demand for microinsurance in Ghana. The
Journal of Risk Finance, 12(3), 182-194.
Arun, T., Bendig, M. & Arun, S. 2012. Bequest motives and determinants of micro life insurance in
Sri Lanka. World Development, 40(8), 1700–1711.
Asselin, L. M. 2009. Analysis of multidimensional poverty: Theory and case studies. New York, NY:
Springer.
Banthia, A., Johnson, S., McCord, M.J. & Mathews, B. 2009. Microinsurance that works for
women: Making gender sensitive microinsurance programs. Geneva: International Labour Office
(ILO).
Benzecri, J.P. 1973. Data analysis: Analysis correspondences. Volume 2. Paris: Dunod.
Bhat, R. & Jain, N. 2006. Factoring affecting the demand for health insurance in a microinsurance
scheme. Ahmedabad: Indian Institute of Management.
Binagwaho, A., Hartwig, R., Ingeri, D. & Makaka, A. 2012. Mutual health insurance and its
contribution to improving child health in Rwanda. Passauer Diskussions Papiere:
Volkswirtschaftliche Reihe, No. V66-12. Passau: University of Passau, Faculty of Business and
Economics.
Binnendijk, E., Koren, R. & Dror, D.M. 2012. Hardship financing of healthcare among rural poor in
Orissa, India. BMC Health Services Research, 12(23):doi:10.1186/1472-6963/12-23
Bonan, J., Dagnelie, O., LeMay-Boucher, P. & Tenikue, M. 2011. Is it all about money? A
randomized evaluation of the impact of insurance literacy and marketing treatments on the demand
for health microinsurance in Senegal. ILO Microinsurance Innovation Facility Research Paper.
Geneva: ILO.
Booysen, F., Servaas, V.D.B., Ronelle, B., Michael, V.M. & Gideon, D.R. 2008. Using an asset
index to assess trends in poverty in seven sub-Saharan African countries. World Development,
36(6), 1113–1130.
Stellenbosch University https://scholar.sun.ac.za
55
Brown, W. & Churchill, C.F. 1999. Providing insurance to low-income households - Part I: A primer
on insurance principles and products. Microenterprise Best Practices Project, Bethesda, MD:
DAI/USAID, pages 1-92.
Brugiavini, A. & Pace, N. 2011. Extending health insurance: Effects of the National Health
Insurance Scheme in Ghana. EUI/RSCAS Working Papers No. 2011/27. Fiesole: European
University Institute.
Buabeng, I.Y. & Gruijters, R. 2012. Market survey: The supply of microinsurance products in
Ghana. In National Insurance Commission (NIC) & Deutsche Gesellschaft für Internationale
Zusammenarbeit (GIZ) (eds.), Promoting microinsurance in Ghana: Microinsurance as a means of
insurance sector development, 102-109. Accra: QualiType Limited.
Chankova, S., Sulzbach, S. & Diop, F. 2008. Impact of mutual health organizations: Evidence from
West Africa. Health Policy and Planning, 23(4), 264–276.
Cheung, D. & Padieu, Y. 2011. Impacts of health insurance on saving and consumption expenses
by income groups in rural China. Centre d’Economie de la Sorbonne (CES) Working Paper 13056,
Paris: University of Paris.
Chou, S.Y., Liu, J.T. & Huang, C.J. 2004. Health insurance and savings over the life cycle: A semi-
parametric smooth coefficient estimation. Journal of Applied Econometrics, 19(3), 295-322.
Churchill, C. 2007. Insuring the low-income market challenges and solution for commercial
insurers. The Geneva Papers, 32(3), 401–412.
Cole, S., Gine, X., Tobacman, J., Topalova, P., Townsend, R. & Vickery, J. 2013. Barriers to
household risk management: Evidence from India. American Economic Journal: Applied
Economics, 5(1), 104-135.
De Allegri, M., Sanon, M., Bridges, J. & Sauerborn, R. 2006. Understanding consumers'
preferences and decision to enrol in community-based health insurance in rural West Africa. Health
Policy, 76(1), 58-71.
De Bock, O. & Ontiveros, D.U. 2013. Literature review on the impact of microinsurance. ILO
Microinsurance Innovation Facility research paper no. 35, Geneva: International Labour Office.
Dercon, S. 2003. Insurance against poverty. World Institute for Development Economics Research,
Helsinki: United Nations University.
Stellenbosch University https://scholar.sun.ac.za

56
Dercon, S., Gunning, J. W. & Zeitlin, A. 2011. The demand for insurance under limited credibility:
Evidence from Kenya. Oxford: University of Oxford.
Dercon, S., Gunning, J. W., Zeitlin, A. & Lombardini, S. 2012. The impact of a health insurance
programme: Evidence from a randomized controlled trial in Kenya. ILO Microinsurance Innovation
Facility Research Paper No. 24. Geneva: International Labour Organization (ILO).
Dercon, S., Kirchberger, M., Gunning, J.W. & Platteau, J.P. 2008. Literature review on
microinsurance. Microinsurance Paper No. 1. Geneva: International Labour Organization.
Dong, H., Bogg, L., Wang, K., Rehnberg, C. & Diwan, V. 1999. A description of outpatient drug use
in rural China: Evidence of differences due to insurance coverage. International Journal of Health
Planning and Management, 14(1), 41-56.
Dror, D. & Jacquier, C. 1999. Microinsurance: Extending health insurance to the excluded.
International Social Security Review, 52(1), 71-97.
Dror, D., Koren, R. & Steinberg, D. 2006. The impact of Filipino micro health insurance units on
income related equality of access to healthcare. Health Policy, 77(3), 304-317.
Echevin, D. 2011. Vulnerability to asset-poverty in sub-Saharan Africa. Munich Personal RePEc
Archive (MPRA) Paper No. 35660. Available: www.mpra.ub.uni-muenchen.de/35660. Accessed:
21 August 2013.
Filmer, D. & Scott, K. 2012. Assessing asset indices. Demography, 49(1), 359-392.
Finmark Trust. 2010. FINSCOPE Ghana 2010 report: Making financial markets work for the poor.
Accra: Finmark Trust Household Survey.
Fitzpatrick, A., Magnoni, B. & Thornton, R.L. 2011. Microinsurance utilization in Nicaragua: A
report on effects on children, retention, and health claims. ILO Microinsurance Innovation Facility
Research Paper No. 5. Geneva: International Labour Office.
Frank, R.H. 2004. Microeconomics and behavior. 6th edition. New York, NY: McGraw-Hill.
Gaurav, S., Cole, S. & Tobacman, J. 2011. Marketing complex financial products in emerging
markets: Evidence from rainfall insurance in India. Journal of Marketing Research, 48(1), 150-162.
Ghana Statistical Service (GSS). 2014. Ghana living standards survey round six (GLSS VI):
Poverty profile in Ghana (2005-2013). Accra: Ghana Statistical Service.
Stellenbosch University https://scholar.sun.ac.za
57
Ghana Statistical Service (GSS). 2008. Ghana living standards survey report of the fifth round
(GLSS V). Accra: Ghana Statistical Service. Available: http://www.statsghana.gov.gh. Accessed:
23 March 2011.
Giesbert, L., Steiner, S. & Bendig, M. 2011. Participation in micro life insurance and the use of
other financial services in Ghana. Journal of Risk and Insurance, 78(1), 7-35.
Giné, X. & Yang, D. 2009. Insurance, credit, and technology adoption: Field experimental evidence
from Malawi. Journal of Development Economics, 89(1), 1–11.
Gnawali, D.P., Pokhrel, S., Sié, A., Sanon, M., De Allegri, M., et al. 2009. The effect of community-
based health insurance on the utilization of modern health care services: Evidence from Burkina
Faso. Health Policy, 90(2/3), 214-222.
Gruber, J. & Yelowitz, A. 1999. Public health insurance and private savings. Journal of Political
Economy, 107(6), 1249-1274.
Guariglia, A. & Rossi, M. 2004. Private medical insurance and saving: Evidence from the British
household panel survey. Journal of Health Economics, 23(4), 761-783.
Guha-Khasnobis, B. & Ahuja, R. 2004. Extending formal insurance to the informal economy
workers in India. EGDI and UNU-WIDER Conference, 17-18 September, Helsinki, Finland.
Gumber, A. 2001. Hedging the health of the poor: The case for community financing in India.
Health, Nutrition and Population discussion paper. Washington, DC: World Bank.
Hamid, S.A., Roberts, J. & Mosley, P. 2010. Can micro health insurance reduce poverty? Evidence
from Bangladesh. The Journal of Risk and Insurance, 78(1), 57-82.
Harttgen, K., Klasen, S. & Vollmer, S. 2013. An African growth miracle? Or: What do asset indices
tell us about trends in economic performance? Review of Income and Wealth, 59(S1), S37-S61.
Heckman, J.J. 1979. Sample selection bias as a specification error. Econometrica, 47(1), 135-161.
Heckman, J.J. 1978. Dummy endogenous variables in a simultaneous equation system.
Econometrica, 46(4), 931-959.
Heckman, J.J. 1974. Effects of child-care programs on women’s work effort. Journal of Political
Economy, 82(2), S136-S163.
Hsu, M., Liao, P.L. & Lin, C.C. 2011. Revisiting private health insurance and precautionary saving:
A theoretical and empirical analysis. Tokyo: National Graduate Institute for Policy Studies (GRIPS).
Stellenbosch University https://scholar.sun.ac.za

58
Hwang, T. & Gao, S. 2003. The determinants of the demand for life insurance in an emerging
economy: The case of China. Managerial Finance, 29(5/6), 82-96.
Janzen, S.A. & Carter, M.R. 2013. The impact of microinsurance on asset accumulation and
human capital investments: Evidence from a drought in Kenya. ILO Microinsurance Innovation
Facility Research Paper No. 31. Geneva: International Labour Organization.
Jehu-Appiah, C., Areetey, G., Spaan, E., De Hoop, T., Agyepong, I. & Balthussen, R. 2011. Equity
aspects of the National Health Insurance Scheme in Ghana. Who is enrolling, who is not and why?
Social Science and Medicine, 72, 157-165.
Johnston, D. & Abreu, A. 2013. Asset indices as a proxy for poverty measurement in African
countries: A reassessment. The Conference of African Economic Development: Measuring
Success and Failure, 18–20 April, 2013, Simon Fraser University, Vancouver, Canada.
Lei, X. & Lin, W. 2009. The new cooperative medical scheme in rural China: Does more coverage
mean more service and better health? Health Economics, 18(S2): S25-S46.
Levine, D. & Polimeni, R. 2012. Insuring health or insuring wealth? An experimental evaluation of
health insurance in rural Cambodia. Impact Analyses Series No. 08. Paris: Agence Francaise de
Development, Evaluation and Capitation Division.
Lin, W. 2007. Models with self-selection. Available at: http://www.wanchuanlin.org/Lecture,
Accessed: 27 August 2013.
Loewe, M. 2006. Downscaling, upgrading or linking? Ways to realise microinsurance. International
Social Security Review, 59(2), 37-59.
Mahal, A., Krishnaswamy, K., Ruchismita, R. & Babu, G. 2013. What is a health card worth? A
randomised controlled trial of an outpatient health insurance product in rural India. ILO
Microinsurance Innovation Facility Research Paper No. 30. Geneva: International Labour
Organization.
McCord, M. 2008. Visions of the future of microinsurance and thoughts on getting there.
Microinsurance note no. 9. Washington, DC: USAID/DAI.
Morsink, K., Geurts, P. & Dijk, A. K. 2011. Impact of microinsurance on vulnerability of low income
households in the Philippines: The case of typhoon re-housing insurance. Proceedings of the
Second European Research Conference on Microfinance, 16-18 June, 2011, Groningen,
Netherlands.
Stellenbosch University https://scholar.sun.ac.za
59
Mosley, P. 2009. Assessing the success of microinsurance programmes in meeting the insurance
needs of the poor. United Nations Department of Economic and Social Affairs (DESA) Working
Paper No. 84, available at http://www.un.org/esa/desa/papers/2009/wp84.
Mossin, J. 1968. Aspects of rational insurance purchasing. Journal of Political Economy, 76(4),
553-568.
National Insurance Commission. 2011. The 2011 annual report. Available: http://www.nicgh.org.
Accessed: 31 March 2014.
NIC and GIZ (2012). Promoting microinsurance in Ghana: Microinsurance as a means of insurance
Sector development. Accra: QualiType Limited.
Nicola, F.D. 2011. The impact of weather insurance on consumption, investment, and welfare. Job
Society for Economic Dynamics Meeting Papers No. 548. St. Louis, MO: Federal Reserve Bank.
Njong, A.M. & Ningaye, P. 2008. Characterizing weights in the measurement of multidimensional
poverty: An application of data-driven approaches to Cameroonian data. OPHI Working Paper No.
21. Available: http://www.ophi.org.uk/OPHI-wp21. Accessed: 22 September 2013.
Nketiah-Amponsah, E. 2009. Demand for health insurance among women in Ghana: Cross
sectional evidence. International Research Journal of Finance and Economics, 33, 179-191.
Nyman, J.A. 1998. Theory of health insurance. Journal of Health Administration Education, 16(1),
41-66.
Owusu, A., Afutu-Kotey, R. & Kala, M. 2012. Micro health insurance in Ghana. In Roesner, H.,
Leppert, G., Degens, P. & Ouedraogo, L. (eds.), Handbook of micro health insurance in Africa,
109-124. Muenster: Lit Verlag.
Ravallion, M., Chen, S. & Sangraula, P. 2007. New evidence on the urbanization of global poverty.
Population and Development Review, 33(4), 667-701.
Sahn, D.E. & Stifel, D.C. 2003. Urban-rural inequality in living standards in Africa. Journal of
African Economies, 12(4), 564-597.
Sahn, D.E. & Stifel, D.C. 2000. Poverty comparisons over time and across countries in Africa.
World Development, 28(2), 2123-2155.
Schneider, P. & Diop, F. 2004. Community-based health insurance in Rwanda - Health financing
for poor people: Resource mobilization and risk sharing. Washington, DC: The World Bank.
Stellenbosch University https://scholar.sun.ac.za

60
Smith, J.P. 1998. Socioeconomic status and health. The American Economic Review, 88(2), 192-
196.
Smith, K.V. & Sulzbach, S. 2008. Community-based health insurance and access to maternal
health services: Evidence from three West African countries. Social Science and Medicine, 66(12),
2460-2473.
Starr-McCluer, M. 1996. Health insurance and precautionary savings. American Economic Review,
86(1), 285-295.
United Nations (UN). 2010. The Millennium Development Goals Report. New York, NY: United
Nations.
United Nations Development Programme (UNDP). 2011. Sustainability and equity: A better future
for all. New York, NY: United Nations Development Programme.
van Kerm, P. 1998. Simple and multiple correspondence analysis in Stata. Stata Technical
Bulletin, 42, 32-37.
Wagstaff, A. & Pradhan, M. 2005. Health insurance impacts on health and nonmedical
consumption in a developing country. World Bank Policy Research Working Paper No. 3563.
Washington, DC: World Bank.
Wagstaff, A., Lindelow, M., Jun, G., Ling, X. & Juncheng, Q. 2009. Extending health insurance to
the rural population: An impact evaluation of China’s new cooperative medical scheme. Journal of
Health Economics, 28(1), 1-19.
Wooldridge, J.M. 2002. Econometric analysis of cross section and Panel data. London: MIT Press.
Stellenbosch University https://scholar.sun.ac.za
61
CHAPTER 4
RISK COPING STRATEGIES AND CONSUMPTION SMOOTHING AMONG
LOW-INCOME HOUSEHOLDS IN GHANA: DOES MICROINSURANCE
MATTER?
4.1. INTRODUCTION
Low-income households employ a diversity of strategies to smooth consumption because the
welfare consequences of consumption shocks are usually very high. These diverse risk coping
mechanisms range from the disposal of productive assets, withdrawal of children from school, and
child labour to a reduction in meals. However the empirical evidence from various developing
countries suggests that these risk coping mechanisms are not good smoothers and do not improve
the long term survival and well-being of households. Rather they almost always disrupt the growth
path of low-income households, impoverish them and set them back into transient and chronic
poverty. For instance, reducing meals may lead to malnourishment with pernicious health
conditions, while withdrawing children from school and child labour may disrupt human capital
development (Janzen & Carter, 2013a; Chakrabarty, 2012; Morsink et al., 2011).
Microinsurance has been proposed as a better alternative for empowering low-income households
to cope with risks effectively. It is a risk management tool that uses the concept of risk pooling to
indemnify low-income persons against specific risks in exchange for affordable premiums which
are mostly paid at irregular times and in uneven amounts. A substantive body of insurance
literature has recognized microinsurance as a risk transfer instrument which does not only reduces
the usage of detrimental coping strategies, but also empowers the poor to manage risks effectively
and make a sustainable exit from poverty (e.g. see Janzen & Carter, 2013a; Morsink et al., 2011;
Dercon et al., 2008; Barnett et al., 2008; Cohen et al., 2005; Churchill, 2002; Siegel et al., 2001).
The microinsurance pay-out received in the event that an insurable risk occurs, prevents asset
pawning and emergency borrowing and, as noted by Giesbert (2010), equips low-income
households to avoid using insufficient and costly alternative ways of coping with shocks.
The international development community (especially ILO, GIZ and USAID)29 has also recognized
microinsurance as a welfare enhancing tool. This has motivated some governments in sub-
Saharan Africa to initiate financial reforms to encourage greater insurance inclusion for households
living and working in the informal sector. Some of these reforms have led to the rolling out of
29ILO is International Labour Organization; GIZ is Deutsche Gesellschaft für Internationale Zusammenarbeit; USAID is United States Agency for International Development.
Stellenbosch University https://scholar.sun.ac.za

62
microinsurance to cover health risks and rural farmers in Kenya, Senegal, Malawi, South Africa,
Uganda and Ghana.
Ghana in particular has witnessed the rolling out of both public and private microinsurance
schemes for more than a decade. However there has been little or no empirical investigation into
their impacts on consumption smoothing. Since the inception of formal30 microinsurance schemes
in 2003, the number of policies has grown quite impressively with about one million policies written
as at 2011 (NIC & GIZ, 2012). Against this backdrop, it will be very interesting to ascertain whether
microinsurance has reduced clients’ dependence on costly coping strategies which undermine
proper human capital development. Hence the current study undertakes an investigation into
whether microinsurance facilitates consumption smoothing necessary for improved health and
human capital growth. In particular we ask: can microinsurance empower low-income households
to eliminate the reduction in meals as a coping strategy?
We use data from the 2010 FINSCOPE Survey which has very rich and in-depth information on
3 642 households’ usage of financial services, risk management tools and shock coping strategies.
The survey was conducted, among other things, to aid financial practitioners and analysts
investigation into the impact of various financial products on households’ welfare. This study is one
of the first attempts to understand the effects of microinsurance on coping strategies from the
perspective of Ghana.
The National Insurance Commission (NIC) has indicated its intention to upgrade its policy on
microinsurance in order to make it more accessible and responsive to the needs of low-income
households. The findings of this study will inform this policy upgrade by providing timely and
invaluable grass root information about how microinsurance influences the choice of costly risk-
coping strategies in Ghana.
The rest of this chapter is organized as follows: the literature review is captured in Section 4.1,
Section 4.2 provides the patterns and trends of consumption poverty and an overview of
microinsurance in Ghana, the methodology is in Section 4.3, the results are presented in Section
4.4 and the conclusion and policy recommendations are presented in Section 4.5.
4.2. LITERATURE REVIEW
4.2.1. Theoretical Literature
4.2.1.1. The Life Cycle Theory
This theory argues that the maximization of personal utility is achieved through the allocation and
balancing of current and future earnings with a lifelong pattern of consumption (Modigliani &
30
The susu type of microinsurance begun in the 1980s but folded up due to operational challenges.
Stellenbosch University https://scholar.sun.ac.za

63
Brumberg, 1954; Modigliani & Ando, 1957; Ando & Modigliani, 1963). It assumes that individuals’
earnings and consumption expenditure follow a pattern of accumulation stage, consolidation stage,
spending stage and gifting stage (Reilly & Norton, 1999). The implication is that the younger
population saves less, because much of their current earnings are used to accumulate assets and
pay off their car, college and housing loans. Hence the net worth of the younger population is
smaller. The middle class on the hand consolidates and saves more because they may have paid
off much of their loans and also may be earning more income. The older population is assumed to
be in the spending and gifting stage and thus dissave. For individuals to achieve consumption
smoothing, the theory suggests that savings at the different stages of life should be align with life
cycle consumption patterns. Savings in this sense can be categorised into contractual and
discretionary savings (Prinsloo, 2000). The contractual savings entails the subscription to
insurance policies or retirement plans (pensions) for the management of risks and future
consumption smoothing. Insurance as an aspect of savings may ensures that the consumption
pattern of individuals at different stages of their lives is not disrupted by risk and inadequate current
earnings.
4.2.1.2. The Permanent Income Theory
The permanent income hypothesis (PIH) was developed by Milton Friedman in 1957. It states that
the average individual does not allow consumption to swing with income fluctuations in the short
run. This is because an individual’s consumption at a point in time does not necessarily depend on
their current earnings, but mostly importantly on future income. Thus consumption smoothing is
driven by changes in the lifetime income – permanent income – but not on the transitory or current
income. This theory has practical implications for the insurance market. The payments made by
individuals into a pool of an insurance policy entitle them to a future stream of income (claims)
which can aid them to smooth out consumption even in times of income shocks.
4.2.2. The Empirical Literature
Households’ consumption as noted by Morduch (1995) does not match income particularly well,
hence a diversity of smoothing behaviours however inadequate has been developed by low-
income households to deal with consumption shocks. These diverse strategies designed to
maintain long-term survival and welfare can broadly be decomposed into two: risk management
tools and risk coping strategies (Morduch, 1995; Alderman & Paxson, 1992). The risk management
tools are ex-ante instruments adapted to manage income shocks and smooth out income. They
are steps taken by the poor to protect their livelihood from negative income shocks before they
occur (Morduch, 1995). Such strategies range from the combination of various economic activities
including farm and non-farm activities in order to diversify income. Others are income skewing
operations; that is, engaging in low risk production and employment at the expense of high returns
Stellenbosch University https://scholar.sun.ac.za

64
(Morduch, 1995; Alderman & Paxson, 1992; Rosenzweig & Binswanger, 1993; Dercon, 2002). The
choice of these low-risk low-return economic activities can consign households to a lower level of
well-being with adverse long run effects. Precautionary savings and investment in livestock as
buffer against shocks have also been identified as risk management strategies among low-income
households (Deaton, 1991; Rosenzweig and Wolpin, 1993).
Risk coping strategies are designed ex-post in response to the economic consequences of income
shocks in order to achieve consumption smoothing. Examples of such strategies are assets
disposal, informal insurance and reduction in daily meals. In Burkina Faso Fafchamps et al. (1998)
report that income loss and consumption shocks due to drought are marginally dealt with through
livestock sales. In contrast, Kazianga and Udry (2006) find no evidence concerning the usage of
livestock as buffer stock to offset consumption shortfalls among households in rural Burkina Faso.
Informal insurance is also used by extended families, village committees and trade associations to
cope with hardships (Lund & Fafchamps, 1997; Townsend, 1994). Informal financing from family
and friends, susu31 and ROSCAS32 are also employed to cope with the consequences of financial
shocks (Dercon, 2002; Bouman, 1995; Besley et al., 1993; Rosenzweig, 1988). These social
insurance networks are however only effective in dealing with idiosyncratic risks. The financial
base of such networks is usually not sufficient for handling covariant risks.
Certain investments and expenditures which are critical for the proper development of human
capital are sometimes sacrificed by the poor to cope with the adverse effects of repeated exposure
to socio-economic downturns. Sometimes children are taken out of school to engage in child
labour in order for the family to raise money to cope with financial distress (Chakrabarty, 2012),
and this does not only impair a family’s human capital growth, but can also have adverse trans-
generational consequences on the capacity of a household to escape the traps of chronic poverty.
Reduction in daily meals is another coping method that can have long-term deleterious impacts on
the physical and intellectual development of household’s members. Children are particularly very
vulnerable since reduced nutrition can lead to irreversible impairment in health such as stunted
growth, slower cognitive and motor development and high morbidity rates (Ray, 1998; Martorell,
1999).
Kochar (1995) indicated increased hours of working as critical for coping with hardships in rural
India. Rahmato (1991) earlier reported a similar approach as well as wild fruit and firewood
gathering as coping mechanisms adopted by the poor to cope with the severe famine that hit
Ethiopia from 1984 to 1985. Recent evidence advanced by Berloffa and Modena (2013) suggest
that Indonesian households use a similar mechanism to deal with crop loss in order to maintain a
31
The regular contribution of smaller amounts of money towards a specified target. 32
Rotating, savings and credit associations.
Stellenbosch University https://scholar.sun.ac.za

65
stable consumption path. Specifically, they report that while the non-poor smooth consumption
through asset disposal and savings, the asset poor increase their labour supply to compensate for
the decline in income and to overcome a drop in consumption.
Despite the diversity of strategies adopted by low-income households to cope with the financial
consequences of risks, majority are still poor and very vulnerable to repeated episodes of socio-
economic shocks. In the next few paragraphs we review the literature on how microinsurance can
be a better alternative for influencing households’ ex-ante decisions and for coping with ex-post
risks.
Microinsurance plays a dual role in dealing with vulnerability and poverty traps: the indemnity cover
and the pay-out in the occurrence of an insurable loss. Whereas the indemnity cover affects ex-
ante decisions, the pay-out influences the choice of ex-post coping mechanism. First, the
indemnity cover can have a positive influence on the ex-ante behavioural patterns of the poor by
motivating them to invest in high yield high risk ventures. Such high yielding ventures can improve
the economic growth path of the poor by aiding them to move steadily to a higher equilibrium and
make a sustainable exit from poverty. It can also provide an “atmosphere of peace” and a “sense
of hope” to the poor that they need not be anxious about future economic shocks. Secondly, the
microinsurance pay-out that households receive if an insurable loss occurs has the potential to
reduce the use of costly coping strategies such as the disposal of productive assets, taking
children out of school, child labour and meal reduction. The evidence in the literature to some
extent supports this two-pronged impact of microinsurance on households’ welfare.
On households’ ex-ante behavioural changes, Janzen et al. (2013) argue that the presence of
microinsurance provides households with positive expectations about their future well-being and a
positive probability of escaping the poverty trap. They further aver that households forgo
precautionary investments in low yielding endowments as a coping strategy in order to take up
microinsurance. This is expected to motivate low-income households to invest in higher yielding
activities and propel them to a higher equilibrium of well-being. The findings of Janzen et al. (2013)
corroborate an earlier work on the Malawian market by Nicola (2011) that weather insurance
enhances the adoption of more productive farming technologies that improve farmers’ welfare.
In India Mobarak and Rosenzweig (2012) report from a randomized study on the uptake and
impact of rainfall index-based insurance that the risk appetite of households to invest in higher
yielding seeds increases under formal insurance. A similar rainfall index-based insurance for
farmers in northern Ghana was studied by Karlan et al. (2014). The findings indicate that insurance
encourages increased investment into agriculture ventures and production choices which provide
better returns to farmers.
Stellenbosch University https://scholar.sun.ac.za
66
Cai (2013) employed difference-in-difference and triple difference to evaluate the impact of
agricultural insurance on farm production, credit financing and savings among households in rural
China. The evidence from the study suggests that insurance (1) raises crop production by 20
percent and lowers farmers’ tendency to diversify farm production; (2) reduces precautionary
savings by about 30 percent and (3) increases the demand for credit by 25 percent. The crux effect
of microinsurance on households’ ex-ante behaviours is the empowerment of households to
engage in productive activities that increase human and physical asset accumulation necessary for
welfare enhancement.
The ex-post evidence is however inconclusive, ranging from positive impacts (Janzen & Carter,
2013a, 2013b; Morsink et al., 2011; Hamid et al., 2010) to negative impacts (Gnawali et al., 2009)
and mixed results or no impacts at all (Dercon et al., 2012; Cheung & Padieu, 2011; Hsu et al.,
2011; Wagstaff et al., 2009). The evidence on Kenya provided by Janzen and Carter (2013a and
2013b) indicates that microinsurance pay-out promotes asset retention, reduces the tendency to
cut down on meals and equips households to escape poverty traps. Similarly Morsink et al. (2011)
report from the Philippines that microinsurance has a declining effect on households’ frequency of
falling into the vulnerability – poverty vicious cycle and from Bangladesh, Hamid et al. (2010) also
indicate that food sufficiency is greatly enhanced among insured households.
As indicated earlier, empirical information about the African experience concerning the impact of
microinsurance on consumption smoothing has been very limited. Apart from the work of Janzen
and Carter (2013a and 2013b) on the Kenyan drought-index microinsurance, evidence on whether
the growing outreach of microinsurance has improved consumption smoothing among low-income
households is virtually non-existent in Africa.
Besides the context-specific contribution indicated in the introduction, this study makes unique
contribution to the empirical literature in two main ways: (1) Unlike the studies of Janzen and
Carter which cover only northern Kenyan, this study covers rural and urban households across the
whole of Ghana; (2) whereas the focus of most studies have been on rural farmers and weather-
index microinsurance, this study extends the coverage to both farmers and non-farmers. The
current study also extends the analysis to other microinsurance product such as life, property and
health schemes.
4.3. OVERVIEW OF CONSUMPTION POVERTY AND MICROINSURANCE IN GHANA
This section presents the trend of consumption poverty across gender and geographical locations
in Ghana. This overview provides the context within which the effect of microinsurance on
consumption smoothing, which has direct consequences on consumption poverty, is evaluated.
Consumption poverty is the standard of living at which the required calories intake falls below the
Stellenbosch University https://scholar.sun.ac.za
67
poverty line (GSS, 2007). It defines the nutritional requirements of each household member and
the minimum amount of money necessary to provide the defined calories. The Ghana Statistical
Service (GSS, 2014) has set the consumption poverty line at 2,900 kilocalories per equivalent
adult, which translates into GHS1314.00 per equivalent adult per year in the January 2013 prices
of Greater Accra Region. In international purchasing parity terms, this is US$1.83/day which is
slightly higher than the World Bank’s poverty benchmark of US$1.25 a day in 2008 prices.
Using this poverty benchmark, Ghana has reduced the incidence of consumption poverty by about
half from a staggering percentage of 51.7 in 1991 to 28.5 percent in 2006 and to 24.2 percent in
2013 (GSS, 2008 & 2014). This indicates that Ghana may be able to achieve the first Millennium
Development Goal (MDG) of reducing the poverty rate by half by the year 2015.
The gender dimension of consumption poverty indicates that male-headed households are on
average much poorer than female-headed households (GSS, 2007 & 2014). This contradicts the
perception that most women are much poorer than men. The rural-urban divide also shows that
consumption poverty is disproportionately high in rural communities, with about 78 percent of
households living below the poverty line residing in rural localities (GSS, 2014). Whereas about 2
percent of the poor population reside in urban coastal towns as high as 40 percent dwell in rural
savannah (GSS, 2014). Though the regional distribution indicates a general decline of
consumption poverty in all the regions, the rates of the three northern regions – Northern Region
(50.4%), Upper East (44.4%) and Upper West (70.7%) – are above the national average.
Many programs have been initiated by the government and private entities not only to sustain the
gains made in reducing consumption poverty, but also to accelerate the efforts of reducing all
forms of poverty to the barest minimum. Examples of such programs are the Livelihood
Empowerment against Poverty (LEAP), free meals for basic school children, capitation grants for
basic schools, free maternal health care and microinsurance services.
The concept of microinsurance begun in Ghana in the 1980s through the traditional susu scheme.
However it collapsed due to challenges with premium collections and other high transactional costs
(NIC, 2008b). In the last decade the National Insurance Commission (NIC) has mounted a
concerted campaign to overcome market and institutional barriers in order to achieve greater
insurance inclusiveness for the lower end of the market. This led to the establishment of GLICO’s33
Anidaso scheme and SIC’s34 Sika Plan in 2003 and Edwadifu Ahobanbo by Downwell Insurance in
2005. Several other schemes have been established since 2005 (see Table 4.1).
33 Gemini Life Insurance Company 34
State Insurance Company
Stellenbosch University https://scholar.sun.ac.za

68
The NIC’s campaign on microinsurance has increased the scale and outreach of microinsurance to
more than 1 million lives, with about GHS11 703 488 (US$6 087 473) collected as premiums and
GHS4 421 494 (US$2 299 803) paid as claims (NIC & GIZ, 2012; Buabeng & Gruijters, 2012). The
product portfolio of the market is dominated by health, savings-linked and funeral/term life policies.
Other products on the market are rainfall index, credit-linked and property policies. Commercial
insurers sell these products in partnership with microfinance institutions, rural and community
banks, post offices, telecoms, direct sales agents and nodal agencies such as trade associations
and churches.
The efforts of the various stakeholders to increase access to microinsurance have been boosted
by innovations from mobile phone technology, which is used to sell, collect premiums and effect
claims payments. This has reduced the high overhead costs usually associated with the
underwriting of several thousands of small policies. For example, Tigo and Airtel mobile
telecommunications are in partnership with MicroEnsure and Star Microinsurance Services Ltd.
respectively to extend microinsurance services to low-income households.
Although the microinsurance market has recorded increased market activity, its full potential
remains largely untapped. The NIC has therefore initiated a new agenda to grow the
microinsurance market and make it more proactive in addressing the needs of low-income
households. Its proposed policy document on microinsurance states that “insurers cannot
designate a product as microinsurance unless it considers that the product satisfied the following
criteria: (1) target at low-income households; (2) affordable for low-income households and (3)
accessible to low income households” (NIC, 2011:3). It also requires insurers to make
microinsurance contracts very simple to understand with less legalese and no or few exceptions. It
further requires claims to be dealt with expeditiously within 7 to 10 days (NIC, 2011).
Stellenbosch University https://scholar.sun.ac.za

69
Table 4.1: Microinsurance Products
Insurer Microinsurance Product Class of Policy
GLICO Anidaso Life, Family Life, Endowment,
Hospital Cash, Children’s Education
Donewell Insurance Edwadifus Life, Savings-linked
Ahobanbo
SIC Life Sika Plan Life, Savings-linked, Funeral
Star Life Assurance Various Life, Health, Funeral, Property
Vanguard Insurance Shop Owner’s Property, Goods in Transit
Policy
Ghana Agricultural Drought-Index Crop insurance, Food Chain Policy
Insurance Pool
Credit Unions Life Savings Life
4.4. METHODOLOGY
4.4.1. The Data
The study used the Ghana household survey undertaken in 2010 by Finmark Trust for the
empirical analysis. In all 3 643 households from rural and urban settings in all ten regions of the
country were randomly selected and interviewed. It has in-depth data on households’
demographics, income, economic activities, education, asset ownership, financial knowledge,
access to financial services and risk coping strategies. The dataset is divided into three categories
based on access to financial services: (1) access to formal financial services such as commercial
banks; (2) access to other formal financial services such as microfinance firms, insurance firms,
savings and loans companies, rural and community banks; informal financial services such as
savings clubs, susu, ROSCAS; and (3) no access at all. Since this study’s focus is on low-income
households we extracted the dataset of 800 households who use informal and other formal
financial services for the empirical estimations. After cleaning the dataset of outliers, 682 datasets
consisting of 438 insured and 244 uninsured households were used for the empirical analysis. The
individual microinsurance products did not have enough observations to aid effective regression
estimations, hence the 438 insured households is an aggregation of the following products:
property, life, health, education, funeral, investment plan and livestock. The aggregation however
has no negative influence on our analysis, because the focus of the study is not on individual
microinsurance products, but rather on the comparison between insured and uninsured cohorts.
Source: Adapted from Wiedmaier-Pfister and McCord, 2009.
Stellenbosch University https://scholar.sun.ac.za
70
4.4.2. The Profile and Features of the Sampled Households
The result of a chi-square test on the degree of differences between the insured and the uninsured
households is reported in Table 4.2. The literature on household economics indicates that the
probability for a household to reduce meals may be influenced by the level of income. Indeed
insufficient income can compel households to reduce the number of daily meals consumed. The
chi-square test indicates that insured households do not significantly differ from the uninsured in
terms of income levels. To this extent effective consumption smoothing among either the insured
or the uninsured cannot be attributed to differences in their income levels. The test on the other
variables of interest also shows that the two groups of households do not differ significantly from
each other in terms of economic activities, proximity to financial services or rural-urban location,
however they differ in terms of access to credit, remittances, education and family size. Whereas
the insured has more access to the credit market, the uninsured receives more foreign
remittances.
Stellenbosch University https://scholar.sun.ac.za
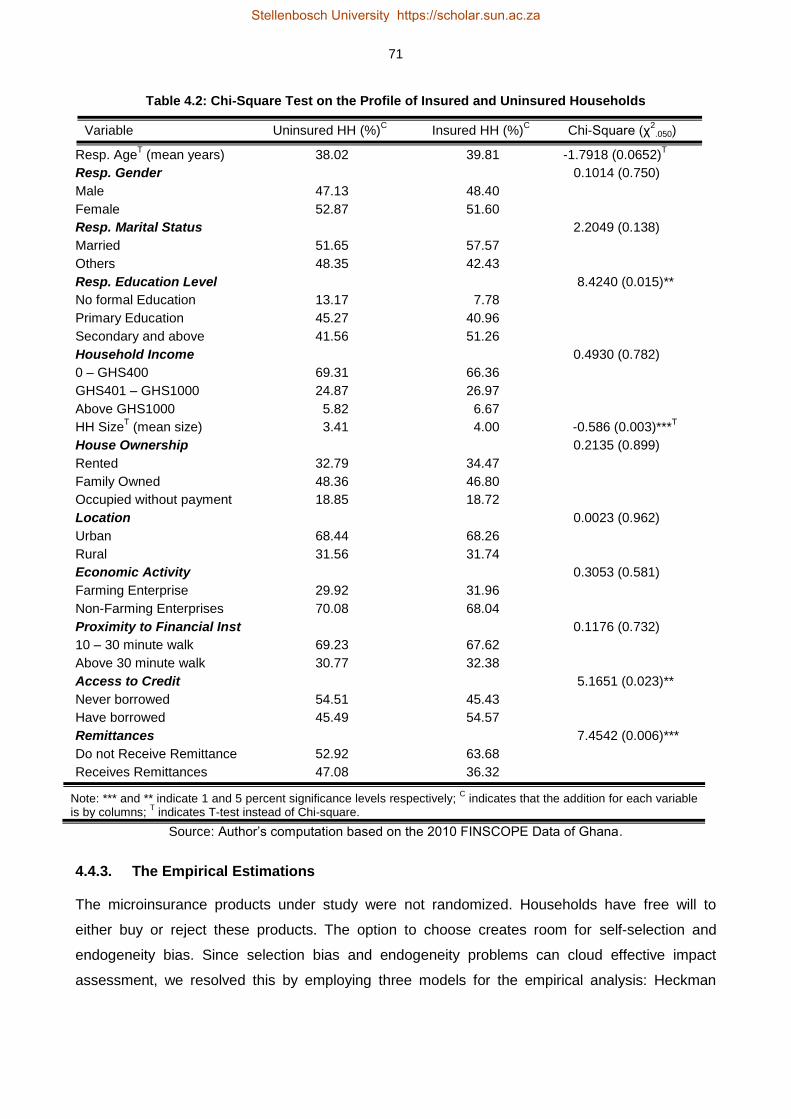
71
Table 4.2: Chi-Square Test on the Profile of Insured and Uninsured Households
Variable Uninsured HH (%)C Insured HH (%)
C Chi-Square (χ
2.050)
Resp. AgeT (mean years) 38.02 39.81 -1.7918 (0.0652)
T
Resp. Gender 0.1014 (0.750)
Male 47.13 48.40
Female 52.87 51.60
Resp. Marital Status 2.2049 (0.138)
Married 51.65 57.57
Others 48.35 42.43
Resp. Education Level 8.4240 (0.015)**
No formal Education 13.17 7.78
Primary Education 45.27 40.96
Secondary and above 41.56 51.26
Household Income 0.4930 (0.782)
0 – GHS400 69.31 66.36
GHS401 – GHS1000 24.87 26.97
Above GHS1000 5.82 6.67
HH SizeT (mean size) 3.41 4.00 -0.586 (0.003)***
T
House Ownership 0.2135 (0.899)
Rented 32.79 34.47
Family Owned 48.36 46.80
Occupied without payment 18.85 18.72
Location 0.0023 (0.962)
Urban 68.44 68.26
Rural 31.56 31.74
Economic Activity 0.3053 (0.581)
Farming Enterprise 29.92 31.96
Non-Farming Enterprises 70.08 68.04
Proximity to Financial Inst 0.1176 (0.732)
10 – 30 minute walk 69.23 67.62
Above 30 minute walk 30.77 32.38
Access to Credit 5.1651 (0.023)**
Never borrowed 54.51 45.43
Have borrowed 45.49 54.57
Remittances 7.4542 (0.006)***
Do not Receive Remittance 52.92 63.68
Receives Remittances 47.08 36.32
Note: *** and ** indicate 1 and 5 percent significance levels respectively; C indicates that the addition for each variable
is by columns; T indicates T-test instead of Chi-square.
Source: Author’s computation based on the 2010 FINSCOPE Data of Ghana.
4.4.3. The Empirical Estimations
The microinsurance products under study were not randomized. Households have free will to
either buy or reject these products. The option to choose creates room for self-selection and
endogeneity bias. Since selection bias and endogeneity problems can cloud effective impact
assessment, we resolved this by employing three models for the empirical analysis: Heckman
Stellenbosch University https://scholar.sun.ac.za

72
sample selection, treatment effects model and instrumental variable modelling. Each of these
models has a unique advantage in correcting selection and endogeneity bias.
4.4.3.1. Heckman Sample Selection Model
Heckman’s model corrects selection bias associated with participation in non-randomized
programs. It is a two-step estimation comprising a probit model and an outcome regression
(Heckman, 1974, 1978 and 1979). The probit model is used to estimate the demand for
microinsurance in the following set up:
𝑖𝑛𝑠𝑢𝑟𝑒𝑖 = {
1 𝑖𝑓 ℎ𝑜𝑢𝑠𝑒ℎ𝑜𝑙𝑑 𝑖 ℎ𝑎𝑠 𝑚𝑖𝑐𝑟𝑜𝑖𝑛𝑠𝑢𝑟𝑎𝑛𝑐𝑒
0 𝑖𝑓 ℎ𝑜𝑢𝑠𝑒ℎ𝑜𝑙𝑑 𝑖 𝑛𝑒𝑣𝑒𝑟 ℎ𝑎𝑑 𝑚𝑖𝑐𝑟𝑜𝑖𝑛𝑠𝑢𝑟𝑎𝑛𝑐𝑒
4.1
The above set up is given as:
𝑖𝑛𝑠𝑢𝑟𝑒𝑖 = 𝑧𝑖𝛿 + 𝜇𝑖 4.2
Thus 𝑃𝑟𝑜𝑏(𝑖𝑛𝑠𝑢𝑟𝑒𝑖 = 1|𝑧𝑖) = Φ(𝑧𝑖𝛿) and 𝑃𝑟𝑜𝑏(𝑖𝑛𝑠𝑢𝑟𝑒𝑖 = 0|𝑧𝑖) = 1 − Φ(𝑧𝑖𝛿)
Where zi is a vector of exogenous factors influencing the demand for microinsurance and Φ(∙) is
the standard normal cumulative distribution function. The inverse Mills ratio or the hazard lambda
which controls for selection bias is then calculated from the estimated co-efficients of the probit
model and used as an additional explanatory variable in the outcome regression (Janzen and
Carter, 2013b; Lin, 2007). The inverse Mills ratio is given as:
𝜆𝑖 =𝜙(𝑧𝑖�̂�)
Φ(𝑧𝑖δ̂) 4.3
Where 𝜆𝑖 is the inverse Mills ratio, 𝜙 is the standard normal density function, and Φ is as defined in
the probit model above. The second step equation – that is, the impact of microinsurance on food
reduction – is then estimated with the inverse Mills ratio35 as an explanatory variable.
𝐹𝑂𝑅𝑖 = 𝛽0 + 𝛽1𝑖𝑛𝑠𝑢𝑟𝑒𝑖 + 𝛽2𝜆𝑖 + 𝑐𝑜𝑛𝑡𝑟𝑜𝑙𝑖 + 휀𝑖 4.4
Where FORi is food reduction as a coping strategy by household i; insurei is microinsurance;
controli is a vector of control variables such as education, age, marital status, income and
economic activity, rural-urban setting and regional effects; and the error terms (𝜇𝑖; 휀𝑖) of both
equations (2) and (4) are bivariate normal with mean zero.
35
The ivtreatreg STATA program designed by Cerulli (2012) estimates the inverse Mills ratio (Heckman correction terms) automatically from the probit model.
Stellenbosch University https://scholar.sun.ac.za

73
4.4.3.2. The Treatment Effect Model
Whereas the Heckman model uses the observed variables of only the participants, the treatment
effect model uses the observed variables of both the program participants and the non-participants
for the estimation. It is a two-stage technique involving the selection and outcome model which can
be estimated simultaneously.
First stage: selection model:
𝑖𝑛𝑠𝑢𝑟𝑒𝑖 = 1 𝑖𝑓 𝑖𝑛𝑠𝑢𝑟𝑒𝑖∗ > 0, 𝑎𝑛𝑑 𝑖𝑛𝑠𝑢𝑟𝑒𝑖 = 0 𝑜𝑡ℎ𝑒𝑟𝑤𝑖𝑠𝑒
Thus 𝑖𝑛𝑠𝑢𝑟𝑒𝑖∗ = 𝑧𝑖𝛿 + 𝜇𝑖 , 4.5
𝐹𝑂𝑅𝑖 = 𝑥𝑖𝛽 + 𝑖𝑛𝑠𝑢𝑟𝑒𝑖𝛾 + 𝑐𝑜𝑛𝑡𝑟𝑜𝑙𝑖 + 휀𝑖 4.6
The errors terms (µi and ɛi) are bivariate normal with zero mean. To obtain the outcome models for
both program participants and non-participants, equation (4.5) is put into equation (4.6). That is:
When 𝑖𝑛𝑠𝑢𝑟𝑒𝑖∗ > 0, 𝑖𝑛𝑠𝑢𝑟𝑒𝑖 = 1: 𝐹𝑂𝑅𝑖 = 𝑥𝑖𝛽 + (𝑧𝑖𝛿 + 𝜇𝑖)𝛾 + 휀𝑖 4.7
And when 𝑖𝑛𝑠𝑢𝑟𝑒𝑖∗ ≤ 0, 𝑖𝑛𝑠𝑢𝑟𝑒𝑖 = 0: 𝐹𝑂𝑅𝑖 = 𝑥𝑖𝛽 + 휀𝑖 4.8
Where the 𝐹𝑂𝑅𝑖 = 𝑥𝑖𝛽 + (𝑧𝑖𝛿 + 𝜇𝑖)𝛾 + 휀𝑖 is the participants outcome model while the non-
participants outcome model is 𝐹𝑂𝑅𝑖 = 𝑥𝑖𝛽 + 휀𝑖. These are evaluated simultaneously.
4.4.3.3. Instrumental Variable Model (IV Model)
The demand for microinsurance is not only influenced by observed factors, but also by unobserved
factors such as risk appetite, entrepreneurial passion, motivation or even fear. Such unobserved
variables are however not likely to be captured by either the Heckman or the treatment effect
models. We have therefore estimated an instrumental variable model to take account of the
unobserved variables and also to control for endogeneity bias. The instrumental variable approach
requires an observed variable that is (1) highly correlated with the demand for microinsurance, but
(2) uncorrelated with the unobserved factors influencing households to use food reduction to cope
with shocks. The assumptions of the IV model referred to as “exclusion restriction” by Khandker et
al. (2010:88) are summarised as:
𝑐𝑜𝑟𝑟𝑒𝑙𝑎𝑡𝑒𝑑 𝑤𝑖𝑡ℎ 𝑖𝑛𝑠𝑢𝑟𝑒: 𝑐𝑜𝑣 (𝑍, 𝑖𝑛𝑠𝑢𝑟𝑒) ≠ 0
𝑢𝑛𝑐𝑜𝑟𝑟𝑒𝑙𝑎𝑡𝑒𝑑 𝑤𝑖𝑡ℎ 𝑒𝑟𝑟𝑜𝑟 𝑡𝑒𝑟𝑚 (휀): 𝑐𝑜𝑣 (𝑍, 휀) = 0
Where Z is the chosen instrument. We chose two nationally recognised identity cards as the
possible instruments: the National Health Insurance Scheme’s identity card (NHIS ID) and the
Electoral Commission’s identity card (the voter’s ID). Although the NHIS ID is issued by the
National Insurance Authority to clients of the government health insurance scheme, private
Stellenbosch University https://scholar.sun.ac.za

74
insurance companies have come to accept this card as a form of identification. The voter’s ID is
also issued by the Ghana Electoral Commission for the purpose of voting in national and local
elections. Financial institutions including insurance companies have however adopted this card as
a major identification of their clients. These two ID cards are major forms of identification that every
individual intending to purchase microinsurance is expected to hold. So they are key determinants
of the uptake of microinsurance. Any one of them is accepted as a prerequisite for the purchase of
microinsurance. Whereas these cards influence one’s decision to purchase microinsurance, they
do not influence the decision to skip or cut the number of meals per day.
Wooldridge (2010) and Cerulli (2012) explain that the most efficient instrument is the predicted
probability of getting treatment; comprising the selected instruments (in this case the ID cards) plus
the other exogenous (control) variables influencing the outcome variable. That is the predicted
probability of microinsurance,[𝑃(𝑖𝑛𝑠𝑢𝑟𝑒̂ 𝑖|𝑥𝑖𝑧𝑖)], derived by regressing 𝑖𝑛𝑠𝑢𝑟𝑒𝑖 on 𝑥𝑖 and 𝑧𝑖 is used
as the instrument because its generates efficient and consistent estimates and in the words of
Cerulli (2012) “is the best instrument because it generates the smallest projection error”. We have
followed this estimation strategy under the IV approach by using an identification strategy which
involves an imposition of an exclusion restriction, the instruments, which predict only the selection
process, but not the outcome. This implies that selection into the program relies on the same
factors that affect the outcome plus the instruments 𝑧𝑖 which do not affect directly the outcome, but
indirectly through their effect on 𝑖𝑛𝑠𝑢𝑟𝑒𝑖 (Cerulli, 2012; Awel & Azomahou, 2014).
Under the IV approach different estimation models have been designed to evaluate programs such
as microinsurance. Examples of such models are the IV-probit, direct-2SLS and probit-2SLS.
Although the IV-probit is good for estimating a model with binary dependent and an endogenous
variable – just as in this case where the dependent variable, 𝐹𝑂𝑅𝑖, is binary and 𝑖𝑛𝑠𝑢𝑟𝑒𝑖 is
endogenous – it assumes that the endogenous variable is continuous and thus not appropriate for
estimating a model with discrete endogenous variable36. It is therefore not suitable for the present
study because our endogenous variable, 𝑖𝑛𝑠𝑢𝑟𝑒𝑖, is discrete. The direct-2SLS is also not
appropriate because it is designed for the estimation of linear regression.
The probit-2SLS fits properly a model where the endogenous variable is binary. First, we estimated
a probit model of 𝑖𝑛𝑠𝑢𝑟𝑒𝑖 on 𝑥𝑖 and 𝑧𝑖 to derive the predicted probability of 𝑖𝑛𝑠𝑢𝑟𝑒𝑖. Second, we
used the predicted probabilities as instruments of 𝑖𝑛𝑠𝑢𝑟𝑒𝑖 to estimate the two-stage least squares
(2SLS) model. This approach is known to yield consistent estimates and is also more efficient than
the direct-2SLS (Cerulli, 2012).
36
See Newey (1987) for the underlying theory of instrumental variables with probit modelling.
Stellenbosch University https://scholar.sun.ac.za

75
The probit-2SLS also allows for the determination of homogenous and heterogeneous treatments
outcomes. It is thus very appropriate for this study. Following Cerulli (2012) and Awel and
Azomahou (2014), we operationalised the probit-2SLS in three stages:
1. Run a probit of 𝑖𝑛𝑠𝑢𝑟𝑒𝑖 on 𝑥𝑖 and 𝑧𝑖 to obtain 𝑃𝑖𝑛𝑠𝑢𝑟𝑒, that is the predicted probability of
𝑖𝑛𝑠𝑢𝑟𝑒𝑖. That is: 𝑖𝑛𝑠𝑢𝑟𝑒𝑖 = 𝛾𝑍𝑖 + 𝜙𝑋𝑖 + 𝜇𝑖
2. Estimate an OLS of 𝑖𝑛𝑠𝑢𝑟𝑒𝑖 on 𝑥𝑖 and 𝑃𝑖𝑛𝑠𝑢𝑟𝑒 to obtain the fitted values of 𝑖𝑛𝑠𝑢𝑟𝑒2𝑓𝑣,𝑖.
3. Estimate a second OLS of the outcome variable 𝐹𝑂𝑅𝑖 on 𝑥𝑖 and 𝑖𝑛𝑠𝑢𝑟𝑒2𝑓𝑣,𝑖.
The parameter of 𝑖𝑛𝑠𝑢𝑟𝑒2𝑓𝑣,𝑖 is the best estimate of the average treatment effect. Also this
approach does not demand for consistency that the selection model be properly specified
(Wooldridge, 2010; Cerulli, 2012).
4.5. RESULTS AND DISCUSSION
The results of all the three models in Table 4.3 show a significant inverse impact of microinsurance
on the reduction in the number of daily food intake. In particular, the Heckman model shows that
households accessing microinsurance services are less likely to reduce daily meals just to cope
with risks. The treatment effects model shows a similar result. The effect of microinsurance on
household consumption is even larger if unobserved factors are accounted for through the
instrumental variable technique. The instrumental variable approach indicates that insured
households are 22 percent less likely to forgo daily food just to cope with socio-economic shocks.
This finding corroborates the Kenyan evidence adduced by Janzen and Carter (2013a and 2013b).
The summary of the three estimations is that microinsurance improves consumption smoothing
and food security among insured households by eliminating under-nutrition and malnourishing
actions such as reduction in food intake. By providing households with better strategies to deal with
risk, microinsurance does not only leads to adoption of more efficient ex-ante behaviours, it also
plays a crucial role in improving households’ health outcomes through better smoothing of
consumption.
In the event of shocks low-income households are mostly compelled to sell essential asset and or
cut meals to raise money to cope (Janzen & Carter, 2013b). In most cases household food
consumption is the first victim to be compromised in the form of reduced meals in order to cope
with shocks. However, the consequential effects of forgoing meals can be very damaging to the
health of a household especially children. Thus using microinsurance to eliminate or reduce the
usage of meals as a coping mechanism can have long-term positive implication on households’
welfare.
Stellenbosch University https://scholar.sun.ac.za
76
By facilitating proper consumption smoothing, microinsurance reduces consumption poverty. This
implies that the inadequacy of current earnings would not force households into consumption
poverty if such households are insured. This is in line with the life cycle theory that consumption
can be smoothen over time and over states of nature if insurance is used as a vehicle to
accumulate financial savings during periods of earnings to cover the possibilities of future shocks
in earnings. It also confirms the permanent income hypothesis and the empirical findings of Hamid
et al. (2010) and Janzen and Carter (2013a, 2013b).
The policy implications of the current findings are quite enormous. For instance the Government of
Ghana is running a poverty reduction program – the Livelihood Empowerment against Poverty
(LEAP) – through which extremely poor households are given monthly cash transfers. The
program which forms part of the National Social Protection Strategy has recognised the welfare
value that microinsurance can add to the LEAP cash transfer. Thus free health insurance has been
added to the social cash transfer in order to properly empower the beneficiaries to use the cash
transfer for the necessary household consumption expenditures. Although the inclusion of the
health insurance is good, the gains may be substantial if other microinsurance products such as
life, crop and fire are integrated into the program. This can be done through a public private
partnership agreement where private insurers will provide these products at subsidized premiums
paid by the government.
Stellenbosch University https://scholar.sun.ac.za

77
Table 4.3: The Impact of Microinsurance on Consumption Smoothing
Variables Heckman Treatment IV
Financial Variables Microinsurance -0.2072 -0.1927 -0.2231 (0.006)*** (0.007)*** (0.007)*** Microcredit -0.0541 -0.0499 -0.0501 (0.241) (0.262) (0.293) Savings -0.0668 -0.0579 -0.0623 (0.214) (0.264) (0.251) Susu_Box (Piggy_Bank) -0.0860 -0.0862 -0.0767 (0.014)** (0.010)** (0.035)** Hide_Money_(underground) 0.0305 0.0259 0.0332 (0.221) (0.282) (0.212) Gone Without Cash -0.0074 -0.0081 -0.0072 (5=Never) (0.039)** (0.020)** (0.010)** Financial Assistance -0.0029 -0.0030 -0.0030 (0.058)* (0.044)** (0.017)** Income Source -0.0012 -0.0015 -0.0009 (3=Salaries) (0.864) (0.828) (0.903) Barter Trade -0.0257 -0.0265 -0.0371 (0.248) (0.207) (0.099)* Assistance_Food (Goods) -0.0025 -0.0063 0.0027 (0.940) (0.843) (0.925) Trade Credit -0.0026 -0.0150 -0.0144 (0.960) (0.764) (0.771) Hire Purchase -0.0974 -0.0881 -0.0817 (0.163) (0.191) (0.240) Receive_Remittance 0.0163 0.0191 0.0180 (1=yes) (0.726) (0.672) (0.707) Household Characteristics Resp. Education 0.0109 0.0106 0.0096 (0.370) (0.366) (0.422) Resp. Age -0.0081 0.0050 -0.0363 (0.547) (0.516) (0.166) Resp. Age Square 0.0001 -0.0001 -0.0004 (0.436) (0.353) (0.158) Female -0.1180 -0.1218 -0.1246 (0.011)** (0.007)*** (0.009)*** HH_Size 0.0227 0.0214 0.0287 (0.123) (0.127) (0.068) HH_Head 0.0299 0.0295 0.0080 (0.578) (0.561) (0.889) Marital 0.0151 0.0221 0.0218 (0.597) (0.207) (0.590) Bread Winner -0.0487 -0.0397 -0.0404 (1=Yes) (0.127) (0.190) (0.147) Financing_HH_Education 0.0373 0.0385 0.0331 (0.108) (0.0.84)* (0.198) Economic Activity 0.1307 0.0953 0.1416 (0.138) (0.068)* (0.248) Illness -0.0252 -0.0265 0.0090 (0.472) (0.172) (0.866) Threat to Income 0.0048 -0.0008 0.0060 (0.274) (0.740) (0.320) Rural Areas -0.0762 -0.0508 -0.1524 (0.366) (0.321) (0.170) Household Assets Access to Water -0.0097 -0.0104 -0.0094 (0.058)* (0.035)** (0.064)* Access to Electricity -0.0074 0.0486 0.0682 (0.039)** (0.473) (0.336) Access to Cooking Stove (Electric) 0.0931 0.0943 0.0661 (1=yes) (0.345) (0.320) (0.540) Access to Cooking Stove (Gas) 0.0645 0.0556 0.0714 (1=yes) (0.222) (0.277) (0.198) Access to Microwave 0.0321 0.0316 0.0382 (1=yes) (0.658) (0.654) (0.615) Inverse Mills Ratio _WL1 0.0179 (0.832) _WL0 -0.1047 (0.111) Hazard Lamda 0.0601 (0.238) Constant 0.7706 0.7117 1.2623 (0.164) (0.121) (0.069)*
R – Square 0.13 Wald=119.49 R-Square = 0.10 Prob>F 0.001 Prob>Chi2=0.000 Prob>F=0.000
Note: ***, ** and * indicate 1%, 5% and 10% significance levels respectively. P-values are in parenthesis
Stellenbosch University https://scholar.sun.ac.za

78
4.6. CONCLUSION AND POLICY RECOMMENDATIONS
In the event of socio-economic shocks low-income households adopt a variety of strategies,
including reducing the number of daily meals consumed, in order to cope. Sacrificing the quality
and quantity of daily meals can have pernicious and irreversible consequences on the health and
development of a household. Indeed underfeeding can lead to malnourished children and
subsequent damage to their motor functions and cognitive skills. In this study we have delved into
the capacity of microinsurance to equip low-income households to smooth out consumption by
avoiding meal reduction as a risk coping strategy. In particular we have examined the effect of
microinsurance as an alternative to costly coping mechanisms such as meals reduction which
undermine the health and welfare of households. The empirical investigations indicate that insured
households are less likely to forgo daily meals.
The policy implications of these findings are enormous. The value of microinsurance is not just the
transfer of risk, but most essentially the empowerment of low-income households to adopt effective
consumption smoothing actions which are critical for healthy living and human capital growth. This
has implications for financial sector policies in developing countries. In particular policies that
promote microinsurance and access to microinsurance will have a tremendous impact on the
government policy of reducing poverty through human development.
Stellenbosch University https://scholar.sun.ac.za

79
REFERENCES
Alderman, H. & Paxson, C. 1992. Do the poor insure? A synthesis of the literature on risk and
consumption in developing countries. World Bank Working Paper No. 1008. Washington, DC:
World Bank.
Ando, A. & Modigliani, F. 1963. The life cycle hypothesis of saving: Aggregate implications and
tests. American Economic Review, 53, 55-84.
Awel, Y.A. & Azomahou, T. T. 2014. Productivity and welfare effects of weather index insurance:
Quasi-experimental evidence. UNU-MERIT and Maastricht University, Proceedings of the 10th
International Microinsurance Conference, Mexico City, 11-13 November.
Barnett, B.J., Barrett, C.B. & Skees, J.R. 2008. Poverty traps and index-based risk transfer
products. World Development, 36, 1766-1785
Berloffa, G. & Modena, F. 2013. Income shocks, coping strategies and consumption smoothing: An
application to Indonesia data. Journal of Asian Economics, 24, 158-171.
Besley, T., Coate, S. & Loury, G. 1993. The economics of rotating savings and credit associations.
The American Economic Review, 83(4), 792-810.
Bouman, F. 1995. Rotating and accumulating savings and credit associations: A development
perspective. World Development, 23(3), 371-384.
Buabeng, I.Y. & Gruijters, R. 2012. Market survey: The supply of microinsurance products in
Ghana. In National Insurance Commission (NIC) & Deutsche Gesellschaft für Internationale
Zusammenarbeit (GIZ) (eds.), Promoting microinsurance in Ghana: Microinsurance as a means of
insurance sector development, 102-109. Accra: QualiType Limited.
Cai, J. 2013. The impact of insurance provision on households' production and financial decisions.
MPRA Paper No. 46864. Munich: Munich Personal RePEc Archive.
Cerulli, G. 2012. Ivtreatreg: A new Stata routine for estimating binary treatment models with
heterogeneous response to treatment under observable and unobservable selection. Cnr-Ceris
Working Papers, ANNO 14, No. 3/2012
Chakrabarty, S. 2012. Does micro credit increase child labour in absence of micro insurance? ILO
Microinsurance Innovation Facility Research Paper No. 12. Geneva: International Labour
Organization (ILO).
Stellenbosch University https://scholar.sun.ac.za

80
Cheung, D. & Padieu, Y. 2011. Impacts of health insurance on saving and consumption expenses
by income groups in rural China. Centre d’Economie de la Sorbonne (CES) Working Paper 13056,
Paris: University of Paris.
Churchill, C. 2007. Insuring the low-income market challenges and solution for commercial
insurers. The Geneva Papers, 32(3), 401–412.
Churchill, C. 2006. What is insurance for the poor? In Churchill, C. & Maul, M. (eds.), Protecting
the poor: A micro insurance compendium, 12-24. Geneva: International Labor Organisation (ILO).
Churchill, C. 2002. Trying to understand the demand for microinsurance. Journal of International
Development, 14, 381-387.
Cohen, M., McCord, M.J. & Sebstad, J. 2005. Reducing vulnerability: Demand for and supply of
microinsurance in East Africa. Journal of International Development, 17(3), 319-325.
Deaton, A. 1991. Savings and liquidity constraints. Econometrica, 59(5), 1221-1248.
Dercon, S. 2002. Income risk, coping strategies and safety nets. The World Bank Research
Observer, 17(2), 141-166.
Dercon, S., Gunning, J. W., Zeitlin, A. & Lombardini, S. 2012. The impact of a health insurance
programme: Evidence from a randomized controlled trial in Kenya. ILO Microinsurance Innovation
Facility Research Paper No. 24. Geneva: International Labour Organization (ILO).
Dercon, S., Tessa, B. & Cesar, C. 2008. Insurance for the poor? In Barrientos, A. & Hulme, D.
(eds.), Social protection for the poor and poorest: Risk, needs and rights, 47-63. Hampshire:
Palgrave Macmillan.
Fafchamps, M., Udry, C. & Czukas, K. 1998. Drought and saving in West Africa: Are livestock a
buffer stock? Journal of Development Economics, 55(2), 273-305.
Finmark Trust. 2010. FinScope Ghana 2010 report: Making financial markets work for the poor.
Accra: Finmark Trust Household Survey.
Friedman, M.A. 1957. Theory of the consumption function. Princeton, NJ: Princeton University
Press.
Ghana Statistical Service (GSS). 2008. Ghana living standards survey report of the fifth round
(GLSS V). Accra: Ghana Statistical Service. Available: http://www.statsghana.gov.gh. Accessed:
23 March 2011.
Stellenbosch University https://scholar.sun.ac.za
81
Ghana Statistical Service (GSS). 2007. Pattern and trends of poverty in Ghana, 1991-2006. Accra:
Ghana Statistical Service.
Giesbert, L. 2010. Uptake of micro-life insurance in rural Ghana. Proceedings of the Chronic
Poverty Research Centre 2010 Conference, University of Manchester, 8-10 September, 2010.
Gnawali, D.P., Pokhrel, S., Sié, A., Sanon, M., De Allegri, M., et al. 2009. The effect of community-
based health insurance on the utilization of modern health care services: Evidence from Burkina
Faso. Health Policy, 90(2/3), 214-222.
Hamid, S.A., Roberts, J. & Mosley, P. 2010. Can micro health insurance reduce poverty? Evidence
from Bangladesh. The Journal of Risk and Insurance, 78(1), 57-82.
Heckman, J. J. 1979. Sample selection bias as a specification error. Econometrica, 47(1), 135-161.
Heckman, J. J. 1978. Dummy endogenous variables in a simultaneous equation system.
Econometrica, 46(4), 931-959.
Heckman, J. J. 1974. Effects of child-care programs on women’s work effort. Journal of Political
Economy, 82(2), S136-S163.
Hsu, M., Liao, P.L. & Lin, C.C. 2011. Revisiting private health insurance and precautionary saving:
A theoretical and empirical analysis. Tokyo: National Graduate Institute for Policy Studies (GRIPS).
Janzen, S. A. & Carter, M. R. 2013a. The impact of microinsurance on consumption smoothing and
asset protection: Evidence from a drought in Kenya. Paper presented at the Agricultural and
Applied Economics Association’s 2013 AAEA and CAES Joint Annual Meeting, Washington, 4-6
August, 2013
Janzen, S.A. & Carter, M.R. 2013b. The impact of microinsurance on asset accumulation and
human capital investments: Evidence from a drought in Kenya. ILO Microinsurance Innovation
Facility Research Paper No. 31. Geneva: International Labour Organization.
Janzen, S.A., Carter, M.R. & Ikegami, M. 2013. Valuing asset insurance in the presence of poverty
traps. Available: http://www.montana.edu/econ/sjanzen/valuingassetinsurance.pdf. Accessed: 28
May 2014.
Karlan, D., Osei, R., Osei-Akoto, I. & Udry, C. 2014. Agricultural decisions after relaxing credit and
risk constraints. The Quarterly Journal of Economics, (2014), 597–652. doi:10.1093/qje/qju002
Kazianga, H. & Udry, C. 2006. Consumption smoothing? Livestock, insurance and drought in rural
Burkina Faso. Journal of Development Economics, 79, 413-446.
Stellenbosch University https://scholar.sun.ac.za

82
Khandker, S.R., Koolwal, G.B. & Samad, H.A. 2010. Handbook on impact evaluation: Quantitative
methods and practices. Washington, DC: The World Bank.
Kochar, A. 1995. Explaining household vulnerability to idiosyncratic income shocks. American
Economic Review, 85(2), 159-164.
Lin, W. 2007. Models with self-selection. Available at: http://www.wanchuanlin.org/Lecture,
Accessed: 27 August 2013.
Lund, S. & Fafchamps, M. 1997. Risk sharing networks in rural Philippines. New York, NY: Mimeo.
Martorell, R. 1999. The nature of child malnutrition and its long-term implications. Food & Nutrition
Bulletin, 20(3), 288-292.
Mobarak, A.M. & Rosenzweig, M. 2012. Selling formal insurance to the informally insured.
Economics Department Working Paper No. 97. New Haven, CT: Yale University.
Modigliani, F. & Ando, A. 1957. Tests of the life cycle hypothesis of savings. Bulletin of the Oxford
University Institute of Economics and Statistics, 19, 99-124.
Modigliani, F. & Brumberg, R. 1954. Utility analysis and the consumption function. In Kurihara, K.
(ed.), Post-Keynesian economics, 338-436. New Brunswick, NJ: Rutgers University Press.
Morduch, J. 1995. Income smoothing and consumption smoothing. Journal of Economic
Perspectives, 9(3), 103-114.
Morsink, K., Geurts, P. & Dijk, A. K. 2011. Impact of microinsurance on vulnerability of low income
households in the Philippines: The case of typhoon re-housing insurance. Proceedings of the
Second European Research Conference on Microfinance, 16-18 June, 2011, Groningen,
Netherlands.
National Insurance Commission (NIC). 2012. Promoting microinsurance in Ghana: Microinsurance
as a means of insurance sector development. Accra: QualiType Limited.
National Insurance Commission (NIC). 2011. The 2011 annual report. Accra: National Insurance
Commission. Available: http://www.nicgh.org. Accessed: 31 March 2014.
National Insurance Commission (NIC). 2008. The state of micro insurance in Ghana. Paper
presented by the Insurance Commissioner at a Stakeholders Meeting on Microinsurance in Ghana,
Accra, 7 August, 2008.
Stellenbosch University https://scholar.sun.ac.za

83
Newey, W. 1987. Efficient estimation of limited dependent variable models with endogenous
explanatory variables. Journal of Econometrics, Vol. 36, 231-250.
Nicola, F.D. 2011. The impact of weather insurance on consumption, investment, and welfare. Job
Society for Economic Dynamics Meeting Papers No. 548. St. Louis, MO: Federal Reserve Bank.
Prinsloo, J. W. 2000. The saving behaviour of the South African economy. Occasional Paper No.
14. Pretoria: South African Reserve Bank.
Rahmato, D. 1991. Famine and survival strategies: A case study from Northeast Ethiopia.
Uddevalla: The Scandinavian Institute of African Studies.
Ray, D. 1998. Development economics. Princeton: Princeton University Press.
Reilly, F.K. & Norton, E.A. 1999. Investment. 5th edition. New York, NY: Dryden Press.
Rosenzweig, M. 1988. Risk, implicit contracts and the family in rural areas of low-income countries.
The Economic Journal, 98(393), 1148-1170.
Rosenzweig, M. & Binswanger, H. 1993. Wealth, weather risk and the composition and profitability
of agricultural investments. Economic Journal, 103, 56-78.
Rosenzweig, M. & Wolpin, K. 1993. Credit market constraints, consumption smoothing, and the
accumulation of durable production assets in low-income countries: Investment in bullocks in India.
Journal of Political Economy, 101(2), 223-244.
Siegel, P.B., Alwang, J. & Canagarajah, S. 2001. Viewing microinsurance as a social risk
management instrument. Social Protection Discussion Paper No. 0116. Washington, DC: World
Bank.
Townsend, R.M. 1994. Risk and insurance in village India. Econometrica, 62(3), 539-591.
Wagstaff, A., Lindelow, M., Jun, G., Ling, X. & Juncheng, Q. 2009. Extending health insurance to
the rural population: An impact evaluation of China’s new cooperative medical scheme. Journal of
Health Economics, 28(1), 1-19.
Wiedmaier-Pfister, M. & McCord, M.J. 2009. Feasibility study on support to the microinsurance
sector in Ghana with a financial systems approach. Accra: National Insurance Commission of
Ghana.
Wooldridge, J.M. 2002. Econometric analysis of cross section and Panel data. London: MIT Press.
Stellenbosch University https://scholar.sun.ac.za

84
CHAPTER 5
EXPLORING THE EFFECT OF MICROINSURANCE ON ASSET
INEQUALITY AMONG HOUSEHOLDS IN GHANA37
5.1. INTRODUCTION
Unexpected events such as accidents and death can force certain households to dispose of
essential assets to cope. By insuring households against future welfare losses, microinsurance
helps in the reduction of asset loss, vulnerability and poverty. The indemnity enjoyed by the
insured prevents the liquidation of essential assets at below market prices. This facilitates
household financial stability and the steady build-up of essential assets by families. The long-term
benefits of the avoidance of asset loss and financial stability are sustained poverty reduction and
reduction in asset inequality among low-income households. Asset loss, poverty and inequality go
hand in hand, but microinsurance can break a part of the cycle that ties them together.
However the issue of whether microinsurance can reduce asset inequality is relatively new to the
literature and evidence on it from the perspective of Africa is non-existent. Hence this study delves
into the trends of asset inequality among households in Ghana and determines whether
microinsurance schemes provided by the private sector and the government help to reduce asset
inequality. In particular we ask: can microinsurance be used to bridge the asset inequality gap
among households in Ghana?
The level of the global household wealth was estimated at US$222.7 trillion in 2012: if shared
equally, this translates into US$48 500 per adult of the 4.6 billion global adult population (Credit
Suisse, 2012). The distribution of this wealth, however, reveals incredible levels of inequalities
within and between countries. For instance, Switzerland has household wealth per adult of
US$470 000; Australia has US$350 000; Norway has US$330 000 while India, Ghana and Burundi
have US$4 250; US$2 009 and US$283 respectively (Credit Suisse, 2012). The continental
dynamics indicate that Africa is second to Latin America as the most inequitable region of the
globe. Indeed, six of the ten countries with the highest levels of inequalities are in Africa (AfDB,
2012a).
In Ghana the Food and Agricultural Organization (FAO, 2012) reports of (1) severe economic
inequalities and poverty in the three northern regions of the country, and (2) persistent employment
inequalities among male and female and across the rural-urban divide. These economic and
37
This paper has been published in the Journal of Developing Areas, Vol. 49, No. 2, 373-398, Spring 2015. An extract of this paper was presented at both the Social Sciences for Development Conference, October, 30-31, 2013, University of Stellenbosch, Cape Town, and the 2013 Global Development Finance Conference, November 5-7, 2013, President Hotel, Cape Town, South Africa.
Stellenbosch University https://scholar.sun.ac.za
85
employment inequalities impede the efforts of individuals and households in accumulating private
assets. Van de Poel et al. (2008) provide evidence from a socio-economic inequality study
involving 47 developing countries that a “queuing effect” exists in Ghana’s socio-economic
inequality since the upper class are better off while the bottom class is expected to wait for a
“trickle-down” effect. Similarly, the most recent living standard survey (GLSS 5) conducted by the
Ghana Statistical Service indicates wide inequalities in per capita consumption expenditure. The
highest quintile has an average per capita expenditure of about GHS1 261 (US$1 261)38. This is
nine and half times higher than the per capita expenditure of households in the lowest quintile
(GHS132.00 or US$132.00) and about two times more than the national average of GHS644.00
(US$644.00).
The findings of this study will not only guide the government on how to reduce these inequalities,
but it will also fulfil the urgent need in the literature about the effect of microinsurance on asset
inequality. It will also influence the National Insurance Commission’s (NIC) policy on the
microinsurance industry.
Another unique feature of this study is its focus on asset inequality instead of income inequality as
a welfare measure. There is a debate (e.g. see Harttgen et al., 2013) about whether assets are a
better measure of welfare than income and consumption expenditures. Several studies (see e.g.
Moser & Felton, 2007; McKenzie, 2004) claim that household assets are practically more accurate
and consistent in measuring poverty because assets do not suffer from the issues of recall bias,
mis-measurement, and households’ reluctance to divulge sensitive information regarding income
and consumption expenditures.
However, Harttgen et al. (2013) argued that assets are not good proxies for trends in income or
consumption and hence cannot be used to gauge poverty levels or economic improvement. We
add a new dimension to this debate by focusing on asset inequality instead of asset poverty or
income poverty. Also most studies do not analyse how government policy interventions have
influenced the observed levels of inequalities. In this study we employed the Gini coefficient to
estimate asset inequality and then proceed to determine whether both the government and private
microinsurance schemes have had a reducing effect on levels of asset inequalities among low-
income households.
The rest of this chapter is organized as follows: Section 5.1 provides a brief review of the relevant
literature; an overview of poverty and inequalities situation in Ghana is captured in section 5.2; an
overview of the microinsurance sector is presented in section 5.3; the methodology is outlined in
38
Based on the 2007 exchange rate between Ghana and the United States of America.
Stellenbosch University https://scholar.sun.ac.za

86
section 5.4; the results are presented in section 5.5 and the conclusion are presented in section
5.6.
5.2. LITERATURE REVIEW
Ray (1998) explains inequality as a fundamental disparity which allows a person access to certain
opportunities and material choice, but deny another person those very same opportunities. Asset
inequality is a disparity in wealth and living standards across groups of people. It is the
accumulation of more private assets and or access to more public assets by certain households
while the capacity of others to own such assets is limited by socio-economic circumstances. An
uninsurable risk is one major situation that can weaken the capacity of individuals to build a stock
of assets, necessary for closing the asset inequality gap. In the absence of insurance, risk as
pointed out by Smith (1997:5) “may limit the ability of households to hold onto their previously
accumulated wealth”.
An insurance cover facilitates asset retention and may equip individuals and economic entities to
overcome asset disparities in a gradual manner. The following conceptual framework sheds light
on how insurance can influence asset inequality among households. As illustrated in Figure 5.1,
both insured and uninsured households are assumed to have begun from the same level towards
the desired equality benchmark. After years of acquiring assets through either savings or bank
credit, both households are assumed to have suffered from a risky event such as fire. With the aid
of the insurance cover, the insured is restored to his original position just as it was before the fire.
The assets of the uninsured are however lost to the fire, due to lack of insurance cover, and his
position is possibly made worse since he may have to sell some more assets to resettle and return
to normalcy. This tends to widen the asset build-up gap between the insured and uninsured and
their inequality levels in relation to the equality benchmark. The end effect is that the insurance
policy helps the insured to prevent asset loss and hence reduce the asset inequality gap in relation
to the equality benchmark while the inequality gap of the uninsured almost always widens.
Stellenbosch University https://scholar.sun.ac.za
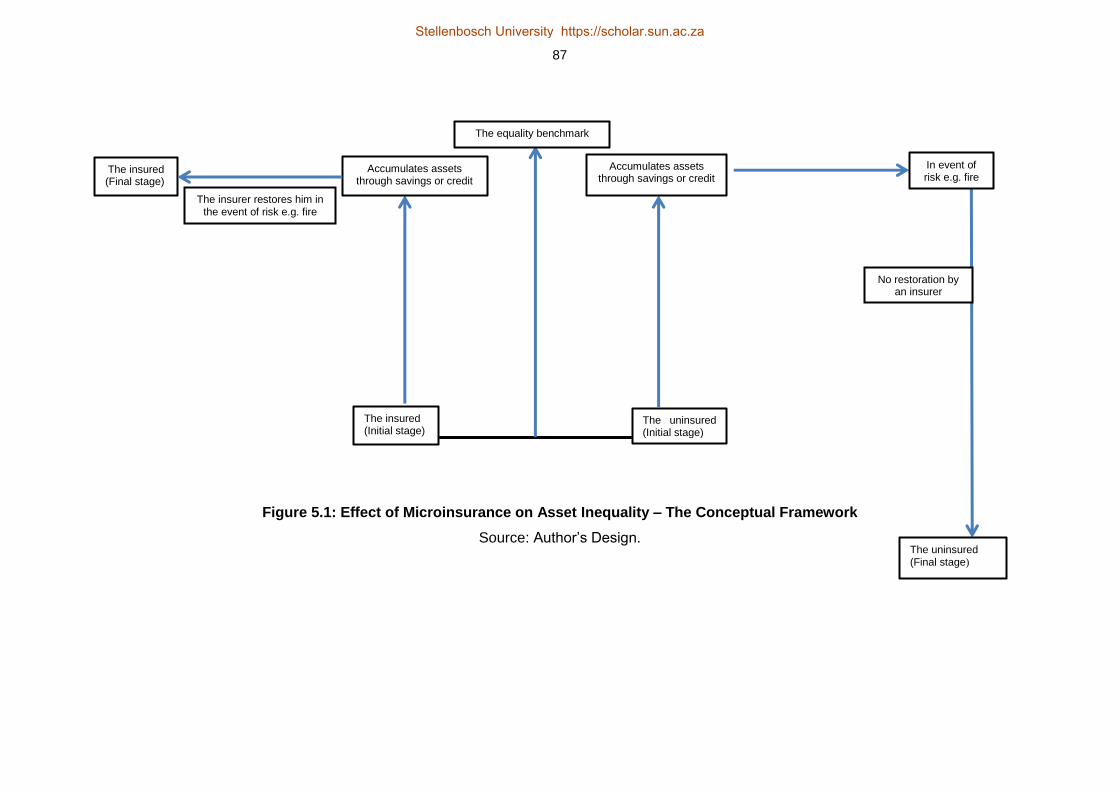
87
Figure 5.1: Effect of Microinsurance on Asset Inequality – The Conceptual Framework
Source: Author’s Design.
The insured (Initial stage)
The uninsured (Initial stage)
The equality benchmark
Accumulates assets through savings or credit
Accumulates assets through savings or credit
The insurer restores him in the event of risk e.g. fire
The insured (Final stage)
In event of risk e.g. fire
No restoration by an insurer
The uninsured (Final stage)
Stellenbosch University https://scholar.sun.ac.za
Stellenbosch University https://scholar.sun.ac.za

88
This phenomenon regarding the effect of microinsurance on asset inequality is relatively new to the
literature, hence empirical evidence on it is non-existent. The available literature, which is mainly
focused on health insurance, is also diverse and inconclusive. A priori insurance may influence the
levels of socio-economic inequalities among groups and across space. In particular employment
fringe benefits related to health and accident insurance, which are most likely to favour skilled
employees (the majority of whom are already in the high income bracket), may widen or sustain
the inequality gap among groups of people (Burkhauser & Simon, 2010). However, insurance can
close the inequality gap if tax laws require employers to pay equal insurance fringe benefits to
employees regardless of the differences in their basic salaries (Burkhauser & Simon, 2010). Thus,
insurance can have a double-edged sword effect on economic inequalities among groups of
people.
Studies on the welfare impact of insurance programs have yielded mixed results. For instance, Wu
et al. (2004) investigated the impacts of welfare insurance programs on rural and urban inequalities
in the United States of America. The authors employed the Atkinson welfare index, the Gini index,
the coefficient of income variation and the relative mean deviation of income as well as panel
regression techniques for their analysis. Their findings indicate among others that whereas
disability insurance has a statistically significant reducing impact on both pre-tax and post-tax
income inequality, unemployment insurance and supplementary social insurance do not reduce
income inequality in both the pre-tax and post-tax regimes. This mixed result may be a pointer that
even within the same national borders different insurance interventions depending upon their
designs and the status of the recipients could have declining or no effect at all on income
inequalities.
Another set of mixed results was provided by Levy (2006) in a study of how wage disparities
respond to health insurance in the USA. The finding indicates a declining effect of health insurance
on the gender-wage differential, but a negligible impact on the race-wage disparity.
The European evidence is as diverse and inconclusive as the American experience. For instance,
in a household study of five European countries Jones et al. (2004) show that private health
insurance leads to inequity in the use of specialist medical personnel. However Van Doorslaer et
al. (2002) produce opposing findings by showing that the rate of “pro-rich” inequity declines if
private insurance usage is controlled for. The findings of Van Doorslaer et al. (2002) and Jones et
al. (2004) are at variance as far as the effect of private health insurance on health inequality is
concerned.
Other studies have shown that insurance can reduce socio-economic inequalities. Burkhauser and
Simon (2010) report that employer health insurance reduces income inequality among American
Stellenbosch University https://scholar.sun.ac.za
89
households. They further show that the government social health insurance schemes – Medicaid
and Medicare – also decrease inequalities very substantially.
The study by Burkhauser and Simon (2010) lends support to an earlier work on the Canadian
welfare insurance done by Erksoy et al. (1995) and Countryman (1999). Erksoy et al. (1995)
observe that tight restriction on access to unemployment insurance leads to an increase in income
equality. Countryman (1999) combined the Gini coefficient, the mean logarithmic deviation and the
Atkinson measure to investigate the effect of unemployment insurance on income inequality
among households across the provinces of Canada. He reports that unemployment insurance
reduces income inequality among households across all the provinces, an indication that
unemployment insurance is an equality enhancing scheme, especially for low-income households.
His findings also point to significant distributional benefits from unemployment insurance.
At the aggregate level, asset and income inequalities have been found to be a catalyst for socio-
political unrest, macroeconomic instability and the stagnation of economic growth (see e.g.
Benabou, 1996; Alesina & Rodrik, 1994; Persson & Tabellini, 1994). Birdsall and Londono (1997)
investigated the effects of asset inequalities on poverty alleviation and economic growth of Latin
America countries. In summary their findings show: (1) incomes of the very poor are highly
sensitive to economic growth; (2) asset accumulation is the major determinant of growth in the
income of the poor; (3) land and human capital inequalities have more severe adverse effects on
the poor than on the rest of the population; (4) the initial threshold of asset and human capital
inequalities impact subsequent economic growth negatively; and (5) income inequality has an
inverse relationship with economic growth and this relationship mirrors the dynamics of asset
accumulation and ownership in various Latin America countries.
5.3. OVERVIEW OF POVERTY AND INEQUALITY TRENDS IN GHANA
Ghana is one of the fastest growing economies on the Africa continent and has since 2003 been
growing faster than the average growth rate of both West Africa and the entire continent (AfDB,
2012b). This has resulted in the reduction of poverty from 51.7 percent in 1991 to 24.2 percent in
2013 (GSS, 2014). Indeed, her poverty reduction rates have been acclaimed as one of the best in
the West Africa sub-region (IFAD, 2012). In spite of this progress, poverty is still widespread in
Ghana, although not evenly dispersed. Recent estimates indicate that about 37.9 percent of rural
and 10.6 percent of urban population live below the poverty line (UNDP, 2011; GSS, 2014).
Closely associated with the level of poverty are income, wealth, health and asset inequalities
between genders and across geographical areas.
The report of the 5th Ghana living standard survey (GLSS V) indicates improved health outcomes
among Ghanaians. This has translated into the country recording one of the highest life
Stellenbosch University https://scholar.sun.ac.za

90
expectancies in sub-Saharan Africa. The life expectancy of Ghana has witnessed a consistent
increase from 46 years in 1960 to 64 years in 2011, as against the average of 56 years for sub-
Saharan Africa (World Bank, 2011). Health expenditure per capita at purchasing power parity has
also doubled from US$42 in 1995 to US$90 in 2011 (World Bank, 2011). Nevertheless, there are
wide disparities in health outcomes. For instance, in Accra – the capital city – the percentage of
children below the age of 1 year who had not been vaccinated was zero while in the rural forest
and rural savannah the non-vaccination rates were 6.4 percent and 10.8 percent respectively
(GSS, 2008).
The gap between rural-urban health indicators is even more disturbing in the distribution of
sanitation and water facilities, as shown in Table 5.1. The rural areas have much less access to
quality sanitation and water facilities and are thus prone to cholera and water-borne diseases.
Since 1990 the average sanitation facilities in the urban dwellings has consistently been two and
three times more than the national and rural average access respectively. Despite the wide
inequalities, the water sub-sector has received much investment, leading to 122 percentage
improvement in the rural areas in the last two decades.
Table 5.1: Access to Sanitation and Water Facilities from 1990-2010, Ghana
Years Improved Sanitation Facilities Improved Water Facilities
Rurala Urban
b Total
c Rural
a Urban
b Total
c
1990 4 12 7 36 84 53
1991 4 12 7 38 84 55
1992 4 13 7 40 84 57
1993 4 13 7 43 85 59
1994 5 13 8 45 85 61
1995 5 14 9 47 85 62
1996 5 14 9 49 86 64
1997 5 14 9 51 86 66
1998 5 15 9 53 87 67
1999 6 15 10 56 87 71
2000 6 16 10 58 87 71
2001 6 16 10 60 88 73
2002 6 16 11 62 88 74
2003 7 17 12 64 88 75
2004 7 17 12 66 89 77
2005 7 17 12 69 89 79
2006 7 18 12 71 89 80
2007 7 18 12 73 90 81
2008 8 19 13 75 90 82
2009 8 19 14 77 91 84
2010 8 19 14 80 91 86
Notes: a
= % of rural population with access; b = % of urban population with access and
c = % of the total
population with access.
Source: Author’s construction based on the data of World Development Indicators, 2011.
Stellenbosch University https://scholar.sun.ac.za
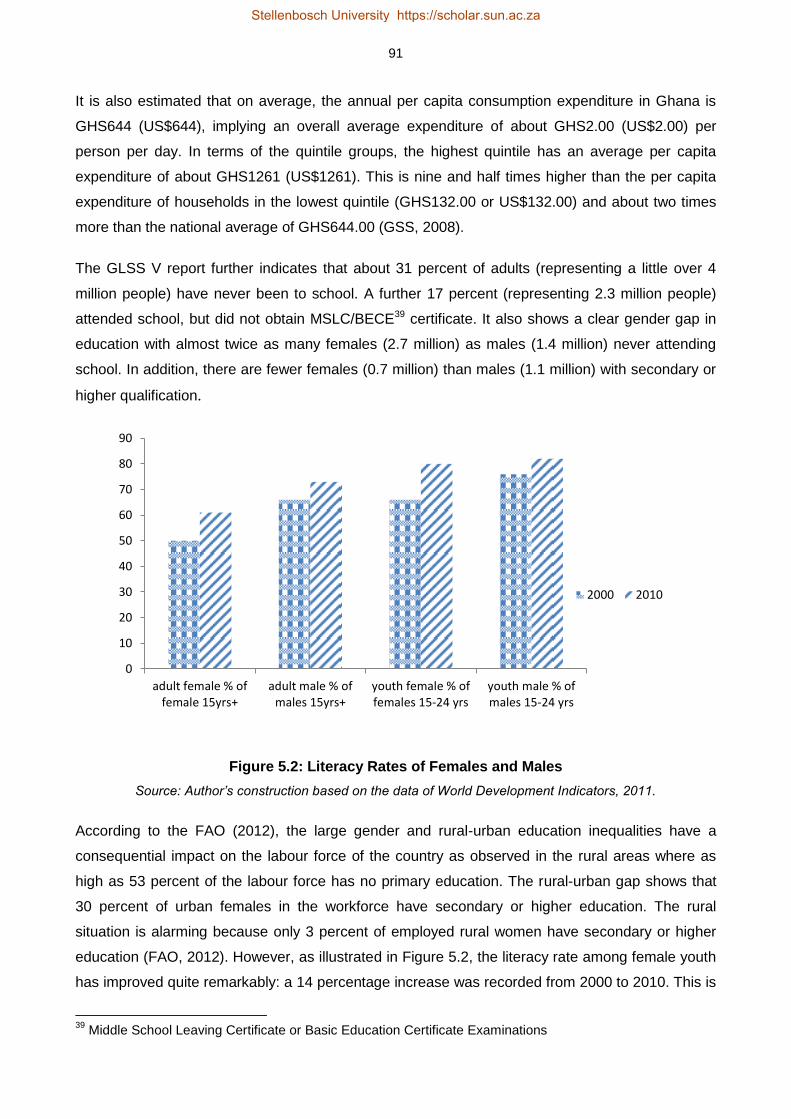
91
It is also estimated that on average, the annual per capita consumption expenditure in Ghana is
GHS644 (US$644), implying an overall average expenditure of about GHS2.00 (US$2.00) per
person per day. In terms of the quintile groups, the highest quintile has an average per capita
expenditure of about GHS1261 (US$1261). This is nine and half times higher than the per capita
expenditure of households in the lowest quintile (GHS132.00 or US$132.00) and about two times
more than the national average of GHS644.00 (GSS, 2008).
The GLSS V report further indicates that about 31 percent of adults (representing a little over 4
million people) have never been to school. A further 17 percent (representing 2.3 million people)
attended school, but did not obtain MSLC/BECE39 certificate. It also shows a clear gender gap in
education with almost twice as many females (2.7 million) as males (1.4 million) never attending
school. In addition, there are fewer females (0.7 million) than males (1.1 million) with secondary or
higher qualification.
Figure 5.2: Literacy Rates of Females and Males
Source: Author’s construction based on the data of World Development Indicators, 2011.
According to the FAO (2012), the large gender and rural-urban education inequalities have a
consequential impact on the labour force of the country as observed in the rural areas where as
high as 53 percent of the labour force has no primary education. The rural-urban gap shows that
30 percent of urban females in the workforce have secondary or higher education. The rural
situation is alarming because only 3 percent of employed rural women have secondary or higher
education (FAO, 2012). However, as illustrated in Figure 5.2, the literacy rate among female youth
has improved quite remarkably: a 14 percentage increase was recorded from 2000 to 2010. This is
39
Middle School Leaving Certificate or Basic Education Certificate Examinations
0
10
20
30
40
50
60
70
80
90
adult female % offemale 15yrs+
adult male % ofmales 15yrs+
youth female % offemales 15-24 yrs
youth male % ofmales 15-24 yrs
2000 2010
Stellenbosch University https://scholar.sun.ac.za

92
more than twice the 6 percent literacy growth of the male youth for the same period (World Bank,
2011). A similar trend is observed for the female and male adults presented in Figure 5.2.
The efforts made in the last decade to improve access to education, especially through free
primary education, free distribution of school uniforms and books, and capitation grants (free meals
for pupils) policies should be expanded to cover many more rural areas. This will not only bridge
the inequality gap, but also develop a skilled labour force with enhanced entrepreneurial abilities to
create and/or access better employment opportunities. This will equip them to break the grip of
poverty and achieve sustainable prosperity.
5.4. BRIEF OVERVIEW OF THE MICROINSURANCE INDUSTRY IN GHANA
The microinsurance market in Ghana, although in a nascent stage has witnessed impressive
growth in the number of firms, policyholders and underwriting activities. For example, as at the end
of 2011, the market had about 1 259 055 microinsurance policyholders, contributed about
GHS11 703 488 (US$6 087 473) in premiums and claims of GHS4 421 494 (US$2 299 803) have
been paid (Buabeng & Gruijters, 2012). The microinsurance firms in Ghana are
subsidiaries/agencies of commercial insurance companies. They provide both life and non-life
products such as personal life cover, family life cover, accident cover, fire cover, employer life
cover, funeral, medical cover, property, education insurance and savings-linked insurance.
The distribution, premium collections and claims processing and payments are done by the
commercial insurers in partnership with rural banks and microfinance institutions located in both
the urban and rural areas of the country. What distinguishes these insurance services offered to
the informal sector from those of the formal sector are the distribution channels and the structure of
the premium payments. For instance, the premium payments are tailor-made to meet the seasonal
cash flow of informal sector workers. The clients are sometimes allowed to pay premiums at
irregular times and in uneven amounts (Tan, 2012). The insurers have agents who go to the
market centres (or place of work) and homes of policyholders almost every week to collect the
premiums. The claims processes are less complicated and are normally determined within 7 days
and paid within 10 days of receipt (NIC, 2011). The flexibility in the distribution and the premium
payments as well as the expeditious processing of claims is the backbone for the extension of
insurance to low-income households.
However the growth of the microinsurance industry is challenged by low levels of financial literacy,
lack of trust in insurers and the notion that risky events are by providence (Finmark Trust, 2010).
The industry is regulated by the same laws meant for the “formal” insurance industry. This law –
the Insurance Act, 2006 (Act 724) – according to the insurance regulatory body40, has significant
40
The regulatory body of the Ghanaian insurance industry is the National Insurance Commission (NIC).
Stellenbosch University https://scholar.sun.ac.za
93
gaps and is not abreast with the current issues in the industry (NIC, 2011). Since microinsurance is
unique, with sector-specific features, and has new emerging characteristics (such as the bundling
of premium payments with airtime), its regulation by the “formal” insurance laws may impede its
rapid expansion. It is however noteworthy that the NIC has initiated steps to address some of these
challenges.
On the other hand the national health insurance is provided by the National Health Insurance
Authority (NHIA). It started operations in 2003 as part of the government social intervention
program to increase access to health care by eliminating medical payment at the point of delivery.
It operates through 145 municipal and district mutual health insurance schemes. Each district
distributes its scheme at designated places in rural and urban areas through registered agents and
scheme officers who call at homes and work places to register and collect premiums from
policyholders. It has over 5 000 service providers which are drawn from public and private
hospitals, clinics and pharmacies. For beneficiaries to access health care they are required to
follow the “gate-keeper system”, that is, first report to a primary care facility, and subsequently to
the second and third levels of care by way of referral (NHIA, 2010).
Formal sector workers pay compulsory monthly premiums to NHIA through their social security
contributions which entitle them to the service of the health insurance scheme. Informal sector
workers are however not bound to join the scheme. They do so voluntarily after paying the required
premiums which range from GHS12 to GHS15 (US$8 to US$10) per person yearly. Currently,
about 66 percent of the population has signed up for the scheme, of which 4.5 million are from the
informal sector. It covers about 95 percent of health conditions in the country and has been
recognized as a reliable social intervention policy for financing health care. It has increased access
to professional medical care and skilled birth attendance, and protects policyholders, especially
low-income households, against emergency borrowing to meet out-of-pocket expenditures. With
increasing coverage, health services utilization has also grown, averaging two visits per head per
year for insured persons, compared to the national level estimated at 0.5 visits (Matul et al., 2010).
5.5. THE METHODOLOGY
5.5.1. The Data
The 2010 FINSCOPE national household survey on Ghana is used in the current study for the
assessment of the influence of microinsurance policies on asset inequality among low-income
households. The dataset contains rich information on 3 643 households’ demographics, human
capital conditions, income and asset distributions, gender characteristics, rural-urban and regional
dynamics, financial literacy and access to financial services, risk coping strategies among
households, and remittances.
Stellenbosch University https://scholar.sun.ac.za
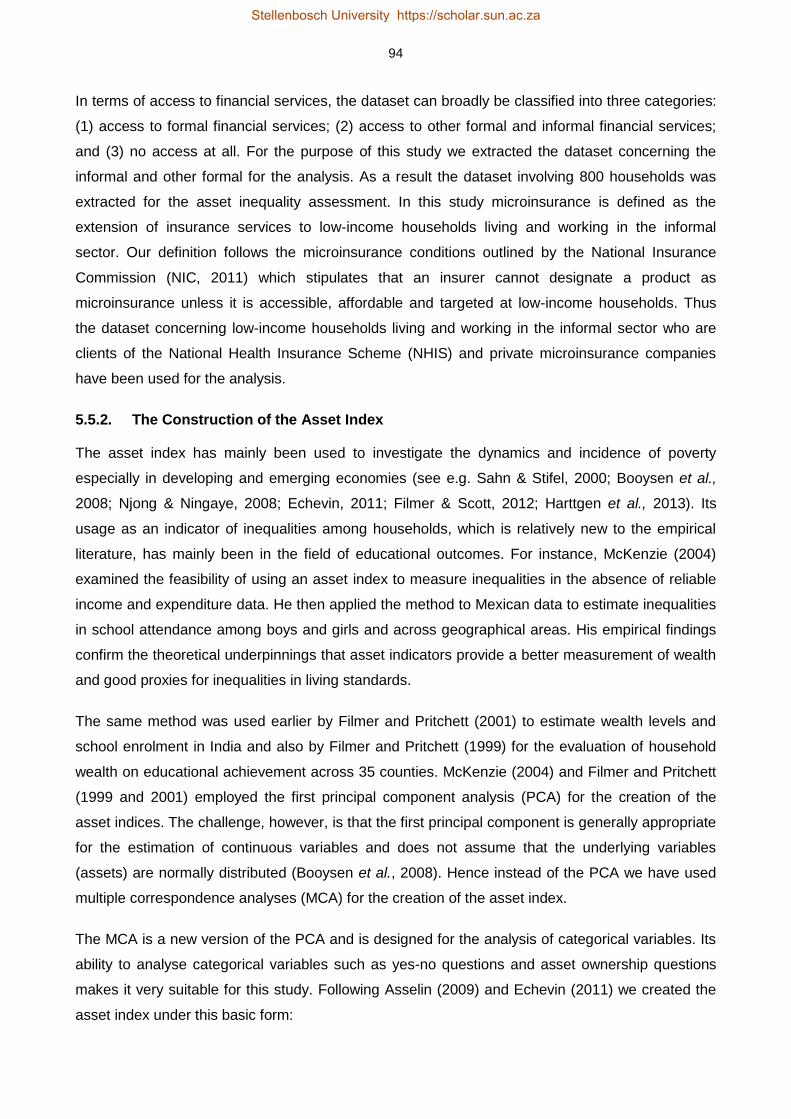
94
In terms of access to financial services, the dataset can broadly be classified into three categories:
(1) access to formal financial services; (2) access to other formal and informal financial services;
and (3) no access at all. For the purpose of this study we extracted the dataset concerning the
informal and other formal for the analysis. As a result the dataset involving 800 households was
extracted for the asset inequality assessment. In this study microinsurance is defined as the
extension of insurance services to low-income households living and working in the informal
sector. Our definition follows the microinsurance conditions outlined by the National Insurance
Commission (NIC, 2011) which stipulates that an insurer cannot designate a product as
microinsurance unless it is accessible, affordable and targeted at low-income households. Thus
the dataset concerning low-income households living and working in the informal sector who are
clients of the National Health Insurance Scheme (NHIS) and private microinsurance companies
have been used for the analysis.
5.5.2. The Construction of the Asset Index
The asset index has mainly been used to investigate the dynamics and incidence of poverty
especially in developing and emerging economies (see e.g. Sahn & Stifel, 2000; Booysen et al.,
2008; Njong & Ningaye, 2008; Echevin, 2011; Filmer & Scott, 2012; Harttgen et al., 2013). Its
usage as an indicator of inequalities among households, which is relatively new to the empirical
literature, has mainly been in the field of educational outcomes. For instance, McKenzie (2004)
examined the feasibility of using an asset index to measure inequalities in the absence of reliable
income and expenditure data. He then applied the method to Mexican data to estimate inequalities
in school attendance among boys and girls and across geographical areas. His empirical findings
confirm the theoretical underpinnings that asset indicators provide a better measurement of wealth
and good proxies for inequalities in living standards.
The same method was used earlier by Filmer and Pritchett (2001) to estimate wealth levels and
school enrolment in India and also by Filmer and Pritchett (1999) for the evaluation of household
wealth on educational achievement across 35 counties. McKenzie (2004) and Filmer and Pritchett
(1999 and 2001) employed the first principal component analysis (PCA) for the creation of the
asset indices. The challenge, however, is that the first principal component is generally appropriate
for the estimation of continuous variables and does not assume that the underlying variables
(assets) are normally distributed (Booysen et al., 2008). Hence instead of the PCA we have used
multiple correspondence analyses (MCA) for the creation of the asset index.
The MCA is a new version of the PCA and is designed for the analysis of categorical variables. Its
ability to analyse categorical variables such as yes-no questions and asset ownership questions
makes it very suitable for this study. Following Asselin (2009) and Echevin (2011) we created the
asset index under this basic form:
Stellenbosch University https://scholar.sun.ac.za

95
𝑎𝑖 = ∑ 𝐹1𝑘𝑘𝑘=1 𝑑𝑘𝑖 5.1
The ith household asset index is αi, dki is the kth value of the categorical variables (with k=1… K)
indicating the household’s asset variables included in the index construction, and F1k is the MCA
weights generated for the analysis. The asset index comprises twelve (12) private households’
assets ranging from ownership of television or radio to refrigerator and two public utilities, access
to water and electricity.
Stellenbosch University https://scholar.sun.ac.za

96
Table 5.2: Weights Generated from the MCA41
Variables Categories Weights
Private Assets
Mobile Phone Owns a mobile phone 0.2020
Does not own a mobile phone -2.7910
Microwave Owns a microwave 2.1460
Does not own a microwave -0.4130
TV Owns a TV 0.6200
Does not own a TV -1.2250
Refrigerator Owns a refrigerator 1.1060
Does not own a fridge -1.2630
Kitchen condition Has built-in sink 2.0060
No built-in sink -0.5100
Radio Owns a radio 0.1960
Does not own a radio -1.2260
DVD Player Owns a DVD player 0.9320
Does not own a DVD player -1.7690
Motor Cycle Owns a motor cycle 0.1620
Does not own a motor cycle -0.0130
Cooking fuel Electricity 1.8000
LPG gas 1.3260
Kerosene 1.1100
Charcoal/wood -2.6800
Others -0.1060
Tractor Owns a tractor 2.0090
Does not own a tractor -0.0150
Toilet Flush toilet 1.4660
Pit latrine -1.2620
Bush/beach/open field -2.0520
Others -0.8530
House Ownership Rented 0.3980
Family owned -0.3190
Occupied without payment 0.0780
Others 0.2290
Public Facilities
Electricity Has electricity 0.4730
Does not have electricity -2.7490
Water Source Piped into house 1.9310
Well in house 0.7320
Public pipe -2.6250
Public well -1.7380
Surface water -14.240
Others -0.8530
Source: Author’s coputation based on the 2010 FINSCOPE data of Ghana.
The use of household assets instead of income or expenditure to measure welfare levels has been
argued to be more theoretically appropriate and empirically reliable. For development reasons the
asset index may capture wealth inequalities much better than income or expenditure inequalities.
Practically data about households’ income face challenges in accuracy and measurement (Moser
& Felton, 2007) due to recall bias, mis-measurement and the seasonal flow of income of most
informal sector workers (McKenzie, 2004). In addition income of informal workers may be highly
41
Since it is not possible to get negative asset (wealth), the negative asset index values were converted into positive values by adding a common value (2.8) across both the negative and positive asset index values.
Stellenbosch University https://scholar.sun.ac.za

97
variable and lumpy thus less reliable for measuring wealth inequality than workers in the formal
sector receiving regular income (Moser & Felton, 2007).
Using an asset index to measure welfare resolves the measurement limitations, recall bias and
households reluctance to divulge sensitive information concerning their income or expenditure
levels. For instance it is much easier for households to respond to yes–no questions concerning
whether the household owns a radio or, has electricity, toilet, piped water etc., than to divulge
information about sources and level of income or to recall consumption expenditure incurred over
the previous month (McKenzie, 2004).
In addition, assets are less volatile than income and consumption expenditure and hence short to
medium-term economic changes in households’ conditions may not alter their asset levels
substantially (Booysen et al., 2008). The build-up of assets takes longer time and therefore
provides better insight into the long-term living standards of households than income and
consumption expenditure (Moser & Felton, 2007). The theoretical underpinnings of using wealth
levels or asset-based indicators to estimate physical and human capital investment and economic
growth has also been proven in studies such as Birdsall and Londono (1997), Banerjee and
Newman (1993), Galor and Zeira (1993), Bardhan et al. (1999) and McKenzie (2004).
5.5.3. The Asset Inequality Estimations through the Gini Coefficient
After the creation of the asset index through the MCA, the Gini coefficient was then used to
estimate the asset inequality across gender and the rural-urban parity in all ten regions of Ghana.
The calculation of the asset Gini follows the procedure for estimating the income Gini. The Gini
index is used to calculate inequality levels among groups of people regarding the distribution of
income, wealth, assets, land, education, food consumption, health and social class. It is calculated
from a particular Lorenz curve (Farris, 2010) and hence is expressed visually in Figure 5.3 as the
area between the Lorenz curve and the line of perfect equality, divided by the total area under the
line of perfect equality (McKay, 2002). From the following Lorenz curve, the basic Gini co-efficient
formula is given as:
𝐺 =𝐴
(𝐴+𝐵), where (𝐴 + 𝐵) = 0.5, hence, 𝐺 = 2𝐴 = 1 − 2𝐵, 5.2
In the absence of a Lorenz curve, equation (5.3) can be used to determine the Gini inequality index
(Damgaard, 2000).
L(y) = ∫ 𝑥
𝑦0 𝑑𝐹(𝑥)
𝜇 5.3
Stellenbosch University https://scholar.sun.ac.za
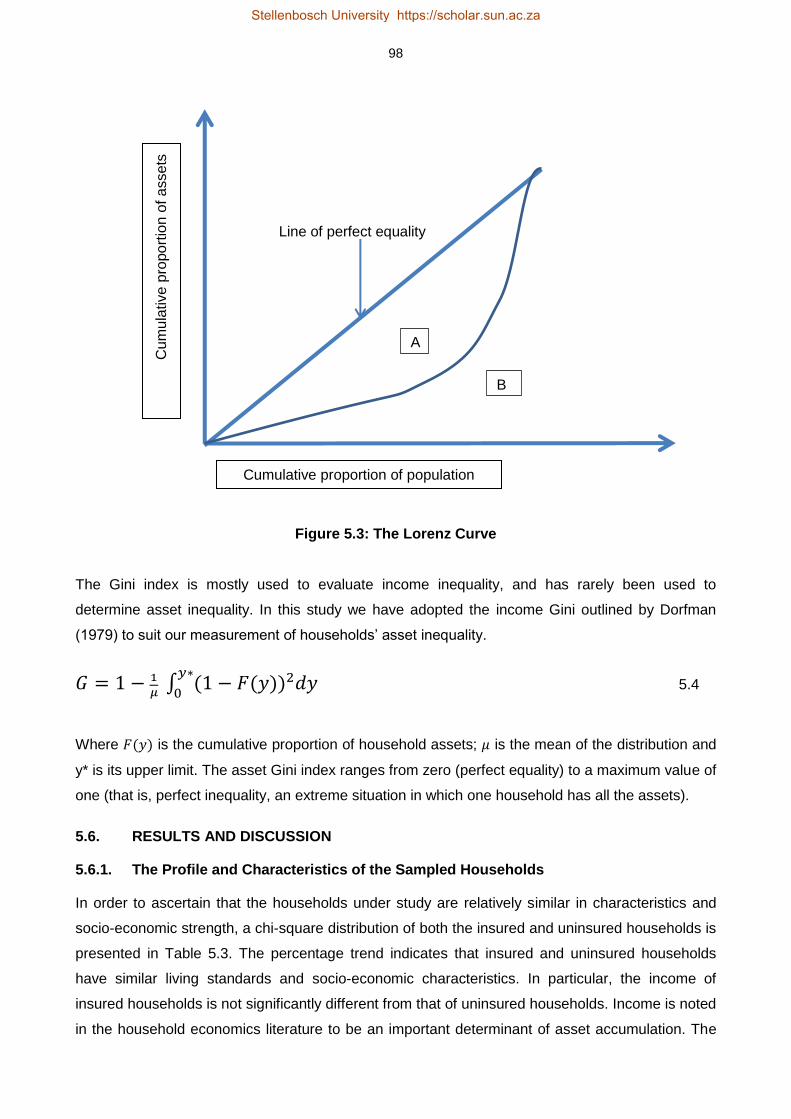
98
Line of perfect equality
Figure 5.3: The Lorenz Curve
The Gini index is mostly used to evaluate income inequality, and has rarely been used to
determine asset inequality. In this study we have adopted the income Gini outlined by Dorfman
(1979) to suit our measurement of households’ asset inequality.
𝐺 = 1 − 1
𝜇 ∫ (1 − 𝐹(𝑦))2𝑑𝑦
𝑦∗
0 5.4
Where 𝐹(𝑦) is the cumulative proportion of household assets; 𝜇 is the mean of the distribution and
y* is its upper limit. The asset Gini index ranges from zero (perfect equality) to a maximum value of
one (that is, perfect inequality, an extreme situation in which one household has all the assets).
5.6. RESULTS AND DISCUSSION
5.6.1. The Profile and Characteristics of the Sampled Households
In order to ascertain that the households under study are relatively similar in characteristics and
socio-economic strength, a chi-square distribution of both the insured and uninsured households is
presented in Table 5.3. The percentage trend indicates that insured and uninsured households
have similar living standards and socio-economic characteristics. In particular, the income of
insured households is not significantly different from that of uninsured households. Income is noted
in the household economics literature to be an important determinant of asset accumulation. The
A
B
Cumulative proportion of population
Cu
mu
lative p
ropo
rtio
n o
f a
ssets
Stellenbosch University https://scholar.sun.ac.za

99
chi-square test indicates that the income of uninsured households does not differ from that of the
insured. To the extent that income is not statistically significant, asset inequality between the two
groups of households may not be influenced by income.
Table 5.3: Chi-Square Test on the Profile of Insured and Uninsured Households
Variable Uninsured HH (%)C Insured HH (%)
C Chi-Square (χ
2.050)
Resp. AgeT (mean years) 38.02 39.81 -1.7918 (0.0652)
T
Resp. Gender 0.1014 (0.750)
Male 47.13 48.40
Female 52.87 51.60
Resp. Marital Status 2.2049 (0.138)
Married 51.65 57.57
Others 48.35 42.43
Resp. Education Level 8.4240 (0.015)**
No formal Education 13.17 7.78
Primary Education 45.27 40.96
Secondary and above 41.56 51.26
Household Income 0.4930 (0.782)
0 – GHS400 69.31 66.36
GHS401 – GHS1000 24.87 26.97
Above GHS1000 5.82 6.67
HH SizeT (mean size) 3.41 4.00 -0.586 (0.0034)***
T
House Ownership 0.2135 (0.899)
Rented 32.79 34.47
Family Owned 48.36 46.80
Occupied without payment 18.85 18.72
Location 0.0023 (0.962)
Urban 68.44 68.26
Rural 31.56 31.74
Economic Activity 0.3053 (0.581)
Farming Enterprise 29.92 31.96
Non-Farming Enterprises 70.08 68.04
Proximity to Financial Inst 0.1176 (0.732)
10 – 30 minute walk 69.23 67.62
Above 30 minute walk 30.77 32.38
Access to Credit 5.1651 (0.023)**
Never borrowed 54.51 45.43
Have borrowed 45.49 54.57
Remittances 7.4542 (0.006)***
Do not Receive Remittance 52.92 63.68
Receives Remittances 47.08 36.32
Note: *** and ** indicate 1 and 5 percent significance levels respectively; C indicates that the addition for each variable
is by columns; T indicates T-test instead of Chi-square.
Source: Author’s computation based on the 2010 Finscope Data of Ghana
Stellenbosch University https://scholar.sun.ac.za
100
5.6.2. Tests for Selection Bias
The demand for microinsurance can be influenced by selection bias such as self-selection,
endogeneity and program placement bias. Without controlling for these, the actual effect of
microinsurance on any welfare indicator can be blurred. To account for selection bias, we run a
Heckman selection model to determine whether our sample population suffers from selection bias.
The Heckman model uses a two-stage estimation procedure to test and control for selection bias
(Heckman, 1979). In the first stage a probit model is estimated to capture the determinants of
microinsurance uptake. The estimated parameters of the probit model are then used to calculate
the inverse Mills ratio, which is used as an additional explanatory variable in the second stage
equation (Lin, 2007; Janzen & Carter, 2013). The results indicate that selection bias as captured by
the inverse Mills ratio is not statistically significant, which is an indication that our sample
population does not suffer from selection bias. The result of the test is presented in Table B.1 in
Appendix B.
5.6.3. Asset Inequality
We used the Lorenz curve to graph the level of asset inequality among low-income households
across the ten regions of Ghana. It indicates that the poorest 10 percent of the population have 2
percent of the total household assets; the poorest 20 percent have 7 percent, while the richest 20
and 10 percent have 75 and 85 percent of the household assets respectively.
Figure 5.4: Lorenz Curve for Household Assets
Source: Drawn by author based on the 2010 FINSCOPE Data of Ghana.
0.2
.4.6
.81
Cum
ula
tive a
sse
t pro
po
rtio
n
0 .2 .4 .6 .8 1Cumulative population proportion
Stellenbosch University https://scholar.sun.ac.za

101
Table 5.4 summarizes the extent of asset inequality between gender and across localities. The
overall asset inequality is twice as high in rural areas as in urban settings. This sharp disparity
between the rural and urban divide is less profound in the gender ownership of assets. For
instance, the gender inequality gap in asset holdings in the urban centres is just 1 percentage
point, while that of rural males and females is at par. This seems to suggest that the enormous
asset inequality in Ghana has little to do with gender issues. The real differences are however
observed between genders across the rural-urban divide. For example, whereas male and female-
headed households in urban areas have relatively lower asset inequality rates of 13 and 14
percent respectively, asset inequality of their counterparts in the rural areas is twice high.
Surprisingly, male-headed households in rural areas have twice as much asset inequality as
female-headed households in urban areas.
Table 5.4: Asset Gini Coefficient
Urban 0.14 0.13 0.14
Rural 0.28 0.28 0.28
Source: Author’s computations based on 2010 FINSCOPE Data, Ghana.
Another useful way of understanding the large degrees of asset inequality is to draw a comparison
across the entire sampled population. Table 5.5 accomplishes this comparison by providing the
percentile distributions of the asset inequality across intra-genders. Considerable variations in
asset ownership exist between the bottom 10th percentile and the upper 10th percentile. Asset
ownership of male-headed households in the top 10th percentile is about four times higher than that
of the bottom 10th percentile, while female asset ownership in the top 10th percentile is more than
three times as large as the bottom 10th of the distribution.
The asset disparity is even more profound between the top and bottom distribution relative to the
median. For example, whereas the bottom 1 percentile deviates substantially from the median by
as much as 8 times, the top 1 percentile deviate from the median by just 1.5 times. The top and
bottom asset ownership disparities are enormous, with the top 1 percentile far outdistancing the
bottom 1 percentile by about 12 times.
Asset Inequality
Locality All Male Female
Stellenbosch University https://scholar.sun.ac.za

102
Table 5.5: Percentiles Distribution of Assets by Gender.
Asset Inequality
Percentiles All Male Female
1 0.37 0.37 0.39
5 0.91 0.91 0.91
10 1.22 1.14 1.25
25 2.15 2.15 2.11
50 2.96 2.98 2.96
75 3.54 3.45 3.57
90 4.05 3.99 4.17
95 4.25 4.25 4.25
99 4.33 4.33 4.34
Source: Author’s computations based on 2010 FINSCOPE Data, Ghana.
Table 5.6 also highlights the extent of disparities in rural and urban areas at selected percentiles of
the asset distribution. The bottom 10th percentile of urban households’ asset ownership is 2.10
while the corresponding asset ownership of rural dwellers is 0.78, indicating a very significant gap
of 132 percent. The observed intra-spatial (intra-urban and intra-rural) differences are even more
disturbing. The asset ownership gap between the bottom 10th and the upper 10th percentiles in the
urban areas is a remarkable 225 percent, which is an indication that the gap between the urban
non-poor and poor even among households in the informal sector is big and thus demands
concerted efforts to bring it under control. The story of the rural non-poor and poor is much worse
with the non-poor overwhelmingly outpacing the poor by 322 percent.
Table 5.6: Distribution of Assets, Rural-Urban Divide
Asset Inequality
Percentiles All Urban Rural
1 0.37 1.04 0.32
5 0.91 1.63 0.57
10 1.22 2.10 0.78
25 2.15 2.73 1.15
50 2.96 3.20 1.91
75 3.54 3.75 2.77
90 4.05 4.25 3.31
95 4.25 4.26 3.65
99 4.33 4.35 4.00
Source: Author’s computations based on 2010 FINSCOPE Data, Ghana.
Stellenbosch University https://scholar.sun.ac.za

103
5.6.4. The Effect of Microinsurance on Asset Inequality
This section advances the analysis by investigating the influence of microinsurance on the levels of
inequalities observed among low-income households. In particular, we determine whether
commercial microinsurance and the government health insurance products can lower asset
inequalities. The computed asset inequality is presented in Table 5.7. The first part42 of Table 5.7
deals with the influence of private microinsurance on asset inequality, while the second part refers
to the effect of the government-based microinsurance on asset inequality. Column 2 shows the
average asset Gini for gender, rural-urban divide and the ten administrative regions. Columns 3
and 4 reveal the asset Gini for the uninsured and the insured respectively; while column 5 presents
the differences between the asset Gini of the uninsured and the insured households.
The total asset inequality (column 2) indicates no gender disparity among low-income households
in asset holdings. This result suggests that among low-income households, female-headed
households do not lag behind their male counterparts in asset ownership. Unsurprisingly, the result
shows that rural households have twice as much asset inequality as urban households. This
finding confirms the empirics (see e.g. Ravallion et al., 2007; Booysen et al., 2008; Echevin, 2011;
Sahn & Stifel, 2003) that rural dwellers are unambiguously disadvantaged in terms of acquisition of
critical assets for welfare enhancement.
The regional trend indicates higher asset inequalities in Brong Ahafo, Upper East and West, with
the Northern region having the highest asset inequality which is three times greater than that of
Greater Accra region. Even among insured households, the trend observed in both Brong Ahafo
and Northern regions is unusual. They are the only regions where insured households’ asset
inequality is higher than both the regional averages and uninsured households. This unusual trend
is observed for Brong Ahafo region in both the government and private microinsurance schemes
and for Northern region in only the private schemes. The contextual issues of these regions may
be the possible reasons underlying these unusual observations. They have the largest land size in
Ghana. The geographical area of Northern and Brong Ahafo regions are 70 384 sq.km and 39 557
sq.km respectively (GSS, 2013), which translates into 46.1 percent of the total land size of Ghana.
Nevertheless, they are among the most least developed and poorest regions of the country, with
little access to amenities to needed for asset build-up. This may imply that insurance matters, but
in the absence of development or in the presence of development gaps which may limit asset
availability, insurance may not do much to bridge the inequality gap.
The Upper East region has the highest inequality gap between insured and uninsured households
under both schemes. The asset inequality of uninsured households in the region is 26 percent
42
The definitions of the columns in the first part of Table 7 apply to the second part.
Stellenbosch University https://scholar.sun.ac.za
104
greater than that of insured households under the private microinsurance schemes. A similar trend
of 16 percent is observed for the same region under the government scheme.
Stellenbosch University https://scholar.sun.ac.za

105
Table 5.7: Gini Coefficient of the Asset Index
Private Microinsurance Schemes Government Health Insurance Scheme
Variables Average Gini Uninsured Insured (UNI-INS)
Average Gini Uninsured Insured (UNI-INS)
Asset Gini 0.20 0.22 0.19 0.03 0.20 0.22 0.18 0.04 Gender Male 0.20 0.22 0.19 0.03 0.20 0.21 0.19 0.02 Female 0.20 0.22 0.18 0.04 0.20 0.22 0.17 0.05 Locality Urban 0.14 0.16 0.12 0.04 0.14 0.15 0.12 0.03 Rural 0.27 0.29 0.26 0.03 0.27 0.31 0.25 0.06 Regions Western 0.22 0.24 0.21 0.03 0.22 0.26 0.19 0.07 Central 0.20 0.24 0.17 0.07 0.20 0.24 0.15 0.09 Greater Accra 0.11 0.13 0.10 0.03 0.11 0.12 0.11 0.01 Volta 0.24 0.38 0.21 0.17 0.24 0.23 0.20 0.03 Eastern 0.19 0.25 0.16 0.09 0.19 0.27 0.16 0.11 Ashanti 0.13 0.14 0.13 0.01 0.13 0.15 0.13 0.02 Brong Ahafo 0.25 0.20 0.29 -0.09 0.25 0.25 0.29 -0.04 Northern 0.34 0.34 0.35 -0.01 0.34 0.39 0.30 0.09 Upper East 0.29 0.47 0.21 0.26 0.29 0.38 0.22 0.16 Upper West 0.25 0.32 0.25 0.07 0.25 0.38 0.25 0.13
Total 3.23 3.82 3.02 0.80 3.23 3.78 2.91 0.87
Note: UNI is Uninsured Households; INS is Insured Households.
Source: Author’s computations based on the 2010 FINSCOPE data of Ghana
Stellenbosch University https://scholar.sun.ac.za
Stellenbosch University https://scholar.sun.ac.za
106
A comparison between average asset Gini and insured households indicate a consistent lower
asset inequality among the insured across both genders, in the rural-urban setting and in eight of
the ten regions. The overall asset Gini of insured households (under the private microinsurance
schemes) is 21 percent less than the average asset Gini across all the variables. In contrast, the
Gini inequality among the uninsured households (column 3) is persistently higher than the average
asset inequality between genders and across all the geographical variables except in two regions.
Indeed the combined asset inequality of the uninsured households is 59 percent higher than the
average asset inequality across gender and locations. The asset inequality of uninsured female-
headed households is 4 percent higher than that of insured female-headed households. This trend
is also observed in the government schemes among insured female-headed households and
uninsured female-headed households. Similarly, the asset inequality of uninsured rural dwellers is
greater than that of insured rural dwellers by 3 percent and 6 percent under the private and
government schemes respectively.
The general influence of the government health insurance scheme in lowering asset inequality is
even more substantial than the private microinsurance. It has an asset inequality lower than the
average asset inequality by 31 percent, compared to 21 percent for the private microinsurance.
The regional breakdown indicates that, apart from Brong Ahafo, households with the government
health insurance scheme have asset inequality levels below or equal to the average asset
inequality index. With regard to gender, female-headed households under the government scheme
have lower asset inequality than male-headed households. Interestingly, uninsured female-headed
households have much higher asset inequality than both uninsured males and insured male-
headed households. This may imply that insured female-headed households are much better off
than uninsured female-headed households.
The overall trend in the results shows that insured households have relatively lower levels of asset
inequality than the uninsured. This confirms the findings of Burkhauser and Simon (2010), Erksoy
et al. (1995) and Countryman (1999). Insurance may not necessarily lead to direct purchases of
more assets and hence reduce inequality, however, the indemnity cover enjoyed by the insured
prevents asset losses and thus frees up other financial resources, such as savings, for more asset
acquisitions. This relationship between insurance indemnity and asset loss prevention is the most
important factor that reduces asset inequality among insured households as witnessed in the
analysis above.
5.7. CONCLUSION AND POLICY RECOMMENDATIONS
Microinsurance is noted for its ability to enable low-income households to manage risks
proactively, prevent asset loss and make a sustainable exit from poverty. In this study we have
Stellenbosch University https://scholar.sun.ac.za

107
assessed the influence of private and government microinsurance schemes on asset inequality
among low-income households in Ghana.
The results indicate that insured households have lower levels of asset inequality than uninsured
households. Interestingly, insured female-headed households benefit more from both schemes
than insured male-headed households, while uninsured female-headed households are worse off
than their uninsured male counterparts. The geographical dimension shows that insured rural
dwellers have lower asset inequality than the rural uninsured. However, the analyses of Northern
and Brong Ahafo regions reveal that large developmental gaps may limit the effect of
microinsurance on the asset inequality gap.
The findings of this study require policy directions and actions that will encourage more low-income
households to take up microinsurance schemes. For instance, microinsurance firms have been
using the regulations of the “formal” insurance companies to regulate their activities. However, the
unique nature of the microinsurance industry demands a separate policy and regulatory framework
to operate effectively. A strong and robust regulatory framework that meets international standards
will encourage more microinsurance firms to enter the market.
Large scale extension of microinsurance to the urban poor and millions of poor people living in
geographically disperse and remote rural areas entail a lot of efforts and high transaction costs.
Indeed high transaction costs involved in reaching the lower end of the market have compelled
most insurers to locate in the national capital and other large towns. A public policy that will reduce
the cost of transactions may incentivize more insurers to extend microinsurance services to many
remote areas. For example, the current rural banking policy that gives tax exemptions to rural
banks in their first five years of establishment could be replicated in the microinsurance sector.
Achieving depth and large scale extension in a cost-effective manner can also be done through the
use of mobile phone technology. The concept of mobile banking has proven to be cost effective in
extending banking services to millions of poor households who were previously excluded from
formal banking. A “mobile microinsurance” can be designed along the lines of the mobile banking
concept to meet the specific needs of microinsurance transactions. Already two mobile companies
have started bundling microinsurance with their services. A formal policy and regulatory backing
will increase the confidence of the public in “mobile microinsurance” and possibly encourage other
entities to venture into it. This will not only increase the uptake of microinsurance, but it will equip
low-income households to protect their assets against risk, escape poverty and gradually bridge
the asset inequality gap. Future studies may consider using panel data to analyse the dynamic
influence of microinsurance on asset inequality.
Stellenbosch University https://scholar.sun.ac.za

108
REFERENCES
African Development Bank (ADB). 2012a. Income inequality in Africa: Briefing notes for African
Development Bank Group’s long-term strategy, African Development Bank.
African Development Bank (ADB). 2012b. Republic of Ghana: Country strategy paper 2012-2016.
Accra: Country Operations Department, Africa Development Bank.
Alesina, A. & Rodrik, D. 1994. Distributive politics and economic growth. Quarterly Journal of
Economics, 109(2), 465-490.
Asselin, L. M. 2009. Analysis of multidimensional poverty: Theory and case studies. New York, NY:
Springer.
Banerjee, A. V. & Newman, A. F. 1993. Occupational choice and the process of development.
Journal of Political Economy, 101(2), 274-298.
Bardhan, P., Bowles, S. & Gintis, H. 1999. Wealth inequality wealth constraints and economic
performance. In Atkinson, A.B. & Bourguignon, F. (eds.), Handbook of income distribution, 541-
604. Elsevier: Amsterdam.
Benabou, R. 1996. Inequality and growth. In Bernanke, B.S. & Rotemberg, J.J. (eds.), National
Bureau of Economic Research: Volume 11, 11-92. Cambridge, MA: MIT Press.
Birdsall, N. & Londono, J.L. 1997. Asset inequality does matter: Lessons from Latin America.
Washington, DC: Inter-American Development Bank.
Booysen, F., Servaas, V.D.B., Ronelle, B., Michael, V.M. & Gideon, D.R. 2008. Using an asset
index to assess trends in poverty in seven sub-Saharan African countries. World Development,
36(6), 1113–1130.
Buabeng, I.Y. & Gruijters, R. 2012. Market survey: The supply of microinsurance products in
Ghana. In National Insurance Commission (NIC) & Deutsche Gesellschaft für Internationale
Zusammenarbeit (GIZ) (eds.), Promoting microinsurance in Ghana: Microinsurance as a means of
insurance sector development, 102-109. Accra: QualiType Limited.
Burkhauser, R.V. & Simon, K.I. 2010. Measuring the impact of health insurance on levels and
trends in inequality. National Bureau of Economic Research, Working Paper 15811. Available at
http://www.nber.org/papers/w15811
Stellenbosch University https://scholar.sun.ac.za

109
Countryman, G.J. 1999. The effect of unemployment insurance benefits on income inequality in the
Canadian Provinces. Canadian Public Policy, 25(4), 539-556.
Credit Suisse Research Institute. 2012. Global wealth data book 2012. Zurich: Credit Suisse
Research Institute.
Damgaard, C. 2000. Lorenz curve. Available: http://mathworld.wolfram.com/LorenzCurve
Accessed: 2 February 2014.
Dorfman, R. 1979. A formula for the Gini coefficient. The Review of Economics and Statistics,
61(1), 146-149.
Echevin, D. 2011. Vulnerability to asset-poverty in sub-Saharan Africa. Munich Personal RePEc
Archive, MPRA Paper No. 35660. Available: http://mpra.ub.uni-muenchen.de/35660/. Accessed: 3
March 2013.
Erksoy, S., Osberg, L. & Phipps, S. 1995. The distributional implications of unemployment
insurance: A micro-simulation analysis. Place du Portage: Human Resources Development
Canada.
Food and Agriculture Organization (FAO). 2012. Gender inequalities in rural employment in
Ghana, an overview: Gender, equity and rural employment division. Accra: Food and Agriculture
Organization.
Farris, F.A. 2010. The Gini index and measures of inequality. The Mathematical Association of
America Monthly, 117, 851-864.
Filmer, D. & Scott, K. 2012. Assessing asset indices. Demography, 49(1), 359-392.
Filmer, D. & Pritchett, L. H. 2001. Estimating wealth effects without expenditure data - or tears: An
application to educational enrolments in states of India. Demography, 38(1), 115-132.
Filmer, D. & Pritchett, L.H. 1999. The effect of household wealth on educational attainment:
Evidence from 35 countries. Population and Development Review, 25(1), 85-120.
Finmark Trust. 2010. FINSCOPE Ghana 2010 report: Making financial markets work for the poor.
Accra: Finmark Trust Household Survey.
Galor, O. & Zeira, J. 1993. Income distribution and macroeconomics. The Review of Economic
Studies, 60, 35-52.
Stellenbosch University https://scholar.sun.ac.za

110
Ghana Statistical Service (GSS). 2013. 2010 population and housing census: National analytical
report. Accra: Ghana Statistical Service.
Ghana Statistical Service (GSS). 2008. Ghana living standards survey report of the fifth round
(GLSS V). Accra: Ghana Statistical Service. Available: http://www.statsghana.gov.gh. Accessed:
23 March 2011.
Harttgen, K., Klasen, S. & Vollmer, S. 2013. An African growth miracle? Or: What do asset indices
tell us about trends in economic performance? Review of Income and Wealth, 59(S1), S37-S61.
Heckman, J. J. 1979. Sample selection bias as a specification error. Econometrica, 47(1), 135-161.
International Fund for Agricultural Development (IFAD). 2012. Rural poverty in Ghana. Available:
http://operations.ifad.org/web/ifad/operations Accessed: 27 January 2012.
Janzen, S. A. & Carter, M. R. 2013. The impact of microinsurance on asset accumulation and
human capital investments: Evidence from a drought in Kenya. ILO Microinsurance Innovation
Facility Research Paper No. 31. Geneva: International Labour Organization.
Jones, A. M., Koolman, X. & van Doorslaer, E. 2004. The impact of supplementary private health
insurance on the use of specialists in European countries. York: Department of Economics and
Related Studies, University of York.
Levy, H. 2006. Health insurance and the wage gap. National Bureau of Economic Research
Working Paper 11975, Available: http://www.nber.org/papers/w11975. Accessed: 6 September
2014.
Lin, W. 2007. Models with self-selection. Available at: http://www.wanchuanlin.org/Lecture,
Accessed: 27 August 2013.
Matul, M., McCord, M.J., Phily, C. & Harms, J. 2010. The landscape of microinsurance in Africa.
ILO Microinsurance working paper no. 4. Geneva: International Labour Office.
McKay, A. 2002. Defining and measuring inequality. Inequality Briefing, 1(1): 1-6.
McKenzie, D.J. 2004. Measuring inequality with asset indicators. Bureau for Research in Economic
Analysis of Development, BREAD Working Paper No. 042.
Moser, C. & Felton, A. 2007. The construction of an asset index measuring asset accumulation in
Ecuador. Global Economy and Development, Brookings Institution, CPRC Working Paper 87.
Stellenbosch University https://scholar.sun.ac.za

111
National Health Insurance Authority. 2010. Summary statistics of the national health insurance
scheme. Accra: National Health Insurance Authority.
National Insurance Commission. 2011. The 2011 annual report. Accra: National Insurance
Commission. Available: http://www.nicgh.org. Accessed: 31 March 2014.
Njong, A.M. & Ningaye, P. 2008. Characterizing weights in the measurement of multidimensional
poverty: An application of data-driven approaches to Cameroonian data. OPHI Working Paper No.
21. Available: http://www.ophi.org.uk/wp21. Accessed: 8 September 2014.
Persson, T. & Tabellini, G. 1994. Is inequality harmful for growth? American Economic Review,
84(3), 600-621.
Ravallion, M., Chen, S. & Sangraula, P. 2007. New evidence on the urbanization of global poverty.
Population and Development Review, 33(4), 667-701.
Ray, D. 1998. Development economics. Princeton: Princeton University Press.
Sahn, D.E. & Stifel, D.C. 2003. Urban-rural inequality in living standards in Africa. Journal of
African Economies, 12(4), 564-597.
Sahn, D.E. & Stifel, D.C. 2000. Poverty comparisons over time and across countries in Africa.
World Development, 28(2), 2123-2155.
Smith, J.P. 1997. Wealth inequality among older Americans. The Journal of Gerontology, 52B, 74-
81.
Tan, V. 2012. Microinsurance. Advocates for International Development 2012, Available:
http://www.allenovery.com/AOWEB/Knowledge. Accessed: 5 May 2014.
United Nations Development Programme (UNDP). 2011. Sustainability and equity: A better future
for all. New York, NY: United Nations Development Programme.
Van de Poel, E., Hosseinpoor, A.R., Speybroeck, N., Van Ourti, T. & Vega, J. 2008.
Socioeconomic inequality in malnutrition in developing countries. Bulletin of the World Health
Organization, 86, 282-291.
Van Doorslaer, E., Koolman, X. & Puffer, F. 2002. Equity in the use of physician visits in OECD
countries: has equal treatment for equal need been achieved? In Measuring up: Improving health
systems performance in OECD countries, 225-248. Paris: OECD Publishing.
World Bank. 2011. The World Development Indicators: 2011. Washington, DC: The World Bank.
Stellenbosch University https://scholar.sun.ac.za

112
Wu, X., Perloff, J.M. & Golan, A. 2004. Government policy effects on urban and rural income
inequality. Working paper no. 976. Berkeley, CA: University of California, Department of
Agricultural & Resource Economics.
Stellenbosch University https://scholar.sun.ac.za

113
CHAPTER 6
DOES MICROCREDIT INCREASE HOUSEHOLD WELFARE IN THE
ABSENCE OF MICROINSURANCE?43
6.1. INTRODUCTION
Micro financial services – microcredit, microsavings and microinsurance – can help households
manage exposure to risks and improve household welfare through income and consumption
smoothing, asset accumulation and women empowerment. Microcredit provides low-income
households with funding in a timely manner to acquire essential assets and meet certain
unexpected expenses. This has facilitated the growth of its customers in developing countries from
16.5 million in 1997 to 154.8 million clients in 2007 representing 838.2 percent growth (Daley-
Harris, 2009). Microcredit, especially productive loans, has been found to increase per capita
household income (Imai & Azam, 2010), enhances households’ multidimensional well-being and
improves the living standards of rural folks (Adjei et al., 2009; Imai et al., 2010).
Similarly, microinsurance is the defence of low-income households living and working in the
informal sector against specific risks in exchange for regular premium payments proportionate to
the probability and cost of the risk involved (Churchill, 2007). It is a risk transfer tool that helps low-
income households to escape poverty traps (Dercon, 2003) by protecting them against the
financial consequences of life-cycle risks (Binnendijk et al., 2012). Combining microinsurance with
microcredit or microsavings services may ensure that income and consumption smoothing is done
with ease. It may eliminate asset pawning or liquidation at “give-away” prices and thus promotes
financial stability among low-income households. These three micro financial services complete
the risk management toolkit needed by low-income households to manage risk effectively and
efficiently in order to improve their welfare outcomes.
Although microcredit has a lot of potential for extending markets, increasing welfare and fostering
socio-economic change, it presents a number of puzzles, many of which have not yet been
resolved conclusively (Armendariz and Morduch, 2010). In particular the available empirical
evidence about its impact on households’ welfare has been inconclusive and controversial.
Whereas one group of researchers (such as Schuler et al., 1997; Pitt and Khandker, 1996) provide
evidence of the beneficial socio-economic impact, others such as Adams and Von Pischke (1992)
and Rogaly (1996) indicate otherwise.
43
Under review at World Development. An extract from this paper was presented at the Economic Society of South Africa Biennial Conference, 25-27 September, 2013, University of the Free State, Bloemfontein, South Africa.
Stellenbosch University https://scholar.sun.ac.za

114
The current study seeks to stimulate discussion into new ways of making microcredit a welfare
enhancing instrument. This discussion may help researchers and policy makers to resolve the
controversies generated among the three strands of the literature. Microcredit may be good, but its
true potential to improve the welfare of the poor is best realized in combination with an appropriate
microinsurance scheme. The trap of poverty is not only the lack of credit, but also life cycle and
economic risks that threaten the very survival of the poor. Thus giving them credit without
indemnifying them against risks may have little or no positive impact on them. Whereas
microinsurance covers the health, funeral, fire, theft, drought and economic risks of the poor,
microcredit enhances their income generating capacity through the financing of new machines,
improved seeds for cultivation, improved animal breeds and expansion of microenterprises.
In the event of risk the pay-out from microinsurance ensures that microcredit funds are not diverted
to resolve the risky event. Hence advancing microcredit to the poor in combination with
microinsurance will equip them to face the shackles of poverty head-on and make a permanent
escape from poverty. The evidence emerging from this line of thought confirms that microcredit if
combined with microinsurance can improve the well-being of the poor. For instance, Chakrabarty
(2012) reports that microcredit in combination with microinsurance has a very strong effect in
reducing child labour among extremely poor households in Bangladesh.
Much of the attention of the studies on combined microfinance – microcredit in combination with
microinsurance or microsavings – has been focused on microfinance institutions’ (MFIs) product
diversification (see e.g. Caplan, 2008; Labie, 2009; Kwon, 2010) and on MFIs sustainability and
productivity (Rossel-Cambier, 2012). The literature indicates that combined microfinance can be
beneficial to MFIs in the form of reduced overhead costs resulting from integrated client
administration, lower transaction cost, wider outreach and client loyalty (Morduch, 2004; ILO,
2007). It also improves loan repayments rates (Bond and Rai, 2009) as well as the efficiency and
productivity of MFIs (Rossel-Cambier, 2012).
This study seeks to re-focus the research into combined microfinance on the clients rather than on
MFIs in order to determine whether combined microfinance inure to the benefits of low-income
households. In particular we ask: are combined microfinance products better than stand-alone
products in improving the welfare of low-income households? To this extent, it is worth exploring
whether the combination of microcredit with microinsurance either enhances the welfare of low-
income households or makes them even more vulnerable.
We examine this research question through the use of an asset index instead of money metric
income and consumption expenditure as a measure of welfare of low-income households. To
control for selection bias and endogeneity we employed three empirical models: Heckman sample
Stellenbosch University https://scholar.sun.ac.za

115
selection, treatment effects and instrumental variable models to estimate the individual and the
combined effects of microcredit and microinsurance on household welfare.
This chapter is organized as follows: the review of the literature is captured in section 6.1, section
6.2 provides an overview of the microfinance industry in Ghana; the methodology is in section 6.3,
the results are presented and discussed in section 6.4 and the conclusion is presented in section
6.5.
6.2. LITERATURE REVIEW
Microfinance exists to meet the needs of those households and microenterprises which have been
excluded or segmented out of the formal financial market due to reasons such as clients lack of
tangible collateral, perceived as highly risky due to informational opacity and the high transaction
cost involved in intermediating for such low-income clients (Abor & Biekpe, 2006; Tagoe et al.,
2005). The extension of credit to low-income earners assists in the creation of households
microenterprises, which helps to generate employment and extra income for poor households and
villages (Bateman, 2010). The additional income generated enhances the welfare of households
through improved nutrition and consumption, investment in household members’ education, and
some modest investment in productive and households’ durable assets.
According to Bateman (2010:25), “poverty is not simply a lack of income; it is also a lack of income
at the time it is needed”. Hence for the poor, getting microcredit to smooth out certain key
household consumption expenditures is a great relief afforded them by MFIs. For instance, during
the lean or dry season, rural farmers are assisted by microloans to meet their households’ health
and education expenditures. Such loans, which are then repaid during the harvesting period,
enable poor farmers to compensate for the ups and downs of economic life and overcome
vulnerability (Bateman, 2010). By aiding households to smooth out consumption of essential
expenditures such as health and education, microfinance enhances the capacity of the poor to
increase their skills and value on the job market, which is critical for sustainable poverty reduction.
Despite acknowledging the potential welfare enhancing effect of microcredit services, Bateman
(2010) provoked an intense debate about the ability of microfinance to lead to sustainable
improvement in the welfare of poor households. He argued that the so-called welfare impact
vehicles – income and employment generation, consumption smoothing, gender empowerment
and a helper of the helpless (poorest) – through which microfinance is acclaimed to impact
positively on the poor are all myths and “largely built on hype and on egregious half-truths”. He
further posits quite strongly that “microfinance is largely antagonistic to sustainable economic and
social development, and so also to sustainable poverty reduction. Put simply, microfinance does
Stellenbosch University https://scholar.sun.ac.za
116
not work” (Bateman, 2010:1). The crux of his argument is that microfinance is a poverty trap and
an anti-development policy.
6.2.1. The Empirical Literature
The empirical literature concerning the microfinance industry is growing in leaps and bounds and
so are the controversies regarding its capacity to equip the poor to escape the poverty trap. The
evidence concerning its effects on welfare is very much inconclusive, ranging from the very radical
position of Bateman (2010) that microfinance does not work as well as the near zero impact in
Thailand (Cull et al., 2009) to the remarkable positive effects in Bangladesh (Imai & Azam, 2010).
This section reviews three strands of the empirical literature: studies showing positive, negative
and mixed/zero impacts of microcredit.
On the positive side, Imai et al. (2010) used the nation-wide cross sectional data of India collected
by the Small Industries Development Bank of India (SIDBI) on 5 260 clients and non-clients of 20
MFIs affiliated to SIDBI. The authors used an index based on households’ food security and socio-
economic characteristics to rank households on five index-based ranking indicators ranging from
the very poor households to households with surplus resources. They then employed the treatment
effect model to estimate the effects of microfinance productive loans on household poverty
alleviation. Propensity score matching and Tobit regression were used to augment and check the
robustness of the results. Their findings indicate that microfinance productive loans have a
significant positive influence on households’ welfare outcomes and that this positive impact is more
profound in rural areas than in urban centres.
In a similar study Imai and Azam (2010) used four series of national panel data of the Bangladesh
Rural Employment Support Foundation (PKSF) collected on 3 000 participants and non-
participants households of 13 MFIs across Bangladesh. The study reports that access to MFIs’
productive loans has a significant increasing impact on households’ per capita income, but access
to general loans does not. The paper further indicates that the analysis of each series of the panel
data shows a reducing trend of the strength of microfinance to equip households to reduce poverty:
that is, the capacity of microfinance to reduce poverty, even though positive, is at a reducing rate.
The authors thus conclude by calling for the re-focusing of microfinance on its primary objective of
reducing poverty and the need to monitor loans utilization.
A similar study in Ghana on a cross-section survey of 547 households was conducted by Adjei et
al. (2009) to evaluate how the products of one microfinance institution – Sinapi Aba Trust (SAT) –
facilitates asset build-up among the program participants. In particular, the study assessed how
access to loans and loan amount influenced the tendency of participants to save money and to join
a welfare scheme. In addition, the impacts of access to loans and loan amount on clients’ human
Stellenbosch University https://scholar.sun.ac.za

117
capital and physical capital was evaluated. The study reports that participation in the SAT program
enhances clients’ savings culture and increases enrolment in the welfare scheme, which in turn
reduces clients’ vulnerability to crisis. It further indicates that clients are better equipped by SAT to
provide better education and health care for their households and to acquire durable assets.
The distributional impact of the financial system with and without the microfinance industry of
Bangladesh was evaluated by Mahjabeen (2008). The social accounting matrix data of Bangladesh
for the period 1999 to 2000 was analysed through the basic and extended version of general
equilibrium techniques by the author to ascertain the real impacts of MFIs. The evidence provided
by the study indicates that microfinance has a positive impact on households’ income and
expenditure levels, decreases inequalities and improves welfare. This finding lends support to
earlier studies about Bangladesh (Pitt & Khandker, 1998; Khandker, 2005) that microfinance is a
potent developmental tool and has the potential to lift the poor from poverty trap, reduce economic
inequalities and facilitate the rapid attainment of the millennium development goals.
Other studies on microfinance and women empowerment (Pitt et al., 2006; Pitt et al., 2003; Pitt et
al., 1999; Pitt & Khandker, 1998; Sharma & Zeller, 1997; Hulme & Mosley, 1996) have indicated
that microfinance programs enhance female participants’: (i) business acumen and decision
making skills; (ii) financial and economic resourcefulness; (iii) formation of social capital networks;
and (iv) better parenting control in the education, nutrition and health of households members.
Female borrowers have also been noted as credit-worthy and thus their participation in a
microcredit program improves the productivity and self-sustainability of MFIs (Sharma & Zeller,
1997; Hulme & Mosley, 1996). Similarly, Afrane (2002) provides evidence from quantitative and
qualitative studies on two microfinance schemes from Ghana and South Africa that microcredit
empowers women to growth their businesses and even perform better than men in enterprise
development. He further indicates that microcredit improves the financial independence, self-worth
and confidence of women.
Despite the general positive impacts of microfinance on households’ welfare, some studies found
that MFIs have either negative or no impacts at all on households’ poverty reducing efforts. Adams
and Von Pischke (1992) argue that microcredit cannot help the poor to escape poverty nor can it
improve the economic welfare of the vulnerable. Two studies which have heightened the debate on
the welfare enhancing effects of microfinance are that of Pitt and Khandker (1998) and Morduch
(1998) on Bangladesh. Whereas Pitt and Khandker (1998) report that microfinance has a positive
marginal impact on households’ consumption, Morduch (1998) finds an inverse impact of
microfinance on consumption.
Morduch’s (1998) analysis further reveals that the educational outcomes of program participating
households are in fact below that of the control group. The difference between these two studies is
Stellenbosch University https://scholar.sun.ac.za
118
probably due to the selection of the control group since this has been the major hindrance to
effective impact evaluation. As Morduch admits, although the control group do not have access to
formal microfinance credit, they are nevertheless served by NGOs and other informal lenders. This
might have blurred the actual differences between the control group and the treatment group.
Although Coleman (1999) did extremely well to correct selection bias, endogenous program
placement and the control group deficiencies, the results reveals that microfinance has no impact
on households’ poverty reducing efforts. In particular the findings show that: (i) rural banks have a
significant adverse effect on men’s healthcare expenditure; (ii) some of the women have been
trapped in a vicious cycle of high interest debt because they borrow from moneylenders to service
the village bank loans; and (iii) the loans are not being invested in any productive venture.
Coleman attributed some of the findings to the small loan size and context-specific issues.
Similarly, Annim, Dasmani and Armah (2011:1) report from an investigation into the effect of credit
on household food consumption that “access to credit does not contribute to the smoothening of
household consumption”. Therefore the authors, among others recommend the bundling of
insurance with credit in order to enhance the benefits that households derive from credit.
Another group of studies produce mixed results on the welfare effects of microfinance. For
example, Kondo et al. (2008) indicate that whereas access to loans has a significant positive effect
on income and expenditures of richer households, its influence on poorer households is
retrogressive. The link between household asset accumulations, human capital investments and
micro financial services was also found to be non-existent. Coleman (2006) undertook a survey of
444 households in 14 villages in northeast Thailand between 1995-96 to assess the outreach and
the true beneficiaries of micro financial services. Eight villages out of the 14 were randomly
selected as treatment villages and, after controlling for program placement bias as well as
participants’ selection bias, weighted logit regression was used for the econometric estimation. The
findings were mixed. Whereas the well to-do participants, especially the village committee
members, derived significant positive impacts, the impact on the ordinary members was negligible.
Makina and Malobola (2004) report from their evaluation of the Khula Enterprise Finance Limited of
South Africa that microfinance has a significant positive influence on clients’ welfare, women’s
economic empowerment and on microenterprises’ access to finance. However, the study also
indicates that the desired impact on poor rural communities is minimal. This is an indication that
microfinance may not necessarily be for the “very poor” communities as it is originally meant to be.
In a cross-country study Hulme and Mosley (1996) also found that the positive impact of
microfinance is much more substantial to richer clients than the ultra-poor.
Stellenbosch University https://scholar.sun.ac.za

119
6.3. AN OVERVIEW OF THE MICROFINANCE INDUSTRY IN GHANA
Urban areas dominate most sub-Saharan Africa financial markets (Mpuga, 2004) to the detriment
of rural folks and microenterprises which remain excluded from the formal financial sector
(Hofmeister, 1999). Much of the efforts to extend formal financial services to the excluded have
come from MFIs through the support of the international development community. Anecdotal
evidence indicates that the journey of the microfinance industry in Ghana began in the Northern
Region in 1955 with the establishment of a credit union by Roman Catholic Church missionaries
from Canada (Bank of Ghana, 2007; Nanor, 2008). This microfinance idea spread to other parts of
the country and, together with the susu and rotating savings and credit concepts, the rural financial
architecture was laid.
Financial sector reforms and certain key regulations, such as the PNDC Law 328 that allowed the
operations of different variant of MFIs, have facilitated the evolution and growth of the microfinance
industry tremendously. Firms in the microfinance industry are licensed and regulated by the Bank
of Ghana (BoG). As at March 2013, the BoG had licensed 133 rural and community banks (RCBs),
144 savings and loans companies (SLCs), 24 moneylenders and 3 financial NGOs (FNGOs) (see
Table 6.1).
Table 6.1: Types and Number of Registered MFIs in Ghana
Type of MFI Number Registered
Formal MFIs
Rural and community banks 133
Savings and loans companies 144
Semi-Formal MFIs
Credit Unions 380
Financial NGOs 3
Informal MFIs
Traditional money lenders 24
Source: BoG, 2007; ARB Apex Bank, 2012
MFIs are licensed into three business categories: formal MFIs, semi-formal MFIs and informal
MFIs (Bank of Ghana, 2007). Examples of the formal MFIs are rural and community banks (RCBs),
and savings and loans companies (SLCs). The formal MFIs accept deposits and make loans. They
provide financial intermediation to rural communities, create a culture of formal banking among
rural dwellers and facilitate the financing of rural microenterprises (Bank of Ghana, 2006). For
example, RCBs provide the largest financial intermediation to rural communities and their branch
network is about 50 percent of the banking outreach in Ghana (IFAD, 2008).
Stellenbosch University https://scholar.sun.ac.za

120
The semi-formal MFIs are mutual or member-based financial societies. They provide savings and
credit products to a defined community such as a trade union, church or any recognized society. In
most cases the clients are also the owners and hence such MFIs normally do not offered financial
services to the general public. Examples of the semi-formal MFIs are credit unions, financial NGOs
and cooperatives. Although the credit unions are under the general supervision of the BoG, they
are registered and regulated by the Credit Unions Association of Ghana. They are registered as
workplace-based, faith-based or community-based credit unions. The informal MFIs are the
traditional moneylenders, susu collectors, and the rotating, savings and credit associations
(ROSCAs) (Bank of Ghana, 2007).
The MFI sector is faced with enormous challenges which can broadly be decomposed into four: (1)
inadequate regulatory and supervisory structures resulting in the setting up of Ponzi schemes and
mushrooming44 of MFIs across the country; (2) very weak governance and risk management
structures in most MFIs; (3) low levels of skills and lack of professionalism among most managers
of MFIs; (4) low levels of equity capital (Nanor, 2008). Addressing these challenges will unleash
the immense potential of MFIs to increase outreach and extend formal financial services to the
poor and the “missing middle”.
6.4. THE METHODOLOGY
6.4.1. The Data
The household survey on access and usage of financial services collected by Finmark Trust in
2010 for Ghana was used for this study. The sampling technique involved stratified multi-stage
random sampling comprising households in geographically enumerated rural and urban settings in
all ten regions of the country. Face-to-face interviews and semi-structured questionnaires were
used to gather the data from 3 643 households. The survey contains very rich information on
households’ demographic features, economic conditions, social backgrounds, asset and income
levels, access to social amenities, financial knowledge and risk management, perception about
financial institutions, remittances and access to credit, and insurance and savings products.
In terms of access to financial services, the dataset can be broadly classified into three categories:
(1) access to formal financial services such as commercial banks; (2) access to other formal
financial services (such as microfinance firms, insurance firms, savings and loans companies, rural
and community banks) and informal financial services (such as savings clubs, susu, ROSCAS);
and (3) no access at all. For the purposes of this study we extracted the data set concerning
households’ usage of informal financial services and other formal financial services. In all 800
households were drawn for the empirical investigation.
44
The Bank of Ghana has closed down some of these MFIs.
Stellenbosch University https://scholar.sun.ac.za

121
6.4.2. The Profile and Characteristics of the Sampled Households
A chi-square45 test on the profile and economic characteristics of households using microcredit
(HH_Credit) and those without microcredit (HH_No Credit) is reported in Table 6.2. The chi-square
distribution indicates that apart from gender and income levels, the two groups of households do
not differ statistically from each other in age, family size, education, housing, location, economic
activity and access to financial services. Whereas the income of HH_Credit is concentrated in the
medium quintile (GHS401-GHS1000), households without microcredit are within the bottom and
upper quintiles of the income bracket.
Table 6.2: Chi-Square Test on the Profile of Microcredit participants and Non-participants
Variable HH_Credit (%)C HH_No Credit (%)
C Chi-Square (χ
2.050)
Resp. AgeT (mean years) 39.568 38.744 -0.8245 (0.234)
T
Resp. Gender 4.0880 (0.043)** Male 51.71 43.98 Female 48.29 56.02 Resp. Marital Status 1.7085 (0.191) Married 57.88 52.89 Others 42.12 44.11 Resp. Education Level 0.7988 (0.671) No formal Education 9.20 10.24 Primary Education 41.38 43.67 Secondary and above 49.43 46.08 Household Income 6.8700 (0.032)** 0 – GHS400 63.12 71.88 GHS401 – GHS1000 31.18 21.09 Above GHS1000 5.70 7.03 HH Size
T (mean size) 3.79 3.79 -0.0049 (0.490)
T
House Ownership 1.4629 (0.481) Rented 36.00 31.63 Family Owned 45.71 49.10 Occupied without payment 18.29 19.28 Location 2.6316 (0.105) Urban 71.14 65.36 Rural 28.86 34.64 Economic Activity 1.2227 (0.269) Farming Enterprise 33.14 29.22 Non-Farming Enterprises 66.86 70.78 Proximity to Financial Ins 1.3151 (0.251) 10 – 30 minute walk 70.40 65.38 Above 30 minute walk 29.60 34.62 Remittances 2.4247 (0.119) Do not Receive Remittance 37.28 43.16 Receive Remittances 62.72 56.84
Note: ** indicate 5 percent significance level; C indicates that the addition for each variable is by columns;
Tindicates
T-test instead of Chi-square.
Source: Author’s computation based on the 2010 FINSCOPE Data of Ghana.
6.4.3. The Estimation Techniques
This study seeks to determine whether access to microcredit without microinsurance might
increase household welfare. The sample population is divided into three: (1) households using
microcredit, but not microinsurance; (2) households using microcredit and microinsurance; and (3)
45
The chi-square and the t-test were used for the categorical and continuous variables respectively.
Stellenbosch University https://scholar.sun.ac.za

122
households without microcredit or microinsurance. The microfinance programs under this study
were not assigned randomly, hence the estimation technique is confined to a sample population in
which all households have access to microfinance services (microcredit and microinsurance), but
some decided not to take up these financial products. The non-randomization of the products
creates selection bias and endogeneity problems associated with the uptake of microfinance
programs. Hence the estimation is done to account for selection bias and endogeneity problems by
using the following techniques: Heckman sample selection method, treatment effect model and
instrumental variable modelling.
6.4.3.1. The Heckman Sample Selection Model
Heckman’s (1974, 1978 and 1979) model for sample selection is a two-step technique for
evaluating nonrandomized programs. It is used to correct selection bias. The first step involves the
estimation of a probit function on the determinants of the uptake of microcredit46. The probit model
for microcredit is a binary variable which takes the value of one (1) if household i has taken up
microcredit otherwise zero (0). This is given in the following set up as:
𝐶𝑅𝐸𝐷𝐼𝑇𝑖 = {
1 𝑖𝑓 ℎ𝑜𝑢𝑠𝑒ℎ𝑜𝑙𝑑 𝑖 ℎ𝑎𝑠 𝑚𝑖𝑐𝑟𝑜𝑐𝑟𝑒𝑑𝑖𝑡
0 𝑖𝑓 ℎ𝑜𝑢𝑠𝑒ℎ𝑜𝑙𝑑 𝑖 𝑛𝑒𝑣𝑒𝑟 ℎ𝑎𝑑 𝑚𝑖𝑐𝑟𝑜𝑐𝑟𝑒𝑑𝑖𝑡
6.1
The above set up is given as:
𝐶𝑅𝐸𝐷𝐼𝑇𝑖 = 𝑧𝑖𝛿 + 𝜇𝑖 6.2
Thus 𝑃𝑟𝑜𝑏(𝐶𝑅𝐸𝐷𝐼𝑇𝑖 = 1|𝑧𝑖) = 𝛷(𝑧𝑖𝛿) and 𝑃𝑟𝑜𝑏(𝐶𝑅𝐸𝐷𝐼𝑇𝑖 = 0|𝑧𝑖) = 1 − 𝛷(𝑧𝑖𝛿)
Where zi is a vector of exogenous variables determining treatment (the uptake of microcredit) and
𝚽(∙) is the standard normal cumulative distribution function. The parameters of the probit function
are then used to calculate the inverse Mills ratio (hazard lambda) which is then included in the
outcome equation as an additional independent variable (Janzen and Carter, 2013; Lin, 2007). The
inverse Mills ratio accounts for possible selection bias and omitted variables or the unexplained
variations in the error term, and is given as:
𝜆𝑖 =𝜙(𝑧𝑖�̂�)
Φ(𝑧𝑖δ̂) 6.3
Where 𝝀𝒊 is the inverse Mills ratio, 𝝓 is standard normal density function, and 𝚽 is as defined in the
probit model above. The second step equation (that is, the effect of microcredit on household
welfare) is then estimated with the inverse Mills ratio as an additional independent variable.
𝑊𝐸𝐿𝐹𝑖 = 𝛽0 + 𝛽1𝐶𝑅𝐸𝐷𝐼𝑇𝑖 + 𝛽2𝜆𝑖 + 𝑐𝑜𝑛𝑡𝑟𝑜𝑙𝑖 + 휀𝑖 6.4
46
The estimations of the microinsurance model follow the same procedure.
Stellenbosch University https://scholar.sun.ac.za

123
Where 𝑊𝐸𝐿𝐹𝑖 is the household welfare indicator; 𝐶𝑅𝐸𝐷𝐼𝑇𝑖 is the uptake of microcredit; 𝑐𝑜𝑛𝑡𝑟𝑜𝑙𝑖is a
vector of control variables such as education, age, marital status, rural-urban setting, income and
economic activity; and the error terms (𝜇𝑖; 휀𝑖) of equations (6.2) and (6.4) are both bivariate normal
with mean zero.
6.4.3.2. The Treatment Effect Model
The treatment effect model performs the estimation for both the program participants and non-
participants simultaneously. The selection and outcome equations are indicated in (6.5) and (6.6)
respectively.
𝐶𝑅𝐸𝐷𝐼𝑇𝑖 = 1 𝑖𝑓 𝐶𝑅𝐸𝐷𝐼𝑇𝑖∗ > 0, 𝑎𝑛𝑑 𝐶𝑅𝐸𝐷𝐼𝑇𝑖 = 0 𝑜𝑡ℎ𝑒𝑟𝑤𝑖𝑠𝑒
Thus 𝐶𝑅𝐸𝐷𝐼𝑇𝑖∗ = 𝑧𝑖𝛿 + 𝜇𝑖 , 6.5
𝑊𝐸𝐿𝐹𝑖 = 𝑥𝑖𝛽 + 𝐶𝑅𝐸𝐷𝐼𝑇𝑖𝛾 + 휀𝑖 6.6
Where µi and ɛi are the error terms which are bivariate normal with zero mean. Since CREDITi is
an endogenous binary variable, the treatment effect model uses the observed characteristics of the
participants and the non-participants for the estimation of the parameters of β and also control for
selection bias due to non-ignorable placement of microfinance. Substituting equation (6.5) into
equation (6.6) gives the outcomes models for both the participants and the non-participants.
When 𝐶𝑅𝐸𝐷𝐼𝑇𝑖∗ > 0, 𝐶𝑅𝐸𝐷𝐼𝑇𝑖 = 1: 𝑊𝐸𝐿𝐹𝑖 = 𝑥𝑖𝛽 + (𝑧𝑖𝛿 + 𝜇𝑖)𝛾 + 휀𝑖 6.7
And when 𝐶𝑅𝐸𝐷𝐼𝑇𝑖∗ ≤ 0, 𝐶𝑅𝐸𝐷𝐼𝑇𝑖 = 0: 𝑊𝐸𝐿𝐹𝑖 = 𝑥𝑖𝛽 + 휀𝑖 6.8
Where the 𝑊𝐸𝐿𝐹𝑖 = 𝑥𝑖𝛽 + (𝑧𝑖𝛿 + 𝜇𝑖)𝛾 + 휀𝑖 is the participants outcome model while the non-
participants outcome model is 𝑊𝐸𝐿𝐹𝑖 = 𝑥𝑖𝛽 + 휀𝑖. These two models are estimated simultaneously.
6.4.3.3. Instrumental Variable Model (IV Model)
An instrumental variable model is included in this study to help us capture certain unobserved
features such as entrepreneur passion, fear or motivation which are likely not to be captured by
either the Heckman or treatment effect models. It controls for the endogeneity problems associated
with the uptake of microfinance products, and also serves as a check on the robustness of the
results. In order to resolve the problem of endogeneity bias, the IV model requires an observed
variable that is (1) strongly correlated with the demand for microcredit; but (2) uncorrelated with the
error term. We chose customers’ identity card, bank account and proximity to a financial company.
Following the theoretical exposition of Wooldridge (2002) about IV’s two-stage least squares, we
employed these instruments to estimate the influence of microcredit on household welfare.
Stellenbosch University https://scholar.sun.ac.za

124
6.4.4. The Construction of the Asset Index
The ownership of assets such as radio, television, mobile phone, refrigerator, electricity, toilet, and
piped water, as well as the type of materials used for the floor and roofing of a house can enhance
the well-being of household members. For instance whereas piped water, flush toilet and a cement
floor may improve household welfare, drinking from surface water (stream, lake, river), using a pit
latrine or defecating in the bush or open field, and using clay to floor a house may expose the
household to deadly diseases such as cholera, guinea worm, bilharzia and snake bites. This
compromises the health status of households, reduces their productive hours, increases their
hospital bills and lowers their well-being. Hence the level of households’ wealth or accumulated
assets has been used as the measure of welfare in this study. We created an asset index as a
composite welfare indicator through multiple correspondence analysis.
Asset index has been used in the mainstream poverty literature to measure poverty levels (see e.g.
Booysen et al., 2008; Harttgen et al., 2013; Filmer & Scott, 2012; Echevin, 2011; Sahn & Stifel,
2000; Njong & Ningaye, 2008). This study adds a new innovation to its usage by employing it in the
financial literature to measure household welfare. We used twelve private household assets and
access to water and electricity for the creation of the asset index. The index, WELFi, is a function of
specific underlying variables Pij, such that Pij represents household i’s ownership or lack of
asset/property j (Johnston and Abreu, 2013; Booysen et al., 2008).
𝑊𝐸𝐿𝐹𝑖 = 𝑓{𝑃𝑖𝑗} 6.9
This is expanded as: 𝑊𝐸𝐿𝐹𝑖 = 𝑃𝑖1 + 𝑃𝑖2 + … + 𝑃𝑖𝑚 6.10
Where Pij is a binary or categorical variable and takes the value 1 if household i owns asset j, and
0 if otherwise. Following the methods of Benźecri (1973), Asselin (2009), Booysen et al. (2008),
Echevin (2011) and van Kerm (1998) the weights of the individual assets were then computed
using multiple correspondence analysis. The basic form of the asset index is given as:
𝑎𝑖 = ∑ 𝐹1𝑘𝑘𝑘=1 𝑑𝑘𝑖 6.11
The ith household asset index is αi, dki is the kth value of the categorical variables (with k=1… K)
indicating the households’ assets included in the index construction. F1k is the MCA weights
generated for the analysis. The extended form of the asset index for this study is given as:
𝑊𝐸𝐿𝐹𝑖 = 𝑃𝑖1𝑊1 + 𝑃𝑖2𝑊2 + ⋯ 𝑃𝑖𝑗𝑊𝑗 6.12
Stellenbosch University https://scholar.sun.ac.za

125
Where WELFi is the welfare composite index of household i, the response of household i to
category/asset j is represented by Pij and Wj is the MCA weight for dimension one applied to
category j (Booysen et al., 2008).
6.5. RESULTS AND DISCUSSION
6.5.1. Uses of the Microcredit
It is expected that borrowing to finance productive ventures will grow household income and
enhance their wealth. Also, borrowing to invest in household members’ education propels their
human capital development which can have long-term effects on sustainable poverty alleviation.
The descriptive statistics in Table 6.3 indicates that about 53 percent of the microcredit is
channelled into productive economic activities and human capital investment. Whereas this may
indicate proper utilization of microcredit, the 30.27 percent and 5.4 percent spent on consumption
and servicing of old debts may not grow the assets of households in the long run. The over-
reliance on debt to finance consumption expenditure can tie households up into the negative
effects of credit cycles.
Table 6.3: Uses of the Microcredit
Purpose Frequency Total Percentage (%)
Consumption Expenditure 89 30.27%
1. Daily expenses 39
2. Emergency 24
3. Social (wedding) 8
4. Rent 5
5. Motorcycle/car 6
6. Household assets 7
Housing Expenditure 34 11.57%
1. Purchase land 5
2. Build a house 14
3. House renovation 15
Business Expenditure 107 36.40%
1. Start-up capital 20
2. Agric inputs 29
3. Business expansion 58
Human Capital 48 16.32%
Education 48
Others 16 5.44%
1. Pay old debts 13
2. Other investment 3
Total 294 100%
Source: Authors’ computation based on the 2010 FINSCOPE Data of Ghana.
Stellenbosch University https://scholar.sun.ac.za

126
The empirical estimations cover households using (1) only microcredit, (2) only microinsurance and
(3) those using both microcredit and microinsurance. The results have been reported in Table 6.5.
The results of the probit model to obtain the coefficients for the inverse Mills ratio needed for the
correction of selection bias is reported in Table 6.4. The characteristics of households (except
income) have no significant effect on the uptake of microcredit, rather some institutional factors
and the availability of microcredit substitutes seem to influence the demand for microcredit. For
instance financial deepening, measured by the percentage of the population banked, has a very
strong positive effect on the uptake of microcredit. This lends support to the finance literature (e.g.
see King & Levine, 1993; Knoop, 2013) that financial development facilitates increased credit
access to households and economic entities.
The other significant institutional factors are convenience of banking hours, customers’
identification card, remittances and savings. The results reveal that customers’ identification card is
the only valid instrument for the estimation of the IV model, hence proximity to a financial institution
and bank account were dropped from the estimation of the IV model. As predicted by financial
theory, access to substitutes such as borrowing from family and friends as well as trade credit have
significant negative effects on the demand for microcredit.
Stellenbosch University https://scholar.sun.ac.za
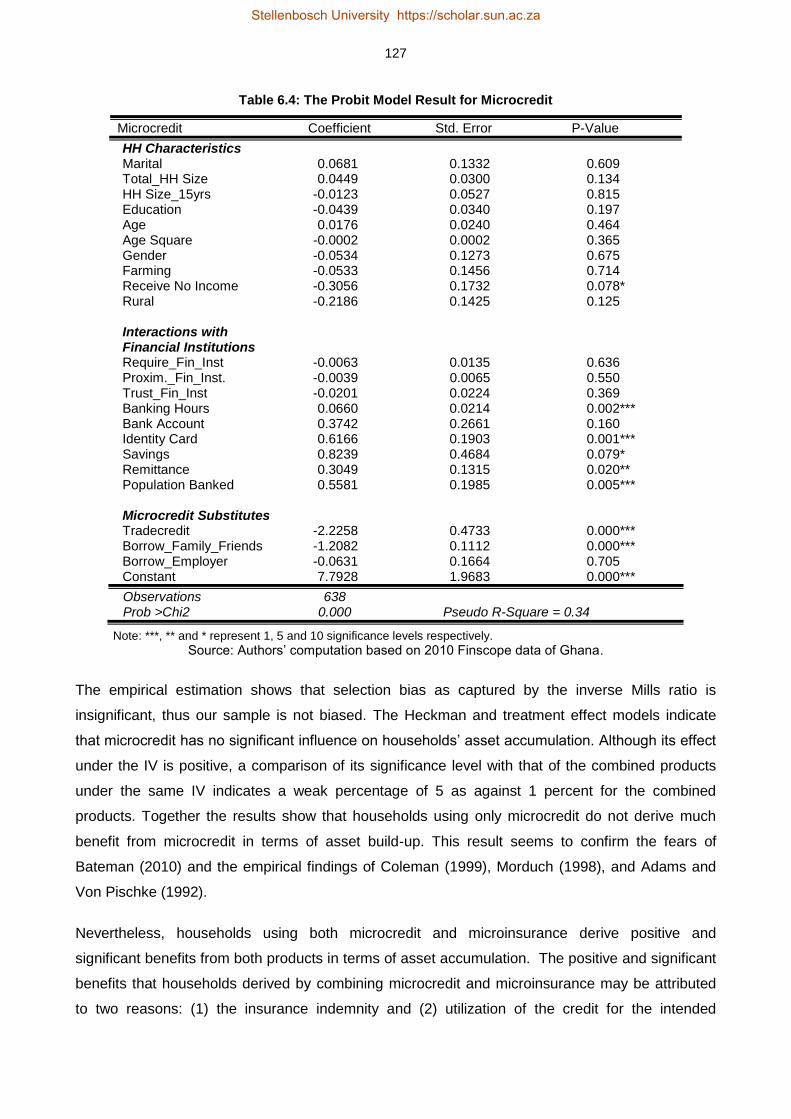
127
Table 6.4: The Probit Model Result for Microcredit
Microcredit Coefficient Std. Error P-Value
HH Characteristics Marital 0.0681 0.1332 0.609 Total_HH Size 0.0449 0.0300 0.134 HH Size_15yrs -0.0123 0.0527 0.815 Education -0.0439 0.0340 0.197 Age 0.0176 0.0240 0.464 Age Square -0.0002 0.0002 0.365 Gender -0.0534 0.1273 0.675 Farming -0.0533 0.1456 0.714 Receive No Income -0.3056 0.1732 0.078* Rural -0.2186 0.1425 0.125 Interactions with Financial Institutions Require_Fin_Inst -0.0063 0.0135 0.636 Proxim._Fin_Inst. -0.0039 0.0065 0.550 Trust_Fin_Inst -0.0201 0.0224 0.369 Banking Hours 0.0660 0.0214 0.002*** Bank Account 0.3742 0.2661 0.160 Identity Card 0.6166 0.1903 0.001*** Savings 0.8239 0.4684 0.079* Remittance 0.3049 0.1315 0.020** Population Banked 0.5581 0.1985 0.005*** Microcredit Substitutes Tradecredit -2.2258 0.4733 0.000*** Borrow_Family_Friends -1.2082 0.1112 0.000*** Borrow_Employer -0.0631 0.1664 0.705 Constant 7.7928 1.9683 0.000***
Observations 638 Prob >Chi2 0.000 Pseudo R-Square = 0.34
Note: ***, ** and * represent 1, 5 and 10 significance levels respectively.
Source: Authors’ computation based on 2010 Finscope data of Ghana.
The empirical estimation shows that selection bias as captured by the inverse Mills ratio is
insignificant, thus our sample is not biased. The Heckman and treatment effect models indicate
that microcredit has no significant influence on households’ asset accumulation. Although its effect
under the IV is positive, a comparison of its significance level with that of the combined products
under the same IV indicates a weak percentage of 5 as against 1 percent for the combined
products. Together the results show that households using only microcredit do not derive much
benefit from microcredit in terms of asset build-up. This result seems to confirm the fears of
Bateman (2010) and the empirical findings of Coleman (1999), Morduch (1998), and Adams and
Von Pischke (1992).
Nevertheless, households using both microcredit and microinsurance derive positive and
significant benefits from both products in terms of asset accumulation. The positive and significant
benefits that households derived by combining microcredit and microinsurance may be attributed
to two reasons: (1) the insurance indemnity and (2) utilization of the credit for the intended
Stellenbosch University https://scholar.sun.ac.za

128
purpose. Microinsurance47 being a risk management tool, indemnifies policyholders against certain
risks at a fee over a period of time. For instance, credit life protects households against the
liquidation of assets to repay loans; health insurance prevents the tendency of diverting approved
loans to pay for hospital bills; and property insurance (e.g. fire policy) enables households to avoid
the tendency of falling on approved loans to rebuild after a fire.
The opportunity cost of poor health and economic shocks are quite unbearable for the poor
(Chakrabarty, 2012), thus in the absence of insurance, either microcredit or mostly assets are
depleted to cope with risky event (Smith, 1998). Hence advancing microcredit to the poor may not
lead to build-up of more assets unless it is combined with an appropriate microinsurance product.
The use of microinsurance enables households to avoid the misapplication of microcredit funds,
and complements microcredit by equipping households to avoid moral hazards in the utilization of
microcredit funds. This finding lends support to similar findings by Chakrabarty (2012) which
indicate that the strength of microcredit to reduce child labour among the extremely poor is realized
through combination with an appropriate microinsurance policy.
47
The microinsurance products covered in this study are life, property, health, funeral, education and investment plans.
Stellenbosch University https://scholar.sun.ac.za

129
Table 6.5: The Estimations of Microcredit and Microinsurance48
Variables Microinsurance Only Microcredit Only Microcredit and Microinsurance Together
Heckman Treatment IV Heckman Treatment IV Heckman Treatment IV
Microinsurance 0.0710 0.1842 0.1909 (0.339) (0.048)** (0.050)** Microcredit 0.0026 0.0182 0.9779 (0.969) (0.850) (0.022)** Insure_Credit 0.1523 0.3175 0.5085 (0.041)** (0.014)** (0.006)*** Inv.Mills Ratio -0.0589 -0.0619 -0.0389 -0.0037 -0.0125 -0.1295 (0.333) (0.350) (0.509) (0.956) (0.811) (0.135) Not Married -0.0938 -0.0981 -0.0936 -0.0607 -0.0651 -0.0852 -0.1020 -0.1038 -0.1075 (0.117) (0.097)* (0.119) (0.023)* (0.004)*** (0.003)*** (0.099)* (0.090)* (0.078)* Education 0.1772 0.1775 0.1770 0.1822 0.1835 0.1769 0.1815 0.1771 0.1716 (0.000)*** (0.000)*** (0.000)*** (0.000)*** (0.000)*** (0.000)*** (0.000)*** (0.000)*** (0.000)*** T_HH_Size -0.0605 -0.0610 -0.0615 -0.0575 -0.0590 -0.0662 -0.0602 -0.0629 -0.0668 (0.000)*** (0.000)*** (0.000)*** (0.000)*** (0.000)*** (0.000)*** (0.000)*** (0.000)*** (0.000)** HH Size≥15yrs 0.0706 0.0731 0.0712 0.0647 0.0679 0.0663 0.0691 0.0703 0.0753 (0.005)*** (0.003)*** (0.004)*** (0.011)** (0.006)*** (0.027)** (0.007)*** (0.005)*** (0.003)*** Resp.Age -0.0077 -0.0078 -0.0073 -0.0049 -0.0033 -0.0193 -0.0071 -0.0076 -0.0100 (0.490) (0.479) (0.511) (0.657) (0.757) (0.180) (0.537) (0.502) (0.380) Resp.Age Sq 0.0001 0.0001 0.0001 0.0001 0.0001 0.0002 0.0000 0.0000 0.0001 (0.442) (0.427) (0.461) (0.463) (0.532) (0.110) (0.466) (0.448) (0.354) Gender 0.0788 0.0744 0.0776 0.1194 0.1116 0.1770 0.0879 0.0778 0.0620 (0.164) (0.187) (0.171) (0.046)** (0.051)* (0.017)** (0.135) (0.181) (0.286) Income 0.0670 0.0730 0.0742 0.0698 0.0512 0.1683 0.0800 0.0950 0.1123 (0.394) (0.350) (0.348) (0.390) (0.515) (0.114) (0.325) (0.240) (0.173) Tradecredit 0.1907 0.1917 0.1954 0.2142 0.1960 0.5105 0.2148 0.2295 0.2488 (0.006)*** (0.000)*** (0.005)*** (0.005)*** (0.010)** (0.002)*** (0.005)*** (0.002)*** (0.001)*** Rura -0.7697 -0.7719 -0.7695 -0.7546 -0.7706 -0.6766 -0.7639 -0.7676 -0.7632 (0.000)*** (0.000)*** (0.000)*** (0.000)*** (0.000)*** (0.000)*** (0.000)*** (0.000)*** (0.000)*** Non-Farming 0.4313 0.4331 0.4320 0.4266 0.4350 0.4589 0.4167 0.4151 0.4255 (0.000)*** (0.000)*** (0.000)*** (0.000)*** (0.000)*** (0.000)*** (0.000)*** (0.000)*** (0.000)*** Constant 1.1197 1.0066 1.3421 0.9653 0.9544 -0.1512 0.8203 0.6864 1.0102 (0.002)*** (0.004)*** (0.002)*** (0.007)*** (0.008)*** (0.848) (0.035)** (0.083)* (0.028)**
Observations 667 667 667 638 663 671 638 638 667 Adj.R.sq. 0.51 Wald=724.25 Adj.R.sq=0.51 Adj.R.sq=0.51 Wald=761.35 Adj.R.sq=0.30 Adj.R.sq=0.51 Wald=686.50 Adj.R.sq.= 0.49 Prob>F 0.000 P>Chi2=0.000 P>F=0.000 P>F=0.000 P>Chi2=0.000 P>F=0.000 P>F=0.000 P>Chi2=0..000 P>F=0.000
Note: The P-values are in parenthesis. ***, ** and * indicate 1%, 5% and 10% significance levels respectively.
48
In order to ensure consistency of results and heteroskedastic consistent estimates, robust standard errors have been performed on the variables. The results of the robust standard
errors do not statistically differ from what is reported here. See Table C.1 in Appendix C for the results of the robust standard errors.
Stellenbosch University https://scholar.sun.ac.za
Stellenbosch University https://scholar.sun.ac.za

130
6.6. CONCLUSION AND IMPLICATIONS
The study has assessed the welfare enhancing ability of microcredit with or without
microinsurance. In particular we asked: does microcredit increase households’ welfare in the
absence of microinsurance? The empirical analyses under Heckman, treatment effect and IV
models indicate a weak association between microcredit and household welfare. However it
improves households’ well-being if combined with microinsurance.
Microcredit may be good, but its real benefits to the poor are best realized if the poverty trapping
risks such as poor health, fire, flood, drought and income shocks which are major obstacles to the
breaking of the poverty cycle are managed with appropriate microinsurance schemes. This finding
underscores the need to advance microcredit and microinsurance to the poor as a single package
instead of separate products. To the extent that microfinance is inextricably linked to households’
welfare, combining microcredit and microinsurance will equip the poor to achieve steady asset
accumulation and make sustainable exit from poverty.
Stellenbosch University https://scholar.sun.ac.za
131
REFERENCES
Abor, J. & Biepke, N. 2006. SMEs access to debt finance: A comparison of male-owned and
female-owned businesses in Ghana. Entrepreneurship and Innovation, 7(2), 105-112.
Adams, D. & Von Pischke, J. D. 1992. Microenterprise credit programs: Dé Jà Vu. World
Development, 20, 1463-1470.
Adjei, J.K., Arun, T. & Hossain, F. 2009. The role of microfinance in asset-building and poverty
reduction: The case of Sinapi Aba Trust of Ghana. Working paper no. 87. Manchester: University
of Manchester, Brooks World Poverty Institute (BWPI).
Afrane, S. 2002. Impact assessment of microfinance interventions in Ghana and South Africa.
Journal of Microfinance, 4(1), 37-58
Annim, S.K., Dasmani, I. & Armah, M. 2011. Does access and use of financial service smoothen
household food consumption? MPRA paper No. 29278. http://mpra.ub.uni-muenchen.de/29278
Accessed: 2 April 2014.
Association of Rural Banks (ARB)/Apex Bank. 2012. Annual reports 2012. Accra: Association of
Rural Banks.
Armendariz, B. & Morduch, J. 2010. The economics of microfinance. 2nd edition. Boston, MA: The
MIT Press.
Asselin, L. M. 2009. Analysis of multidimensional poverty: Theory and case studies. New York, NY:
Springer.
Bank of Ghana. 2007. A note on microfinance in Ghana. Working Paper No. WP/BOG-2007/01.
Accra: Bank of Ghana.
Bank of Ghana. 2006. Bank of Ghana web site. Available: www.bog.gov.gh. Accessed: 3
September 2014.
Bateman, M. 2010. Why doesn’t microfinance work? The destructive rise of local neoliberalism.
London: Zed Books.
Benzécri, J. P. 1973. Data analysis: The correspondence analysis. Volume 2. Paris: Dunod.
Binnendijk, E., Koren, R. & Dror, D. M. 2012. Hardship financing of healthcare among rural poor in
Orissa, India. BMC Health Services Research, 12(23):doi:10.1186/1472-6963/12-23.
Stellenbosch University https://scholar.sun.ac.za

132
Bond, P. & Rai, A. S. 2009. Borrower runs. Journal of Development Economics, 88(2), 185-191.
Booysen, F., Servaas, V. D. B., Ronelle, B., Michael, V. M. & Gideon, D. R. 2008. Using an asset
index to assess trends in poverty in seven sub-Saharan African countries. World Development,
36(6), 1113–1130.
Caplan, J. 2008. Microfinance still hums, despite global financial crisis. Time Magazine. Available:
http://www.time.com/time/business/article Accessed: 4 July, 2014.
Chakrabarty, S. 2012. Does micro credit increase child labour in absence of micro insurance? ILO
Microinsurance Innovation Facility Research Paper No. 12. Geneva: International Labour
Organization (ILO).
Churchill, C. 2007. Insuring the low-income market challenges and solution for commercial
insurers. The Geneva Papers, 32(3), 401–412.
Coleman, B.E. 2006. Microfinance in Northeast Thailand: Who benefits and how much? World
Development, 34(9), 1612-1638.
Coleman, B.E. 1999. The impact of group lending in Northeast Thailand. Journal of Development
Economics, 60, 105-142.
Cull, R., Demirguc-Kunt, A. & Morduch, J. 2009. Microfinance meets the market. Journal of
Economic Perspectives, 23(1), 167-192.
Daley-Harris, S. 2009. State of the microcredit summit campaign report. Washington, DC:
Microcredit Summit.
Dercon, S. 2003. Insurance against poverty. Helsinki: World Institute for Development Economics
Research, United Nations University.
Echevin, D. 2011. Vulnerability to asset-poverty in sub-Saharan Africa. Munich Personal RePEc
Archive, MPRA Paper No. 35660. Available: http://mpra.ub.uni-muenchen.de/35660/. Accessed: 3
March 2013.
Filmer, D. & Scott, K. 2012. Assessing asset indices. Demography, 49(1), 359-392.
Harttgen, K., Klasen, S. & Vollmer, S. 2013. An African growth miracle? Or: What do asset indices
tell us about trends in economic performance? Review of Income and Wealth, 59(S1), S37-S61.
Heckman, J.J. 1979. Sample selection bias as a specification error. Econometrica, 47(1), 135-161.
Stellenbosch University https://scholar.sun.ac.za

133
Heckman, J.J. 1978. Dummy endogenous variables in a simultaneous equation system.
Econometrica, 46(4), 931-959.
Heckman, J.J. 1974. Effects of child-care programs on women’s work effort. Journal of Political
Economy, 82(2), S136-S163.
Hofmeister, S. 1999. Financial Sector Study. Accra: GIZ.
Hulme, D. & Mosley, P. 1996. Finance against poverty: Effective institutions for lending to small
farmers and microenterprises in developing countries. Volume 2. London: Routledge.
International Fund for Agricultural Development (IFAD). 2008. The Republic of Ghana rural and
agricultural finance program. Rome: IFAD.
International Labour Organization (ILO). 2007. Health microinsurance schemes: Monitoring and
evaluation guide. Volume 1 and 2. Geneva: International Labour Organization.
Imai, K. S. & Azam, M. D. S. 2012. Does microfinance reduce poverty in Bangladesh? New
evidence from household panel data, The Journal of Development Studies, 48(5), 633-653.
Imai, K.S., Arun, T. & Annim, S.K. 2010. Microfinance and household poverty reduction: New
evidence from India. World Development, 38(12), 1760-1774.
Janzen, S.A. & Carter, M.R. 2013. The impact of microinsurance on asset accumulation and
human capital investments: Evidence from a drought in Kenya. ILO Microinsurance Innovation
Facility Research Paper No. 31. Geneva: International Labour Organization.
Johnston, D. & Abreu, A. 2013. Asset indices as a proxy for poverty measurement in African
countries: A reassessment. The Conference of African Economic Development: Measuring
Success and Failure, 18–20 April, 2013, Simon Fraser University, Vancouver, Canada.
Khandker, S.R. 2005. Microfinance and poverty: Evidence using panel data from Bangladesh. The
World Bank Economic Review, 19(2), 263-286.
King, R. & Levine, R. 1993. Finance and growth: Schumpeter might be right. Quarterly Journal of
Economics, 108, 717-738.
Kondo, T., Orbeta, A.J., Dingcong, C. & Infantado, C. 2008. Impact of microfinance on rural
households in the Philippines. Institute of Development Studies, 39(1), 51-70.
Knoop, T. A. 2013. Global finance in emerging markets economies. New York, NY: Routledge,
Taylor and Francis Group.
Stellenbosch University https://scholar.sun.ac.za

134
Kwon, W. J. 2010. An analysis of organizational, market and socio-cultural factors affecting the
supply of insurance and other financial services by microfinance institutions in developing
economies. The Geneva Papers on Risk and Insurance: Issues and Practice, 35, 130-160.
Labie, M. 2009. Microfinance: developments in the sector, commodity diversification and
governance. Reflets et Perspectives de la vie Économique, 47(3), 5-6.
Lin, W. 2007. Models with self-selection. Available at: http://www.wanchuanlin.org/Lecture,
Accessed: 27 August 2013.
Mahjabeen, R. 2008. Microfinance in Bangladesh: Impact on households’ consumption and
welfare. Journal of Policy Modeling, 30, 1083-1092.
Makina, D. & Malobola, L.M. 2004. Impact assessment of microfinance programmes, including
lessons from Khula Enterprise Finance. Development Southern Africa, 21(5), 799-814.
Morduch, J. 2006. Microinsurance: The next revolution? In Banerjee, A.V., Benabou, R. &
Mookherjee, D. (eds.), Understanding poverty, 337-356. New York, NY: Oxford University Press.
Morduch, J. 2004. Microinsurance: The next revolution? New York, NY: Oxford University Press.
Morduch, J. 1998. Does microfinance really help the poor? New evidence from flagship programs
in Bangladesh. Department of Economics, Harvard University and HIID/Stanford University,
Hoover Institution.
Mpuga, P. 2004. Demand for credit in rural Uganda: Who cares for the peasants? Paper presented
at the Centre for the Study of Africa Economies, Oxford University, 21-22 March.
Nanor, M.A. 2008. Microfinance and its impact on selected districts in Eastern Region of Ghana.
Kumasi: Kwame Nkrumah University of Science and Technology.
Njong, A.M. & Ningaye, P. 2008. Characterizing weights in the measurement of multidimensional
poverty: An application of data-driven approaches to Cameroonian data. OPHI Working Paper No.
21. Available: http://www.ophi.org.uk/wp21. Accessed: 8 September 2014.
Pitt, M. & Khandker, S. 1998. The impact of group-based credit programs on poor households in
Bangladesh: Does the gender of participants matter? Journal of Political Economy, 106(5), 958-
996.
Stellenbosch University https://scholar.sun.ac.za

135
Pitt, M. & Khandker, S. 1996. Household and intra-household impact of the Grameen Bank and
similar targeted programs in Bangladesh. Discussion Paper No. 320. Washington, DC: World
Bank.
Pitt, M., Khandker, S. & Cartwright, J. 2006. Empowering women with micro finance: Evidence
from Bangladesh. Economic Development and Cultural Change, 54(4), 791-831.
Pitt, M., Khandker, S., Choudhury, O. & Millimet, D. 2003. Credit programs for the poor and the
health status of children in rural Bangladesh. International Economic Review, 44, February, 87-
118.
Pitt, M., Khandker, S., McKernan, S.M. & Latif, M.A. 1999. Credit programs for the poor and
reproductive behavior in low income countries: Are the reported causal relationships the result of
heterogeneity bias? Demography, 33, February, 1-21.
Rogaly, B. 1996. Microfinance evangelism, ‘destitute women’ and the hard selling of a new anti-
poverty formula. Development in Practice, 6(2), 100-112.
Rossel-Cambier, K. 2012. Can combined microfinance boost economic results? An empirical
cross-sectional analysis. Review of Economics and Finance, 2(3), 79-94.
Sahn, D.E. & Stifel, D.C. 2000. Poverty comparisons over time and across countries in Africa.
World Development, 28(2), 2123-2155.
Schuler, S.R., Hashemi, S.M. & Riley, A.P. 1997. The influence of women’s changing roles and
status in Bangladesh’s fertility transition: Evidence from a study of credit programs and
contraceptive use. World Development, 25(4), 563-576.
Sharma, M. & Zeller, M. 1997. Repayment performance in group-based credit programs in
Bangladesh: An empirical analysis. World Development, 25(10), 1731-1742.
Smith, J.P. 1998. Socioeconomic status and health. The American Economic Review, 88(2), 192-
196.
Tagoe, N., Nyarko, E. & Anuwa-Amarh, E. 2005. Financing challenges facing urban SMEs under
financial Sector liberalization. Journal of Small Business Management, 43(3), 331-343.
Van Kerm, P. 1998. Simple and multiple correspondence analysis in Stata. Stata Technical
Bulletin, 42, 210-217.
Wooldridge, J.M. 2002. Econometric analysis of cross section and Panel data. London: MIT Press.
Stellenbosch University https://scholar.sun.ac.za
136
CHAPTER 7
THE CONCLUSION AND POLICY RECOMMENDATIONS
7.1. INTRODUCTION
This research is a collection of essays which have examined the welfare benefits of
microinsurance from the perspective of Ghana. Specifically the research sought to evaluate the
impact of microinsurance on household asset accumulation, and tested whether microinsurance is
a viable alternative for coping with risk and for smoothing consumption. The thesis also examined
the asset inequality levels of insured and uninsured households and then tested whether
microinsurance has any effect on the levels of inequality. Finally it tested whether households gain
positive synergy by combining microinsurance and microcredit.
Using data on household living standards from the 2010 FINSCOPE survey, the impact evaluation
was undertaken through Heckman sample selection, treatment effects model and instrumental
variable modelling. Each of these methods provides a unique benefit to the whole impact
estimations. For instance, both the Heckman and treatment models control for selection bias,
however whereas the Heckman model uses the observed variables of only the insured to
undertake the estimations, the treatment effect model uses the observed variables of both insured
and uninsured households. The instrumental variable model controls for endogeneity bias by using
the unobserved characteristics of both the insured and the uninsured for the empirical estimations.
Together the three models provide results which are consistent and reliable.
On the whole the study makes a unique contribution to the literature in three main ways. First,
income has been used quite extensively in welfare economics to measure the level of wealth and
welfare. However, incomes, particularly of informal sector workers, are known to be seasonal and
suffer from mis-measurement and recall bias (Moser & Felton, 2007; McKenzie, 2004). The
accuracy of household income is also hindered by households’ reluctance to divulge sensitive
information concerning their income and expenditure levels. In order to overcome these challenges
associated with income and expenditure data, this study used an asset index created through
multiple correspondence analyses to measure the welfare levels of low-income households.
Although asset indexes have been used in the mainstream welfare economics, this study is one of
the pioneers in the application of the concept in the microinsurance field.
Second, the study initiates a new dimension to the debate and controversies in the microfinance
literature by asking whether households using microcredit in combination with microinsurance
derive more significant welfare benefits than those using only microcredit schemes. Third,
microinsurance schemes have been on the Ghanaian market for more than a decade, however
Stellenbosch University https://scholar.sun.ac.za

137
there has not been any empirical investigation into their impact on household welfare. This
research thus addresses this urgent need by providing valuable empirical knowledge needed not
only for the growth and development of the sector, but most importantly for improving the welfare
of low-income households. The information is also very timely and an important input to the
National Insurance Commission’s intention to amend the policy guidelines on microinsurance in
order to make it more relevant to the conditions of low-income households.
7.2. SUMMARY OF THE FINDINGS
The impact of microinsurance on asset accumulation presented in Table 3.8 indicates that insured
households derived positive significant gains from microinsurance through the protection of their
assets against risks. The indemnity cover under microinsurance empowers low-income households
to engage in high risk high yielding ventures necessary for the accumulation of essential assets.
More importantly, the results indicate that the pay-out received if an insurable risk occurs prevents
asset pawning. This implies that microinsurance protects households against asset liquidation
during times of emergency.
The empirical evidence presented in Table 4.3 also reveals that households undertake better
consumption smoothing through the use of microinsurance schemes. Specifically, insured
households are on average 19-22 percent less likely to forgo daily meals when faced with an
income shock. Sacrificing the quality and quantity of food can have pernicious and irreversible
consequences on the health of household members, especially children. To the extent that
microinsurance eliminates the tendency to cut meals, it promotes healthy living necessary for
household development.
With respect to the level of asset inequality within and between the insured and the uninsured
households, the analysis under the Gini index shows that insured households have lower levels of
asset inequality. More importantly, insured female-headed households have lower inequality than
insured male-headed households. But uninsured female-headed households are worse off than
both uninsured and insured male-headed households. The geographical dimension shows that
insured rural dwellers have lower asset inequality than the rural uninsured. However, the analyses
of Northern and Brong Ahafo regions reveal that large developmental gaps may limit the effect of
microinsurance in closing the asset inequality gap.
Finally, the study examined the scenarios where some households use only microcredit while
others use microcredit in combination with microinsurance. The findings suggest a weak influence
of microcredit on household welfare. However households using microcredit in combination with
microinsurance derive significant gains in terms of welfare improvement. Microcredit may be good,
Stellenbosch University https://scholar.sun.ac.za

138
but its real benefits to the poor are best realised if the poverty trapping risks are covered with
microinsurance.
In all the findings of the four empirical papers corroborate each other by confirming the theoretical
underpinnings that indeed microinsurance improves the welfare of low-income households.
7.3. CONCLUSION
The combined evidence reveals quite strongly that microinsurance is a very good risk management
instrument for improving the welfare of low-income households through asset retention, proper
consumption smoothing, reduction in asset inequality and the derivation of positive synergies from
microcredit.
7.4. RECOMMENDATIONS
The thesis recommends some policy interventions necessary for welfare enhancement through
microinsurance schemes. The welfare benefits of microinsurance can be widened to cover more
low-income households if the barriers to the uptake of microinsurance are eliminated. Barriers such
as lack of substantive legislative backing need to be addressed expeditiously to encourage more
insurance firms to enter the microinsurance sector. Of the 44 life and non-life insurance companies
in Ghana only 11 are providing microinsurance schemes to the informal sector. Addressing the
regulation obstacles may incentivize many more insurers to enter this largely untapped segment of
the insurance industry.
There is also a need to upscale microinsurance to enable low-income households to participate
and benefit to a larger extent. The key issue is to ensure a design that reduces transaction costs
and makes it relatively less expensive to enhance significant participation. Achieving depth and
large scale extension in a cost effective manner can be done through the use of mobile phone
technology. The concept of mobile banking has proven to be cost effective in extending banking
services to millions of poor households who were previously excluded from formal banking at a low
transaction cost. “Mobile microinsurance” can be designed along the lines of the mobile banking
concept to meet the specific needs of microinsurance transactions at a lower cost, and also result
in a lower cost of premium and greater accessibility and depth. Already two mobile companies
have started bundling microinsurance with their services. A formal public policy and regulatory
backing by the NIC and key stakeholders such as the National Communication Authority will
increase the confidence of the public in “mobile microinsurance” and possibly encourage other
entities to venture into it. This will not only increase the uptake of microinsurance, but it will also
equip low-income households to protect their assets against risk, escape consumption poverty and
gradually bridge the asset inequality gap.
Stellenbosch University https://scholar.sun.ac.za
139
The upscaling of microinsurance amongst low-income households can also be enhanced by
increasing the density and spread of microinsurance providers. The NIC can encourage more
insurers to enter the microinsurance market by setting a different initial regulatory capital for
microinsurance providers. Currently the regulatory capital is set at US$5 million for every insurance
company irrespective of class of business or size. Requiring all insurers, either life, non-life or
microinsurance providers, to start with the same capital may discourage some insurers from
entering the microinsurance sector and will also not help in increasing the scale of uptake from low
income households. Therefore to encourage more insurers to enter the microinsurance sector, the
NIC can use its regulatory powers to lower the regulatory capital for prospective microinsurers.
This will reduce the entry cost of microinsurance and increase the number of providers who can
provide these services at a lower premium and thereby attract more low income households. The
regulatory capital incentive can also be structured to be more favourable to institutions willing to
locate in rural and semi-urban areas with high densities of low-income households. Such
incentives can encourage significant entry into the industry and also help spread the provision of
microinsurance at a relatively lower setup cost to low-income households and result in higher
uptake.
In addition microinsurance can be a better enabler for reduction in asset inequality if institutional
and developmental gaps are dealt with. Institutional and developmental deficits, such as
inadequate hospitals and insurance companies in Brong Ahafo and the three Northern regions
have reduced the influence of microinsurance, especially the national health insurance scheme, on
asset inequality. It is therefore imperative for the government to initiate policies that will bridge the
developmental gaps and increase the access of microinsurance services in these regions.
Microfinance providers can add more to clients’ value if they exploit the positive synergies between
microcredit and microinsurance by designing products which tie the two products into a single
scheme. This requires going beyond the usual credit life products into products that provide credit
as well as cover health, fire, drought, theft and disability. To the extent that microfinance is
inextricably linked to households’ welfare, combining microcredit and microinsurance will equip the
poor to achieve steady asset accumulation and make a sustainable exit from poverty.
Sometimes welfare intervention programs suffer major setbacks when the recipients encounter
risky events such as crop failure, fires and other shocks. These uninsured shocks can draw the
recipients who may otherwise be above the poverty line back into poverty, thereby erasing any
meaningful gains made under the welfare intervention. It is therefore essential that the
beneficiaries of welfare programs are properly insured against the very risk that impoverishes
them. This demands a policy that will integrate microinsurance into the government’s strategy on
poverty reduction. Integrating microinsurance into the government poverty reduction strategy will
Stellenbosch University https://scholar.sun.ac.za

140
promote a sustainable reduction in poverty and facilitate a systematic empowerment of low-income
households to achieve welfare improvements.
Future studies may consider using panel data (where such data is available) to analyse the
dynamic influence of microinsurance on household welfare. The availability of panel data may also
allow the application of other impact methods such as difference-in-difference to estimate the
before and after effects of microinsurance on household welfare.
Stellenbosch University https://scholar.sun.ac.za

141
APPENDIX A:
ROBUST STANDARD ERRORS: ASSET ACCUMULATION
Table A.1: Heteroskedasticity Robust Standard Errors: Asset Accumulation
Variables Heckman IV
Microinsurance 0.0712 0.1899
(0.355) (0.053)**
Microcredit -0.0035 -0.0081
(0.950) (0.886)
Inv.Mills ratio -0.0589
(0.331)
Not Married -0.0938 -0.0935
(0.112) (0.114)
Education 0.1772 0.1771
(0.000)*** (0.000)***
T_HH_Size -0.0605 -0.0614
(0.000)*** (0.000)***
HH Size≥15 0.0706 0.0712
(0.006)*** (0.005)***
Resp.Age -0.0076 -0.0072
(0.502) (0.526)
Resp.Age Sq 0.0001 0.0001
(0.457) (0.478)
Male 0.0786 0.0771
(0.162) (0.172)
Income 0.0666 0.0732
(0.422) (0.374)
Tradecredit 0.1895 0.1927
(0.004)*** (0.004)***
Rural -0.7700 -0.7703
(0.000)*** (0.000)***
Non-Farming 0.4312 0.4318
(0.000)*** (0.000)***
Constant 1.1240 1.3546
(0.002)*** (0.001)***
Observations 667 667
Adj. R-Squ. 0.52 0.52
P>F 0.000 P>F=0.000
Note: ***, ** and * indicate 1%, 5% and 10% significance levels respectively.
Source: Author’s computation based on the 2010 Finscope data of Ghana.
Stellenbosch University https://scholar.sun.ac.za

142
APPENDIX B:
SELECTION BIAS TEST
Table B.1: The Selection Bias Test, Heckman Model
Asset Index Coeff Std. Error P-Value
Microinsurance 0.0712 0.0743 0.338 Inverse Mills Ratio -0.0589 0.0609 0.333 Microcredit -0.0035 0.0572 0.951 Not Married -0.0938 0.0598 0.118 Male 0.0786 0.0567 0.166 Resp. Education Level 0.1772 0.0145 0.000*** Resp. Age -0.0076 0.0112 0.495 Resp. Age Square 0.0001 0.0001 0.446 Total HH Size -0.0605 0.0148 0.000*** HH Size ≥ 15 Yrs 0.0706 0.0249 0.005*** Income 0.0666 0.0788 0.166 Trade Credit 0.1895 0.0720 0.009*** Non-Farming 0.4313 0.0665 0.000*** Rural -0.7700 0.0643 0.000*** Constant 1.1240 0.3728 0.003***
Observations 676 Adj. R-Square 0.51 Prob >F = 0.000
***, ** and * represent 1, 5 and 10 significance levels respectively.
Source: Author’s computation based on 2010 Finscope data of Ghana.
Stellenbosch University https://scholar.sun.ac.za

143
APPENDIX C:
ROBUST STANDARD ERRORS: MICROCREDIT AND MICROINSURANCE
Table C.1: Heteroskedasticity Robust Standard Errors: Microcredit and Microinsurance
Variables Microinsurance Only Microcredit Only Microcredit and Microinsurance Together
Heckman IV Heckman IV Heckman IV
Microinsure Only 0.0710 0.1909 (0.354) (0.050)** Microcredit Only 0.0026 0.9779 (0.968) (0.020)** Insure_Credit 0.1523 0.5085 (0.037)** (0.006)*** Inv.Mills Ratio -0.0589 -0.0389 -0.0125 (0.331) (0.442) (0.776) Not Married -0.0938 -0.0936 -0.0607 -0.0852 -0.1020 -0.1075 (0.112) (0.114 (0.020)** (0.005)*** (0.093)* (0.074)* Education 0.1772 0.1770 0.1822 0.1769 0.1815 0.1716 (0.000)*** (0.000)*** (0.000)*** (0.000)*** (0.000)*** (0.000)*** T_HH_Size -0.0605 -0.0615 -0.0575 -0.0662 -0.0602 -0.0668 (0.000)*** (0.000)*** (0.000)*** (0.000)*** (0.000)*** (0.000)*** HH Size≥15yrs 0.0706 0.0712 0.0647 0.0663 0.0691 0.0753 (0.006)*** (0.005)*** (0.015)** (0.027)** (0.009)*** (0.003)*** Resp.Age -0.0077 -0.0073 -0.0049 -0.0193 -0.0071 -0.0100 (0.498) (0.518) (0.665) (0.193) (0.542) (0.387) Resp.Age Sq 0.0001 0.0001 0.0001 0.0002 0.0000 0.0001 (0.453) (0.471) (0.472) (0.115) (0.474) (0.365) Gender 0.0788 0.0776 0.1194 0.1770 0.0879 0.0620 (0.161) (0.170) (0.041)** (0.014)** (0.129) (0.285) Income 0.0670 0.0742 0.0698 0.1683 0.0800 0.1123 (0.418) (0.366) (0.418) (0.126) (0.353) (0.192) Tradecredit 0.1907 0.1954 0.2142 0.5105 0.2148 0.2488 (0.003)*** (0.002)*** (0.001)*** (0.001)*** (0.001)*** (0.000)*** Rural -0.7697 -0.7695 -0.7546 -0.6766 -0.7639 -0.7632 (0.000)*** (0.000)*** (0.000)*** (0.000)*** (0.000)*** (0.000)*** Non-Farming 0.4313 0.4320 0.4266 0.4589 0.4167 0.4255 (0.000)*** (0.000)*** (0.000)*** (0.000)*** (0.000)*** (0.000)*** Constant 1.1197 1.3421 0.9653 -0.1512 0.8203 1.0102 (0.001)*** (0.002)*** (0.005)*** (0.846) (0.027)** (0.026)**
Observations 667 667 638 671 638 667 R.sq. 0.52 R.sq=0.52 R.sq=0.52 R.sq=0.31 R.sq=0.52 R.sq.= 0.50 Prob>F 0.000 P>F=0.000 P>F=0.000 P>F=0.000 P>F=0.000 P>F=0.000
The P-values are in parenthesis. ***, ** and * indicate 1%, 5% and 10% significance levels respectively.
Stellenbosch University https://scholar.sun.ac.za
Stellenbosch University https://scholar.sun.ac.za