Domestic violence and its impact on fertility behavior: Evidence from Nationally Representative...
29
Domestic violence and its impact on fertility behavior: Evidence from Nationally Representative Household Survey Data in India A.K. Sharma 1 and Niharika Tripathi 2 1. Professor, Humanities and Social Sciences Department, Indian Institute of Technology Kanpur, India. E-mail:[email protected] 2. Doctoral Student at International Institute for Population Sciences, Mumbai, India. E-mail: [email protected] Introduction Regional differences in demographic behaviour in India have been a subject of great interest among policy makers, demographers and other social scientists. These differences have been explained largely within the framework of demographic transition theory and its various offshoots such as social development hypothesis. There have also been some explanations in terms of the variations in the nature of family. Evidence shows that due to greater prevalence of consanguineous marriage and other cultural differences, families on the south of the Vindhyachal Mountain Range are more egalitarian and informed, and this has reduced fertility to replacement level faster. Beginning 1998, two National Family Health Surveys (NFHS-II and NFHS-III) have produced detailed data on physical, emotional and sexual violence against women. These data establish that the states where more women report experience of violence are also the states which show a rather sluggish change towards replacement level fertility. This is true for almost all states of both northern
Transcript of Domestic violence and its impact on fertility behavior: Evidence from Nationally Representative...
Domestic violence and its impact on fertility behavior:Evidence from Nationally Representative Household Survey Data in India
A.K. Sharma1 and Niharika Tripathi2
1. Professor, Humanities and Social Sciences Department, IndianInstitute of Technology Kanpur, India. E-mail:[email protected]
2. Doctoral Student at International Institute for PopulationSciences, Mumbai, India. E-mail: [email protected]
Introduction
Regional differences in demographic behaviour in India have been
a subject of great interest among policy makers, demographers and
other social scientists. These differences have been explained
largely within the framework of demographic transition theory and
its various offshoots such as social development hypothesis.
There have also been some explanations in terms of the variations
in the nature of family. Evidence shows that due to greater
prevalence of consanguineous marriage and other cultural
differences, families on the south of the Vindhyachal Mountain
Range are more egalitarian and informed, and this has reduced
fertility to replacement level faster. Beginning 1998, two
National Family Health Surveys (NFHS-II and NFHS-III) have
produced detailed data on physical, emotional and sexual violence
against women. These data establish that the states where more
women report experience of violence are also the states which
show a rather sluggish change towards replacement level
fertility. This is true for almost all states of both northern

and southern India. Tamil Nadu is an exception where violence
against women is high but fertility level is relatively low.
These data raise three questions which are not yet adequately
answered: (a) What explains the differences in violence between
different states of India? (b) Why does violence decelerate the
speed of demographic transition? (c) Why is Tamil Nadu a deviant
case of violence-fertility relationship? Using secondary data and
Malinowski’s concept of reciprocity this paper attempts to answer
these questions. It is hypothesized that apart from socio-
economic explanations violence against women exercises an
independent effect on fertility by creating a need for help which
perceivably comes from children. Since women are not expected to
commit violence against husband they may reciprocate to violence
by producing more children, rationally or in frustration. If they
reciprocate rationally, women may seek to reduce the power of the
husband by expanding the family size, and this seems to be true
for both nuclear and joint families. If they reciprocate in
frustration, women show the greater acceptance of risk behavior
abandoning social mobility considerations.
Demographic transition in India
India is fast approaching the below replacement fertility. SRS
report published in 2011 exhibit that the Total Fertility Rate
(TFR) of India in year 2009 is estimated to be 2.6. Table 1 shows
the SRS estimates of Total Fertility Rates (TFR) for various
states of India. The table also shows that the differences
between urban and rural areas are along expected lines: the rural
TFR (2.9) being .9 points higher than the urban TFR (2.0).
Interestingly, the urban areas of India have already attained the
replacement level fertility and the ideas and institutions which
have produced this phenomenon in urban setting are fast diffusing
to rural areas. The most interesting fact is that out of 20
bigger states nine have already attained a below replacement
fertility. Further, there is no state which has a TFR of 4 or
more now. There is a very high correlation between urban and
rural TFR (.83), and urban and rural Total Marital Fertility Rate
(TMFR) (.73), implying that in all those states in which urban
fertility has declined rural fertility has also declined. Kerala
has the lowest TFR (1.7) and in both urban and rural areas TFR in
Kerala remains around 1.7 (Sharma, 2012). It is particularly
interesting to note that in urban areas of some other states
fertility has almost gone down to North European level: urban TFR
in Himachal Pradesh (1.3) and West Bengal (1.3) is much below the
Kerala level. As the urban ideas and institutions are diffusing
to rural areas, can we say that India is moving towards a low TFR
of 1.3 and the country planners have to be ready to face
consequences of this transition? There is no denying the fact
that demographic transition in India is now a regional issue and
different States have a different explanation of the rate of
fertility decline true to specific socio-economic and cultural
context.

TABLE 1: TOTAL FERTILITY RATE (TFR) BY RESIDENCE, INDIA ANDBIGGER STATES, 2009
India and bigger
States
Total Rural Urban
India 2.6 2.9 2.0Andhra Pradesh 1.9 2.0 1.6Assam 2.6 2.8 1.6Bihar 3.9 4.0 2.8Chhattisgarh 3.0 3.2 2.0Delhi 1.9 2.0 1.9Gujarat 2.5 2.8 2.1Haryana 2.5 2.6 2.2Himachal Pradesh 1.9 1.9 1.3Jammu & Kashmir 2.2 2.4 1.4Jharkhand 3.2 3.4 2.2Karnataka 2.0 2.2 1.7Kerala 1.7 1.7 1.8Madhya Pradesh 3.3 3.6 2.3Maharashtra 1.9 2.1 1.8Orissa 2.4 2.5 1.6Punjab 1.9 1.9 1.7Rajasthan 3.3 3.6 2.5Tamil Nadu 1.7 1.8 1.7Uttar Pradesh 3.7 3.9 3.0West Bengal 1.9 2.1 1.3
Causes of fertility transition at state levels

Demographic transition in the world has been a well researched
area. Several theories of transition have been offered and a
review of them is beyond the scope of this paper. Some main
factors which have been posited as causing the demographic
transition in different settings are as follows:
Improvement in mortality
Industrialization, urbanization and economic development
Modernization and westernization affecting the calculus of
wealth flow between generations
Social development covering a broad range of factors such as
literacy, increase in age of marriage, status of women and
social mobility
Role of state and family planning program
Information, education and communication
Fertility transition in India is also analyzed in terms of the
same factors. All the above factors have played some role in
reducing fertility directly or indirectly. However, different
factors may have contributed to fertility reduction varyingly in
different states (Sharma, 2011). Gender equality has been
hypothesized to be one important factor causing north-south
differences in fertility trends (Dyson and Moore, 1983).
Domestic violence: a neglected issue
Domestic violence is a new issue in sociology. In the recent past
some literature has emerged on violence against women, i.e.,
women who have been the victim of domestic violence (Cavanagh,
2012).
Possibility of relationship between violence and fertility:
evidence from macro data
As early as 1965 Irawati Karve had shown that Indian family shows
significant regional variations. She divided them family system
of India into three categories: Indo-European or Sanskritic;
Dravidian; and Mundari organizations of kinship – Austro Asiatic.
Later on using a more geographic criterion she divided family
system into four categories: Northern; Central; Southern; and
Eastern. Analysis of fertility data in India, right from the
beginning, has focused on area-specific differences in fertility
which was attributed to difference in family and differences in
status of women. However, there was a lack of data on domestic
violence or violence against women in the family set up.
There are reasons to associate domestic violence with fertility.
Domestic violence can be assumed to be associated with almost all
social and behavioral aspects of fertility: efficacy, planning,
self esteem, husband-wife communication, structured objectives,
knowledge of family planning methods, health seeking behavior,
locus of control and value of child. In the condition of
empowerment women are more likely to share family concerns with
husband and are more likely to plan everything including family.
In absence of empowerment women are more likely to be alienated,

frustrated, withdrawn, lacking in planning and efficacy. In
Indian patriarchal society women victims may try to gain power
over husband by producing more babies. However, these are only
unconfirmed ideas. There is a need for rigorously planned
researches to test them.
For the first time National Family Health Survey-2: 1998-99
collected data on attitudes towards and experience of domestic
violence as part of ‘background characteristics of respondents’.
The results showed that in India 56.3 percent of women
respondents agreed with at least one reason for justifying a
husband beating his wife. The reasons arranged according to
frequency of response are: wife neglects house or children; wife
goes out without telling husband; wife shows disrespect for in-
laws; husband suspects that wife is unfaithful; wife does not
cook food properly; and natal family does not give money or other
items. The report said: ‘In patriarchal societies such as India,
women are not only socialized into being silent about their
experience of violence but traditional norms teach them to
accept, tolerate, and even rationalize domestic violence’ (IIPS,
2000). The analysis of data on experience revealed that 21.0
percent of ever married women were beaten or physically
mistreated by their husband, in-laws or other persons since age
15 (most of them by husband); 11.0 percent had been beaten or
physically mistreated in the past 12 months. Illiteracy, rural
residence, age, nuclear household, poverty, and working for cash
seemed to aggravate violence. The report also said: ‘The
percentage of women beaten in the 12 months preceding the survey
varies from less than 5 percent in Himachal Pradesh and Kerala to
more than 15 percent in Bihar, Arunachal Pradesh, Tamil Nadu and
Nagaland.
NFHS-3 (IIPS, 2007) produced extensive data on domestic violence
in India by using more valid measures of violence. It showed that
33.5 percent women, aged 15-49, had ever experienced physical
violence since age 15. Further, 15.8 percent of all women, aged
15-49, included in the survey, had ever experienced emotional
violence, 35.1 percent had experienced physical violence and 10.0
percent had experienced sexual violence. Overall, 39.7 percent
women had experienced violence in some form or the other
physical, emotional or sexual, mostly from their spouse. Although
the data from the two surveys – NFHS-2 and NFHS-3 – are not
strictly comparable but they suggest that there is a rise in the
incidence of domestic violence. Like NFHS-2 NFHS-3 also revealed
that illiteracy, rural residence, age, nuclear household,
poverty, and working for cash seemed to aggravate violence.
Regarding the state-wise variations the report also said: ‘The
prevalence of physical or sexual violence ranges from 6 percent
and 13 percent in Jammu and Kashmir and Meghalaya, to 46 percent
in Madhya Pradesh and Rajasthan and 59 percent in Bihar.’
Further, the data establish that the states where more women
report experience of violence are also the states which show a
rather sluggish change towards replacement level fertility. This
is true for almost all states of both northern and southern
India. Tamil Nadu is an exception where violence against women is
high but fertility level is relatively low.
Violence against women is part of patriarchal structure of Indian
society. Demographers maintained that due to differences in
status of women States to the south of Vindhyachal mountains had
lower fertility than the States on the north where patriarchy was
particularly strong. Although it is fraught with a risk to
generalize for whole India, in much of the 20th century due to
the influences of religious conversions and reforms and processes
of modernization even the other forms of family, such as the
Khasi family of the North East and the Nair family of Kerala,
have moved towards the all-India, patrilocal, patriarchal and
patrilineal model. various forms of violence by the husband,
independent of other causes of fertility decline. Therefore, it
is imperative that forgetting the differences in development of
patriarchy in different regions an analysis is done of the
relationship between domestic violence and fertility.
In order to test the reliability of data on violence the inter-
correlations between different indicators of violence may be
calculated from the State level data. Table 2 shows the inter-
correlations between different indicators of violence. All
correlations are statistically significant at 1 percent level for
both one-tailed and two-tailed tests.
TABLE 2: INTERCORRELATIONS BETWEEN INDICATORS OF VIOLENCE
Emotionalviolence
Physicalviolence
Sexualviolence
Any form ofviolence –
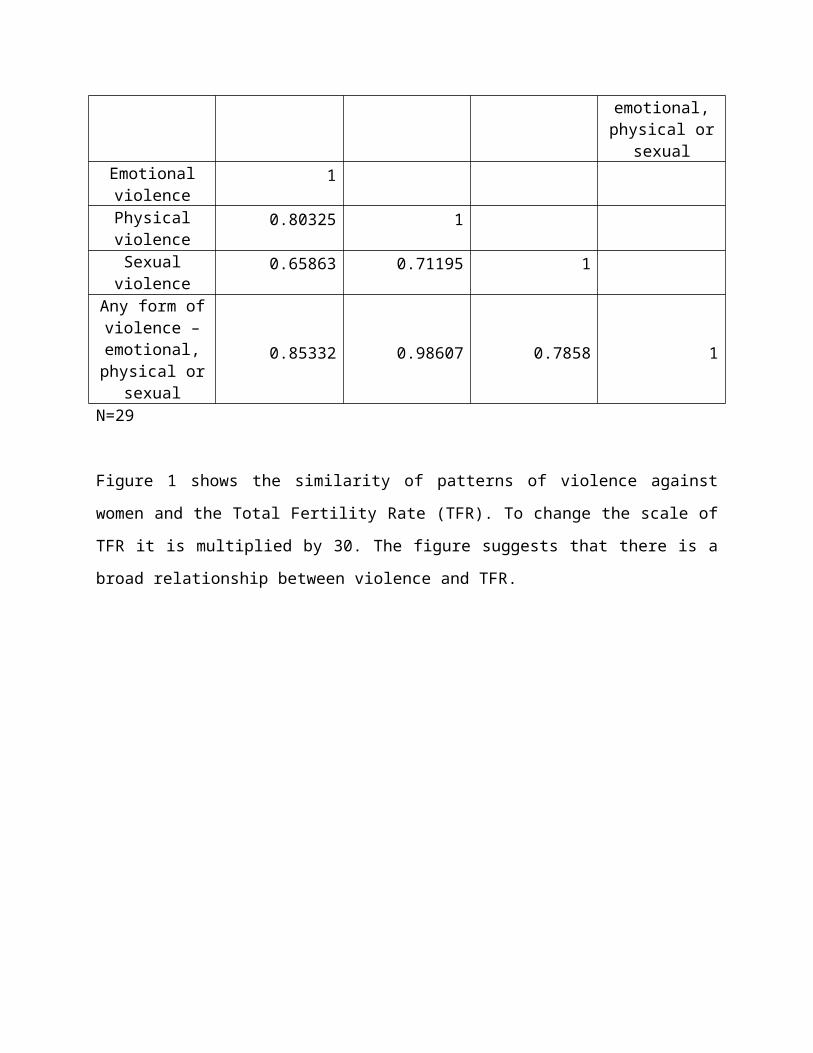
emotional,physical or
sexual Emotionalviolence
1
Physicalviolence
0.80325 1
Sexualviolence
0.65863 0.71195 1
Any form ofviolence –emotional,physical or
sexual
0.85332 0.98607 0.7858 1
N=29
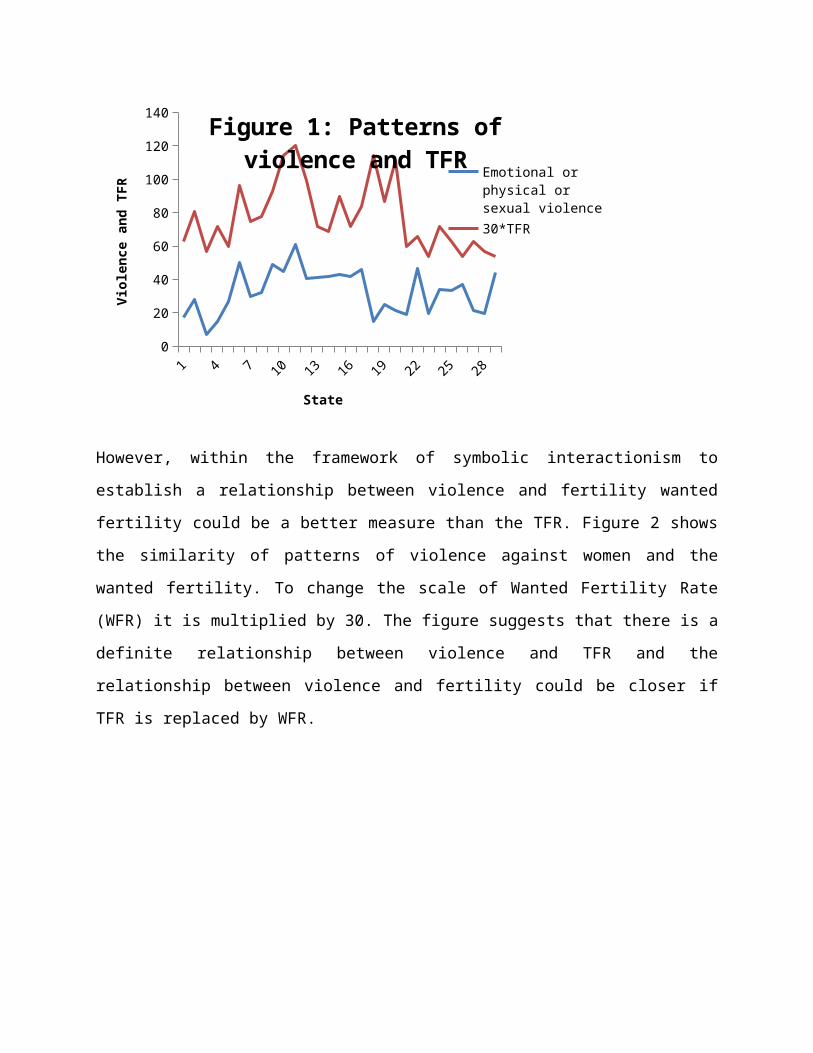
Figure 1 shows the similarity of patterns of violence against
women and the Total Fertility Rate (TFR). To change the scale of
TFR it is multiplied by 30. The figure suggests that there is a
broad relationship between violence and TFR.
1 4 7 10 13 16 19 22 25 280
20
40
60
80
100
120
140 Figure 1: Patterns of violence and TFR Emotional or
physical or sexual violence30*TFR
State
Violence and TFR
However, within the framework of symbolic interactionism to
establish a relationship between violence and fertility wanted
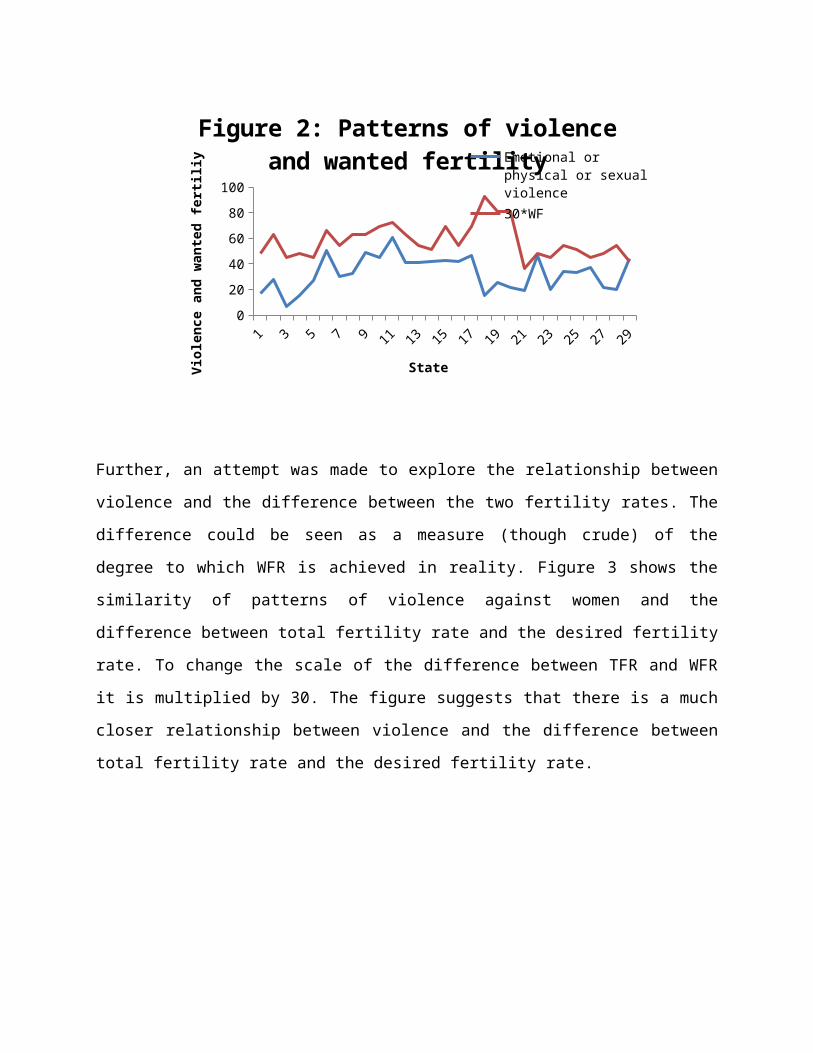
fertility could be a better measure than the TFR. Figure 2 shows
the similarity of patterns of violence against women and the
wanted fertility. To change the scale of Wanted Fertility Rate
(WFR) it is multiplied by 30. The figure suggests that there is a
definite relationship between violence and TFR and the
relationship between violence and fertility could be closer if
TFR is replaced by WFR.
1 3 5 7 9 11 13 15 17 19 21 23 25 27 29020406080100
Figure 2: Patterns of violence and wanted fertilityEmotional or
physical or sexual violence30*WF
StateViolence and wanted fertiliy
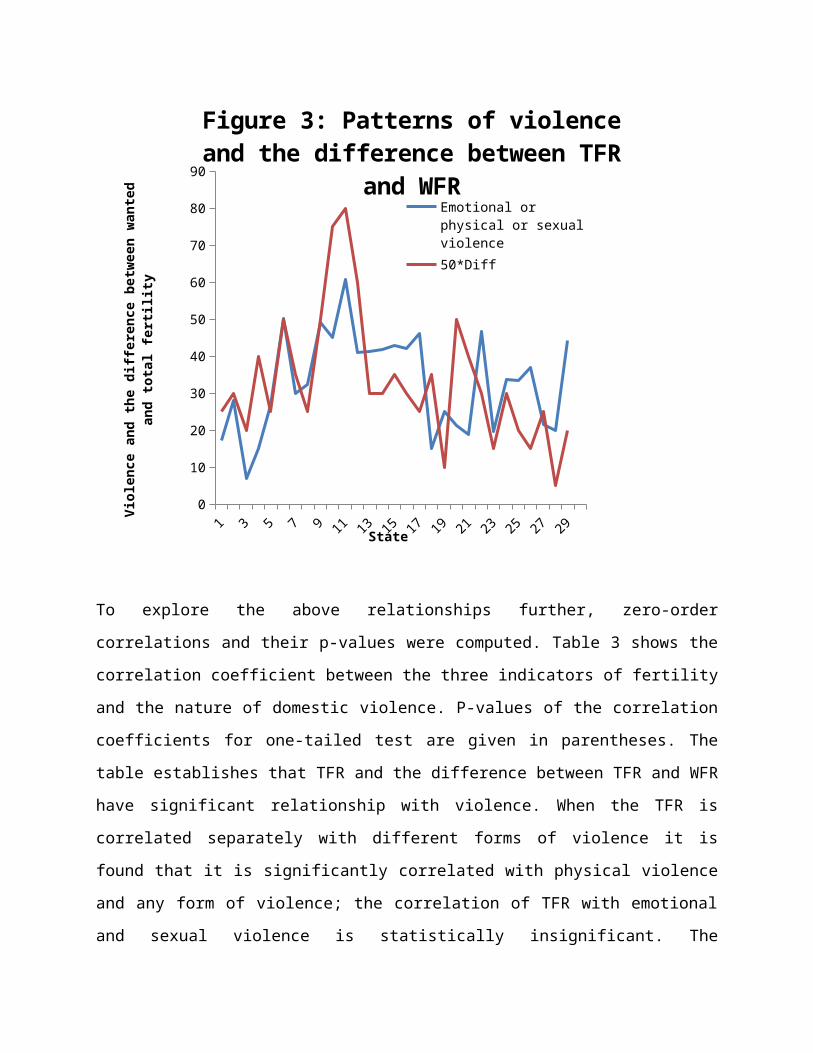
Further, an attempt was made to explore the relationship between
violence and the difference between the two fertility rates. The
difference could be seen as a measure (though crude) of the
degree to which WFR is achieved in reality. Figure 3 shows the
similarity of patterns of violence against women and the
difference between total fertility rate and the desired fertility
rate. To change the scale of the difference between TFR and WFR
it is multiplied by 30. The figure suggests that there is a much
closer relationship between violence and the difference between
total fertility rate and the desired fertility rate.
1 3 5 7 9 11 13 15 17 19 21 23 25 27 290
10
20
30
40
50
60
70
80
90
Figure 3: Patterns of violence and the difference between TFR
and WFREmotional or physical or sexual violence50*Diff
State
Violence and the
diffe
rence
between wanted
and total fertil
ity
To explore the above relationships further, zero-order
correlations and their p-values were computed. Table 3 shows the
correlation coefficient between the three indicators of fertility
and the nature of domestic violence. P-values of the correlation
coefficients for one-tailed test are given in parentheses. The
table establishes that TFR and the difference between TFR and WFR
have significant relationship with violence. When the TFR is
correlated separately with different forms of violence it is
found that it is significantly correlated with physical violence
and any form of violence; the correlation of TFR with emotional
and sexual violence is statistically insignificant. The

difference between TFR and WFR is significantly correlated with
all forms of violence as well as any form of violence.
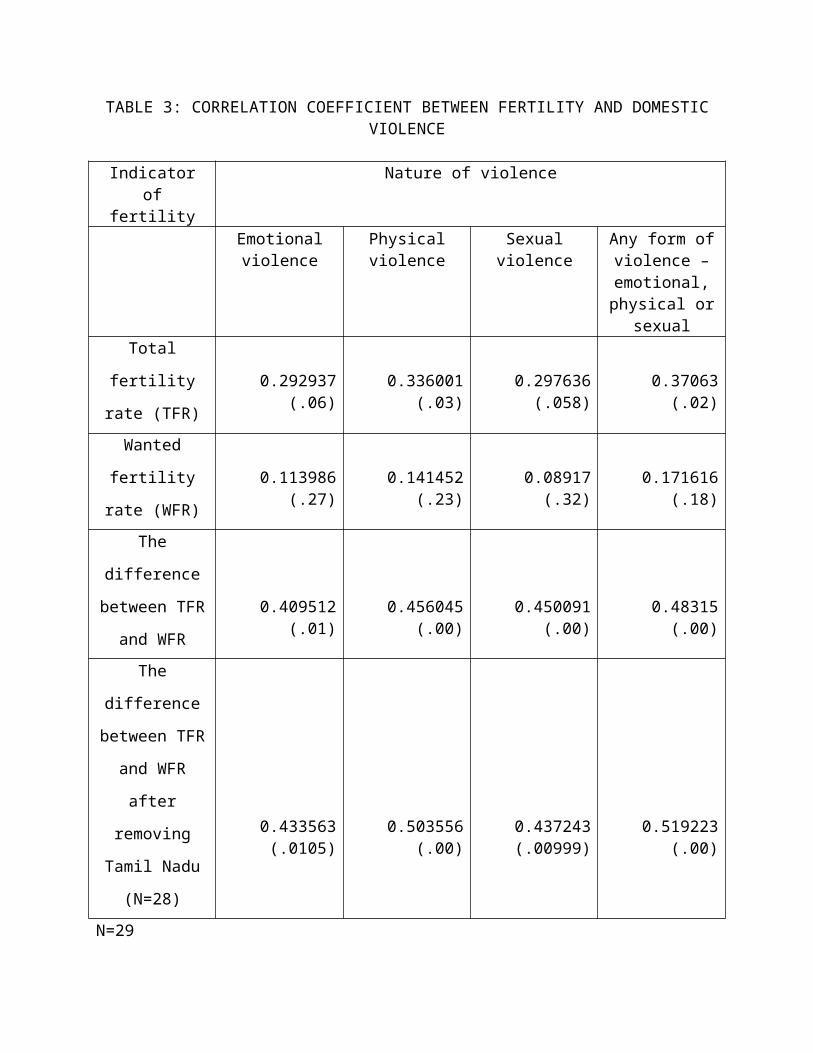
TABLE 3: CORRELATION COEFFICIENT BETWEEN FERTILITY AND DOMESTICVIOLENCE
Indicatorof
fertility
Nature of violence
Emotionalviolence
Physicalviolence
Sexualviolence
Any form ofviolence –emotional,physical or
sexual Total
fertility
rate (TFR)
0.292937(.06)
0.336001(.03)
0.297636(.058)
0.37063(.02)
Wanted
fertility
rate (WFR)
0.113986(.27)
0.141452(.23)
0.08917(.32)
0.171616(.18)
The
difference
between TFR
and WFR
0.409512(.01)
0.456045(.00)
0.450091(.00)
0.48315(.00)
The
difference
between TFR
and WFR
after
removing
Tamil Nadu
(N=28)
0.433563(.0105)
0.503556(.00)
0.437243(.00999)
0.519223(.00)
N=29

Findings of the micro data
An attempt was also made to study the relationship between
fertility and experience of domestic violence at the micro level.
Tables 4-5 show the results of application of adjusted multiple
linear regression model predicting association between lifetime
exposure to any domestic violence and children ever born among
currently married women (15-49), India, 2005-2006, and ideal
family size respectively. Table 6 shows the the results of
application of adjusted multiple linear regression model
predicting association between lifetime exposure to any domestic
violence and children ever born among currently married women
(15-49), India, 2005-2006, and ideal family size respectively.
Table 6 shows the results of application of adjusted odds ratio
from multiple logistic regression model predicting association
between lifetime exposure to any domestic violence and desire for
another child.
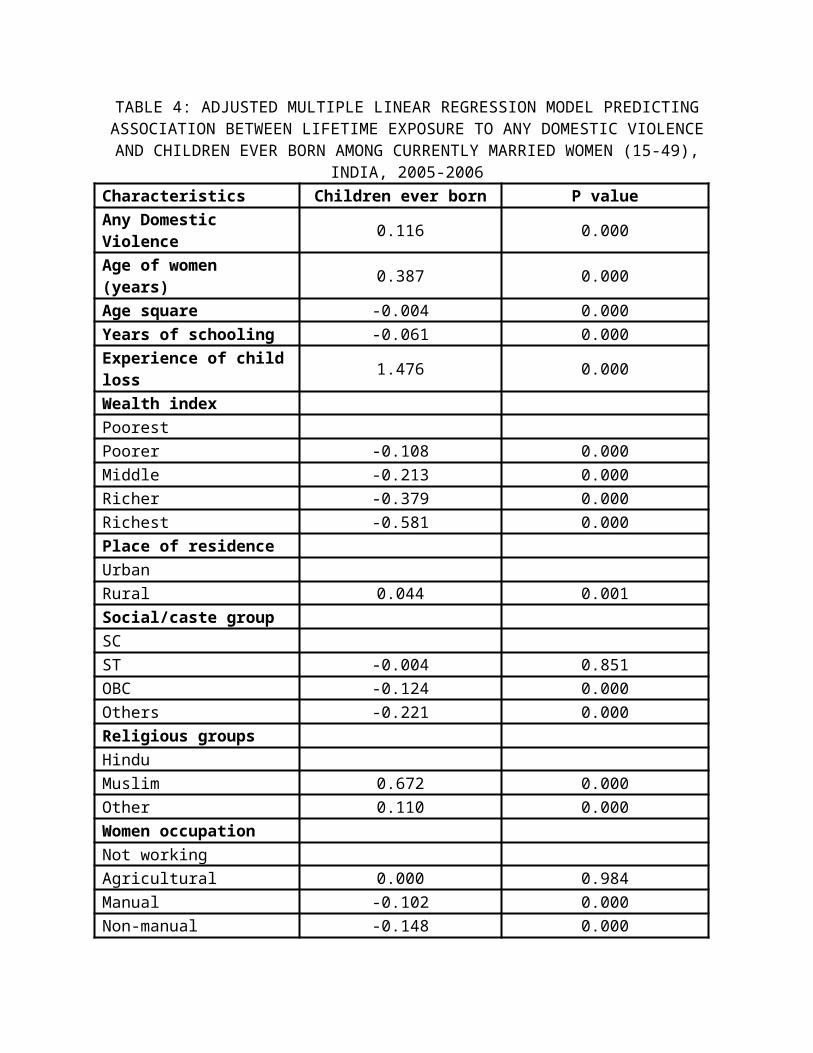
TABLE 4: ADJUSTED MULTIPLE LINEAR REGRESSION MODEL PREDICTINGASSOCIATION BETWEEN LIFETIME EXPOSURE TO ANY DOMESTIC VIOLENCEAND CHILDREN EVER BORN AMONG CURRENTLY MARRIED WOMEN (15-49),
INDIA, 2005-2006 Characteristics Children ever born P valueAny Domestic Violence 0.116 0.000
Age of women (years) 0.387 0.000
Age square -0.004 0.000Years of schooling -0.061 0.000Experience of childloss 1.476 0.000
Wealth index Poorest Poorer -0.108 0.000Middle -0.213 0.000Richer -0.379 0.000Richest -0.581 0.000Place of residence Urban Rural 0.044 0.001Social/caste group SC ST -0.004 0.851OBC -0.124 0.000Others -0.221 0.000Religious groups Hindu Muslim 0.672 0.000Other 0.110 0.000Women occupation Not working Agricultural 0.000 0.984Manual -0.102 0.000Non-manual -0.148 0.000

Women Autonomy Low Autonomy Medium Autonomy 0.025 0.041High Autonomy -0.028 0.039Note: Model is adjusted for the state of residence of respondent; R-Square: 0.5231; No. of observation: 64836.
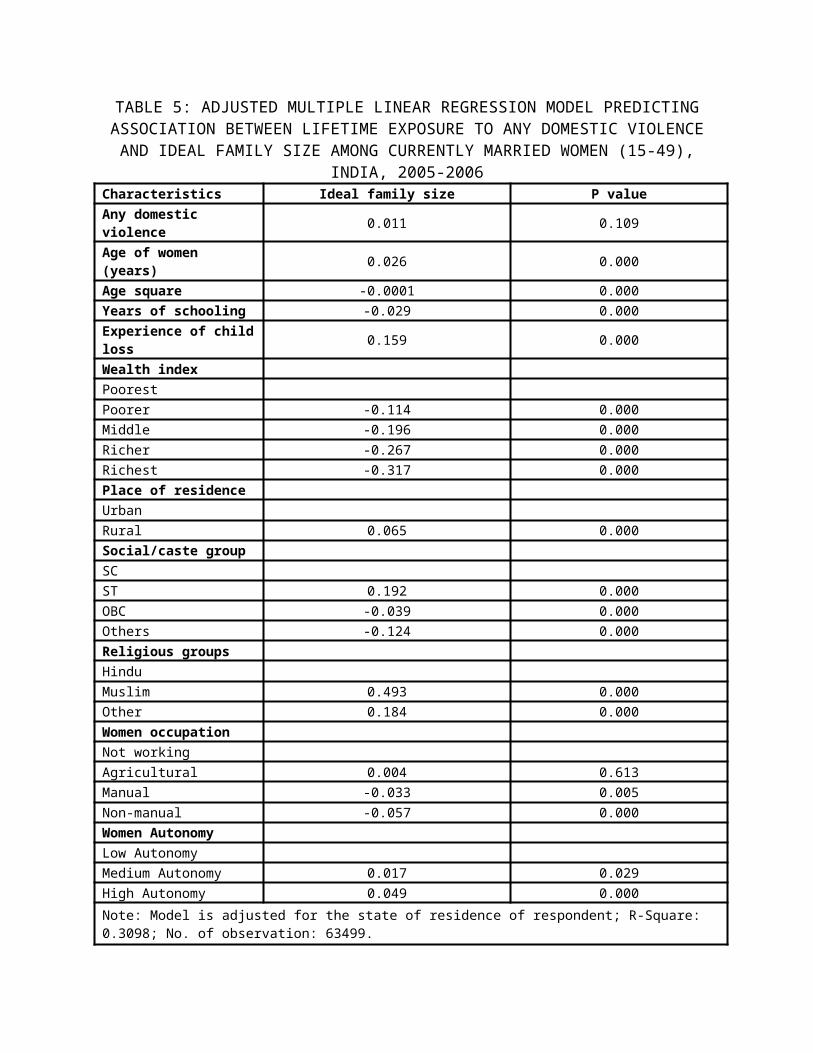
TABLE 5: ADJUSTED MULTIPLE LINEAR REGRESSION MODEL PREDICTINGASSOCIATION BETWEEN LIFETIME EXPOSURE TO ANY DOMESTIC VIOLENCEAND IDEAL FAMILY SIZE AMONG CURRENTLY MARRIED WOMEN (15-49),
INDIA, 2005-2006Characteristics Ideal family size P valueAny domestic violence 0.011 0.109
Age of women (years) 0.026 0.000
Age square -0.0001 0.000Years of schooling -0.029 0.000Experience of childloss 0.159 0.000
Wealth index Poorest Poorer -0.114 0.000Middle -0.196 0.000Richer -0.267 0.000Richest -0.317 0.000Place of residence Urban Rural 0.065 0.000Social/caste group SC ST 0.192 0.000OBC -0.039 0.000Others -0.124 0.000Religious groups Hindu Muslim 0.493 0.000Other 0.184 0.000Women occupation Not working Agricultural 0.004 0.613Manual -0.033 0.005Non-manual -0.057 0.000Women Autonomy Low Autonomy Medium Autonomy 0.017 0.029High Autonomy 0.049 0.000Note: Model is adjusted for the state of residence of respondent; R-Square: 0.3098; No. of observation: 63499.
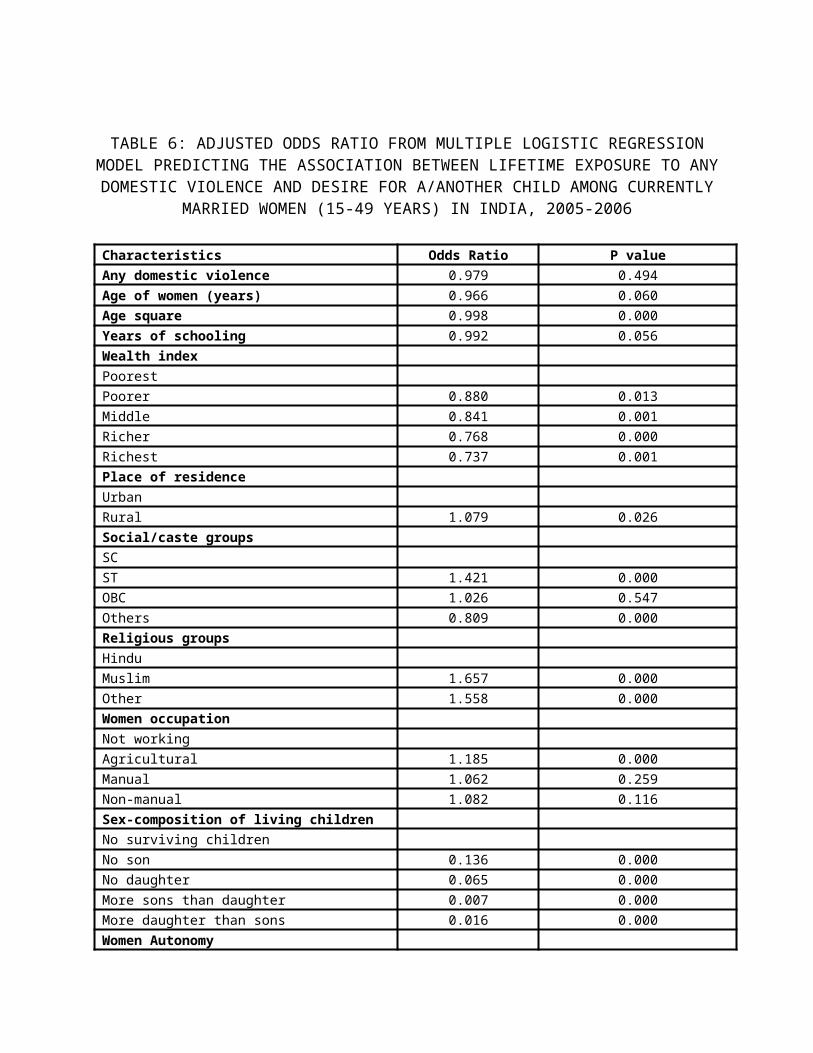
TABLE 6: ADJUSTED ODDS RATIO FROM MULTIPLE LOGISTIC REGRESSIONMODEL PREDICTING THE ASSOCIATION BETWEEN LIFETIME EXPOSURE TO ANYDOMESTIC VIOLENCE AND DESIRE FOR A/ANOTHER CHILD AMONG CURRENTLY
MARRIED WOMEN (15-49 YEARS) IN INDIA, 2005-2006
Characteristics Odds Ratio P valueAny domestic violence 0.979 0.494Age of women (years) 0.966 0.060Age square 0.998 0.000Years of schooling 0.992 0.056Wealth index Poorest Poorer 0.880 0.013Middle 0.841 0.001Richer 0.768 0.000Richest 0.737 0.001Place of residence Urban Rural 1.079 0.026Social/caste groups SC ST 1.421 0.000OBC 1.026 0.547Others 0.809 0.000Religious groups Hindu Muslim 1.657 0.000Other 1.558 0.000Women occupation Not working Agricultural 1.185 0.000Manual 1.062 0.259Non-manual 1.082 0.116Sex-composition of living children No surviving children No son 0.136 0.000No daughter 0.065 0.000More sons than daughter 0.007 0.000More daughter than sons 0.016 0.000Women Autonomy

Low Autonomy Medium Autonomy 1.050 0.145High Autonomy 1.191 0.000Note: Model is adjusted for the state of residence of respondent. No. of observation: 39824
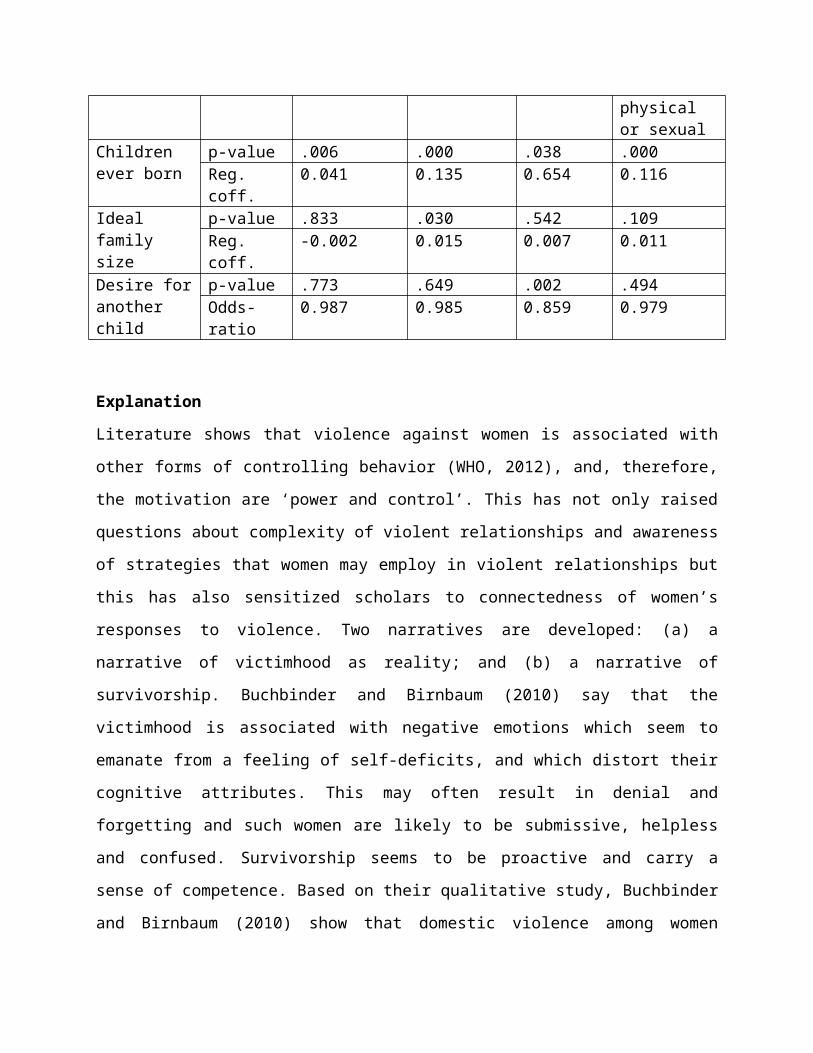
Table 7 shows the summary of the results of the same analyses for
separate indicators of fertility and the different dimensions of
violence.
The results are interesting. They show that there is a
significant relationship of children ever born with domestic
violence and the relationship is positive. This is an extra
evidence of domestic violence preventing the completion of
demographic transition. There is, however, no relationship of
violence with ideal family and desire for another child and
violence. When the analysis is done separately for different
forms of violence then physical violence alone is found to be
having a significant relationship with ideal family size and
sexual violence is found to be having a significant relationship
with desire for another child also. Thus there is some evidence
that even at the micro level violence against women can reduce
the pace of demographic transition.
TABLE 7: REGRESSION COEFFICIENTS/ODDS RATIOS AND THEIR P-VALUES
Indicator of fertility
Emotional violence
Physical violence
Sexual violence
Any form of violence –emotional,
physical or sexual
Children ever born
p-value .006 .000 .038 .000Reg. coff.
0.041 0.135 0.654 0.116
Ideal family size
p-value .833 .030 .542 .109Reg. coff.
-0.002 0.015 0.007 0.011
Desire foranother child
p-value .773 .649 .002 .494Odds-ratio
0.987 0.985 0.859 0.979
Explanation
Literature shows that violence against women is associated with
other forms of controlling behavior (WHO, 2012), and, therefore,
the motivation are ‘power and control’. This has not only raised
questions about complexity of violent relationships and awareness
of strategies that women may employ in violent relationships but
this has also sensitized scholars to connectedness of women’s
responses to violence. Two narratives are developed: (a) a
narrative of victimhood as reality; and (b) a narrative of
survivorship. Buchbinder and Birnbaum (2010) say that the
victimhood is associated with negative emotions which seem to
emanate from a feeling of self-deficits, and which distort their
cognitive attributes. This may often result in denial and
forgetting and such women are likely to be submissive, helpless
and confused. Survivorship seems to be proactive and carry a
sense of competence. Based on their qualitative study, Buchbinder
and Birnbaum (2010) show that domestic violence among women
produced two contradictory responses. On the one hand they felt
deficiency and threat and a feeling that self is rooted in the
past, and on the other, they felt motivated to struggle and gain
strength to overcome the hardships experienced.
Researches on violence have shown that violence against women
leads to depression and several post-traumatic disorders
(Violence against Women Online Resources, 2010). In the West,
domestic violence has often been associated with injuries,
homelessness, depression, psychosomatic disorders, sleep and
eating disorders, hypertension, drug abuse, lower self esteem,
and unemployment. Domestic violence is also the cause of lack of
negotiation for safer sex and therefore women who suffer from
domestic violence run a high risk of HIV (UNICEF, 2000).
Tamil Nadu as an outlier
If the violence-fertility hypothesis is true then Tamil Nadu
emerges as an outlier. It has reached the below replacement much
earlier than many other low fertility rates and it has a rather
high rate of domestic violence against women. This requires
explanation. Either the NFHS overestimates the prevalence of
domestic violence in Tamil Nadu or it has a few unique conditions
which have reduced fertility here. Literature show that the lower
fertility in Tamil Nadu is especially due to governance,
effective implementation of family planning programs, better
rural-urban connectivity (Savitri, 1994; Dreze and Mamta Murthi,
2000) and higher incidence of poverty in the rural areas
(Visaria, u.d.) TN had achieved replacement level of fertility
without increasing female literacy, without reducing IMR, and
even with lower level of women empowerment.
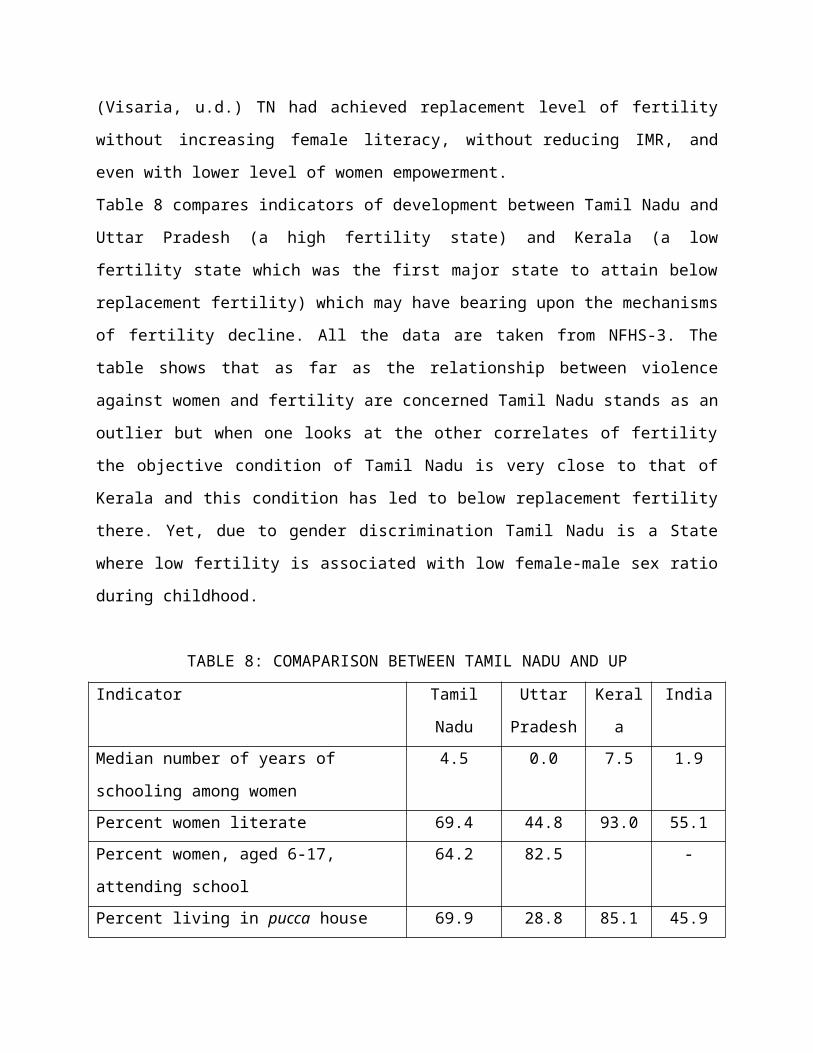
Table 8 compares indicators of development between Tamil Nadu and
Uttar Pradesh (a high fertility state) and Kerala (a low
fertility state which was the first major state to attain below
replacement fertility) which may have bearing upon the mechanisms
of fertility decline. All the data are taken from NFHS-3. The
table shows that as far as the relationship between violence
against women and fertility are concerned Tamil Nadu stands as an
outlier but when one looks at the other correlates of fertility
the objective condition of Tamil Nadu is very close to that of
Kerala and this condition has led to below replacement fertility
there. Yet, due to gender discrimination Tamil Nadu is a State
where low fertility is associated with low female-male sex ratio
during childhood.
TABLE 8: COMAPARISON BETWEEN TAMIL NADU AND UP
Indicator Tamil
Nadu
Uttar
Pradesh
Keral
a
India
Median number of years of
schooling among women
4.5 0.0 7.5 1.9
Percent women literate 69.4 44.8 93.0 55.1Percent women, aged 6-17,
attending school
64.2 82.5 -
Percent living in pucca house 69.9 28.8 85.1 45.9
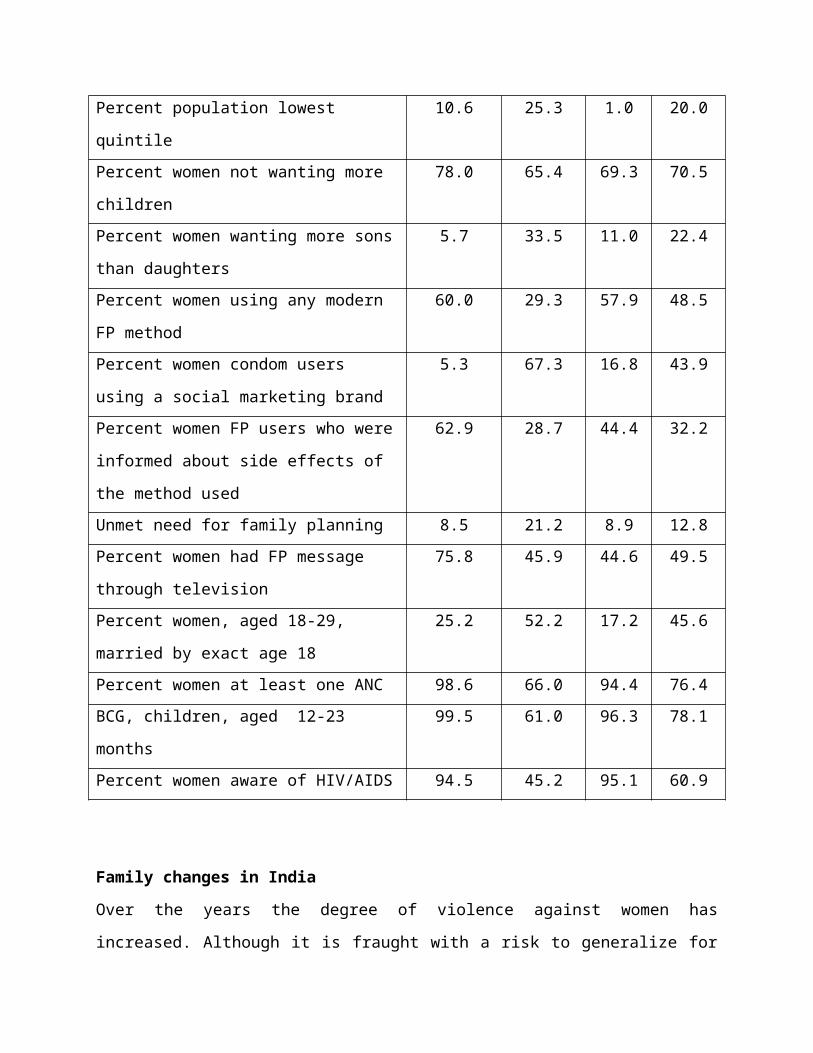
Percent population lowest
quintile
10.6 25.3 1.0 20.0
Percent women not wanting more
children
78.0 65.4 69.3 70.5
Percent women wanting more sons
than daughters
5.7 33.5 11.0 22.4
Percent women using any modern
FP method
60.0 29.3 57.9 48.5
Percent women condom users
using a social marketing brand
5.3 67.3 16.8 43.9
Percent women FP users who were
informed about side effects of
the method used
62.9 28.7 44.4 32.2
Unmet need for family planning 8.5 21.2 8.9 12.8Percent women had FP message
through television
75.8 45.9 44.6 49.5
Percent women, aged 18-29,
married by exact age 18
25.2 52.2 17.2 45.6
Percent women at least one ANC 98.6 66.0 94.4 76.4BCG, children, aged 12-23
months
99.5 61.0 96.3 78.1
Percent women aware of HIV/AIDS 94.5 45.2 95.1 60.9
Family changes in India
Over the years the degree of violence against women has
increased. Although it is fraught with a risk to generalize for
whole India, in much of the 20th century due to the influences of
religious conversions and reforms and processes of modernization
even the other forms of family, such as the Khasi family of the
North East and the Nair family of Kerala, have moved towards the
all-India, patrilocal, patriarchal and patrilineal model. In the
early 21st century new forces of social change are posing new
challenges to continuation of the diverse, traditional
institutions of family. They are: Westernization, increased
mobility, improvement in life expectancy, demographic transition
causing fertility to go below the replacement level, rising
unemployment, increasing landlessness in rural areas and
secularization. These forces are bound to affect size and
structure of family. This will also affect the ideational shifts
in values of web of relationship within family.
Conclusion and discussion
It may be argued that in the future Indian family will be moving
gradually towards a state which can be characterized by follows:
geographically isolated, autonomous small family with strong
emotional links and economic cooperation with the larger kin
groups; strong value of sacrifice for the children; greater
tolerance of the disabilities and ill-health of the old;
democratization of family politics; conflict between values and
practices; and a more permissive attitude towards alternative
forms of family. This is likely to accelerate the process of
second demographic transition through its effect on women’s power
to resist various forms of violence by the husband, independent
of other causes of fertility decline.
References
Buchbinder, Eli and Liora Birnbaum, 2010, Strength trapped within
weakness/weakness trapped within weakness, Violence against
Women, Vol. 16, No. 6, pp. 658-678.
Cavanagh, Kate, 2012, Understanding women’s responses to domestic
violence, Qualitative Social Work, Vol. 2, No. 3, pp. 229-249.
Dreze, Jean, and Mamta Murthi, 2000, Fertility, Education and
Development, Discussion Paper, The Suntory Centre, Suntory
and Toyota International Centres for Economics and Related
Disciplines, London School of Economics and Political
Science.
Dyson, T., and M. Moore, 1983, On Kinship Structure, Female
Autonomy and Demographic Behaviour in India. Population and
Development Review, 9 (March), pp. 35-60.
International Institute for Populations Sciences (IIPS) and ORC
Macro, 2000, National Family Health Survey (NFHS-2), 1998-99: India,
IIPS, Mumbai.
International Institute for Populations Sciences (IIPS) and ORC
Macro, 2007, National Family Health Survey (NFHS-3), 2005-06: India,
Volume I, IIPS, Mumbai.
Karve, Irawati, 1965, Kinship Organization in India, Asia Publishing
House, Bombay.
Sample Registration System, 2009, Sample Registration System: Statistical
Report 2009, Report No. 1 of 2011.
Savitri, R., 1994, Fertility Rate Decline in Tamil Nadu: Some
Issues, Economic and Political Weekly, Vol. 29, No. 29, pp. 1850-
1852.
Sharma, A. K., 2011, Population and Society, Concept Publishing
Company, New Delhi.
Sharma, A. K., 2012, Fertility Decline in Contemporary India:
Increasing Role of the Marriage Institution, Paper presented
in the 2nd Asian Population Conference, Bangkok, Thailand, 26-29
August.
UNICEF, 2000, Domestic Violence against Women and Girls, Innocent
Digest, 6 June, Innocenti Research Centre, Florence, Italy.
Violence against Women Online Resources, 2010, The Facts about
Domestic Violence,
www.vaw.umn.edu/documents/inbriefs/domesticviolence/domestic
violence.html, [accessed on 9 October 2012].
Visaria, Leela, 2000, Innovations in Tamil Nadu, Seminar, web-
edition,
http://www.india-seminar.com/2000/489/489%20visaria.htm
[accessed on 20 October 2012].
WHO, 2012, Multi-country Study on Women’s Health and Domestic Violence against
Women: Initial Results on Prevalence, Health Outcomes and Women’s
Responses,
www.who.int/gender/violence/who_multicountry_study/en/
[accessed on 9 October 2012].