Exercise as a therapeutic tool to prevent mitochondrial degeneration in NASH
Upload
independentCategory
view
2download
0
The Relationship between Opsin Overexpressionand Photoreceptor Degeneration
Elaine Tan,1,2 Quan Wang,3 Alexander B. Quiambao,1 Xiaoping Xu,2,4
Nasser M. Qtaishat,1 Neal S. Peachey,2,4,5 Janis Lem,6 Steven J. Fliesler,7
David R. Pepperberg,1 Muna I. Naash,1 and Muayyad R. Al-Ubaidi1,3
PURPOSE. To characterize the process by which overexpressionof normal opsin leads to photoreceptor degeneration.
METHODS. Three transgenic mouse lines were generated thatexpress different levels of an opsin with three amino acidmodifications at the C terminus. These modifications createdan epitopic site that can be readily distinguished from theendogenous protein using a bovine opsin-specific antibody.Evidence of degeneration associated with opsin overexpres-sion was provided by anatomic studies and electroretinogram(ERG) recordings. Western blot analysis was used to confirmthe production of the transgenic opsin, and an enzyme-linkedimmunosorbent assay (ELISA) was used to determine theamounts of opsin overexpressed in each line. Immunocyto-chemistry was used to determine the cellular localization oftransgenic opsin. Amounts of 11-cis retinal were determinedby extraction and high-performance liquid chromatography(HPLC).
RESULTS. Opsin expression levels in the three lines were foundto be 123%, 169%, and 222% of the level measured in nontrans-genic animals, providing direct correlation between the levelof transgene expression and the severity of the degenerativephenotype. In the lower expressing lines, ERG a-wave ampli-tudes were reduced to less than approximately 30% and 15% ofnormal values, whereas responses of the highest expressingline were indistinguishable from noise. In the lowest expres-sor, a 26% elevation in 11-cis retinal was observed, whereas inthe medium and the high expressors, 11-cis retinal levels wereincreased by only 30% to 33%, well below the 69% and 122%increases in opsin levels.
CONCLUSIONS. The overexpression of normal opsin induces pho-toreceptor degeneration that is similar to that seen in manymouse models of retinitis pigmentosa. This degeneration canbe induced by opsin levels that exceed by only approximately23% that of the normal mouse retina. Opsin overexpression haspotential implications in retinitis pigmentosa. (Invest Ophthal-mol Vis Sci. 2001;42:589–600)
More than 90 mutations in the rhodopsin gene have beenfound to be associated with retinitis pigmentosa,1 a het-
erogeneous set of diseases characterized by night blindnessand progressive loss of peripheral vision resulting from rodphotoreceptor degeneration.2–5 A number of transgenic mousemodels carrying different mutant opsins have been establishedto confirm a causal relationship between the mutations and thedisease phenotype, as well as to determine the mechanism bywhich a mutation may trigger photoreceptor degeneration.6–12
However, results from recent studies in which mice expressingnormal human,10 mouse,11 or pig13 opsin transgenes as controlexperiments have raised questions about the validity of usingtransgenic mouse models expressing mutant opsins to studyretinal degeneration. Overexpression of normal opsin leads toa degenerative phenotype indistinguishable from that observedin mice expressing mutant forms of opsin.7–12,14 When theratio of transgene transcript to that of endogenous protein isbetween 0.1 and 0.3, the degeneration is slow and mice retainmore than 50% of their photoreceptors by 8 weeks of age.11
However, when the ratio is higher the severity of the degen-eration increases accordingly.11 These data reflect the tightregulation of the opsin gene and the detrimental effects ofincreased levels of expression.11 In another study, expressionof normal human opsin at a ratio of unity relative to endoge-nous opsin does not cause retinal degeneration, whereas anincrease of fivefold causes severe retinal degeneration.10 Theobservation that photoreceptor degeneration occurs at a ratedependent on the steady state levels of opsin mRNA10,11 sug-gests that the total amount of opsin expressed in the photore-ceptor cell may play a key role in triggering photoreceptor celldeath.
Although photoreceptor degeneration resulting from opsinoverexpression has been described, no characterization of thepattern and rate of the associated degeneration or the possiblemechanism leading to the degeneration has been provided. Inthe present study, we investigated the correlation between theamount of opsin expressed and the rate of retinal degenera-tion. Furthermore, we investigated the mechanism throughwhich overexpression of opsin can lead to photoreceptor celldeath. To accomplish these goals, we used a transgene con-struct in which three amino acid substitutions were made atthe C terminus to give the transgene bovine opsin-specificimmunoreactivity. We refer to this as the Bouse (bovine andmouse) opsin transgenic construct. These substitutions, whichhave not been associated with any retinal disease, allowed thetransgenic protein to be distinguished within the environmentof the endogenous protein using the bovine opsin-specificmonoclonal antibody (mAb) 3A6.15,16
Three transgenic mouse lines designated Bouse A, Bouse B,and Bouse C, were established from the injection of the Bouseopsin transgenic construct. Retinas of Bouse transgenic micewere examined at specific ages with electroretinography todefine the functional competence of the retina, with immuno-cytochemistry to determine the cellular localization of trans-genic opsin, and enzyme-linked immunosorbent assay (ELISA)to determine the opsin expression levels. The results confirmthat the severity of degeneration depends on the level of opsin
From the 1Department of Ophthalmology and Visual Sciences,College of Medicine, and the 3Department of Biological Sciences,College of Liberal Arts and Sciences, University of Illinois at Chicago;the 2Research Service, Hines VA Hospital, Illinois; Departments of4Neurology and 5Ophthalmology, Stritch School of Medicine, LoyolaUniversity of Chicago, Maywood, Illinois; the 6Department of Ophthal-mology, New England Eye Center, Boston, Massachusetts; and 7SaintLouis University Eye Institute and the Cell and Molecular BiologyGraduate Program, Saint Louis University School of Medicine, Missouri.
Supported by Grants EY11376, EY01792, EY05494, and EY06045from the National Eye Institute; the Department of Veterans Affairs; theIllinois Eye Fund; and an unrestricted departmental grant from Re-search to Prevent Blindness.
Submitted for publication August 7, 2000; revised October 30,2000; accepted November 15, 2000.
Commercial relationships policy: N.Corresponding author: Muayyad R. Al-Ubaidi, Department of Cell
Biology, University of Oklahoma Health Sciences Center, 940 StantonL. Young Boulevard, BMSB 781, Oklahoma City, OK [email protected]
Investigative Ophthalmology & Visual Science, March 2001, Vol. 42, No. 3Copyright © Association for Research in Vision and Ophthalmology 589
expression and demonstrates that an approximate 23% over-expression of opsin is sufficient to trigger photoreceptor de-generation.
MATERIALS AND METHODS
Construction of the Transgene
The Bouse transgenic construct was prepared from a 15-kb mousegenomic fragment containing the entire mouse opsin gene including 6kb of the 59 flanking sequence, all exons and introns, and 3 kb of the39 flanking sequence.17 The C-terminal modifications were introducedusing polymerase chain reaction (PCR) site-directed mutagenesis.8
These modifications, which generated two restriction fragment lengthpolymorphisms (RFLPs) by eliminating a BsaHI restriction site andcreating a StuI restriction site, allowed the transgene product to beeasily distinguished from endogenous opsin at the DNA level. Subse-quent sequence analysis was performed to ensure that no unintendedchanges were introduced. The construct was digested with SalI torelease the 15-kb fragment and then electrophoresed through a 1%agarose gel. The DNA fragment of interest was electroeluted, precipi-tated, and purified through a desalting column (Elu-tip; Schleicher &Schuell, Keene, NH).
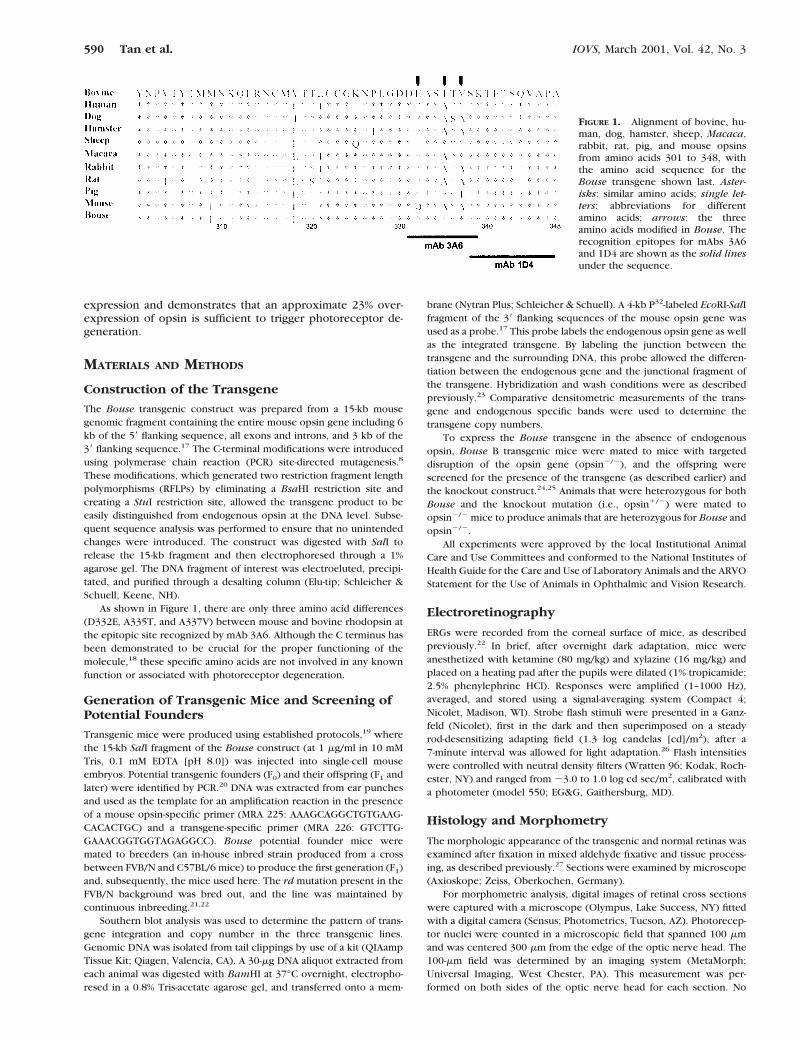
As shown in Figure 1, there are only three amino acid differences(D332E, A335T, and A337V) between mouse and bovine rhodopsin atthe epitopic site recognized by mAb 3A6. Although the C terminus hasbeen demonstrated to be crucial for the proper functioning of themolecule,18 these specific amino acids are not involved in any knownfunction or associated with photoreceptor degeneration.
Generation of Transgenic Mice and Screening ofPotential Founders
Transgenic mice were produced using established protocols,19 wherethe 15-kb SalI fragment of the Bouse construct (at 1 mg/ml in 10 mMTris, 0.1 mM EDTA [pH 8.0]) was injected into single-cell mouseembryos. Potential transgenic founders (F0) and their offspring (F1 andlater) were identified by PCR.20 DNA was extracted from ear punchesand used as the template for an amplification reaction in the presenceof a mouse opsin-specific primer (MRA 225: AAAGCAGGCTGTGAAG-CACACTGC) and a transgene-specific primer (MRA 226: GTCTTG-GAAACGGTGGTAGAGGCC). Bouse potential founder mice weremated to breeders (an in-house inbred strain produced from a crossbetween FVB/N and C57BL/6 mice) to produce the first generation (F1)and, subsequently, the mice used here. The rd mutation present in theFVB/N background was bred out, and the line was maintained bycontinuous inbreeding.21,22
Southern blot analysis was used to determine the pattern of trans-gene integration and copy number in the three transgenic lines.Genomic DNA was isolated from tail clippings by use of a kit (QIAampTissue Kit; Qiagen, Valencia, CA). A 30-mg DNA aliquot extracted fromeach animal was digested with BamHI at 37°C overnight, electropho-resed in a 0.8% Tris-acetate agarose gel, and transferred onto a mem-
brane (Nytran Plus; Schleicher & Schuell). A 4-kb P32-labeled EcoRI-SalIfragment of the 39 flanking sequences of the mouse opsin gene wasused as a probe.17 This probe labels the endogenous opsin gene as wellas the integrated transgene. By labeling the junction between thetransgene and the surrounding DNA, this probe allowed the differen-tiation between the endogenous gene and the junctional fragment ofthe transgene. Hybridization and wash conditions were as describedpreviously.23 Comparative densitometric measurements of the trans-gene and endogenous specific bands were used to determine thetransgene copy numbers.
To express the Bouse transgene in the absence of endogenousopsin, Bouse B transgenic mice were mated to mice with targeteddisruption of the opsin gene (opsin2/2), and the offspring werescreened for the presence of the transgene (as described earlier) andthe knockout construct.24,25 Animals that were heterozygous for bothBouse and the knockout mutation (i.e., opsin1/2) were mated toopsin2/2 mice to produce animals that are heterozygous for Bouse andopsin2/2.
All experiments were approved by the local Institutional AnimalCare and Use Committees and conformed to the National Institutes ofHealth Guide for the Care and Use of Laboratory Animals and the ARVOStatement for the Use of Animals in Ophthalmic and Vision Research.
Electroretinography
ERGs were recorded from the corneal surface of mice, as describedpreviously.22 In brief, after overnight dark adaptation, mice wereanesthetized with ketamine (80 mg/kg) and xylazine (16 mg/kg) andplaced on a heating pad after the pupils were dilated (1% tropicamide;2.5% phenylephrine HCl). Responses were amplified (1–1000 Hz),averaged, and stored using a signal-averaging system (Compact 4;Nicolet, Madison, WI). Strobe flash stimuli were presented in a Ganz-feld (Nicolet), first in the dark and then superimposed on a steadyrod-desensitizing adapting field (1.3 log candelas [cd]/m2), after a7-minute interval was allowed for light adaptation.26 Flash intensitieswere controlled with neutral density filters (Wratten 96; Kodak, Roch-ester, NY) and ranged from 23.0 to 1.0 log cd sec/m2, calibrated witha photometer (model 550; EG&G, Gaithersburg, MD).
Histology and Morphometry
The morphologic appearance of the transgenic and normal retinas wasexamined after fixation in mixed aldehyde fixative and tissue process-ing, as described previously.27 Sections were examined by microscope(Axioskope; Zeiss, Oberkochen, Germany).
For morphometric analysis, digital images of retinal cross sectionswere captured with a microscope (Olympus, Lake Success, NY) fittedwith a digital camera (Sensus; Photometrics, Tucson, AZ). Photorecep-tor nuclei were counted in a microscopic field that spanned 100 mmand was centered 300 mm from the edge of the optic nerve head. The100-mm field was determined by an imaging system (MetaMorph;Universal Imaging, West Chester, PA). This measurement was per-formed on both sides of the optic nerve head for each section. No
FIGURE 1. Alignment of bovine, hu-man, dog, hamster, sheep, Macaca,rabbit, rat, pig, and mouse opsinsfrom amino acids 301 to 348, withthe amino acid sequence for theBouse transgene shown last. Aster-isks: similar amino acids; single let-ters: abbreviations for differentamino acids; arrows: the threeamino acids modified in Bouse. Therecognition epitopes for mAbs 3A6and 1D4 are shown as the solid linesunder the sequence.
590 Tan et al. IOVS, March 2001, Vol. 42, No. 3
differences were found in the number of photoreceptor nuclei be-tween these regions. Three sections from each of three retinas wereexamined for each time point.
Light Microscopic Immunocytochemistry
Immunocytochemical analysis was performed after a 4- to 16-hourfixation of enucleated eyes in Davidson fixative28,29 and subsequentremoval of the anterior segment. Tissues were cryoprotected with 30%sucrose in phosphate-buffered saline (PBS; 140 mM NaCl, 2.7 mM KCl,10 mM Na2HPO4, and 1.76 mM KH2PO4), embedded in optimal cuttingtemperature compound (OCT; Miles Diagnostics, Elkhart, IN), andsnap frozen in an isopentane-dry ice bath. Six-micrometer sectionswere cut, picked up on glass slides, and allowed to dry at roomtemperature. Sections were incubated with PBS containing 5% normalgoat serum and 0.1% bovine serum albumin (BSA) for 30 minutes atroom temperature. After three washes with PBS, sections were incu-bated with the primary antibody in PBS containing 5% goat serum,0.1% BSA, and 140 mM NaCl (mAb 1D4 at 1:100 dilution at 4°C) or 500mM NaCl (mAb 3A6 at 1:20 dilution at room temperature) overnight.After primary antibody incubation, sections were rinsed in PBS threetimes. The secondary antibody, fluorescein isothiocyanate (FITC)–conjugated goat anti-mouse (Jackson ImmunoResearch, West Grove,PA), was applied at 1:1000 dilution for 30 minutes at room tempera-ture. Sections were then washed three times with PBS, mounted inmedium (H-1000; Vector, Burlingame, CA), and viewed with an epiflu-orescence microscope (Axioskope; Ziess).
Alternatively, hemisected eyes (anterior segment removed) werefixed in mixed aldehyde fixative (0.1 M sodium phosphate buffer [pH7.4], containing 2.5% glutaraldehyde, 2.0% paraformaldehyde, and0.025% CaCl2) and processed for embedding in resin (LR White; Elec-tron Microscopy Sciences, Fort Washington, PA), essentially accordingto the method of Erickson et al.30 Thick sections (0.75 mm) were cutwith a microtome and placed onto glass slides, followed by treatmentfor 30 minutes at room temperature with blocking buffer (PBS con-taining 1% [wt/vol]) radioimmunoassay grade BSA, 10% [vol/vol] nor-mal goat serum, and 0.05% [vol/vol] Triton X-100). Tissue sectionswere exposed for 2 hours at room temperature, either to rabbitanti-bovine opsin IgG or to nonimmune rabbit serum (each diluted1:500 with blocking buffer), rinsed briefly with PBS, and treated for 2hours at room temperature with 1 nm colloidal gold–conjugated goatanti-rabbit IgG secondary antibody (AuroProbe One GAR; Amersham,Arlington Heights, IL; diluted 1:50 [vol/vol] with blocking buffer).Sections were rinsed three times (15 minutes each) with PBS, followedby fixation for 10 minutes at room temperature with 2% (vol/vol)glutaraldehyde in PBS and then rinsed with distilled water (twice, 5minutes each). Silver intensification was performed with a kit (IntenSEM Silver Enhancement; Amersham), according to the directions of themanufacturer. Sections were then rinsed with distilled water, counter-stained with 1% (wt/vol) toluidine blue in 1% (wt/vol) sodium borate,rinsed again with distilled water, air dried, and coverslipped (Per-mount; Fisher Scientific, Fairlawn, NJ). Sections were viewed andphotographed with a photomicroscope (BH-2 with a 320 DPlanApoobjective; Olympus).
Western Blot Analysis
Retinas were isolated, immediately frozen in liquid nitrogen, andstored at 270°C until used. Retinal protein extracts were prepared byhomogenization of frozen tissue in PBS containing 1 mM EDTA, 1%Triton X-100, 0.1 mM phenylmethylsulfonyl fluoride (PMSF), and aprotease inhibitor cocktail (Mini Complete; Boehringer–Mannheim,Indianapolis, IN). Protein concentrations of the homogenates weredetermined with a BCA protein assay kit (Pierce, Rockford, IL), usingthe BSA provided as a calibration standard.
Retinal extracts were combined with Laemmli sample buffer31
containing 0.2 M Tris (pH 6.8), 1 mM EDTA, 4% (wt/vol) sodiumdodecyl sulfate (SDS), 20% (vol/vol) glycerol, 0.005% bromophenolblue, and 5% b-mercaptoethanol. Twenty to 40 mg total protein ali-quots of each sample (300 ng from bovine rod outer segment [ROS]
extract) were resolved on a 12% SDS–polyacrylamide minigel31 andtransferred32 to polyvinylidene (PVDF) membrane (Immunoblot; Bio-Rad, Hercules, CA) in a minigel apparatus (Transblot; Bio-Rad) at 200 Vfor 2 hours in 25 mM Tris, 192 mM glycine, 10% methanol, and 0.1%SDS. Membranes were blocked in 5% nonfat dry milk (Carnation,Glendale, CA) in TTBS (10 mM Tris [pH 7.5], 100 mM NaCl, 0.1%Tween-20) for 1 hour at room temperature with agitation. Primaryantibody incubations (mAb 1D4 at 1:3000, mAb 3A6 at 1:1) wereperformed in 5% milk/TTBS (containing 0.01% Tween-20) for 16 hours,at 4°C for mAb 1D4 and at room temperature for mAb 3A6. Membraneswere then washed five times for 5 minutes each at room temperaturein TTBS, and incubated in a horseradish peroxidase–linked goat anti-mouse IgG (Pierce) for 1 hour at room temperature, at a dilution of1:20,000 in 5% milk/TTBS. Membranes were then washed as describedearlier. Blots were incubated in an enhanced chemiluminescence de-tection system (SuperSignal; Pierce) for 5 minutes, and then exposedto film (XAR; Kodak).
Enzyme-Linked Immunosorbent Assay
Protein extracts used for ELISA were prepared from individual animals,as described for Western blot analysis. Control experiments estab-lished the linear ranges for total protein loaded, primary and secondaryantibody dilutions, and color substrate concentration. Aliquots (5–320ng total protein from retinal homogenates from mice at postnatal day[P]15) were diluted in PBS for a total sample volume of 50 ml, loadedin duplicates onto a 96-well cell culture dish (Costar, Cambridge, MA),and allowed to bind overnight. Samples were rinsed three times withwater, and incubated for 2 hours with blocking buffer (PBS, 0.05%Tween-20, 1 mM EDTA, 0.25% gelatin). Samples were rinsed andallowed to incubate in primary antibody (partially purified mAb 1D4 at1:1000 and anti-peripherin/rds33 polyclonal antibody at 1:500, dilutedin blocking buffer) for 2 hours. Wells were rinsed as described earlier,blocking buffer was added, incubation was performed for 10 minutes,and the wells were rinsed again. Horseradish peroxidase–labeled sec-ondary antibodies were applied (goat anti-mouse IgG and goat anti-rabbit IgG [Pierce] at a dilution of 1:10,000) in blocking buffer for 2hours. Samples were rinsed, blocked, and rinsed again as described.Then a 100-ml aliquot of o-phenylenediamine substrate (1 mg/ml) instable peroxide buffer (Pierce) was added to each well and allowed todevelop for 30 minutes. The reaction was stopped by adding 50 ml of2.5 M sulfuric acid to each well, and plates were read at 490 nm(Microplate Autoreader, model EL309; Bio-Tek, Winooski, VT). Allsteps were performed at room temperature.
The mean optical density readings from blank wells (no proteinloaded) were subtracted from readings obtained for the remainingwells. These values were then averaged for duplicate wells. Finalvalues were plotted versus total protein loaded for opsin as well as forperipherin/rds. The slope of the opsin plot (defined by optical density/total protein) was then divided by the slope of the peripherin/rds plotto obtain an opsin/peripherin/rds ratio. Opsin/peripherin/rds ratiosfrom three trials were averaged; values for animals of the same line(i.e., normal and Bouse A, B, and C) were then averaged and divided bythe mean value obtained for nontransgenic and breeder normal sam-ples to arrive at values for opsin expression levels. The peripherin/rdsratio was used to correct for any degeneration.
Localization of Bouse opsinAnti-Opsin Antibody
ROS membranes were prepared from bovine retinas by discontinuoussucrose density ultracentrifugation, per the method of Papermaster.34
Purity was assessed by SDS-polyacrylamide gel electrophoresis (SDS-PAGE; broad band at molecular mass 38 kDa, representing 90% of theCoomassie blue–stainable material) and spectral ratio (A280/A498 51.8–2.0). Rhodopsin was purified from ROS membranes by lectin-affinity column chromatography according to the method of Litman,35
using concanavalin (ConA)-Sepharose (Sigma, St. Louis, MO), and pu-rity again was assessed by SDS-PAGE and spectral ratio (A280/A498 51.6). Polyclonal antiserum was raised against purified bovine rhodop-
IOVS, March 2001, Vol. 42, No. 3 Opsin Expression and Retinal Degeneration 591
sin in New Zealand White rabbits, using a standard protocol withadjuvant (Hunter’s TitreMax; Sigma). Preimmune serum was obtainedbefore immunization with antigen. A purified IgG fraction of antiserumwas obtained by diethylaminoethyl (DEAE) chromatography (Affi-GelBlue; Bio-Rad), according to the manufacturer’s protocol. Titer wasassessed to be at least 1:5000 by standard dot blot assay.
Electron Microscopic Immunogold Cytochemistry
Electron microscopic immunogold cytochemistry was performed es-sentially as described by Erickson et al.30 Briefly, ultrathin sections(silver-gold) obtained from each of the tissue blocks (embedded in LRWhite; Electron Microscopy Sciences) were placed onto nickel gridsand treated for 15 minutes at room temperature with 50 mM ammo-nium chloride, followed by blocking for 30 minutes at room temper-ature with blocking buffer (composition described earlier). Grids wereexposed overnight at 4°C, either to rabbit anti-bovine opsin IgG or tononimmune rabbit serum (each diluted 1:250 with blocking buffer),then rinsed briefly with PBS and treated for 2 hours at room temper-ature with goat anti-rabbit IgG conjugated to 10 nm colloidal gold(AuroProbe EM GAR G10; Amersham; diluted 1:50 with blockingbuffer). After a brief rinsing with PBS, sections were treated with 1%glutaraldehyde (5 minutes at room temperature), rinsed serially withPBS and distilled water, stained with uranyl acetate and lead citrate,rinsed again with distilled water, exposed to OsO4 vapors, and airdried. Sections were viewed with an electron microscope (JEM-1200EX; JEOL, Tokyo, Japan) at an accelerating voltage of 80 keV.
Retinoid Analysis
Analyses were performed on dark-reared P15 mice. Experiments wereperformed under dim red light. Each animal was first anesthetized withketamine (0.15–0.18 mg/g) and xylazine (0.004–0.006 mg/g) and thenkilled by cervical dislocation. Retinas were removed and then homog-enized in 500 ml of PBS supplemented with protease inhibitor cocktail(one tablet protease inhibitor cocktail per 10 ml), using a 1-ml manualtissue grinder (Wheaton, Millville, NJ).
An aliquot (100 ml) of homogenate was added to 200 ml of form-aldehyde (37% wt/vol aqueous solution), supplemented with isopro-panol and water, and subsequently extracted with n-hexane, as previ-ously described.36 This formaldehyde-based extraction procedurerecovers both chromophoric and nonchromophoric 11-cis retinal.37–39
Another 100-ml aliquot of the homogenate was added to 400 ml ofisopropanol, supplemented with water, and extracted with n-hex-ane.36 Levels of 11-cis retinal and other retinaldehydes were deter-mined from results obtained with the formaldehyde-based extractionprocedure. Data obtained from extractions in the absence of formal-dehyde were used to determine levels of retinal.36 Each sample wasthen evaporated under nitrogen and redissolved in 200 ml n-hexane.Levels of retinoids in each sample were determined by normal-phasehigh-performance liquid chromatography (HPLC).36 The last 200-mlaliquot of homogenate was used for protein concentration determina-tion and ELISA.
RESULTS
The microinjection of the Bouse construct produced 50 poten-tial founders that were screened for the presence of the trans-gene in their genome by PCR.20 Two of these mice (11571 and11760) were positive for the transgene and when mated towild-type mice passed the transgene to their offspring in aMendelian fashion. Southern blot analysis performed on tailDNA extracted from founder animals and members of theiroffspring showed that founder 11760 had two to four copies ofthe transgene at a single site of integration. Analysis of trans-genic founder 11571 showed that the transgene integrated attwo separate sites with two to four copies per site (data notshown). Mating separated these two sites, giving rise to twoindependent transgenic lines (11571-A and 11571-B). Thesethree lines 11571-A, 11571-B, and 11760, referred to as Bouse
A, Bouse B, and Bouse C, respectively, were mated to wild-type mice to generate heterozygous transgenic offspring foranalysis.
Electroretinography
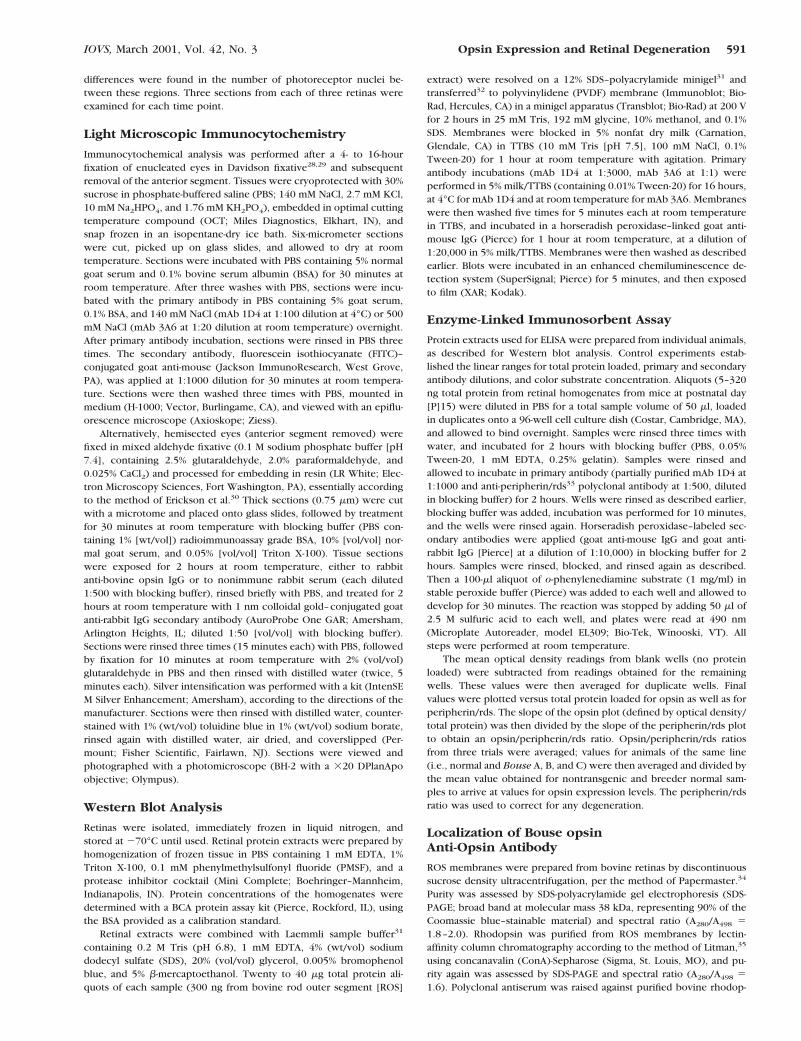
To assess retinal function, ERGs were recorded from transgenicmice and nontransgenic littermates. Figure 2A presents dark-adapted ERGs obtained from representative 1-month-old non-transgenic, Bouse A, and Bouse B mice to flash stimuli thatspanned a 4-log-unit range of intensity. At the lowest flashintensity, the response of nontransgenic mice was dominatedby the positive-polarity b-wave, reflecting the activity of rodbipolar cells.40 At the higher flash intensities, the b-wave waspreceded by the negative-polarity a-wave, which representsthe mass response of the rod photoreceptors.41 In the trans-genic mice, both a- and b-waves were reduced in amplitude atall stimulus intensities. The magnitude of this reduction wasgreater in Bouse B than Bouse A mice and was greatest inBouse C mice, in which ERG responses were not distinguish-able from the preflash baseline (data not shown). The bottompanels present average intensity–response functions for themajor ERG components, a-wave (Fig. 2B) and b-wave (Fig. 2C).In each transgenic line, a- and b-wave amplitudes were welloutside the 99% confidence interval defined in nontransgenicmice (dashed lines). The magnitude of this reduction wasgreatest in Bouse C mice and least in Bouse A animals. BouseB mice exhibited an intermediate level of amplitude reduction.The amplitude of the cone ERG b-wave was also reduced but toa lesser degree than that seen for the rod ERG (data notshown). This reduction was greatest in Bouse C mice and leastin Bouse A and Bouse B animals, implicating a secondary effecton cones of the rod degeneration, as has been seen before inanimal models of retinitis pigmentosa8,10,13,42,43 and in pa-tients with retinitis pigmentosa who have rod-specific genedefects.44–48
Retinal Histology in Bouse Transgenic Mice
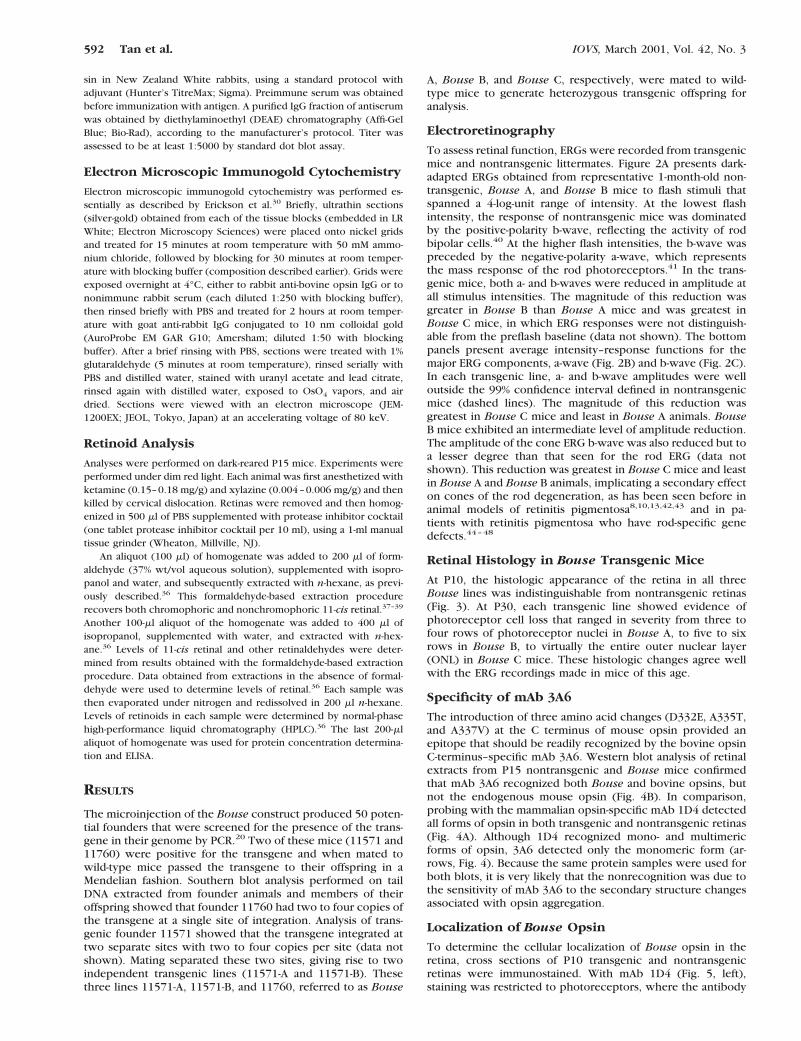
At P10, the histologic appearance of the retina in all threeBouse lines was indistinguishable from nontransgenic retinas(Fig. 3). At P30, each transgenic line showed evidence ofphotoreceptor cell loss that ranged in severity from three tofour rows of photoreceptor nuclei in Bouse A, to five to sixrows in Bouse B, to virtually the entire outer nuclear layer(ONL) in Bouse C mice. These histologic changes agree wellwith the ERG recordings made in mice of this age.
Specificity of mAb 3A6
The introduction of three amino acid changes (D332E, A335T,and A337V) at the C terminus of mouse opsin provided anepitope that should be readily recognized by the bovine opsinC-terminus–specific mAb 3A6. Western blot analysis of retinalextracts from P15 nontransgenic and Bouse mice confirmedthat mAb 3A6 recognized both Bouse and bovine opsins, butnot the endogenous mouse opsin (Fig. 4B). In comparison,probing with the mammalian opsin-specific mAb 1D4 detectedall forms of opsin in both transgenic and nontransgenic retinas(Fig. 4A). Although 1D4 recognized mono- and multimericforms of opsin, 3A6 detected only the monomeric form (ar-rows, Fig. 4). Because the same protein samples were used forboth blots, it is very likely that the nonrecognition was due tothe sensitivity of mAb 3A6 to the secondary structure changesassociated with opsin aggregation.
Localization of Bouse Opsin
To determine the cellular localization of Bouse opsin in theretina, cross sections of P10 transgenic and nontransgenicretinas were immunostained. With mAb 1D4 (Fig. 5, left),staining was restricted to photoreceptors, where the antibody
592 Tan et al. IOVS, March 2001, Vol. 42, No. 3
labeled outer segments (OSs) most intensely. Under conditionsexceeding saturation of the OS epifluorescence signal, moder-ate labeling of inner segments and photoreceptor cell bodies inthe ONL also was observed. A similar staining pattern was seenin nontransgenic animals and in Bouse mice. The distributionwas similar also when mAb 3A6, which detects Bouse opsin,was used, except that only transgenic retinas were stained (Fig.5, right). This result validates the use of mAb 3A6 to detect the
presence of the Bouse transgene product against a backgroundof normal mouse opsin.
The localization of opsin (both endogenous and Bouse) intransgenic mouse retinas was confirmed independently at thelight microscopic level, by using silver-enhanced immunogoldlabeling (Figs. 6A, 7A), with subsequent subcellular localizationby electron microscopic immunogold cytochemistry (Figs. 6B,6C, 7B, 7C). In this case, a rabbit polyclonal antibody raised
FIGURE 2. Electroretinography of 1-month-old mice. (A) Dark-adaptedERG series recorded from nontrans-genic, Bouse A, and Bouse B mice.Stimulus intensities are indicated tothe right. (B) Amplitude of the dark-adapted ERG a-wave plotted as afunction of stimulus intensity. (C) In-tensity–response function for thedark-adapted ERG b-wave. Datapoints in (B) and (C) indicate averagevalues. Error bars: 61 SD; dashedlines: 99% confidence interval for re-sults in 25 nontransgenic mice.
FIGURE 3. Light micrographs of ret-inal cross sections from cyclic-light–reared nontransgenic mice and age-matched Bouse mice at P10 and P30.Top: Sections from 10-day-old mice;bottom: sections from 1-month-oldanimals. PE, pigment epithelium; OS,outer segments; IS, inner segments;ONL, outer nuclear layer; OPL, outerplexiform layer; INL, inner nuclearlayer; IPL, inner plexiform layer;GCL, ganglion cell layer.
IOVS, March 2001, Vol. 42, No. 3 Opsin Expression and Retinal Degeneration 593

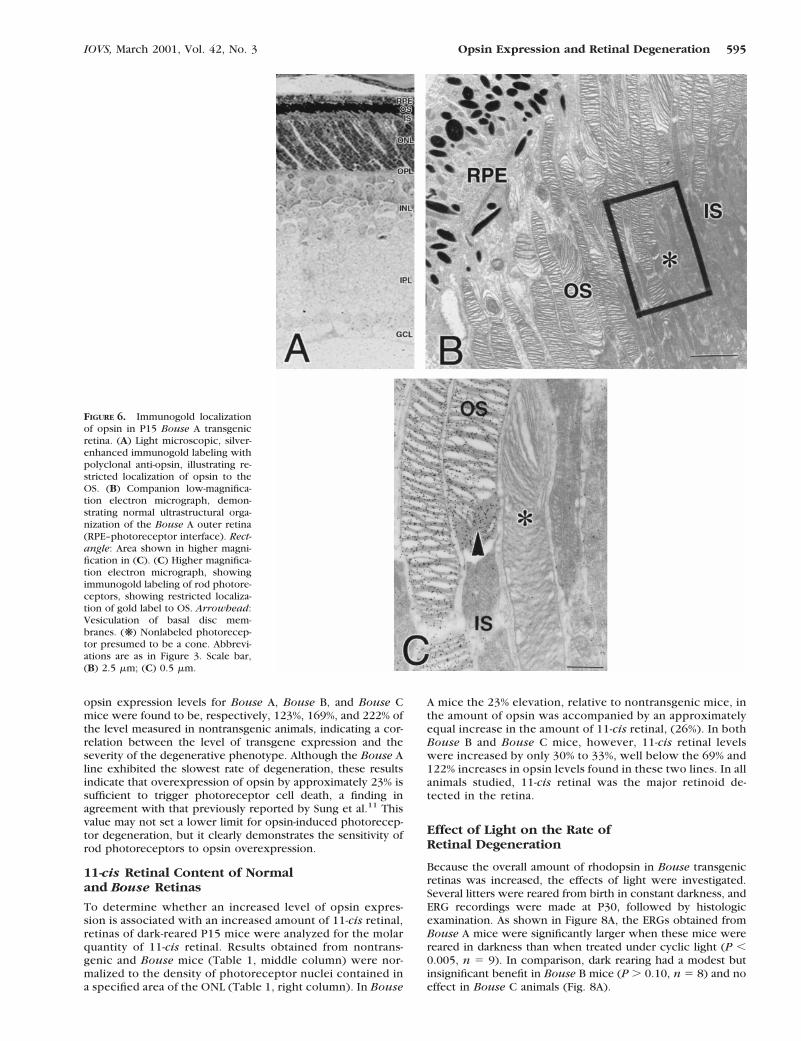
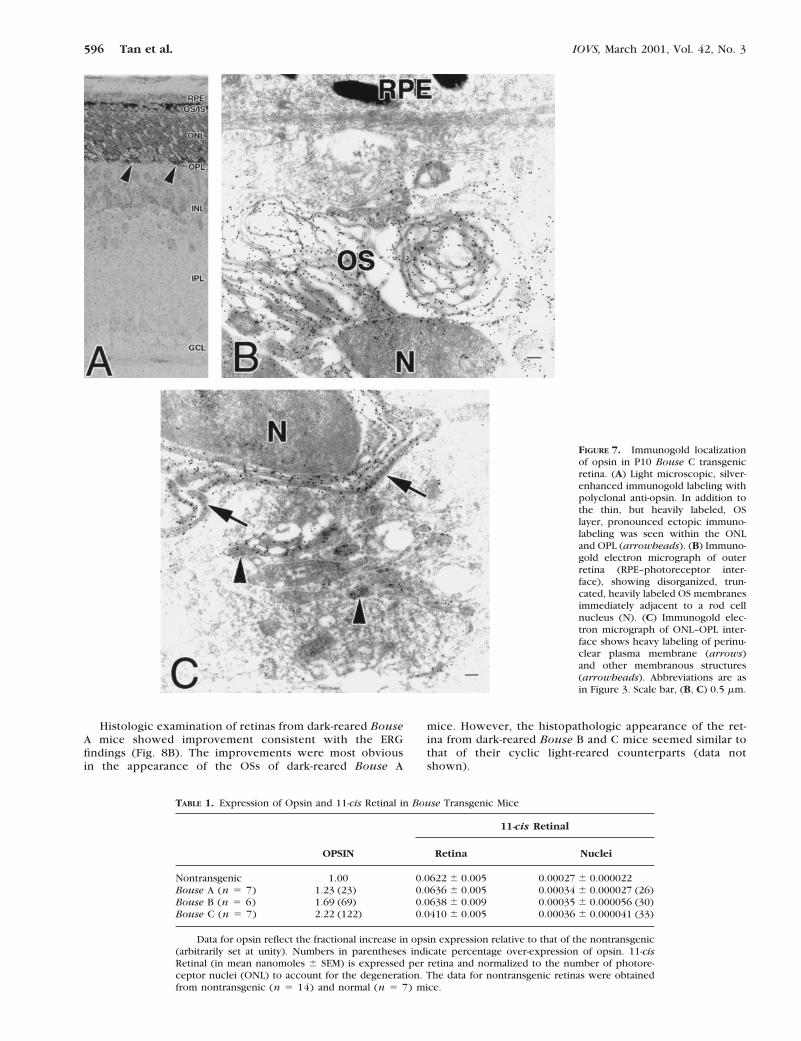
against purified bovine opsin was used, followed by gold-conjugated goat anti-rabbit IgG secondary antibodies for detec-tion. In the retinas of P15 Bouse A mice (Fig. 6), opsin waslocalized almost exclusively to rod photoreceptor OSs. Theabsence of labeling of some OSs (asterisk, Figs. 6B, 6C) iden-tifies these as cone photoreceptors, because the antibody doesnot recognize cone opsin (Fliesler SJ, unpublished results,1997). Vesicular structures were observed at the base of someROSs (arrowhead, Fig. 6C). However, such structures alsowere observed with comparable frequency in sections of non-transgenic retinas (not shown). Therefore, these vesicles arenot a result of the Bouse alteration, but probably representeither misaligned basal discs or a capricious artifact of tissuepreparation. Relatively sparse anti-opsin immunolabeling wasobserved along the rod cell plasmalemma and in other innersegment membrane compartments (Fig. 6C). Even less pro-nounced immunolabeling was detected at synaptic terminals inthe outer plexiform layer (OPL), which was very similar to thatobserved in nontransgenic retinas and in retinas of Bouse Btransgenic mice (data not shown). However, in Bouse C retinasat P10 (Fig. 7), anti-opsin immunolabeling of photoreceptorcell bodies and in the OPL was considerably more pronounced(Figs. 7A, 7C), reflecting loss of the normally polarized distri-bution of opsin (i.e., ectopic expression), consistent with theadvanced degeneration already present in Bouse C retinas at
P10. In this case, not only were the OSs very truncated andpoorly aligned, but they also had disorganized disc membranes(Fig. 7B).
These results indicate that opsin trafficking and localiza-tion in Bouse A retinas (and Bouse B retinas, not shown)were normal, thus suggesting that defects in opsin transportare unlikely to cause the degeneration noted in these lines.In Bouse C, however, the situation was complicated by theseverity of degeneration, and it is possible that abnormalitieseither in opsin transport or in redistribution after initialinsertion into the photoreceptor plasma membrane mayhave accelerated the degenerative process.
Relationship between Severity of Degenerationand Opsin Expression
To determine the level of opsin expression, retinas were ex-amined at P15 by ELISA. When mAb 1D4 was used, the valuesobtained for total opsin reflect both Bouse and endogenousforms. These values were normalized to those obtained forperipherin/rds, a photoreceptor-specific structural protein lo-calized in the OS, using a polyclonal antibody (anti-mRDS-C).33
Because peripherin/rds is an essential component of theOS,49,50 this normalization procedure accounted for the loss ofOSs due to the degenerative process. As shown in Table 1,
FIGURE 5. Opsin expression in nontransgenic and P15 Bouse A and Cretinas. Retina sections of normal and Bouse A mice were fixed withDavidson fixative. Anti-opsin mAb 1D4 or 3A6 was applied as theprimary antibody for immunostaining. Abbreviations are as in Figure 3.
FIGURE 4. Western blot analysis of Bouse opsins at P10. Aliquots of 2mg protein of extracts from bovine ROS, and nontransgenic (NT) andtransgenic retina homogenates were electrophoresed, transferred toPVDF membrane, and probed with mAb 1D4 (1:1000) for detectingopsin contents. Migration of protein molecular weight markers isspecified at left. Arrows: Monomeric form of opsin.
594 Tan et al. IOVS, March 2001, Vol. 42, No. 3
opsin expression levels for Bouse A, Bouse B, and Bouse Cmice were found to be, respectively, 123%, 169%, and 222% ofthe level measured in nontransgenic animals, indicating a cor-relation between the level of transgene expression and theseverity of the degenerative phenotype. Although the Bouse Aline exhibited the slowest rate of degeneration, these resultsindicate that overexpression of opsin by approximately 23% issufficient to trigger photoreceptor cell death, a finding inagreement with that previously reported by Sung et al.11 Thisvalue may not set a lower limit for opsin-induced photorecep-tor degeneration, but it clearly demonstrates the sensitivity ofrod photoreceptors to opsin overexpression.
11-cis Retinal Content of Normaland Bouse Retinas
To determine whether an increased level of opsin expres-sion is associated with an increased amount of 11-cis retinal,retinas of dark-reared P15 mice were analyzed for the molarquantity of 11-cis retinal. Results obtained from nontrans-genic and Bouse mice (Table 1, middle column) were nor-malized to the density of photoreceptor nuclei contained ina specified area of the ONL (Table 1, right column). In Bouse
A mice the 23% elevation, relative to nontransgenic mice, inthe amount of opsin was accompanied by an approximatelyequal increase in the amount of 11-cis retinal, (26%). In bothBouse B and Bouse C mice, however, 11-cis retinal levelswere increased by only 30% to 33%, well below the 69% and122% increases in opsin levels found in these two lines. In allanimals studied, 11-cis retinal was the major retinoid de-tected in the retina.
Effect of Light on the Rate ofRetinal Degeneration
Because the overall amount of rhodopsin in Bouse transgenicretinas was increased, the effects of light were investigated.Several litters were reared from birth in constant darkness, andERG recordings were made at P30, followed by histologicexamination. As shown in Figure 8A, the ERGs obtained fromBouse A mice were significantly larger when these mice werereared in darkness than when treated under cyclic light (P ,0.005, n 5 9). In comparison, dark rearing had a modest butinsignificant benefit in Bouse B mice (P . 0.10, n 5 8) and noeffect in Bouse C animals (Fig. 8A).
FIGURE 6. Immunogold localizationof opsin in P15 Bouse A transgenicretina. (A) Light microscopic, silver-enhanced immunogold labeling withpolyclonal anti-opsin, illustrating re-stricted localization of opsin to theOS. (B) Companion low-magnifica-tion electron micrograph, demon-strating normal ultrastructural orga-nization of the Bouse A outer retina(RPE–photoreceptor interface). Rect-angle: Area shown in higher magni-fication in (C). (C) Higher magnifica-tion electron micrograph, showingimmunogold labeling of rod photore-ceptors, showing restricted localiza-tion of gold label to OS. Arrowhead:Vesiculation of basal disc mem-branes. (❋) Nonlabeled photorecep-tor presumed to be a cone. Abbrevi-ations are as in Figure 3. Scale bar,(B) 2.5 mm; (C) 0.5 mm.
IOVS, March 2001, Vol. 42, No. 3 Opsin Expression and Retinal Degeneration 595
Histologic examination of retinas from dark-reared BouseA mice showed improvement consistent with the ERGfindings (Fig. 8B). The improvements were most obviousin the appearance of the OSs of dark-reared Bouse A
mice. However, the histopathologic appearance of the ret-ina from dark-reared Bouse B and C mice seemed similar tothat of their cyclic light-reared counterparts (data notshown).
FIGURE 7. Immunogold localizationof opsin in P10 Bouse C transgenicretina. (A) Light microscopic, silver-enhanced immunogold labeling withpolyclonal anti-opsin. In addition tothe thin, but heavily labeled, OSlayer, pronounced ectopic immuno-labeling was seen within the ONLand OPL (arrowheads). (B) Immuno-gold electron micrograph of outerretina (RPE–photoreceptor inter-face), showing disorganized, trun-cated, heavily labeled OS membranesimmediately adjacent to a rod cellnucleus (N). (C) Immunogold elec-tron micrograph of ONL–OPL inter-face shows heavy labeling of perinu-clear plasma membrane (arrows)and other membranous structures(arrowheads). Abbreviations are asin Figure 3. Scale bar, (B, C) 0.5 mm.
TABLE 1. Expression of Opsin and 11-cis Retinal in Bouse Transgenic Mice
OPSIN
11-cis Retinal
Retina Nuclei
Nontransgenic 1.00 0.0622 6 0.005 0.00027 6 0.000022Bouse A (n 5 7) 1.23 (23) 0.0636 6 0.005 0.00034 6 0.000027 (26)Bouse B (n 5 6) 1.69 (69) 0.0638 6 0.009 0.00035 6 0.000056 (30)Bouse C (n 5 7) 2.22 (122) 0.0410 6 0.005 0.00036 6 0.000041 (33)
Data for opsin reflect the fractional increase in opsin expression relative to that of the nontransgenic(arbitrarily set at unity). Numbers in parentheses indicate percentage over-expression of opsin. 11-cisRetinal (in mean nanomoles 6 SEM) is expressed per retina and normalized to the number of photore-ceptor nuclei (ONL) to account for the degeneration. The data for nontransgenic retinas were obtainedfrom nontransgenic (n 5 14) and normal (n 5 7) mice.
596 Tan et al. IOVS, March 2001, Vol. 42, No. 3

Determining the Effects of the C-TerminalModifications of Bouse
To demonstrate that the C-terminal amino acid alterationsmade to generate the Bouse epitope do not by themselvesinduce photoreceptor degeneration, Bouse mice were bredwith opsin2/2 mice.24 Because a minimum of 50% of thewild-type amount of opsin is required to support the morpho-genesis of OSs,24 only Bouse B mice were used. After extensivematings, mice that were heterozygous for the Bouse B trans-gene and opsin2/2 were obtained. Examination of these ani-mals indicated that their retinal histology and ERG recordingswere indistinguishable from those of wild-type mice. As shownin Figure 9, Bouse opsin alone supported the OS morphogen-esis and maintenance. Dark-adapted ERG a-waves were com-parable with those of wild-type mice (data not shown).
DISCUSSION
We generated transgenic mice that express a modified yetnormal form of opsin and used these animals to investigate thedegenerative process associated with overexpression of opsin.Evidence of photoreceptor degeneration was provided by an-atomic and electrophysiological studies of the heterozygoustransgenic retina. There was a clear correlation between theseverity of the degenerative phenotype and the level of trans-gene expression. At low levels of expression, however, bothtransgenic and endogenous opsins were correctly localized to
photoreceptor OSs, and opsin was not found in other cellularcompartments. This was determined by immunocytochemistryusing antibodies that recognize the endogenous mouse opsin(mAb 1D4) or the transgenic Bouse form of opsin (mAb 3A6)in which a bovine-like epitope was created by the introductionof three amino acid alterations at the C terminus. Because theBouse transgene did not induce degeneration when expressedin opsin2/2 mice (i.e., in the absence of the endogenousopsin) Bouse transgenic mice provided an opportunity to ex-amine the implications of rhodopsin overexpression in photo-receptor degeneration.
A number of prior studies have shown that expression ofmutant forms of opsins induce photoreceptor degeneration intransgenic mice.7–12,14 In one study, mice expressing as little as10% more opsin transcript exhibited a notable reduction in thenumber of photoreceptors by 8 weeks of age,11 whereas inanother study, expression levels as high as 100% over endog-enous levels did not cause retinal degenerative changes.10 Thisdiscrepancy may result from the use of a semiquantitativemethod such as PCR to determine the steady state levels ofopsin transcripts.10,11 Although we determined the amount ofthe protein rather than the transcript, we find our data more inagreement with the first study, because only approximately20% overexpression of opsin was sufficient to cause functionaldeficits and structural abnormalities in ROSs. In this regard, itis worth noting that homozygous Bouse A mice, presumablyexpressing twice as much opsin (.40%), exhibited a moresevere retinal degeneration than did their heterozygous coun-terparts (data not shown). Finally, it is of interest to note thatno studies of opsin overexpression have reported a notableincrease in the length or width of the ROS, despite the increasein opsin synthesis and the fact that overexpressed opsin islocalized to the ROS.10,11 Nevertheless, careful morphometricanalysis will be required to demonstrate conclusively whetheror not ROS of mice overexpressing rhodopsin have abnormaldimensions.
The present results indicate that it is difficult to concludethat the degeneration is uniquely related to the particular genedefect that was introduced, without dissection of the deleteri-ous effect induced by overexpression of opsin itself. Moreover,it is possible that a similar situation applies to other models inwhich a mutant opsin transgene is expressed either inpigs13,43,51 or rats.52 With mice, the development of opsin2/2
lines24,25 provides the opportunity to distinguish betweenthese two factors. The properties of a mutant opsin can beevaluated by expression in the opsin2/2 background. In cer-tain cases it may be more appropriate to express a transgene inopsin1/2 heterozygotes, which express only 50% of the en-dogenous (wild-type) protein. This is determined by the levelsof expression of the mutant transgenic protein. Although othertechniques, including knock-in, have the potential to introducea mutant rhodopsin gene in a manner that allows experimentalresults to be clearly interpreted, the present study emphasizesthe need for the continued development of accurate animalmodels for human photoreceptor degeneration associated withopsin mutations.
The Degenerative Mechanism
There are several possible mechanisms by which the overex-pression of opsin could lead to death of rod photoreceptors.For example, the overproduction of opsin could simply over-whelm the transport machinery, and cell death would beinitiated by mislocalized opsin molecules. Although opsin mis-localization has been observed in transgenic mice expressingpig51 or human10,11 opsins, electron microscopic immuno-analysis of retinas of Bouse A transgenic mice indicate thatboth endogenous and transgenic opsins were properly local-ized to the OSs. These results argue against opsin mislocaliza-tion as a major cause of cell death in Bouse mice.
FIGURE 8. (A) Amplitude of the dark-adapted ERG a-wave in responseto a high-intensity stimulus (1.0 log cd sec/m2). Data are average resultsfor 5 to 10 mice reared from birth in constant darkness (filled bars) orunder constant light (open bars); error bars: 6 1 SD. (❋) Statisticallysignificant differences (P , 0.05, t-test) between the dark- and cyclic-light–reared group. (B) Histologic appearance of cyclic-light– and dark-reared Bouse retinas at 30 days of age. Abbreviations are as in Figure 3.
IOVS, March 2001, Vol. 42, No. 3 Opsin Expression and Retinal Degeneration 597

The relationship between opsin levels and the amount of11-cis retinal in the retina was examined at P15, an age whenOS has been elaborated and degeneration is minimal. In BouseA mice, for which the overexpression of opsin was on average23%, the amount of 11-cis retinal per unit density of ONL nucleiexceeded the average for nontransgenic mice by 26% (Table 1,right column). Relative amounts of opsin were normalized tothe amount of peripherin/rds in the analyzed sample becauseits levels at P10 were comparable in both Bouse transgenic andnontransgenic retinas as determined by western analyses (datanot shown). Because at P15 retinal degeneration in Bouse C isalready under way (data not shown), peripherin/rds was usedto account for the loss of OS assuming that opsin and periph-erin/rds disappear at the same rate with the reduction in theOS. The values for relative opsin level are effectively scaled tothe number of photoreceptors present, and the level of opsinoverexpression may be compared with the observed increasein 11-cis retinal in Bouse A mice. The results suggest that inBouse A opsin overexpression leads to increase of 11-cis retinalsufficient to match the chromophore requirement of the 23%opsin overexpression. There would appear, however, to be alimit to such an induced increase in 11-cis retinal level. In thehigher expressing Bouse B and C, a substantial percentage ofopsin molecules have no 11-cis retinal chromophore. It has
been suggested that free opsin arising in vitamin A deprivation,as well as some mutant forms of opsin that cannot bind 11-cisretinal, can excite the phototransduction cascade.53 It wouldbe of interest in future studies to examine the effect in BouseB and Bouse C mice of systemic vitamin A administration, atreatment that has been found in other studies of transgenicmice54 and human trials55 to promote recovery of visual sen-sitivity.
There are several other means through which overexpres-sion of opsin could lead to cell death. For example, becausesome fraction of the overproduced opsin is coupled to thechromophore, the number of photobleachable rhodopsin mol-ecules is increased. As a result, a given amount of light fallingon the retina would be expected to activate relatively morerhodopsin molecules in Bouse retinas than it does in thenormal retina. If there is a limited supply of proteins that areinvolved in deactivating the phototransduction cascade, thephotoactivated rhodopsin may have a longer life—that is, theeffect can be likened to prolonged light exposure.
Because dark rearing of Bouse A mice did not restore theirERGs to those of their normal counterparts, there must beanother mechanism besides the increased amount of totalrhodopsin that contributes to the cell death. Opsin constitutes80% to 90% of the OS proteins,56,57 and because 10% of the OS
FIGURE 9. Histologic appearance ofretinas from cyclic-light–reared BouseB and nontransgenic mice in the wild-type and opsin2/2 backgrounds atP30. Abbreviations are as in Figure 3.
598 Tan et al. IOVS, March 2001, Vol. 42, No. 3

is regenerated each day58 the cell must resynthesize 10% oftotal opsin daily, as well as all the other proteins that arerequired for the genesis of the OS. These other proteins in-clude peripherin/rds, rom-1, the phototransduction cascademembers as well as the proteins involved in packaging, trans-port and OS assembly. Because it appears that the vast majorityof the available opsin is shipped to the OSs of Bouse mice, theincreased synthesis of opsin presumably is also associated withan increased synthesis of other needed proteins. As a result, inBouse mice, it is feasible that the photoreceptor cell is func-tioning at the threshold of its maximum translational capacity.The net result is a situation that is likely to be unsustainable andmay ultimately lead to cell death.
It is interesting to note that the same situation does notappear to apply to cone photoreceptors. Shaaban et al.59 stud-ied transgenic mice in which the human long-wavelength coneopsin gene was expressed in cones of transgenic mice usingthe human red-green cone opsin promoter. These mice exhib-ited no evidence of cone photoreceptor degeneration, evenwhen the transgenic cone opsin was expressed at rod opsinlevels that are known to compromise rod photoreceptors.10,11
This may be due to the considerably faster regeneration of thephotobleached cone pigment when compared with rhodop-sin.60–62 The explanation for this fundamental difference be-tween rod and cone photoreceptors may provide importantinsights into the photoreceptor degeneration induced by opsinoverexpression.
Clinical Implications
The results described here have implications for the under-standing of photoreceptor degeneration, particularly in retini-tis pigmentosa. Although much effort has been devoted to theidentification of point mutations in the coding regions of theopsin gene, it is possible that some forms of retinitis pigmen-tosa may be due to an abnormally high level of rhodopsin (oropsin) expression. To evaluate this possibility, it is importantto understand the regulatory mechanism that controls the rateof opsin gene expression. In this regard it is interesting to notethat mutations in Crx, a regulatory element for opsin expres-sion, are linked to retinitis pigmentosa.63–65 It is possible thata dominant positive mutation in crx could lead to rhodopsinoverexpression, thus causing a retinal degenerative disorder. Ifthis is the case, the Bouse mouse could provide a useful modelin which to conduct treatment trials, through pharmacologicintervention, gene therapy, or other means.
In conclusion, the present results confirm that rod photo-receptor degeneration can be induced by overexpression of anormal opsin gene, a factor that should be considered whenevaluating studies of mice expressing a mutant opsin trans-gene. These results also indicate that precise control of opsinexpression is of critical importance in maintaining viable pho-toreceptors. As a consequence, these findings underscore theimportance of completely identifying genes that regulate rho-dopsin expression. They further indicate that identification ofthese genes is a potentially fruitful avenue for the identificationof gene defects that may underlie retinitis pigmentosa andother retinal disorders.
Acknowledgments
The authors thank Harris Ripps for helpful comments on the manu-script; Jiang Yu, Chi-yen Miller, Laura Bucher, and Shihong Li fortechnical help; Robert S. Molday and Gabriel Travis for providing theantibodies used in this study; and Nancy Mangini for providing some ofthe bovine ROS preparations used.
References
1. Rattner A, Sun H, Nathans J. Molecular genetics of human retinaldisease. Ann Rev Genet. 1999;33:89–131.
2. Berson EL. Retinitis pigmentosa: The Friedenwald Lecture. InvestOphthalmol Vis Sci. 1993;34:1659–1676.
3. Heckenlively JR. Autosomal dominant retinitis pigmentosa. Retini-tis Pigmentosa. Philadelphia: JB Lippincott; 1988:125–149.
4. Humphries P. Hereditary retinopathies: insight into a complexgenetic etiology. Br J Ophthalmol. 1993;77:469–470.
5. Pagon RA. Retinitis pigmentosa. Surv Ophthalmol. 1988;33:137–177.
6. Chen J, Makino CL, Peachey NS, Baylor DA, Simon MI. Mechanismof rhodopsin inactivation in vivo as revealed by COOH-terminaltruncation mutant. Science. 1995;267:374–377.
7. Gryczan CW, Kuszak JR, Novak L, Peachey NS, Goto Y, Naash MI.A transgenic mouse model for autosomal dominant retinitis pig-mentosa caused by a three base pair deletion in codon 255/256 ofthe opsin gene [ARVO Abstract]. Invest Ophthalmol Vis Sci. 1995;36:S423. Abstract nr 1941.
8. Naash MI, Hollyfield JG, Al-Ubaidi MR, Baehr W. Simulation ofhuman autosomal dominant retinitis pigmentosa in transgenicmice expressing a mutated murine opsin gene. Proc Natl Acad SciUSA. 1993;90:5499–5503.
9. Naash MI, Al-Ubaidi MR, Hollyfield JG, Baehr W. Simulation ofautosomal dominant retinitis pigmentosa in transgenic mice. In:Hollyfield JG, Anderson RE, LaVail MM Retinal Degeneration:Clinical and Laboratory Applications. New York: Plenum; 1993:201–210.
10. Olsson JE, Gordon JW, Pawlyk BS, et al. Transgenic mice with arhodopsin mutation (Pro23His): a mouse model of autosomal dom-inant retinitis pigmentosa. Neuron. 1992;9:815–830.
11. Sung C-H, Makino C, Baylor D, Nathans J. A rhodopsin genemutation responsible for autosomal dominant retinitis pigmentosaresults in a protein that is defective in localization to the photo-receptor outer segment. J Neurosci. 1994;14:5818–5833.
12. Zozulya SA, Gurevich VV, Zvyaga TA, et al. Functional expressionin vitro of bovine visual rhodopsin. Protein Eng. 1990;3:453–458.
13. Huang PC, Gaitan AE, Hao Y, Petters RM, Wong F. Cellular inter-actions implicated in the mechanism of photoreceptor degenera-tion in transgenic mice expressing a mutant rhodopsin gene. ProcNatl Acad Sci USA. 1993;90:8484–8488.
14. Chen J, Woodford, B, Jiang, H, Nakayama T, Simon MI. Expressionof a c-terminal truncated rhodopsin gene leads to retinal degener-ation in transgenic mice [ARVO Abstract]. Invest Ophthalmol VisSci. 1993;34:S768. Abstract nr 333.
15. Hicks D, Molday RS. Differential immunogold-dextran labeling ofbovine and frog rod and cone cells using monoclonal antibodiesagainst bovine rhodopsin. Exp Eye Res. 1986;42:55–71.
16. Hodges RS, Heaton RJ, Robert Parker JM, Molday L, Molday RS.Antigen-antibody interaction: synthetic peptides define linear an-tigenic determinants recognized by monoclonal antibodies di-rected to the cytoplasmic carboxyl terminus of rhodopsin. J BiolChem. 1988;263:11768–11775.
17. Al-Ubaidi MR, Pittler SJ, Champagne MS, Triantafyllos JT, McGinnisJF, Baehr W. Mouse opsin: gene structure and molecular basis ofmultiple transcripts. J Biol Chem. 1990;265:20563–20569.
18. Deretic D, Puleo–Scheppke B, Trippe C. Cytoplasmic domain ofrhodopsin is essential for post-Golgi vesicle formation in a retinalcell-free system. J Biol Chem. 1996;271:2279–2286.
19. Hogan B, Costantini F, Lacy E. Manipulating The Mouse Embryo:A Laboratory Manual. Cold Spring Harbor, New York: ColdSpring Harbor Laboratory; 1986.
20. Chen S, Evans GA. A simple screening method for transgenic miceusing the polymerase chain reaction. Biotechniques. 1990;8:32–35.
21. Quiambao AB, Peachey NS, Mangini NJ, Rohlich P, Hollyfield JG,Al-Ubaidi MR. A 221-bp fragment of the mouse opsin promoterdirects expression specifically to the rod photoreceptors of trans-genic mice. Vis Neurosci. 1997;14:617–625.
22. Xu X, Quiambao AB, Roveri L, et al. Degeneration of cone photo-receptors induced by expression of the Mas1 proto-oncogene. ExpNeurol. 2000;163:207–219.
23. O’Brien J, Ripps H, Al-Ubaidi MR. Molecular cloning of a rod opsincDNA from the skate retina. Gene. 1997;193:141–150.
24. Lem J, Krasnoperova NV, Calvert PD, et al. Morphological, physi-ological and biochemical changes in rhodopsin knockout mice.Proc Natl Acad Sci USA. 1999;96:736–741.
IOVS, March 2001, Vol. 42, No. 3 Opsin Expression and Retinal Degeneration 599
25. Humphries MM, Rancourt D, Farrar GJ, et al. Retinopathy inducedin mice by targeted disruption of the rhodopsin gene. Nat Genet.1997;15:216–219.
26. Peachey NS, Goto Y, Al-Ubaidi MR, Naash MI. Properties of themouse cone-mediated electroretinogram during light adaptation.Neurosci Lett. 1993;162:9–11.
27. Al-Ubaidi MR, Hollyfield JG, Overbeek PA, Baehr W. Photoreceptordegeneration induced by the expression of simian virus 40 largetumor antigen in the retina of transgenic mice. Proc Natl Acad SciUSA. 1992;89:1194–1198.
28. Moore KL, Graham MA, Barr ML. The detection of chromosomalsex in hermaphrodites from a skin biopsy. Surg Gynecol Obstet.1953;96:641–648.
29. Moore KL, Graham MA, Barr ML. Nuclear morphology, accordingto sex, in human tissues. Acta Anat. 1954;21:197–208.
30. Erickson PA, Lewis GP, Fisher SK. Post-embedding immunocyto-chemical techniques for light and electron microscopy. MethodsCell Biol. 1993;37:283–310.
31. Laemmli UK. Cleavage of structural proteins during assembly ofthe head of bacteriophage T4. Nature. 1970;227:680–685.
32. Towbin H, Staehelin T, Gordon J. Electrophoretic transfer of pro-teins from polyacrylamide gels to nitrocellulose sheets: procedureand some applications. Proc Natl Acad Sci USA. 1979;76:4350–4354.
33. Kedzierski W, Weng J, Travis GH. Analysis of the rds/peripherion-rom1 complex in transgenic photoreceptors that express a chi-meric protein. J Biol Chem. 1999;274:29181–29187.
34. Papermaster DS. Preparation of retinal rod outer segments. Meth-ods Enzymol. 1982;81:48–52.
35. Litman B. Purification of rhodopsin by concanavalin A affinitychromatography. Methods Enzymol. 1982;81:150–160.
36. Qtaishat NM, Okajima TIL, Li S, Naash MI, Pepperberg DR. Retin-oid kinetics in eye tissues of VPP transgenic mice and their normallittermates. Invest Ophthalmol Vis Sci. 1999;40:1040–1049.
37. Suzuki T, Fujita Y, Noda Y, Miyata S. A simple procedure for theextraction of the native chromophore of visual pigments: theformaldehyde method. Vision Res. 1986;26:425–429.
38. Suzuki T, Maeda Y, Toh Y, Eguchi E. Retinyl and 3-dehydroretinylesters in the crayfish retina. Vision Res. 1988;28:1061–1070.
39. Okajima T-IL, Pepperberg DR. Retinol kinetics in the isolatedretina determined by retinoid extraction and HPLC. Exp Eye Res.1997;65:331–340.
40. Robson JG, Frishman LJ. Response linearity and kinetics of the catretina: the bipolar cell component of the dark-adapted electroreti-nogram. Vis Neurosci. 1996;12:837–850.
41. Lamb TD. Gain and kinetics of activation in the G-protein cascadeof phototransduction. Proc Natl Acad Sci USA. 1996;93:566–570.
42. Goto Y, Peachey NS, Ripps H, Naash MI. Functional abnormalitiesin transgenic mice expressing a mutant rhodopsin gene. InvestOphthalmol Vis Sci. 1995;36:62–71.
43. Petters RM, Alexander CA, Wells EB, et al. Genetically engineeredlarge animal model for studying cone photoreceptor survival anddegeneration in retinitis pigmentosa. Nat Biotech. 1997;15:965–970.
44. Peachey NS, Fishman GA, Derlacki DJ, Alexander KR. Rod andcone dysfunction in carriers of X-linked retinitis pigmentosa. Oph-thalmology. 1988;95:677–685.
45. Birch DG, Anderson JL, Fish GE. Yearly rates of rod and conefunctional loss in retinitis pigmentosa and cone-rod dystrophy.Ophthalmology. 1999;106:258–268.
46. Wong F. Visual pigments, blue cone monochromasy, and retinitispigmentosa. Arch Ophthalmol. 1990;108:935–936.
47. Sandberg MA, Berson EL. Blue and green cone mechanisms inretinitis pigmentosa. Invest Ophthalmol Vis Sci. 1977;16:149–157.
48. Hood DC, Birch DG. Abnormalities of the retinal cone system inretinitis pigmentosa. Vision Res. 1996;36:1699–1709.
49. Travis GH, Sutcliffe JG, Bok D. The retinal degeneration slow(rds) gene product is a photoreceptor disc membrane-associatedglycoprotein. Neuron. 1991;6:61–70.
50. Travis GH, Bok D. A molecular characterization of the retinaldegeneration slow (rds) mouse mutation. In: Hollyfield JG, Ander-son RE, LaVail MM, eds. Retinal Degeneration: Clinical and Lab-oratory Applications. New York: Plenum; 1993:219–230.
51. Wong F. Creating transgenic mouse models of photoreceptordegeneration caused by mutations in the rhodopsin gene. In:Hollyfield JG, Anderson RE, LaVail MM, eds. Retinal Degeneration:Clinical and Laboratory Applications. New York: Plenum; 1993:211–217.
52. Steinberg RH, Flannery JG, Naash MI, et al. Transgenic rat modelsof inherited retinal degeneration caused by mutant opsin genes[ARVO Abstract]. Invest Ophthalmol Vis Sci. 1996;37(3):S698.Abstract nr 3190.
53. Fain GL, Lisman JE. Photoreceptor degeneration in vitamin Adeprivation and retinitis pigmentosa: the equivalent light hypoth-esis. Exp Eye Res. 1993;57:335–340.
54. Li T, Sandberg MA, Pawlyk BS, et al. Effect of vitamin A supple-mentation on rhodopsin mutants threonine-17-methionine andproline-347-serine in transgenic mice and in cell cultures. ProcNatl Acad Sci USA. 1998;95:11933–11938.
55. Berson EL, Rosner B, Sandberg MA, et al. A randomized trial ofvitamin A and vitamin E supplementation for retinitis pigmentosa.Arch Ophthalmol. 1993;111:761–772.
56. Molday RS, Molday LL. Differences in the protein composition ofbovine retinal rod outer segment disk and plasma membranesisolated by a ricin-gold-dextran density perturbation method. J CellBiol. 1987;105:2589–2601.
57. Papermaster DS, Dreyer WJ. Rhodopsin content in the outer seg-ment membranes of bovine and frog retinal rods. Biochemistry.1974;13:2438–2444.
58. Young RW. Visual cells and the concept of renewal. Invest Oph-thalmol Vis Sci. 1976;15:700–725.
59. Shaaban SA, Crognale MA, Calderone JB, Huang J, Jacobs GH, DeebSS. Transgenic mice expressing a functional human photopigment.Invest Ophthalmol Vis Sci. 1998;39:1036–1043.
60. Ripps H, Weale RA. Rhodopsin regeneration in man. Nature.1969;222:775–777.
61. Alpern M, Maaseidvaag F, Ohba N. The kinetics of cone visualpigments in man. Vision Res. 1971;11:539–549.
62. Hollins M, Alpern M. Dark adaptation and visual pigment regener-ation in human cones. J Gen Physiol. 1973;62:430–447.
63. Swaroop A, Wang QL, Wu W, et al. Leber congenital amaurosiscaused by a homozygous mutation (R90W) in the homeodomain ofretinal transcription factor CRX: direct evidence for the involve-ment of CRX in the development of photoreceptor function. HumMol Genet. 1999;8:299–305.
64. Jacobson SG, Cideciyan AV, Huang Y, et al. Retinal degenerationwith truncation mutations in the cone–rod homeobox (CRX)gene. Invest Ophthalmol Vis Sci. 1998;39:2417–2426.
65. Sohocki MM, Sullivan LS, Mintz–Hittner HA, et al. A range ofclinical phenotypes associated with mutations in CRX, a photore-ceptor transcription-factor gene. Am J Hum Genet. 1998;63:1307–1315.
600 Tan et al. IOVS, March 2001, Vol. 42, No. 3
Copyright © 2022 FDOKUMEN