Terrorist attacks escalate in frequency and fatalities preceding highly lethal attacks
Upload
independentCategory
view
0download
0
Alzheimer’s & Dementia - (2014) 1-9
Research Article
Widespread white matter degeneration preceding the onset of dementia
Klaus H. Maier-Heina,b,c,*, Carl-Fredrik Westina, Martha E. Shentona,d,e, Michael W. Weinerf,Ashish Rajg, Philipp Thomannh, Ron Kikinisa, Bram Stieltjesc, Ofer Pasternaka,d
aDepartment of Radiology, Brigham and Women’s Hospital, Harvard Medical School, Boston, MA, USAbJunior Group Medical Image Computing, German Cancer Research Center, Heidelberg, Germany
cJunior Group Quantitative Image-based Disease Characterization, German Cancer Research Center, Heidelberg, GermanydDepartment of Psychiatry, Brigham and Women’s Hospital, Harvard Medical School, Boston, MA, USAeHealth Scientist, Veterans Affairs Boston Healthcare System, Brockton Division, Brockton, MA, USA
fCenter for Imaging of Neurodegenerative Disease, San Francisco VA Medical Center, University of California, San Francisco, USAgImage Data Evaluation and Analytics Lab (IDEAL), Weill Cornell Medical College, New York, NY, USA
hDepartment of General Psychiatry, Section of Geriatric Psychiatry, Ruprecht-Karls-University, Heidelberg, Germany
Abstract Background: Brain atrophy in subjects with mild cognitive impairment (MCI) introduces partial
*Corresponding a
2345.
E-mail address: k.
1552-5260/$ - see fro
http://dx.doi.org/10.10
volume effects, limiting the sensitivity of diffusion tensor imaging to white matter microstructuraldegeneration. Appropriate correction isolates microstructural effects in MCI that might be precursorsof Alzheimer’s disease (AD).Methods: Forty-eight participants (18 MCI, 15 AD, and 15 healthy controls) had magnetic reso-nance imaging scans and clinical evaluations at baseline and follow-up after 36months. TenMCI sub-jects were diagnosed with AD at follow-up and eight remained MCI. Free-water (FW) correctedmeasures on the white matter skeleton were compared between groups.Results: FW corrected radial diffusivity, but not uncorrected radial diffusivity, was increased acrossthe brain of the converted group compared with the nonconverted group (P , .05). The extent of in-creases was similar to that found comparing AD with controls.Conclusion: Partial volume elimination reveals microstructural alterations preceding dementia.These alterations may prove to be an effective and feasible early biomarker of AD.� 2014 The Alzheimer’s Association. All rights reserved.
Keywords: Alzheimer’s disease; Mild cognitive impairment; Diffusion tensor imaging; Partial volume elimination; Free-wa-
ter imaging
1. Background
Magnetic resonance imaging (MRI) can identify patho-logical brain alterations associated with Alzheimer’s disease(AD) [1]. These include macrostructural effects such as graymatter (GM) and white matter (WM) atrophy, and micro-structural WM alterations, such as Wallerian degenerationand compromised myelin integrity. GM atrophy can be iden-tified using volumetric measures based on anatomical MRI,
uthor. Tel.: 149-6221/42-3545; Fax: 149-6221/42-
nt matter � 2014 The Alzheimer’s Association. All rights r
16/j.jalz.2014.04.518
whereas microstructural alterations can be identified usingdiffusion MRI (dMRI), a method that is sensitive to micronscale tissue architecture [2].
Mild cognitive impairment (MCI) is often a prestage ofAD with a tenfold higher risk of developing dementiacompared with healthy subjects [3]. Therefore, the detectionof imaging abnormalities in MCI may increase our under-standing of the pathogenesis of AD, as it may lead toimproved early detection of patients at risk, and may thusprovide an objective means for the assessment of medica-tion(s) in early stage clinical trials. MRI studies have notyet been able to provide a robust diagnostic measure forthe early stages of the disease [4]. Specifically, dMRI studiesreport inconsistent findings when comparing patients with
eserved.

K.H. Maier-Hein et al. / Alzheimer’s & Dementia - (2014) 1-92
MCI and controls, even when using similar analysis methods(e.g., see tract-based spatial statistics [TBSS] studies inTable S1).
The inconsistent findings in MCI might stem from thefact that the cognitive deficits of some patients may stabilize,improve, or progress to other dementias [5]. Patients withMCI are also likely to have different underlying pathology,as for example some subjects have AD pathology in theform of neurofibrillary tangles of hyperphosphorylated tau(p-tau) and beta amyloid (Ab) neuritic plaques [6], whichmay be responsible for the MCI, whereas others may nothave AD pathology, and their MCI is due to other pathol-ogies [5]. Therefore, patients with MCI do not compriseone clinical entity, which limits the predictive validity ofMCI imaging abnormalities as a predementia syndromeand/or as biomarkers of AD pathology [7–10].
Another limiting factor in the study of patients with MCIand AD is the influence of brain atrophy on the sensitivity ofdMRI to microstructural changes. Part of the atrophy islikely age associated, because atrophy also appears innormal aging [11]. Moreover, many structural MRI studieshave demonstrated increased GM atrophy (e.g., hippocampi,entorhinal cortex, amygdala) and WM atrophy (e.g., corpuscallosum) in patients with AD or MCI in comparison withage-matched controls [12,13]. Atrophy in subjects withMCI might be an early manifestation of AD pathology[14]. Nevertheless, atrophy has limited specificity as a pre-curser of AD, as it may appear both in subjects with MCIwho will develop AD and also appear in those who willnot, as well as in patients with other brain disorders. Atrophyintroduces macroscopic morphologic changes in WM, suchas loss of volume, reduced cellular density, and increasedextracellular space [15], which due to the limited resolutionof dMRI, increases the influence of partial volume betweendifferent tissues [16]. Unless these macroscopic morpho-logic changes are accounted for, they decrease dMRI speci-ficity and lead to difficulties in the interpretation of derivedmeasurements. Thus, the partial volume effects associatedwith variable amounts of atrophy may have affected the
Table 1
Demographic and clinical characterization of subject groups
HC MCI
N 15 18
Age 63.0 6 9.4 71.9 6 6.5
Sex (m/f) 8/7 7/11
MMSE 29.3 6 0.7 26.4 6 1.5
Verbal fluency .746 6 .946 2.133 6 1.21 2Boston naming test .653 6 .312 2.686 6 1.91 2Word list learning 2.020 6 .651 21.48 6 1.18 2Word list delayed recall .0287 6 .739 21.60 6 1.49 2Word list recognition .317 6 .411 21.92 6 2.40 2Constructional praxis .287 6 1.33 .195 6 1.18 2Delayed constructional praxis .733 6 .769 2.268 6 1.43 2
Abbreviations: AD, Alzheimer’s disease; MCI-c, mild cognitive impairment, lat
with dementia; MMSE, Mini-Mental State Examination; HC, healthy controls; m
*Group effect P , .05.yGroup effect with P , 1023.
interpretation of previous data [16]. This, in conjunctionwith the group heterogeneity, might explain the diversityof previous findings regarding dMRI alterations in MCI.
Our aim is to decouple macroscopic and microscopic ef-fects and obtain dMRI derived microstructural precursors ofdementia by studying a sample of subjects diagnosed withMCI who were followed for 3 years after an initial MRIscan. Within this period, some subjects developed dementiaand were diagnosed with AD, whereas others did not. Bycomparing these two subsets of MCI subjects, we wereable to identify abnormalities that may constitute an earlyprecursor of AD. These abnormalities were revealed onlywhen controlling for partial-volume effects by applyingthe free-water (FW) imaging method [17], which correctseach image voxel for contamination from freely diffusingextracellular water molecules. The method separatelymodels the contribution of such molecules from water mol-ecules that are in the vicinity of cellular membranes such asaxonal membrane and myelin sheath [18]. By eliminatingthe extracellular contribution, the method accounts forpartial-volume that could be introduced by atrophy, andmakes it possible to identify whether microstructuralchanges, such as WM degeneration occur [16].
2. Methods
2.1. Study populations
This study comprised 48 subjects including 18 patientsdiagnosed with MCI, 15 patients diagnosed with AD, and15 age-matched healthy control subjects (HC). A demo-graphic and clinical characterization of the groups can befound in Table 1. Group effects were evaluated using anal-ysis of deviance for the generalized linear model imple-mented in MathWorks Matlab (R2012a, 7.14.0.739).Global cognitive deficits were assessed using the mini-mental state examination (MMSE). Cognitive performancewas investigated with a standardized extensive neuropsy-chological test battery (CERAD). Subjects were classified
AD MCI-c MCI-nc Group effect
15 10 8
73.6 6 7.7 72.3 6 7.5 71.4 6 5.5 –
5/10 4/6 3/5 –
19.2 6 4.9 26.1 6 1.8 26.8 6 0.9 y
1.19 6 1.09 2.300 6 1.30 .055 6 1.15 y
2.4 6 1.93 21.00 6 2.32 2.330 6 1.37 y
4.15 6 3.2 21.61 6 1.18 21.32 6 1.25 y
3.31 6 .681 21.70 6 1.46 21.50 6 1.61 y
4.73 6 2.91 22.91 6 2.75 2.801 6 1.37 y
1.32 6 2.47 2.0667 6 1.5 .490 6 .638 *
2.73 6 1.32 -.553 6 1.18 .0537 6 1.69 y
er diagnosed with AD; MCI-nc, mild cognitive impairment, did not develop
/f, male/female.

K.H. Maier-Hein et al. / Alzheimer’s & Dementia - (2014) 1-9 3
as healthy if they scored within the age- and education-adjusted norm with respect to each of the CERAD subtests.The MCI diagnosis was defined by Levy’s criteria of aging-associated cognitive decline [19] (see Supplement S1). Mildto moderate AD was defined by the National Institute ofNeurological and Communicative Disorders and Strokeand the Alzheimer’s Disease and Related Disorders Associ-ation (NINCDS-ADRDA) criteria. The clinical evaluationof all subjects included ascertainment of personal and fam-ily history, as well as physical, neurological, and neuropsy-chological examinations. Those with a history of ischemicheart disease, cancer, extensive macro- and microangio-pathic changes onMRI, and severe cerebrovascular risk fac-tors (e.g., instable hypertension or poorly controlleddiabetes) were excluded. An MRI scan and a clinical eval-uation took place at the time of recruitment. Clinical reeval-uation of the patients with MCI was performed 3 years afterinclusion in the study (range 35–37 months). MRI was notacquired during reevaluation. During these 3 years, 10 pa-tients with MCI diagnostically converted to AD (MCI-c),whereas the remaining 8 patients with MCI maintained sta-ble (MCI-nc). The local institutional review board approvedall study protocols and written informed consent was ob-tained from all patients or their legal guardians.
2.2. Image acquisition and preprocessing
Magnetization prepared rapid gradient echo (MPRAGE)and dMRI imaging was performed on a 1.5 T clinical scan-ner. The acquisition and preprocessing protocol is describedin the Supplements (S2).
2.3. Diffusion MRI processing
The diffusion tensor imaging (DTI) model was fitted usingthe tensor toolkit (https://gforge.inria.fr/projects/ttk) and usedto quantify fractional anisotropy (FA), radial diffusivity (RD),and axial diffusivity (AXD). The AXD and RD measures, inparticular, have been shown to be associated with microstruc-tural changes that are related to WM degeneration [20].
In addition to the DTI model, we analyzed the data usingthe FW imaging model [17], which assumes a separate FWcompartment with a fixed diffusivity of 3 ! 1025 mm2/s(the diffusion coefficient of FW at body temperature). Map-ping the fractional volume of the FW compartments pro-vides a FW map. A second compartment (the tissuecompartment) fits the remaining signal, which originatesfrom intra- and extracellular water molecules in the prox-imity of cellular membranes, i.e., from brain tissue [18].The tissue compartment is modeled by a diffusion tensor,and therefore yields the same type of maps as the DTImethod, only now these maps are corrected for contamina-tion by a freely diffusing extracellular compartment (FA-cor, RD-cor, and AXD-cor), and are thus expected to bemore specific to WM degeneration than the measuresderived from DTI alone [16,18]. The FW model was
implemented in the Medical Imaging Interaction Toolkit(MITK, http://www.mitk.org). Recently, FW correctedmaps have shown increased specificity to microstructuralchanges with increased sensitivity to changes that occur inMCI [21,22] and normal aging, compared withnoncorrected measures.
To detect global patterns of WM degeneration, wealigned all subjects to a common space using a two-stepregistration approach directly on the tensor images usingthe Diffusion Tensor Imaging ToolKit (DTI-TK, http://www.nitrc.org/projects/dtitk). First, a template was boot-strapped [23], using the IXI aging template [24]. Then, apopulation-specific template space was created by meansof affine and diffeomorphic registration [23]. We usedTBSS [25] to build a commonWM skeleton from FA imagesderived from the coregistered tensor images. We then map-ped all dMRI measures (both with and without FW elimina-tion) onto the skeleton.
2.4. Volumetric measures
Cortical reconstruction and volumetric segmentation wasperformed using Freesurfer [26]. The total GM (both corticaland subcortical) and WM volumes, normalized by the intra-cranial volume, were computed and the quality of the seg-mentation was visually evaluated for gross registrationmistakes, resulting with the exclusion of one AD subjectfrom the volumetric analysis.
2.5. Statistical analysis
Clinical scores were analyzed by means of t-tests andanalysis of variance (ANOVA) using Stata 9 (StataCorp LP).
TBSS group comparisons between the AD and HCgroups and the MCI-c and MCI-nc groups, with age as a co-variate, were performed using threshold-free clusterenhancement [27] via a nonparametric test with 5000 per-mutations (randomize, FSL [www.fmrib.ox.ac.uk/fsl]),and a significance threshold of P 5 .05 corrected for multi-ple comparisons. The group comparisons were done sepa-rately for each diffusivity measure (either FW correctedor not). We tested whether the GM or WM volume is corre-lated with FW using a Pearson correlation test between therespective volumes and the mean FW over the entire WMskeleton of each subject. We tested for group effects inthe GM and WM volumes using an analysis of deviancefor the generalized linear model as implemented in Math-Works Matlab (R2012a, 7.14.0.739), with the GM andWM volumes being modeled as dependent and the group la-bels and age as independent variables.
3. Results
3.1. Clinical scores
The MMSE scores and statistical analysis of the differentgroups at recruitment and follow-up are presented in

K.H. Maier-Hein et al. / Alzheimer’s & Dementia - (2014) 1-94
Supplement (S3). At the time of recruitment, there was nosignificant mean MMSE score difference between the HCgroup and the MCI-c as well as the MCI-nc groups.
3.2. FW maps
Many of the WM skeleton voxels in the AD group werefound to have higher values of FW when compared withthe HC group (Fig. 1A). Significant (P , .05) differenceswere identified in areas including the frontal, temporal,and parietal lobes, bilaterally, in an equal measure.Comparing the MCI-c andMCI-nc groups showed no signif-icant differences in FW.
3.3. Association between FW values and total GM volume
Comparing the average FW estimates on the WM skel-eton with the total GM and WM volumes tested the associ-ation between FW content in the WM and atrophic brainprocesses. Although WM volume did not exhibit a signifi-cant group effect (F(41) 5 1.0721; P 5 .38269), significantgroup effects were found for the GM volume(F(41) 5 6.5542; P , 1023) and FW (F(41) 5 8.628; P, 1024). Further analysis revealed that the AD group hadsignificantly increased mean FW comparing with the HCgroup (t(26) 5 23.03; P , 1022; Fig. 1B). Similarly, totalGM volume was significantly decreased between the ADgroup and the HC group (t(26) 5 3.42; P , 1022;
Fig. 1. Association between free-water (FW) and atrophy in Alzheimer’s disease
increased FW is found between the AD group and the healthy control (HC) gro
were no significant differences between the MCI-nc and MCI-c groups (not show
the entire skeleton was observed comparing the four groups (B). At the same time
were highly negatively correlated with the GM volume (Pearson’s R 5 20.6693;
Fig. 1C). No significant differences were identified whencomparing the mean FW (t(14) 5 20.88; P 5 .393;Fig. 1B) or total GM volume (t(14) 5 0.74; P 5 .471;Fig. 1C) between the MCI-c and MCI-nc groups.
Correlating the average FW estimates on the WM skel-eton for all subjects (all groups combined n5 46) with theirrespective total GM volumes, we found a highly significantnegative correlation (Fig. 1D; Pearson’s R 5 20.6693;P , 1026), i.e., the more GM atrophy present, the higherwere the FW values. WM volume did not correlate signifi-cantly with FW (Pearson’s R 5 20.2195; P 5 .1428), nordid it correlate with GM volume (Pearson’s R 5 0.0516;P 5 .7332).
3.4. Diffusion MRI analysis
Having established that the FW measure in the WM ofthis population is associated with GM atrophy, we nextinvestigate how the FW correction affected the identificationof significant group differences of DTI measures that areindicative of microstructural WM degeneration.
3.4.1. Radial diffusivityComparison of the WM skeleton between AD and HC
(Fig. 2) demonstrated that the AD group had a widespreadsignificant increase of RD. Controlling for partial-volumeby using FW elimination had little or no impact on these re-sults, as the significant group differences were apparent in
(AD) and mild cognitive impairment (MCI). (A) Widespread significantly
up (P , .05 in blue, on top of the white matter skeleton in green). There
n). A gradual increase along the progression of AD in the mean FW over
a gradual decrease in the GM volume was observed (C). (D) The FW values
P , 1026), suggesting a widespread pattern of atrophy-related changes.
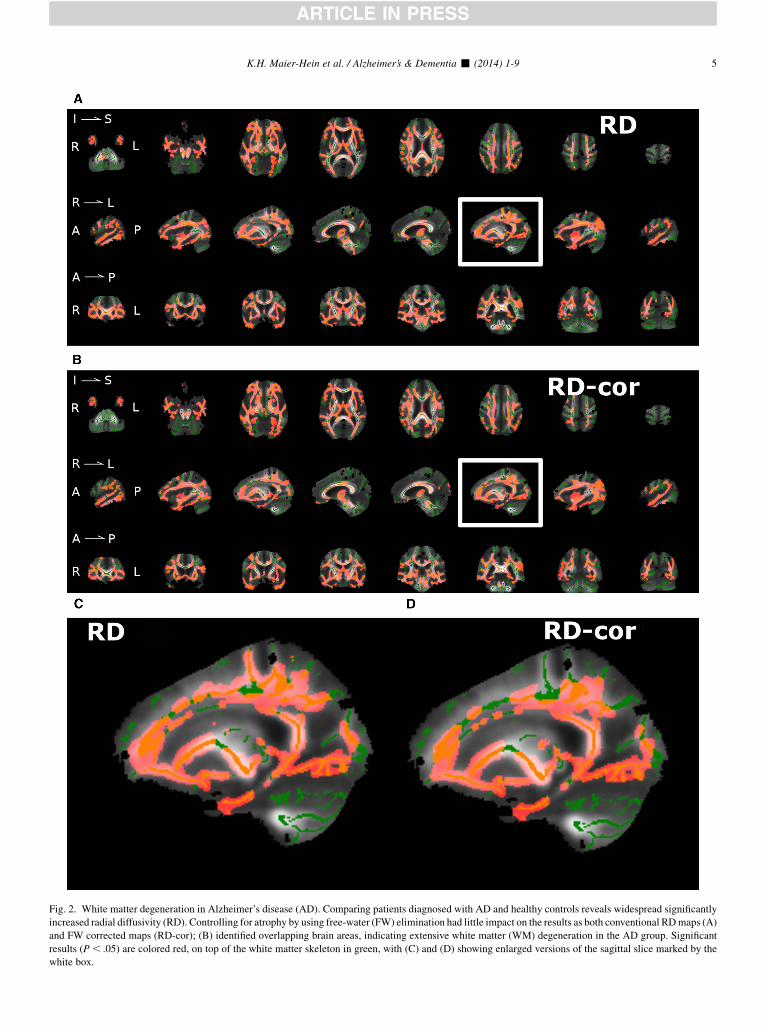
Fig. 2. White matter degeneration in Alzheimer’s disease (AD). Comparing patients diagnosed with AD and healthy controls reveals widespread significantly
increased radial diffusivity (RD). Controlling for atrophy by using free-water (FW) elimination had little impact on the results as both conventional RDmaps (A)
and FW corrected maps (RD-cor); (B) identified overlapping brain areas, indicating extensive white matter (WM) degeneration in the AD group. Significant
results (P , .05) are colored red, on top of the white matter skeleton in green, with (C) and (D) showing enlarged versions of the sagittal slice marked by the
white box.
K.H. Maier-Hein et al. / Alzheimer’s & Dementia - (2014) 1-9 5

K.H. Maier-Hein et al. / Alzheimer’s & Dementia - (2014) 1-96
both the noncorrected (RD, Fig. 2A) and the FW corrected(RD-cor, Fig. 2B) measures (P , .05). This was despitethe fact that the AD group had significantly higher FWvalues than the HC group (see above, and Fig. 2). The twocorrected and noncorrected RD measures overlapped, witha small fraction of voxels on theWM skeleton that was iden-tified by only one of the measures. The areas where RD andRD-cor overlap included the frontal, temporal, and parietallobes, bilaterally, in an equal measure, similar to the extentof increased FW reported above. These areas included themedial temporal, retrosplenial regions, anterior commissure,corona radiata, internal capsule, corticopontine tracts, cere-bral peduncle, striatum, and precentral gyrus. In a recentstudy microstructural differences independent of volumetricchanges were found in these areas in AD [28]. The smallareas that were identified using only RD or only RD-corwere scattered throughout the brain without a clear pattern.
Comparison of the WM skeleton between the MCI-c andMCI-nc groups (Fig. 3) showed that the MCI-c group hadsignificantly increased noncorrected RD (Fig. 3A) onlywithin a small subset of voxels, all within the corpus cal-losum. On the other hand, correcting for FW revealed wide-spread significantly increased RD-cor values (P , .05) fortheMCI-c group (Fig. 3B). In other words, controlling for at-rophy using the FWelimination method drastically increasedthe number of areas where WM degeneration in the MCI-cgroup was identified. The areas identified with the RD-cormeasure included the areas that were identified using the non-corrected RD values. The extent of increased RD-cor identi-fied for the MCI-c group was similar to the extent of theincreased RD-cor identified for the AD group (compare Fig2B with Fig. 3B), although the extent of findings in theMCI-c group was slightly reduced, and in particular the fron-tal lobewas less affected. Specifically, the orbitofrontal cortexwas bilaterally affected inMCI-c, with a predominance of theleft hemisphere. The cingulate gyrus was affected bilaterallyin an equal measure. The right-sided dorsolateral prefrontalcortex was spared in MCI-c, whereas the left side wasaffected. InAD, both sideswere affected in an equalmeasure.
3.4.2. Other diffusivitiesSignificant differences (P, .05) between the AD and HC
groups in FA, FA-cor, AXD, and AXD-cor were less exten-sive than RD-cor (not shown). Comparing the MCI-c andMCI-nc groups showed significantly lower FA-cor(P, .05) only within the corpus callosum, and no significantdifferences in FA, AXD, or AXD-cor.
4. Discussion
Our results indicate that widespread WMmicrostructuralabnormalities, detected after correction for partial volumeeffects, are associated with the development of dementiadue to AD. These abnormalities are likely indicative ofWM degeneration and were found in patients with MCI, pre-ceding the onset of dementia, as well as in subjects who are
already diagnosed with AD. These early signs of neurode-generative processes were found across the brain.
The most important finding in our study is that there was awidespread and significant RD-cor increase in the MCI-cgroup comparing with the MCI-nc group. This increasewas similar in extent to that evinced when comparing theAD group with healthy controls, suggesting that neurode-generative processes are present even before the onset of de-mentia in those subjects with MCI whowill convert to AD inthe future. DTI findings in the early stages of AD and inMCIhave been reported previously [29,30]. Of particular note areour findings in the frontal lobe. It is generally accepted thatthe destructive process during the clinical course of ADfollows a characteristic pattern, in which the frontal lobe isinvolved in the isocortical stage, with frontal lobe-relatedneurocognitive deterioration appearing only in the latestages of AD and absent in the MCI subjects [6]. Accord-ingly, we find reduced frontal lobe involvement in MCI-ccomparing with AD. Nevertheless, the frontal lobe areasthat show increased RD-cor in the MCI-c group stronglysuggest that this pathology precedes the manifestation offrontal lobe-related symptoms (e.g., inhibition) that are ab-sent in MCI. DTI findings in the early stages of AD and inMCI have been reported previously [29,30]. However,studies that did not separate MCI-c fromMCI-nc are limitedin their reproducibility (see Table S1), and studies that per-formed this separation were either limited to the analysisof regions of interest [9,31,32] or used supervised learningfor classification [33,34]. Thus, none of these studies hasthus far been able to demonstrate the extent ofmicrostructural alterations in subjects with MCI that willdevelop dementia. One previous study used TBSS for theexamination of group differences between MCI-c andMCI-nc, but that study did not find a significant group differ-ence and did not correct for partial volume [35]. Here, byassociating the FW measure with the GM volume we areable to demonstrate that atrophy-related processes are likelyaffecting the ability to identify microstructural DTI differ-ences in the WM of subjects with MCI and that followingFW elimination, such WM alterations are much morerobustly identified. We did not find an association betweenGM and WM volumes, suggesting that at least in its earlystages, atrophy mostly affects the extracellular volume andthe density of white matter, which are not apparent in volu-metric MRI measures of WM [15], but are apparent in theFW measure. This is important because it will potentiallyimprove current imaging-based AD prediction methods,which directly benefit from imaging markers that are moresensitive and more specific to AD pathology.
Atrophy is known to be prominent in AD-type dementia[1], and in agreement with this observation, we found highlyelevated GM atrophy for AD patients compared with theother groups. A previous study in an aging populationdemonstrated that dMRI quantities such as RD and AXDare affected by partial-volume and atrophy, with diffusivitymeasures increasing as atrophy is more severe [16]. In that

Fig. 3. White matter (WM) degeneration in subjects with mild cognitive impairment (MCI) that were later diagnosed with AD. In a comparison of subjects with
MCI who were later diagnosed with AD (MCI-c) and subjects with MCI that did not develop dementia within a 3-year follow-up (MCI-nc), the noncorrected
radial diffusivity (RD) measure (A) demonstrates significant increases only in a small subset of voxels in the corpus callosum. Controlling for atrophy with the
free-water corrected measure, RD-cor (B), reveals a widespread pattern of WM degeneration between the MCI-nc and MCI-c groups. Significant results
(P , .05) are colored red, on top of the WM skeleton in green, with (C) and (D) showing enlarged versions of the sagittal slice marked by the white box.
K.H. Maier-Hein et al. / Alzheimer’s & Dementia - (2014) 1-9 7

K.H. Maier-Hein et al. / Alzheimer’s & Dementia - (2014) 1-98
study, using FWelimination to control for partial-volume ef-fects eliminated group differences that were likely attributedto increased atrophy with aging, and did not reflect micro-structural changes. In the current study, we similarly findthat the AD subjects evince significantly increased FWcomparing with age-matched controls, correlating withincreased atrophy. However, unlike the aging study, in thecurrent study there was a significant group difference evenafter the FW correction (increased RD-cor). This suggeststhat in AD there are additional dMRI alterations that occuron a microstructural level. These additional findings arelikely related to WM degeneration, which might appear innormal aging as well, but is known to be much more pro-nounced and wide-spread in subjects with AD [6].
In the comparison of the MCI-c and MCI-nc groups theRD-cor differences were revealed only following the FWcorrection. This is opposite to previous FW eliminationstudies, where the elimination of partial-volume effectsservedmostly to reduce group difference in theDTI correctedmeasures [16,18]. This difference can be explained by notingthat we found a similar degree of GM atrophy between theMCI-c and MCI-nc groups, which means that variableamounts of partial-volume effects are expected in these datasets. The variable partial-volume effects dominate the signal,introducing a bias that prevents the identification of the muchmore subtle microstructural group differences. The FWelim-ination effectively reduces this bias, making possible theidentification ofwhether there aremicrostructural differencesbetween the groups. As a result, the FWeliminated DTI mea-sures aremore specific tomicrostructural processes that occurin brain tissue rather than in the extracellular space [18]. In thedata presented, we find that there are such microstructuralchanges between the MCI-c and MCI-nc groups (as well asbetween the AD andHC groups), whereas in previous studieson other type of populations, such microstructural changeswere not found, or had a limited extent. Taken together, ourresults demonstrate that the FW corrected RD (RD-cor),which decouples dMRI’s microstructural effects from itsmacrostructural effects, provides better separability than thetotal volume of GM between the MCI-c and MCI-nc groups.Although it is likely that regional GM volumetric measuresmight have increased prediction power, previous studieshave demonstrated that combining conventional DTI mea-sures with GM volumetric measures increases the classifica-tion accuracy of MCI from healthy controls [36]. Wetherefore suggest that the FW corrected measures could bean important addition to GM atrophy measures in the predic-tion of the development of dementia caused by AD. This isalso supported by recent studies where FW corrected mea-sures in preselected WM connections were associated withchanges in behavioral measures related to AD [21,22].
We have demonstrated the importance of having a sampleof subjects with dMRI acquisitions at baseline and a knownfuture conversion to AD. Future longitudinal studies onlarger numbers of patients with MCI, e.g., the diffusionMRI subset of the ADNI-2 data set on which the follow-
up information will eventually become available, will allowus to substantiate our findings. Another potential extensionof our work would be the incorporation of the correcteddiffusion measure into network analytics applied to similarpatient groups. This could potentially be translated to theclinical domain by creating a pool of normative controlsand detecting and comparing degeneration patterns on asingle-patient basis [37]. This information may prove usefulin the individual management of patients with MCI, and thepossibly in the development of targeted drugs.
Acknowledgments
This work was supported in part by National Institutes ofHealth grants (R01MH074794, P41RR013218, andP41EB015902); by the German Research Foundation(DFG) grant (ME 833/15-1) (to K.H.M.H. and B.S.); andby a NARSAD Young Investigator grant from the Brainand Behavior Research Foundation (to O.P.).
RESEARCH IN CONTEXT
1. Systematic review: We searched PubMed, up toSeptember 2013 with the terms (mild cognitiveimpairment [MCI] or Alzheimer’s disease [AD])and (diffusion or diffusion tensor imaging [DTI]).Tract-based spatial statistics (TBSS) based studiesshow inconsistent abnormalities reported in MCIpatients (e.g., Table 1). Six studies evaluated MCIsubjects who were diagnosed with AD in a laterclinical follow-up. One article used TBSS and foundno differences between converting and non-converting MCI.
2. Interpretation: The identification of changes preced-ing the clinical phase of AD is essential for themanagement of disease-modifying therapeutic in-terventions. Previous DTI studies were limited in theability to detect such changes. We show that pre-clinical AD exhibits distinctive microstructural al-terations that can be detected by enhancing DTImeasures with a free-water elimination.
3. Future directions: Longitudinal studies on larger num-ber of MCI patients would substantiate our findings,to establish a biomarker for early prediction of AD.
References
[1] Dubois B, Feldman HH, Jacova C, Dekosky ST, Barberger-Gateau P,
Cummings J, et al. Research criteria for the diagnosis of Alzheimer’s
disease: revising the NINCDS-ADRDA criteria. Lancet Neurol 2007;
6:734–46.
K.H. Maier-Hein et al. / Alzheimer’s & Dementia - (2014) 1-9 9
[2] Assaf Y, Pasternak O. Diffusion tensor imaging (DTI)-based white
matter mapping in brain research: a review. J Mol Neurosci 2008;
34:51–61.
[3] Mitchell AJ, Shiri-Feshki M. Rate of progression of mild cognitive
impairment to dementia—meta-analysis of 41 robust inception cohort
studies. Acta Psychiatr Scand 2009;119:252–65.
[4] Albert MS, DeKosky ST, Dickson D, Dubois B, FeldmanHH, FoxNC,
et al. The diagnosis of mild cognitive impairment due to Alzheimer’s
disease: recommendations from the National Institute on Aging-Alz-
heimer’s Association workgroups on diagnostic guidelines for Alz-
heimer’s disease. Alzheimers Dement 2011;7:270–9.
[5] Petersen RC.Mild cognitive impairment as a diagnostic entity. J Intern
Med 2004;256:183–94.
[6] Braak H, Braak E. Neuropathological stageing of Alzheimer-related
changes. Acta Neuropathol 1991;82:239–59.
[7] van Bruggen T, Stieltjes B, Thomann PA, Parzer P, Meinzer HP,
Fritzsche KH. Do Alzheimer-specific microstructural changes in
mild cognitive impairment predict conversion? Psychiatry Res 2012;
203:184–93.
[8] Killiany RJ, Gomez-Isla T, Moss M, Kikinis R, Sandor T, Jolesz F,
et al. Use of structural magnetic resonance imaging to predict who
will get Alzheimer’s disease. Ann Neurol 2000;47:430–9.
[9] Mielke MM, Okonkwo OC, Oishi K, Mori S, Tighe S, Miller MI, et al.
Fornix integrity and hippocampal volume predict memory decline and
progression to Alzheimer’s disease. Alzheimers Dement 2012;
8:105–13.
[10] Rosenberg PB, Hillis AE. Biomarkers for Alzheimer’s disease: ready
for the next step. Brain 2009;132(Pt 8):2002–4.
[11] Scahill RI, Frost C, Jenkins R, Whitwell JL, Rossor MN, Fox NC. A
longitudinal study of brain volume changes in normal aging using se-
rial registered magnetic resonance imaging. Arch Neurol 2003;
60:989–94.
[12] Du AT, Schuff N, Amend D, Laakso MP, Hsu YY, Jagust WJ, et al.
Magnetic resonance imaging of the entorhinal cortex and hippocam-
pus in mild cognitive impairment and Alzheimer’s disease. J Neurol
Neurosurg Psychiatry 2001;71:441–7.
[13] Hampel H, Teipel SJ, Alexander GE, Horwitz B, Teichberg D,
Schapiro MB, et al. Corpus callosum atrophy is a possible indicator
of region- and cell type-specific neuronal degeneration in Alzheimer
disease: a magnetic resonance imaging analysis. Arch Neurol 1998;
55:193–8.
[14] Jack CR Jr, Petersen RC, Xu YC, O’Brien PC, Smith GE, Ivnik RJ,
et al. Prediction of AD with MRI-based hippocampal volume in
mild cognitive impairment. Neurology 1999;52:1397–403.
[15] Fjell AM, Westlye LT, Greve DN, Fischl B, Benner T, van der
Kouwe AJ, et al. The relationship between diffusion tensor imaging
and volumetry as measures of white matter properties. Neuroimage
2008;42:1654–68.
[16] Metzler-Baddeley C, O’Sullivan MJ, Bells S, Pasternak O, Jones DK.
How and how not to correct for CSF—contamination in diffusion
MRI. Neuroimage 2012;59:1394–403.
[17] Pasternak O, Sochen N, Gur Y, Intrator N, Assaf Y. Free water elimi-
nation and mapping from diffusion MRI. Magn Reson Med 2009;
62:717–30.
[18] Pasternak O,Westin CF, Bouix S, Seidman LJ, Goldstein JM,Woo TU,
et al. Excessive extracellular volume reveals a neurodegenerative
pattern in schizophrenia onset. J Neurosci 2012;32:17365–72.
[19] Levy R. Aging-associated cognitive decline. Working Party of the In-
ternational Psychogeriatric Association in collaboration with the
World Health Organization. Int Psychogeriatr 1994;6:63–8.
[20] Song SK, Sun SW, Ju WK, Lin SJ, Cross AH, Neufeld AH. Diffusion
tensor imaging detects and differentiates axon and myelin degenera-
tion in mouse optic nerve after retinal ischemia. Neuroimage 2003;
20:1714–22.
[21] Metzler-Baddeley C, Hunt S, Jones DK, Leemans A, Aggleton JP,
O’Sullivan MJ. Temporal association tracts and the breakdown of
episodic memory in mild cognitive impairment. Neurology 2012;
79:2233–40.
[22] Metzler-Baddeley C, Jones DK, Steventon J,Westacott L, Aggleton JP,
O’Sullivan MJ. Cingulum microstructure predicts cognitive control in
older age and mild cognitive impairment. J Neurosci 2012;
32:17612–9.
[23] Zhang H, Yushkevich PA, Rueckert D, Gee JC. Unbiased white matter
atlas construction using diffusion tensor images. Med Image Comput
Comput Assist Interv 2007;10(Pt 2):211–8.
[24] Zhang H, Yushkevich P, Rueckert D, Gee J. A computational white
matter atlas for aging with surface-based representation of fasciculi.
In: Fischer B, Dawant B, Lorenz C, eds. Biomedical image registra-
tion. Berlin Heidelberg: Springer; 2010. p. 83–90.
[25] Smith SM, Jenkinson M, Johansen-Berg H, Rueckert D, Nichols TE,
Mackay CE, et al. Tract-based spatial statistics: voxelwise analysis
of multi-subject diffusion data. Neuroimage 2006;31:1487–505.
[26] Fischl B, Salat DH, Busa E, Albert M, Dieterich M, Haselgrove C,
et al. Whole brain segmentation: automated labeling of neuroanatom-
ical structures in the human brain. Neuron 2002;33:341–55.
[27] Smith SM, Nichols TE. Threshold-free cluster enhancement: address-
ing problems of smoothing, threshold dependence and localisation in
cluster inference. Neuroimage 2009;44:83–98.
[28] Canu E, McLaren DG, Fitzgerald ME, Bendlin BB, Zoccatelli G,
Alessandrini F, et al. Microstructural diffusion changes are indepen-
dent of macrostructural volume loss in moderate to severe Alzheimer’s
disease. J Alzheimers Dis 2010;19:963–76.
[29] Zhang Y, Schuff N, Jahng GH, BayneW, Mori S, Schad L, et al. Diffu-
sion tensor imaging of cingulum fibers in mild cognitive impairment
and Alzheimer disease. Neurology 2007;68:13–9.
[30] Fellgiebel A, Wille P, Muller MJ, Winterer G, Scheurich A,
Vucurevic G, et al. Ultrastructural hippocampal and white matter alter-
ations in mild cognitive impairment: a diffusion tensor imaging study.
Dement Geriatr Cogn Disord 2004;18:101–8.
[31] Fellgiebel A, Dellani PR, Greverus D, Scheurich A, Stoeter P,
Muller MJ. Predicting conversion to dementia in mild cognitive
impairment by volumetric and diffusivity measurements of the hippo-
campus. Psychiatr Res 2006;146:283–7.
[32] Douaud G, Menke RA, Gass A, Monsch AU, Rao A,Whitcher B, et al.
Brain microstructure reveals early abnormalities more than two years
prior to clinical progression from mild cognitive impairment to Alz-
heimer’s disease. J Neurosci 2013;33:2147–55.
[33] Oishi K, Akhter K, Mielke M, Ceritoglu C, Zhang J, Jiang H, et al.
Multi-modal MRI analysis with disease-specific spatial filtering:
initial testing to predict mild cognitive impairment patients who
convert to Alzheimer’s disease. Front Neurol 2011;2:54.
[34] Hahn K, Myers N, Prigarin S, Rodenacker K, Kurz A, Forstl H, et al.
Selectively and progressively disrupted structural connectivity of func-
tional brain networks in Alzheimer’s disease—revealed by a novel
framework to analyze edge distributions of networks detecting disrup-
tions with strong statistical evidence. Neuroimage 2013;81:96–109.
[35] Haller S, Nguyen D, Rodriguez C, Emch J, Gold G, Bartsch A, et al.
Individual prediction of cognitive decline in mild cognitive impair-
ment using support vector machine-based analysis of diffusion tensor
imaging data. J Alzheimers Dis 2010;22:315–27.
[36] Zhang Y, Schuff N, Camacho M, Chao LL, Fletcher TP, Yaffe K, et al.
MRI markers for mild cognitive impairment: comparisons between
white matter integrity and gray matter volume measurements. PloS
one 2013;8:e66367.
[37] Bouix S, Pasternak O, Rathi Y, Pelavin PE, Zafonte R, Shenton ME.
Increased gray matter diffusion anisotropy in patients with persistent
post-concussive symptoms following mild traumatic brain injury.
PloS one 2013;8:e66205.
Levy’s criteria of aging-associated cognitive decline(AACD)
TheAACDconcept [14] considers decline in a broadpoten-tial range of cognitive domains, namelymemory and learning,attention and concentration, thinking, language, and visuospa-tial functioning and is thus comparable with Petersen’s defini-tion of “mild cognitive impairment multiple domain” [15].Previous studies have demonstrated that AACD is useful forthe prediction of future development of manifested dementiain large longitudinal studies [16,17]. Subjects with AACDwere identified according to the following criteria: Exclusionof dementia, normal activities of daily living, exclusion ofany medical, neurological or psychiatric disorder that couldproduce cognitive deterioration as determined by historyand/or clinical examination, and a performance of at least 1standard deviation below the age-adjusted normon a standard-ized test of cognition, involving at least one of the aforemen-tioned domains.
Image acquisition
Imagingwas performed on a 1.5 Twhole-body clinical scan-nerwithaquadratureheadcoil (MagnetomSymphony,Siemens,Erlangen, Germany) and gradient strength of 40 mT/m.
A magnetization prepared rapid gradient echo(MPRAGE) sequence was used to acquire 128 T1-weightedcoronal slices with slice thickness of 1.0 mm, field of view of260 ! 260 mm2, data matrix of 256 ! 256 yielding an in-plane resolution of 1.02 mm, repetition time (TR) of 4 ms,and flip angle of 13�.
Diffusion magnetic resonance imaging (dMRI) wascollected using a single-shot echo-planar imaging sequencewith dual bipolar diffusion gradients and a double spin echoutilized for reduction of eddy-currents. The sequence had aTR/echo time (TE) of 4700/78 ms; data matrix of 96 ! 96yielding an in-plane resolution of 2.5 mm2; 50 axial slices
of 2.5 mm thickness and no gap; six gradient directionswith b-value of 1000 s/mm2; and one image with a zero b-value. To increase the signal-to-noise ratio, the dMRIsequence was repeated 10 times and averaged.
Image preprocessing
All dMRI images were masked (brain extraction tool,FMRIB software library; FSL, fsl.fmrib.ox.ac.uk/fsl) andcorrected for motion and eddy-currents (FMRIB’s LinearImage Registration Tool; FLIRT, FSL) while compensatingthe gradient directions. One data set (mild cognitive impair-ment develops into Alzheimer’s disease [MCI-c]) could notbe corrected due to imaging artifacts and was excluded.
Clinical scores
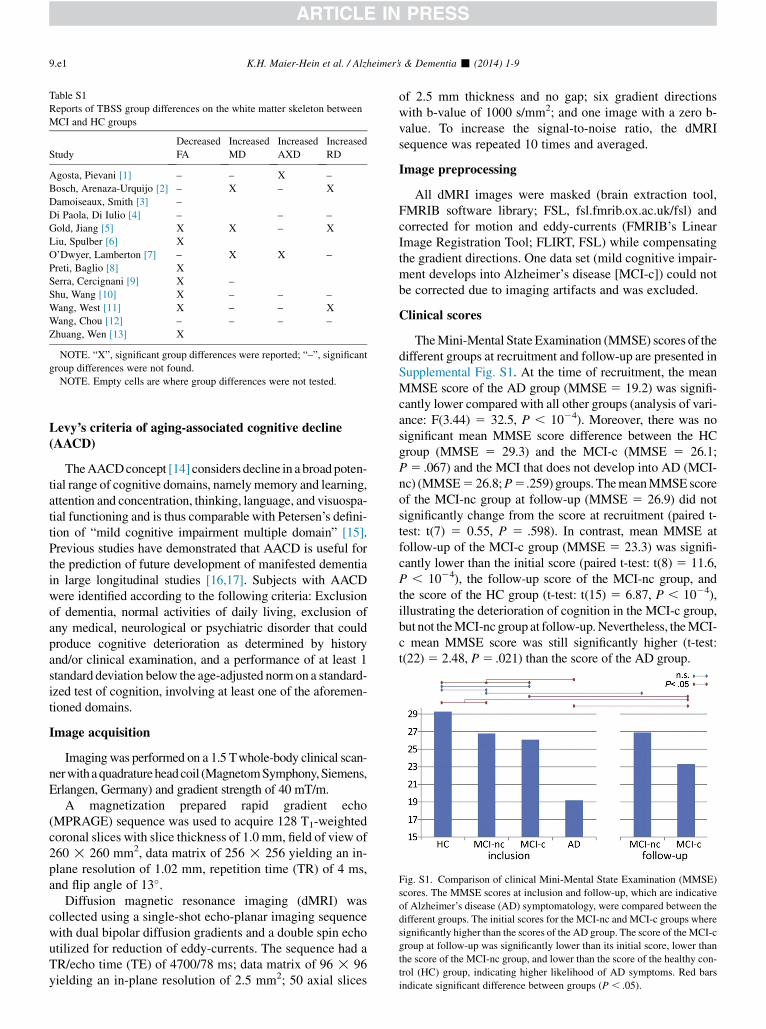
TheMini-Mental State Examination (MMSE) scores of thedifferent groups at recruitment and follow-up are presented inSupplemental Fig. S1. At the time of recruitment, the meanMMSE score of the AD group (MMSE 5 19.2) was signifi-cantly lower compared with all other groups (analysis of vari-ance: F(3.44) 5 32.5, P , 1024). Moreover, there was nosignificant mean MMSE score difference between the HCgroup (MMSE 5 29.3) and the MCI-c (MMSE 5 26.1;P5 .067) and the MCI that does not develop into AD (MCI-nc) (MMSE5 26.8;P5.259) groups. ThemeanMMSE scoreof the MCI-nc group at follow-up (MMSE 5 26.9) did notsignificantly change from the score at recruitment (paired t-test: t(7) 5 0.55, P 5 .598). In contrast, mean MMSE atfollow-up of the MCI-c group (MMSE 5 23.3) was signifi-cantly lower than the initial score (paired t-test: t(8) 5 11.6,P , 1024), the follow-up score of the MCI-nc group, andthe score of the HC group (t-test: t(15) 5 6.87, P , 1024),illustrating the deterioration of cognition in the MCI-c group,but not theMCI-nc group at follow-up.Nevertheless, theMCI-c mean MMSE score was still significantly higher (t-test:t(22)5 2.48, P5 .021) than the score of the AD group.
Fig. S1. Comparison of clinical Mini-Mental State Examination (MMSE)
scores. The MMSE scores at inclusion and follow-up, which are indicative
of Alzheimer’s disease (AD) symptomatology, were compared between the
different groups. The initial scores for the MCI-nc and MCI-c groups where
significantly higher than the scores of the AD group. The score of the MCI-c
group at follow-up was significantly lower than its initial score, lower than
the score of the MCI-nc group, and lower than the score of the healthy con-
trol (HC) group, indicating higher likelihood of AD symptoms. Red bars
indicate significant difference between groups (P , .05).
Table S1
Reports of TBSS group differences on the white matter skeleton between
MCI and HC groups
Study
Decreased
FA
Increased
MD
Increased
AXD
Increased
RD
Agosta, Pievani [1] – – X –
Bosch, Arenaza-Urquijo [2] – X – X
Damoiseaux, Smith [3] –
Di Paola, Di Iulio [4] – – –
Gold, Jiang [5] X X – X
Liu, Spulber [6] X
O’Dwyer, Lamberton [7] – X X –
Preti, Baglio [8] X
Serra, Cercignani [9] X –
Shu, Wang [10] X – – –
Wang, West [11] X – – X
Wang, Chou [12] – – – –
Zhuang, Wen [13] X
NOTE. “X”, significant group differences were reported; “–”, significant
group differences were not found.
NOTE. Empty cells are where group differences were not tested.
K.H. Maier-Hein et al. / Alzheimer’s & Dementia - (2014) 1-99.e1

References
[1] Agosta F, Pievani M, Sala S, Geroldi C, Galluzzi S, Frisoni GB,
et al. White matter damage in Alzheimer disease and its relationship
to gray matter atrophy. Radiology 2011;258:853–63. Epub
2010/12/24.
[2] Bosch B, Arenaza-Urquijo EM, Rami L, Sala-Llonch R, Junque C,
Sole-Padulles C, et al. Multiple DTI index analysis in normal aging,
amnestic MCI and AD. Relationship with neuropsychological perfor-
mance. Neurobiol Aging 2012;33:61–74. Epub 2010/04/08.
[3] Damoiseaux JS, Smith SM, Witter MP, Sanz-Arigita EJ, Barkhof F,
Scheltens P, et al. White matter tract integrity in aging and Alzheimer’s
disease. Hum Brain Mapp 2009;30:1051–9. Epub 2008/04/17.
[4] Di Paola M, Di Iulio F, Cherubini A, Blundo C, Casini AR,
Sancesario G, et al. When, where, and how the corpus callosum
changes in MCI and AD: a multimodal MRI study. Neurology 2010;
74:1136–42. Epub 2010/04/07.
[5] Gold BT, Jiang Y, Powell DK, Smith CD. Multimodal imaging ev-
idence for axonal and myelin deterioration in amnestic mild cogni-
tive impairment. J Alzheimers Dis 2012;31:19–31. Epub
2012/03/31.
[6] Liu Y, Spulber G, Lehtimaki KK, KononenM, Hallikainen I, Grohn H,
et al. Diffusion tensor imaging and tract-based spatial statistics in Alz-
heimer’s disease and mild cognitive impairment. Neurobiol Aging
2011;32:1558–71. Epub 2009/11/17.
[7] O’Dwyer L, Lamberton F, Bokde AL, Ewers M, Faluyi YO, Tanner C,
et al. Multiple indices of diffusion identifies white matter damage in
mild cognitive impairment and Alzheimer’s disease. PloS one 2011;
6:e21745. Epub 2011/07/09.
[8] Preti MG, Baglio F, Lagana MM, Griffanti L, Nemni R, Clerici M,
et al. Assessing corpus callosum changes in Alzheimer’s disease: com-
parison between tract-based spatial statistics and atlas-based tractogra-
phy. PloS one 2012;7:e35856. Epub 2012/05/01.
[9] Serra L, Cercignani M, Lenzi D, Perri R, Fadda L, Caltagirone C, et al.
Grey and white matter changes at different stages of Alzheimer’s dis-
ease. J Alzheimers Dis 2010;19:147–59. Epub 2010/01/12.
[10] Shu N, Wang Z, Qi Z, Li K, He Y. Multiple diffusion indices reveals
white matter degeneration in Alzheimer’s disease and mild cognitive
impairment: a tract-based spatial statistics study. J Alzheimers Dis
2011;26(Suppl 3):275–85. Epub 2011/10/06.
[11] Wang Y, West JD, Flashman LA, Wishart HA, Santulli RB, Rabin LA,
et al. Selective changes in white matter integrity in MCI and older
adults with cognitive complaints. Biochimica et biophysica acta
2012;1822:423–30. Epub 2011/08/27.
[12] Wang PN, Chou KH, Lirng JF, Lin KN, Chen WT, Lin CP. Multiple
diffusivities define white matter degeneration in amnestic mild cogni-
tive impairment and Alzheimer’s disease. J Alzheimers Dis 2012;
30:423–37. Epub 2012/03/21.
[13] Zhuang L, Wen W, Zhu W, Trollor J, Kochan N, Crawford J, et al.
White matter integrity in mild cognitive impairment: a tract-based
spatial statistics study. Neuroimage 2010;53:16–25. Epub 2010/07/03.
[14] Levy R. Aging-associated cognitive decline. Working Party of the In-
ternational Psychogeriatric Association in collaboration with the
World Health Organization. Int Psychogeriatr 1994;6:63–8.
[15] Petersen RC.Mild cognitive impairment as a diagnostic entity. J Intern
Med 2004;256:183–94.
[16] Ritchie K, Artero S, Touchon J. Classification criteria for mild cogni-
tive impairment: a population-based validation study. Neurology
2001;56:37–42.
[17] Schonknecht P, Pantel J, Kruse A, Schroder J. Prevalence and natural
course of aging-associated cognitive decline in a population-based
sample of young–old subjects. Am J Psychiatr 2005;162:2071–7.
K.H. Maier-Hein et al. / Alzheimer’s & Dementia - (2014) 1-9 9.e2
Copyright © 2022 FDOKUMEN