
Design and fuzzy control of hand prosthesis or anthropomorphic robotic hand

Classifying EEG Signals Preceding Right Hand, Left Hand,Tongue, and Right Foot Movements and Motor Imageries
Valerie Morash, Ou Bai, Stephen Furlani, Peter Lin, and Mark HallettHuman Motor Control Section, Medical Neurological Branch, National Institute of NeurologicalDisorders and Stroke, National Institutes of Health, Bethesda, MD, USA
AbstractObjective—To use the neural signals preceding movement and motor imagery to predict which offour movements/motor imageries is about to occur, and to access this utility for brain-computerinterface (BCI) applications.
Methods—Eight naive subjects performed or kinesthetically imagined four movements whileelectroencephalogram (EEG) was recorded from 29 channels over sensorimotor areas. The task wasinstructed with a specific stimulus (S1) and performed at a second stimulus (S2). A classifier wastrained and tested offline at differentiating the EEG signals from movement/imagery preparation (the1.5 seconds preceding movement/imagery execution).
Results—Accuracy of movement/imagery preparation classification varied between subjects. Thesystem preferentially selected event related (de)synchronization (ERD/ERS) signals forclassification, and high accuracies were associated with classifications that relied heavily on theERD/ERS to discriminate movement/imagery planning.
Conclusions—The ERD/ERS preceding movement and motor imagery can be used to predictwhich of four movements/imageries is about to occur. Prediction accuracy depends on this signal’saccessibility.
Significance—The ERD/ERS is the most specific pre-movement/imagery signal to the movement/imagery about to be performed.
KeywordsElectroencephalography (EEG); event related (de)synchronization (ERD/ERS); brain-computerinterface (BCI); movement; motor imagery
IntroductionThe goal of the present study was to prove the viability of a movement/imagery predictionbrain computer interface (BCI), and to discover which electroencephalography (EEG) neuralsignals would be best for controlling such a device. We focused on EEG because it is non-invasive and mobile. Additionally, we restricted the device to decoding pre-movement/imagerysignals with cued movements/imageries.
Correspondence to: Ou Bai, Ph.D., Assistant Professor, Virginia Commonwealth University, 701 West Grace Street, Room 2405,Richmond VA 23284-3067, P.O. Box 843067, TEL: (804) 827-3607, FAX: (804) 828-4454, EMAIL: [email protected]'s Disclaimer: This is a PDF file of an unedited manuscript that has been accepted for publication. As a service to our customerswe are providing this early version of the manuscript. The manuscript will undergo copyediting, typesetting, and review of the resultingproof before it is published in its final citable form. Please note that during the production process errors may be discovered which couldaffect the content, and all legal disclaimers that apply to the journal pertain.
NIH Public AccessAuthor ManuscriptClin Neurophysiol. Author manuscript; available in PMC 2009 November 1.
Published in final edited form as:Clin Neurophysiol. 2008 November ; 119(11): 2570–2578. doi:10.1016/j.clinph.2008.08.013.
NIH
-PA Author Manuscript
NIH
-PA Author Manuscript
NIH
-PA Author Manuscript

BCIs are important medical devices for patients who have lost control of their motor faculties,and can no longer outwardly express their needs and thoughts. A BCI enables these “lockedin” patients to control a computer with their brain activity for communication, mobility, andother purposes. In practice, the most common neural signals to use as BCI inputs are movement-related signals, because they are well defined and natural to the user. Movement-controlledBCIs allow the patient to indicate a choice by making or imagining one of several predefinedmovements.
Current movement-controlled BCIs have two major drawbacks. First, they rapidly fatigue thepatient by requiring sustained movement/imagery for several seconds. Neural signalsassociated with non-sustained movement/imagery subside quickly, and a longer sample of datais required for classification (Neuper et al. 2005). Second, after the neural signal is obtained,the device can require several seconds to classify it, especially if sophisticated techniques areinvolved (Brunner et al. 2006). This causes a waiting time between the patient’s actions andthe BCI response, decreasing the BCI’s usability and convenience. To address these problems,we proposed a BCI that used the brain signals preceding movement execution and imagery (aprediction BCI). This enabled the extraction of more than one second of preparatory neuralinformation from a single non-sustained movement/imagery, and had the potential to reducethe perceived waiting time between the patient’s actions and BCI response by using earlierneural signals.
We created a prediction BCI that selected the neural signals that gave it the best results forpredicting which of 4 movements was about to be executed or imagined: right hand squeeze,left hand squeeze, tongue press on the roof of the mouth, or right foot toe curl. The movementwas instructed with a specific stimulus (S1) and performed at a second stimulus (S2). Weanticipated that the BCI would rely on one of the two predominant EEG signals known toprecede cued movement and motor imagery in this circumstance: the contingent negativevariation (CNV) or the event related (de)synchronization (ERD/ERS). These signals are uniqueto movement/imagery preparation, and dissimilar from those during movement/imageryexecution. Specifically, the CNV only occurs preceding movement/imagery and subsidesimmediately upon movement/imagery execution. Additionally, the preparatory ERD/ERS isfunctionally distinct from the ERD/ERS that can occur during movement/imagery (Neuper,1999). While the CNV and its coincident ERD/ERS are extracted from the contemporaneousEEG, they represent separate processes of motor/imagery preparation within the motor cortices(Filipovic et al. 2001).
The contingent negative variation (CNV) is a widespread negative shift occurring during theinterval between a warning stimulus (S1) and a subsequent imperative stimulus (S2) thatrequires execution of a movement or motor imagery (Walter et al. 1964; Tecce 1972; Tecceand Cattanach 1993). In a choice situation, the instruction for which movement to make couldbe given with either the S1 or the S2; in our experiments, the instruction is given at S1. Theearlier part of the CNV is maximal over the frontal cortex, and generated in response to S1.The later, or terminal CNV (tCNV) can begin up to 1.5 seconds before S2; and reflects bothcognitive preparation, causing maximal activity within and negativity over the frontal andprefrontal cortices, and motor preparation, causing maximal activity within and negativity overthe primary motor cortex (M1) and supplementary motor area (SMA) (Rohrbaugh et al.1976; Rosahl and Knight 1995; Ikeda et al. 1996).
The tCNV’s motor-related activity is associated with a sustained ERD/ERS in the alpha (8-13Hz) and beta (14-30 Hz) range. The ERD, a reduction of a specific frequency component, isrelated to increased neural activity and appears over the performed/imagined movement’s M1representation. The ERS, an enhancement of a specific frequency component, is related toneural suppression, and sometimes appears over non-performed/imagined movements’ cortical
Morash et al. Page 2
Clin Neurophysiol. Author manuscript; available in PMC 2009 November 1.
NIH
-PA Author Manuscript
NIH
-PA Author Manuscript
NIH
-PA Author Manuscript

representations (Pfurtscheller 1989; Neuper and Pfurtscheller 1992; Pfurtscheller et al. 1997;Pfurtscheller 2003; Caldara et al. 2004).
We anticipated that the prediction BCI would work best with the ERD/ERS due to thestraightforward relationship between the ERD/ERS and motor cortex activity, in contrast tothe CNV. Success would indicate that movement and motor imagery contain a substantial andspecific preparation within the primary motor cortex, which is reflected in the ERD/ERS morethan the CNV and other movement/imagery preparation neural signals. Furthermore, this 4-movement BCI could greatly improve the lives of locked in patients by offering them 2dimensions, 4 directions derived from the 4 movements, of control.
MethodsSubjects
Subjects were eight, right-handed, healthy volunteers (five male) between the ages of 23 and53. None of the subjects had prior BCI training or instruction on the current study’s procedure.The subjects were not informed of the experimental hypothesis, or the experimental designbeyond the activities they performed. Each subject provided written informed consent prior toparticipating in the study. The Institutional Review Board approved the protocol.
Experimental protocol and data acquisitionSubjects were seated in a comfortable chair with their arms extended, supported by pillows,and their right leg extended, supported by a footrest. Stimuli presentation, data acquisition, anddata processing and visualization were done using homemade MatLab (MathWorks, Natick,MA) scripts. Stimuli were presented on a nineteen-inch LCD computer screen, and occupiedabout 1.2 degrees of visual angle.
Each subject completed at least six blocks of trials, each block consisting of 100 trials. Duringeach trial, a cross stimulus was presented for 2-5 seconds, followed by an arrow stimulus (S1)for 2 seconds, and then a diamond stimulus (S2) for 2 seconds (Fig. 1). Subjects were instructedto blink and swallow only during the cross presentation and to minimize eye movements duringS1 and S2 presentations. We asked the subjects to relax their muscles and pay attention to thevisual stimulus. We stressed the importance of their relaxation, because the presence of anyS1-related artifacts could potentially contaminate our results. The duration of the cross stimuluswas adjusted for each subject’s comfort and varied randomly between trials by at least onesecond. For each trial, S1 was randomly chosen to be an arrow in one of 4 directions: right,left, up, or down, which indicated the movement to be performed or imagined: a right handsqueeze, left hand squeeze, press of the tongue on the roof of the mouth, or right foot toe curl,respectively.
During the first three blocks of trials, subjects were instructed to perform physical movementimmediately upon S2 appearance, and not before it. During the last three blocks, subjects wereinstructed to perform kinesthetic motor imagery immediately upon S2 appearance, and notbefore it. Subjects were explicitly warned against making muscle contractions before S2.Instead of recording electromyography (EMG) on the arms and leg, we made sure that subjectswere not making movements before S2 by watching them via a closed-circuit video camera.Tongue movements were detectable through the EEG scalp electrodes, and we used this toensure that subjects were not making tongue movements after S2. Additionally, subject self-reports indicated that subjects were not performing imagery or muscle contractions before S2.The closed-circuit video was also used to ensure that subjects performed movement trialscorrectly and were awake and attentive. Extra blocks of trials were collected from subjects who
Morash et al. Page 3
Clin Neurophysiol. Author manuscript; available in PMC 2009 November 1.
NIH
-PA Author Manuscript
NIH
-PA Author Manuscript
NIH
-PA Author Manuscript

failed to remain attentive; such bad trials were discarded. Each subject was enrolled in thestudy for 1.5 to 2 hours.
EEG was recorded from 29 tin surface electrodes mounted on an elastic cap (Electro-CapInternational, Inc., Eaton, OH, USA). Electrodes were placed over central and parietal areas,spaced roughly 2.5 centimeters apart. These included the following, labeled as channels 1-29:FC1, FC3, FC5, C1, C3, C5, FC2, FC4, FC6, C2, C4, C6, CP1, CP3, CP5, P1, P3, P5, CP2,CP4, CP6, P2, P4, P6, FZ, FCZ, CZ, CPZ, and PZ (Sharbrough et al. 1991). Reference wastaken from the right ear lobe and ground from the forehead. Bipolar recordings of the verticaland horizontal electrooculogram (EOG) were taken to monitor eye movements and blinks. Allsignals were amplified (Neuroscan Inc., El Paso, TX), passed through a 100 Hz low-pass filter,and digitized with a sampling frequency of 250 Hz.
Trial exclusionTrials that contained muscle tension, tongue movement, face movement, eye movement, oreye blink artifacts in the 1.5 seconds preceding S2 appearance were identified offline andexcluded from all subsequent visualizations and analyses. Tongue movements that occurredbefore S2 were not part of the experimental task, because subjects were instructed to makemovements/imagery after S2. To assess the impact of trial quantity on classification success,the average quantity of movement and imagery trials retained for each subject was comparedto the mean and variance of the results using a linear regression (movement and imagery wereconsidered separately).
CNV and ERD/ERS visualizationsTo create CNV and ERD/ERS visualizations, trials belonging to the same subject, channel,and movement or imagery were averaged offline over the 3 seconds preceding and 1 secondfollowing S2 appearance.
CNV visualizations were created by low-pass filtering (second order Butterworth filter with a5 Hz cutoff) and averaging voltages after subtracting the average voltage between 3 to 2 secondsbefore S2 appearance. 95% confidence intervals were made using bootstrapping with 500samples (Good 2006). ERD/ERS visualizations were created by generating power spectra foreach trial (using a fast Fourier transformation (FFT) with Hanning windows, a 256-millisecondsegment length, and no overlap between consecutive segments), and averaging 3.9 Hz, 256millisecond bins of the power spectra (Bai et al. 2005).
Visualizations were inspected manually to identify CNV waveforms and sustained ERD/ERSsover motor areas. To assess the impact of ERD/ERSs on classification accuracy, the numberof movement/imagery preparations displaying sustained motor channel ERD/ERSs wascompared to average testing accuracies using linear regression (movement and imagery wereconsidered separately).
Training and testing accuraciesTrials were separated into two groups per subject, one for movement and one for imagery.Each group was pseudo-randomly divided into a training set (80% of trials) and a testing set(20% of trials). All data were independently filtered using a spatial filter (independentcomponent analysis, ICA), which attenuated the signal components associated with noise; anda temporal filter (discrete wavelet transformation, DWT), which applied a transformation tomake relevant neural signals more accessible (it extracted features). Optimum filter parameterswere determined using data in the training set. The filters were chosen based on their abilityto produce better testing accuracies than other methods (spatial filters: principal componentanalysis, common spatial patterns analysis, and surface Laplacian derivation; and temporal
Morash et al. Page 4
Clin Neurophysiol. Author manuscript; available in PMC 2009 November 1.
NIH
-PA Author Manuscript
NIH
-PA Author Manuscript
NIH
-PA Author Manuscript

filter: power spectral density estimation) in Bai et al. 2007, where specific implementationdetails can be found (Bai et al. 2007).
After filtering, the data were rescaled to have zero mean and unit variance. This eliminated thepossibility of high variance features dominating the classification training (Bai et al. 2007).The training set was searched by a genetic algorithm, using Bayesian cross-validation andBhattacharyya distances, to identify the best one hundred features for differentiating themovement/imagery preparations during the 1.5 seconds before S2 appearance. TheBhattacharyya distance of each feature quantified the feature’s impact; the larger the feature’sBhattacharyya distance, the greater separability of the data by that feature (Marques De Sa2001). Only 1.5 seconds before S2 were included in the classification, since this was the timeperiod known to contain the motor related tCNV and ERD/ERS. We avoided using the 0.5seconds after S1 appearance, to ensure that any S1-related artifacts were not used by theclassification.
A naïve Bayesian (BSC) classifier used the best features (those with the largest Bhattacharyyadistances), in the best quantity (the number between 1 and 16 that produced the best trainingset results), to classify each trial in the training set, yielding a training accuracy, and each trialin the testing set, yielding a testing accuracy. Similar to the filtering techniques, BSC waschosen based on its ability to produce better testing accuracies than other methods(Mahalanobis distance classifier, quadratic Mahalanobis distance classifier, multi-layerperceptron neural network, probabilistic neural network, and support vector machine) in Baiet al. (Bai et al. 2007).
This process was repeated five times, using data preceding all 4 movements/imageries, toaccount for variation from the random division of trials into training and testing sets and thegenetic algorithm used in feature identification. All analyses used data preceding movement/imagery execution, although explicit statement of this is omitted from now on for brevity.
Six subjects were used for 2-movement/imagery classifications. Two subjects were excludedfrom this analysis based on their failure to adequately participate in the experiment. The resultsof their CNV visualizations (one lacked an imagery CNV and the other lacked movement andimagery CNVs) and their poor behavior during the experiment indicated that they were notinvesting effort in the task. The six subjects’ 2-movement/imagery data were classified tentimes using the same procedure. This was done for each combination of 2 movements/imageriesfrom the original 4. The results were collapsed across subjects.
The 2-movement/imagery classification results from subject 6 were examined in detail,because this subject had an ERD/ERS for every movement/imagery, and therefore had equallysubstantive data for every movement/imagery. We used this subject to investigate which pairsof movements/imageries were the easiest and hardest to discriminate. To reveal anyrelationship between 2-movement and 2-imagery testing accuracies, 2-movement testingaccuracies were compared to 2-imagery testing accuracies using a linear regression.
ICA TopographiesBased on the training data, ICA separated the channel data into mutually independentcomponents. The number of ICA components was automatically chosen based on classificationperformance in the training procedure (measured by cross-validation accuracy). This isphysiologically sound because neuronal sources separated into ICA components are likely tobe mutually independent from each other, and surely independent from environmental noise.Therefore, meaningful neural components associated with the movement/imagery task wererelatively amplified compared to the un-associated neural components and noise, which wereattenuated (Bai et al. 2007).
Morash et al. Page 5
Clin Neurophysiol. Author manuscript; available in PMC 2009 November 1.
NIH
-PA Author Manuscript
NIH
-PA Author Manuscript
NIH
-PA Author Manuscript

The ICA spatial filter attenuated the EEG signal over some scalp sites, and amplified the EEGsignal over other scalp sites. To visualize typical signals amplified by ICA spatial filtering, wecreated ICA topography plots for one subject (subject 6). We made four plots, one for 4-movement, 4-imagery, 2-movement, and 2-imagery classification. The plots depict which scalplocations were attenuated and which were amplified. Each plot was made from only oneclassification (out of five 4-movement/imagery classifications and ten 2-movement/imageryclassifications), because the ICA weights and component numbers differed betweenclassifications due to the different training data.
Classification featuresOur choice of DWT for temporal filtering determined that classification features were acombination of channel and variable width frequency bin (Bai et al. 2007). The features had atime window encompassing the entire 1.5 seconds before movement/imagery execution (S2).Features above 40 Hz were excluded, since there was no expectation of finding relevant neuralsignals above this frequency.
Classification features were visualized by creating Bhattacharyya distance matrices and scalpplots. The matrices depicted the Bhattacharyya distance of each feature (features were brokeninto 3.9 Hz bins, instead of variable width bins, for visualization) for a particular subject’smovement or imagery preparation. Bhattacharyya distances beyond the 100 highest werecorrected to zero. The scalp plots indicated the Bhattacharyya distance of each channel for aparticular 3.9 Hz frequency bin. Points between channel locations were interpolated to createcontinuous gradients of color. Within both types of plots, colors indicated the Bhattacharyyadistance of the associated feature. A larger Bhattacharyya distance indicated a greaterseparability of the data by the associated feature.
The traditional method of ERD/ERS analysis, which is based on power spectral estimation, issimilar to that from DWT (the classification features). Therefore, the spatial, temporal, andspectral characteristics of the ERD/ERS were describable by the DWT features.
A single ERD/ERS pattern likely extended over several frequency bins, and several channels.Therefore, the ERD/ERS was available to the BCI through many different features (each featurewas a combination of channel and frequency bin). If, as we had hypothesized, the ERD/ERSsignals were the best for differentiating the 4 movements/imageries, the BCI wouldpreferentially select ERD/ERS features. To assess the impact of using ERD/ERS features onclassification, we examined the top ten features (determined by their Bhattacharyya distances).If a feature was composed of an M1 channel (C1, C3, C5, CP1, CP3, CP5, C2, C4, C6, CP2,CP4, or CP6) and frequency between 8-30 Hz, it was regarded as an ERD/ERS feature. If afeature was composed of a frequency below 4 Hz, it was regarded as a CNV feature. Wecompared the presence of only ERD/ERS features in the top ten features to average testingaccuracies using a linear regression (movement and imagery were considered separately). Thiswas not done for CNV features, because of the extremely small number of CNV features.
ResultsTrial exclusion
Trial exclusion retained, per subject, an average of 55.9 (standard deviation 10.1) trials permovement/imagery, from an original average of 78.4 (standard deviation 12.4) trials collectedper movement/imagery. The correlation between the average quantity of included trials andaverage 4-movement/imagery testing accuracy was not significant (p>0.05); similarly notsignificant was the correlation between the average quantity of included trials and variance of4-movement/imagery testing accuracies (p>0.05).
Morash et al. Page 6
Clin Neurophysiol. Author manuscript; available in PMC 2009 November 1.
NIH
-PA Author Manuscript
NIH
-PA Author Manuscript
NIH
-PA Author Manuscript

CNV and ERD/ERS visualizationsCNV visualizations, except for subject 7 motor imagery and subject 8 movement and motorimagery, displayed the characteristic widespread negativity. Subject 7 completed movementtrials correctly, but lost interest in performing imagery trials in anticipation of the experimentending. Subject 8 was unable to maintain attention during any portion of the experiment dueto excessive sleepiness. Therefore, CNV absence indicated failure to adequately participate inthe experiment.
The CNV visualizations for subject 7 right hand movement (containing a CNV) and motorimagery (not containing a CNV), from C3 (channel 5), are included to depict what we deemedas present and absent CNVs. The CNV visualizations for subject 5 right tongue movement andmotor imagery, from CP2 (channel 19), are also included (Fig. 2). Movement and motorimagery produced similar CNV waveforms when CNVs were present. CNVs tended to bewidespread, being visible in almost all channels, but with particularly large amplitudes in morecentral and frontal channels. Negativity began about 1.2 seconds before S2, following a positivepeak that occurred about 1.5 seconds before S2. This positive peak represented a P100 responseto visual S1 stimuli. Negativity persisted, often with slight attenuation, until S2, when itsubsided.
The ERD/ERS visualizations for subject 7 right hand movement (containing an ERD, areduction of a specific frequency component, related to increased neural activity) and motorimagery (not containing an ERD), from C3 (channel 5), are included to depict what we deemedas present and absent ERDs. The ERD/ERS visualizations for subject 5 tongue movement andmotor imagery (both containing an ERS, an enhancement of a specific frequency component,related to neural suppression), from CP2 (channel 19), are included as examples of ERSs (Fig.3). ERD/ERSs appeared in mostly motor channels. They were characterized by a sustainedpower decrease/increase in the 8-30 Hz range, beginning about 1.0-1.5 seconds before S2 andpersisting at least until S2, and often beyond S2 appearance. The number of movements ormotor imageries displaying an ERD/ERS correlated well with average testing accuracies(movement r2≈0.43, imagery r2≈0.59, p<0.05).
Subjects that displayed ERD/ERSs for movement did not necessarily display ERD/ERSs formotor imagery, or vice versa. Subjects were not limited to displaying an ERD or ERSexclusively, since they could display an ERD for some movements or imageries and an ERSfor others. A movement/imagery never displayed both an ERD and an ERS. Also, a movementERD could correspond to an imagery ERS, or vice versa (Table 1).
Training and testing accuraciesFive training and testing accuracies were collected from each subject for 4 movements and 4motor imageries (Fig. 4). Ten training and testing accuracies were obtained from subjects 1-6(Fig. 5). For subject 6, the correlation between average 2-movement testing accuracy andaverage 2-imagery testing accuracy was not significant (p>0.05). The highest average 2-movement/imagery testing accuracies involved right foot and left hand responses. The lowestaverage 2-movement/imagery testing accuracies involved tongue responses.
ICA TopographiesTo illustrate the neural signals amplified by ICA, we created four example plots of ICAtopographies (Fig. 6). Heavy contributions from sensorimotor areas were detected, and circledin the figure. This illustrates the emphasis of our system on motor-related signals.
Morash et al. Page 7
Clin Neurophysiol. Author manuscript; available in PMC 2009 November 1.
NIH
-PA Author Manuscript
NIH
-PA Author Manuscript
NIH
-PA Author Manuscript

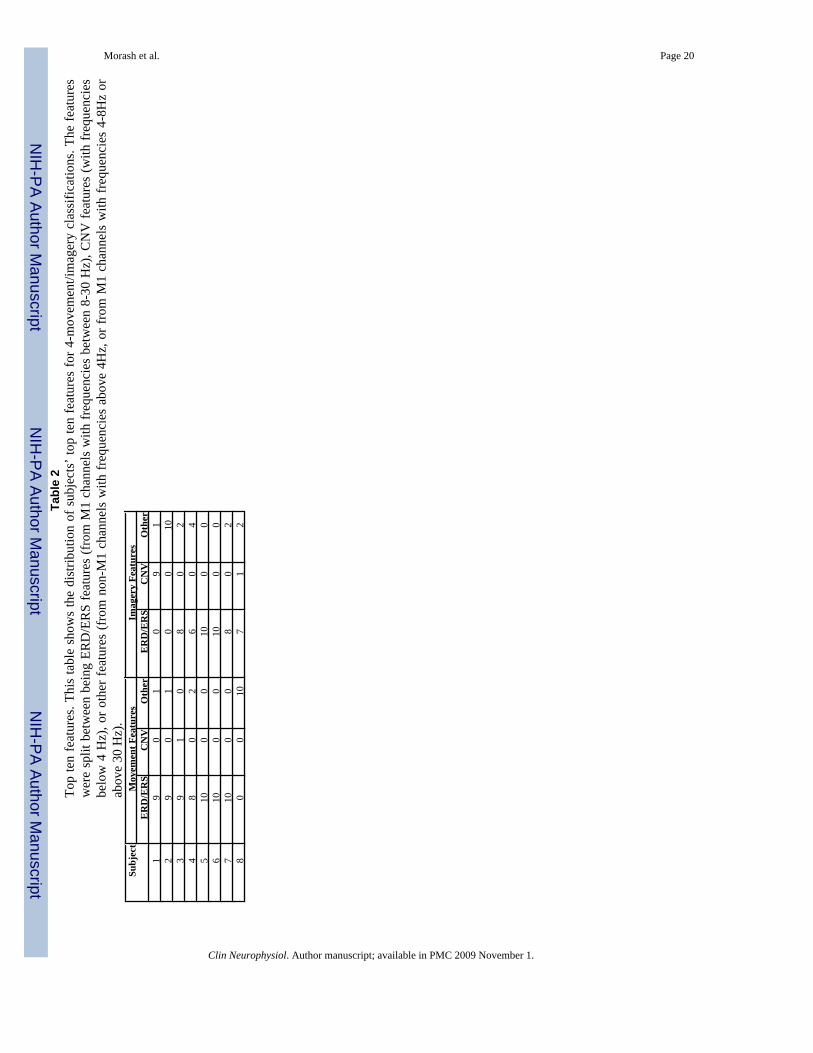
Classification featuresExample feature visualizations are shown for subject 6 (Fig. 7). They show feature preferencefor ERD/ERS signals (over M1 channels, with frequencies between 8-30 Hz). Our systemselected mostly ERD/ERS features as top ten features, instead of CNV features or otherfeatures. The only exception to preference for ERD/ERS over CNV features was for subject 1imagery (Table 2). Additionally, the presence of only ERD/ERS features in the top ten washighly correlated with testing accuracy (movement r2 ≈0.51, imagery r2 ≈0.53, p<0.05).Classifications that did not rely on ERD/ERS or CNV features, but were in motor channels,had high frequencies (around 39 Hz), which were unlikely to carry relevant neural information,and probably represented recording equipment or environmental noise. Other classificationsthat did not rely on ERD/ERS or CNV features used features that were dispersed through morefrontal channels. These features probably represented cognitive preparation (in the frontal andprefrontal cortices) for ensuing movement/imagery or cognitive noise from subject inattention.This selection by the BCI of non-CNV and non-ERD/ERS features was probably due to thefailure of the BCI to identify ERD/ERS or CNV features. Use of these non-CNV and non-ERD/ERS features was not associated with high classification accuracy.
DiscussionMovement and motor imagery preparation
Every subject displayed a typical CNV waveform unless they were not performing the task, inwhich case they also lacked ERD/ERSs. Performing subjects with CNVs sometimes lackedERD/ERSs, confirming independence between the CNV and ERD/ERS phenomena (Filipovicet al. 2001).
The 2-movement/imagery results averaged across subjects 1-6 were nearly identical for eachpair of movement/imagery. Each subject had particular pairs of movements/imageries thatproduced better results than the rest, but these trends were not consistent across subjects. Thismay be related to the diversity we found in our subjects’ ERD/ERSs. For subject 6, who wasthe only subject with ERD/ERSs for every movement/imagery, 2-movement and 2-imageryaverage testing accuracies were not significantly correlated. This agrees with a functionaldifference in preparation between movement and kinesthetic motor imagery. Specifically,motor imagery preparation involves less M1 activity than does movement preparation (Caldaraet al. 2004; Hanakawa et al. 2008). The dissimilarities between each subject’s movement andimagery ERD/ERSs also agree with this finding. Insufficient work has been conducted tocompare the ERD/ERS patterns for movement preparation to ERD/ERS patterns for motorimagery preparation. Such research could possibly explain why, in this experiment, preparatoryERD/ERS presence correlated better with imagery prediction accuracy than movementprediction accuracy. More generally, such research could lead to a better understanding of thedifferent neural activity involved in preparation for movement and motor imagery, and howthis activity is related to the movement being performed or imagined.
The large difference between subjects’ BCI accuracies (testing accuracies) reflected a variableability of our BCI to extract motor-related information, in particular the ERD/ERS. Our systempreferentially extracted this information, but it was not always available. This suggests that theERD/ERS is the neural signal preceding movement and motor imagery that is most specific tothe particular movement/imagery. Observed variability may have been due to differences inthe shape and position of M1 with respect to the skull, changing the relationship betweenchannel locations and M1, making channels more or less effective at detecting M1 activity.Alternatively, it may have been due to differences in the amount and location of cortical activityexperienced when preparing for movement/imagery. Such functional diversity may explainwhy some subjects with a CNV waveform had ERD/ERSs (representing two separate motor
Morash et al. Page 8
Clin Neurophysiol. Author manuscript; available in PMC 2009 November 1.
NIH
-PA Author Manuscript
NIH
-PA Author Manuscript
NIH
-PA Author Manuscript
processes) and some did not. This explanation would be confirmed if, through training, asubject could improve his or her BCI accuracy by making M1 information more available.
Implications for BCI applicationsThe collection of more trials neither improved our BCI’s accuracy nor reduced the variabilityof its results. Our BCI performed best when using the ERD/ERS movement/imagerypreparation signals from M1. We expected our BCI to produce the best results whendifferentiating between right hand and right foot preparations since EEG channels would detectthese signals on opposite sides of the head. This is because, even though both right hand andright foot M1 representations are in the left hemisphere, right foot activity appears in righthemisphere EEG channels (Osman et al. 2005). We did not have high expectations fordifferentiating right and left hand preparations, since these can activate the same areas of theleft hemisphere for right-handed subjects (Bai et al. 2005). We also did not expect tonguepreparations to produce relatively discernible signals, for reasons explained later.
Overall, no particular movement/imagery produced better results than any other. However, the2-movement/imagery results from subject 6, who had strong neural signals (ERD/ERSs) foreach movement/imagery, garner some insight. Despite our expectations, right foot and lefthand signals were the easiest for our BCI to differentiate. Perhaps, even though the EEG signalswere detected on the same side of the head, the opposite hemisphere activity kept the signalsfrom sharing similar noise or other characteristics, making them easier to differentiate.
We expected our BCI to produce the worst results when differentiating between tongue andother preparations, which it did. The tongue representation is relatively small and distributedacross both hemispheres. Additionally, tongue movements created a glossokinetic potential(GKP) that disrupted the EEG signal (Satow et al. 2004). Trials contaminated by this GKPwere identified in our trial exclusion process. For future application, our BCI’s results may beimproved by replacing tongue movement/imagery with an alternative, such as the left foot.
It would be informative to compare our results to those from a similar BCI that used actualmovement/imagery signals instead of the preceding ERD/ERS. This may be done in a futurestudy, seeing as we did not ask subjects to make 1.5 seconds of movement/imagery forcomparison. We directed our subjects to make non-sustained movements/imageries, since non-sustained movement/imagery is a major advantage of using a preparation BCI (as discussed inthe introduction).
Overall, our BCI has the following advantages over other BCIs: 2-dimensional control through4 commands; a natural control scheme (especially for right-left-up-down); a system thatminimizes fatigue by using natural and non-sustained movements/imageries; and response onan acceptable time scale. Assuming that a patient could enhance their preparatory ERD/ERScontributions through training, our BCI could greatly impact the lives of patients sufferingfrom ailments such as amyotrophic lateral sclerosis (ALS) or spinal cord injury. These patientshave severe paralysis and a BCI could offer them control of mechanical, entertainment, andcommunication devices.
AcknowledgementsThis research was supported by the Intramural Research Program of the NIH, National Institute of NeurologicalDisorders and Stroke. Ms. Morash was also partly supported by NINDS Summer Intern Program. The authors thankMs. D.G. Schoenberg for skillful editing.
Morash et al. Page 9
Clin Neurophysiol. Author manuscript; available in PMC 2009 November 1.
NIH
-PA Author Manuscript
NIH
-PA Author Manuscript
NIH
-PA Author Manuscript
ReferencesBai O, Lin P, Vorbach S, Li J, Furlani S, Hallett M. Exploration of Computational methods for
classification of movement intention during human voluntary movement from single trial EEG. ClinNeurophysiol. 2007In press
Bai O, Mari Z, Vorbach S, Hallett M. Asymmetric spatiotemporal patterns of event-relateddesynchronization preceding voluntary sequential finger movements: a high-resolution EEG study.Clin Neurophysiol 2005;116:1213–1221. [PubMed: 15826864]
Brunner C, Scherer R, Graimann B, Supp G, Pfurtscheller G. Online control of a brain-computer interfaceusing phase synchronization. IEEE Trans Biomed Eng 2006;53:2501–2506. [PubMed: 17153207]
Caldara R, Deiber MP, Andrey C, Michel C, Thut G, Hauert CA. Actual and mental motor preparationand execution: a spatiotemporal ERP study. Exp Brain Res 2004;159:389–399. [PubMed: 15480592]
Filipovic SR, Jahanshahi M, Rothwell JC. Uncoupling of contingent negative variation and alpha bandevent-related desynchronization in a go/no-go task. Clin Neurophysiol 2001;112:1307–1315.[PubMed: 11516743]
Good, PI. Resampling methods : a practical guide to data analysis. Boston: Birkhäuser; 2006.Hanakawa T, Dimyan MA, Hallett M. Motor Planning, Imagery, and Execution in the Distributed Motor
Network: A Time-Course Study with Functional MRI. Cereb Cortex. 2008Ikeda A, Luders HO, Collura TF, Burgess RC, Morris HH, Hamano T, Shibasaki H. Subdural potentials
at orbitofrontal and mesial prefrontal areas accompanying anticipation and decision making in humans:a comparison with Bereitschaftspotential. Electroenceph clin Neurophysiol 1996;98:206–212.[PubMed: 8631280]
Marques De Sa, JP. Pattern Recognition: Concepts, Methods, and Applications. Berlin: Springer-Verlag;2001.
Neuper C, Pfurtscheller G. Event-Related Negativity and Event-Related Desynchronization DuringPreparation for Motor Acts. Eeg-Emg-Zeitschrift Fur Elektroenzephalographie ElektromyographieUnd Verwandte Gebiete 1992;23:55–61.
Neuper C, Scherer R, Reiner M, Pfurtscheller G. Imagery of motor actions: differential effects ofkinesthetic and visual-motor mode of imagery in single-trial EEG. Brain Res Cogn Brain Res2005;25:668–677. [PubMed: 16236487]
Osman A, Muller KM, Syre P, Russ B. Paradoxical lateralization of brain potentials during imaginedfoot movements. Brain Res Cogn Brain Res 2005;24:727–731. [PubMed: 15894471]
Pfurtscheller G. Functional Topography during Sensorimotor Activation Studied with Event-RelatedDesynchronization Mapping. J Clin Neurophysiol 1989;6:75–84. [PubMed: 2915031]
Pfurtscheller G. Induced oscillations in the alpha band: Functional meaning. Epilepsia 2003;44:2–8.[PubMed: 14641556]
Pfurtscheller G, Neuper C, Andrew C, Edlinger G. Foot and hand area mu rhythms. Int J Psychophysiol1997;26:121–135. [PubMed: 9202999]
Rohrbaugh JW, Syndulko K, Lindsley DB. Brain wave components of the contingent negative variationin humans. Science 1976;191:1055–1057. [PubMed: 1251217]
Rosahl SK, Knight RT. Role of prefrontal cortex in generation of the contingent negative variation. CerebCortex 1995;5:123–134. [PubMed: 7620289]
Satow T, Ikeda A, Yamamoto J, Begum T, Thuy DH, Matsuhashi M, Mima T, Nagamine T, Baba K,Mihara T, Inoue Y, Miyamoto S, Hashimoto N, Shibasaki H. Role of primary sensorimotor cortexand supplementary motor area in volitional swallowing: a movement-related cortical potential study.Am J Physiol Gastrointest Liver Physiol 2004;287:G459–G470. [PubMed: 14701719]
Sharbrough F, Chatrian G-E, Lesser RP, Luders H, Nuwer M, Picton TW. AmericanElectroencephalographic Society guidelines for standard electrode position nomenclature. J ClinNeurophysiol 1991;8:200–202. [PubMed: 2050819]
Tecce JJ. Contingent negative variation (CNV) and psychological processes in man. Psychol Bull1972;77:73–108. [PubMed: 4621420]
Tecce, JJ.; Cattanach, L. Contingent negative variation. In: Niedermeyer, E.; Lopes da Silva, FH., editors.Electroencephalography, Basic Principles, Clinical Applications and Related Fields. Baltimore:Williams and Wilkins; 1993. p. 887-910.
Morash et al. Page 10
Clin Neurophysiol. Author manuscript; available in PMC 2009 November 1.
NIH
-PA Author Manuscript
NIH
-PA Author Manuscript
NIH
-PA Author Manuscript

Walter WG, Cooper R, Aldridge VJ, McCallum WC, Winter AL. Contingent Negative Variation: AnElectric Sign of Sensorimotor Association and Expectancy in the Human Brain. Nature1964;203:380–384. [PubMed: 14197376]
Morash et al. Page 11
Clin Neurophysiol. Author manuscript; available in PMC 2009 November 1.
NIH
-PA Author Manuscript
NIH
-PA Author Manuscript
NIH
-PA Author Manuscript

Fig. 1.Trial stimuli. Stimuli presented during a single trial included a cross, an arrow (S1), and adiamond (S2). Subjects were asked to blink and swallow only during the cross presentation.S1 indicated the movement or imagery the subject should perform immediately upon S2appearance.
Morash et al. Page 12
Clin Neurophysiol. Author manuscript; available in PMC 2009 November 1.
NIH
-PA Author Manuscript
NIH
-PA Author Manuscript
NIH
-PA Author Manuscript

Fig. 2.CNV visualization examples. CNV visualizations from C3 (channel 5) associated with subject7 right hand movement (a) and motor imagery (b); and from CP2 (channel 19) associated withsubject 5 tongue movement (c) and motor imagery (d). Time is measured relative to S2appearance. Dashed lines represent the 95% confidence interval. All visualizations, exceptsubject 7’s motor imagery visualization, reveals a CNV waveform, a negative shift in potentialbeginning about 1.5 seconds before S2 appearance.
Morash et al. Page 13
Clin Neurophysiol. Author manuscript; available in PMC 2009 November 1.
NIH
-PA Author Manuscript
NIH
-PA Author Manuscript
NIH
-PA Author Manuscript

Fig. 3.ERD/ERS visualization examples. ERD/ERS visualizations from C3 (channel 5) associatedwith subject 7 right hand movement (a) and motor imagery (b); and from CP2 (channel 19)associated with subject 5 tongue movement (c) and motor imagery (d). Colors depict therelative amplitudes, or power, of the frequencies in the signals’ power spectra. Time ismeasured relative to S2 appearance. For subject 7, the movement visualization, but not themotor imagery visualization, reveals an ERD, a sustained reduction of power, for frequenciesaround 10 Hz beginning about 1.5 seconds before S2 appearance. For subject 5, bothvisualizations reveal an ERS, a sustained increase of power, for frequencies around 12 Hzbeginning about 1.0 seconds before S2 appearance.
Morash et al. Page 14
Clin Neurophysiol. Author manuscript; available in PMC 2009 November 1.
NIH
-PA Author Manuscript
NIH
-PA Author Manuscript
NIH
-PA Author Manuscript

Fig. 4.4-movement/imagery results. Average training and testing accuracies for 4-movement (a) and4-imagery (b) classification. Error bars indicate standard deviation. Chance accuracy for 4-movement/imagery classification was 25%.
Morash et al. Page 15
Clin Neurophysiol. Author manuscript; available in PMC 2009 November 1.
NIH
-PA Author Manuscript
NIH
-PA Author Manuscript
NIH
-PA Author Manuscript

Fig. 5.2-movement/imagery results from subjects 1-6 (a) and subject 6 (b). Average training andtesting accuracies for 2-movement/imagery classification. Error bars indicate standarddeviation. Pairs of letters indicate the movements/imageries: R for right hand squeeze, L forleft hand squeeze, T for tongue press on the roof of the mouth, and F for right foot toe curl.Chance accuracy for 2-movement/imagery classification was 50%.
Morash et al. Page 16
Clin Neurophysiol. Author manuscript; available in PMC 2009 November 1.
NIH
-PA Author Manuscript
NIH
-PA Author Manuscript
NIH
-PA Author Manuscript
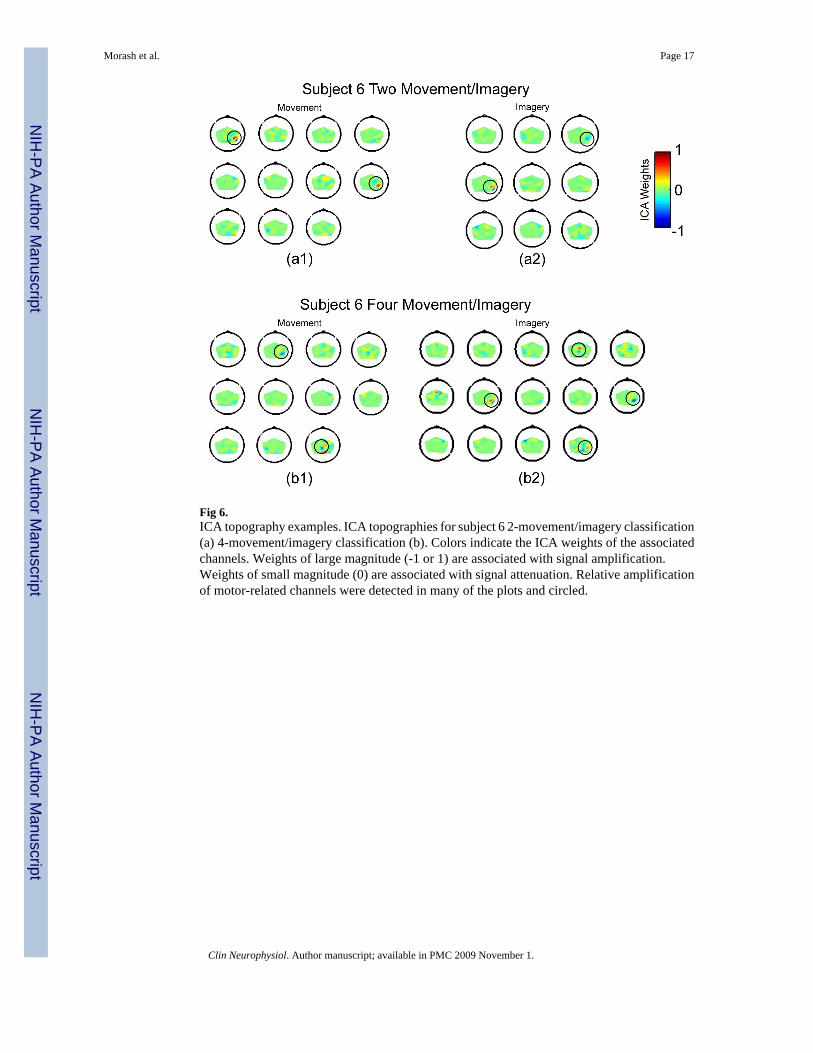
Fig 6.ICA topography examples. ICA topographies for subject 6 2-movement/imagery classification(a) 4-movement/imagery classification (b). Colors indicate the ICA weights of the associatedchannels. Weights of large magnitude (-1 or 1) are associated with signal amplification.Weights of small magnitude (0) are associated with signal attenuation. Relative amplificationof motor-related channels were detected in many of the plots and circled.
Morash et al. Page 17
Clin Neurophysiol. Author manuscript; available in PMC 2009 November 1.
NIH
-PA Author Manuscript
NIH
-PA Author Manuscript
NIH
-PA Author Manuscript

Fig. 7.Feature visualization examples. Feature visualizations for subject 6 movement (a) and motorimagery (b) classification. Colors indicate the Bhattacharyya distance of the associated feature.Scalp plots (a1 and b1) are for the 3.9 Hz frequency bin centered at 19.5 Hz. Bhattacharyyadistance matrices (a2 and b2) are scaled to match the associated scalp plot.
Morash et al. Page 18
Clin Neurophysiol. Author manuscript; available in PMC 2009 November 1.
NIH
-PA Author Manuscript
NIH
-PA Author Manuscript
NIH
-PA Author Manuscript

NIH
-PA Author Manuscript
NIH
-PA Author Manuscript
NIH
-PA Author Manuscript
Morash et al. Page 19
Table 1ERD/ERS presence. Subject’s movements and motor imageries that displayed a preparatory ERD or ERS. Actionentries indicate the movement/imagery: R for right hand squeeze, L for left hand squeeze, T for tongue press on theroof of the mouth, and F for right foot toe curl. Movement and imagery entries indicate the display of an ERD, an ERS,or neither (-).
Subject Action Movement Imagery
1 R - -L ERD ERDT - ERDF ERD -
2 R - ERDL - ERDT - ERDF - -
3 R - -L - -T - -F ERD -
4 R - -L ERD -T - -F ERD -
5 R ERS -L ERS ERDT ERS ERSF ERS -
6 R ERD ERSL ERD ERDT ERS ERSF ERS ERD
7 R ERD -L ERD -T ERD -F ERD -
8 R - -L - -T - -F ERD -
Clin Neurophysiol. Author manuscript; available in PMC 2009 November 1.
NIH
-PA Author Manuscript
NIH
-PA Author Manuscript
NIH
-PA Author Manuscript
Morash et al. Page 20Ta
ble
2To
p te
n fe
atur
es. T
his
tabl
e sh
ows
the
dist
ribut
ion
of s
ubje
cts’
top
ten
feat
ures
for 4
-mov
emen
t/im
ager
y cl
assi
ficat
ions
. The
feat
ures
wer
e sp
lit b
etw
een
bein
g ER
D/E
RS
feat
ures
(fro
m M
1 ch
anne
ls w
ith fr
eque
ncie
s be
twee
n 8-
30 H
z), C
NV
feat
ures
(with
freq
uenc
ies
belo
w 4
Hz)
, or o
ther
feat
ures
(fro
m n
on-M
1 ch
anne
ls w
ith fr
eque
ncie
s ab
ove
4Hz,
or f
rom
M1
chan
nels
with
freq
uenc
ies
4-8H
z or
abov
e 30
Hz)
.Su
bjec
tM
ovem
ent F
eatu
res
Imag
ery
Feat
ures
ER
D/E
RS
CN
VO
ther
ER
D/E
RS
CN
VO
ther
19
01
09
12
90
10
010
39
10
80
24
80
26
04
510
00
100
06
100
010
00
710
00
80
28
00
107
12
Clin Neurophysiol. Author manuscript; available in PMC 2009 November 1.
Copyright © 2022 FDOKUMEN