Rankings of extreme and widespread dry and wet events in ...
14
Earth Syst. Dynam., 12, 197–210, 2021 https://doi.org/10.5194/esd-12-197-2021 © Author(s) 2021. This work is distributed under the Creative Commons Attribution 4.0 License. Rankings of extreme and widespread dry and wet events in the Iberian Peninsula between 1901 and 2016 Margarida L. R. Liberato 1,2 , Irene Montero 1 , Célia Gouveia 2,3 , Ana Russo 2 , Alexandre M. Ramos 2 , and Ricardo M. Trigo 2 1 Escola de Ciências e Tecnologia, Universidade de Trás-os-Montes e Alto Douro, UTAD, 5000-801 Vila Real, Portugal 2 Instituto Dom Luiz, Faculdade de Ciências, Universidade de Lisboa, 1749-016 Lisbon, Portugal 3 Instituto Português do Mar e da Atmosfera Lisboa, 1749-077 Lisbon, Portugal Correspondence: Margarida L. R. Liberato ([email protected]) Received: 10 July 2020 – Discussion started: 24 August 2020 Accepted: 11 November 2020 – Published: 19 February 2021 Abstract. Extensive, long-standing dry and wet episodes are two of the most frequent climatic extreme events in the Iberian Peninsula. Here, a method for ranking regional extremes of persistent, widespread drought and wet events is presented, considering different timescales. The method is based on the multi-scalar Standardized Precipitation Evapotranspiration Index (SPEI) gridded dataset for the Iberian Peninsula. Climatic Research Unit (CRU) data are used to compute the SPEI between 1901 and 2016 by means of a log-logistic probability distri- bution function. The potential evapotranspiration (PET) is computed using the Penman–Monteith equation. The ranking classification method is based on the assessment of the magnitude of an event, which is obtained after considering both the area affected by the respective dryness or wetness – defined by SPEI values over a certain threshold – and its intensity in each grid point. A sensitivity analysis of the impact of different thresholds used to define dry and wet events is also performed. For both the dry and wet periods, this simple yet robust tool allows for the identification and ranking of well-known regional extremes of persistent, extensive dry and wet periods at different timescales. A comprehensive dataset of rankings of the most extreme, prolonged, widespread dry and wet periods in the Iberian Peninsula is presented for aggregated timescales of 6, 12, 18, and 24 months. Results show that no region in the Iberian Peninsula is more prone to the occurrence of any of these long-term (dry and/or wet) extreme events. Finally, it is highlighted that the application of this methodology to other domains and periods represents an important tool for extensive, long-standing, extreme event assessment worldwide. 1 Introduction Similar to other Mediterranean regions, droughts represent one of the most frequent damaging natural hazards in the Iberian Peninsula (Sousa et al., 2011; Lionello et al., 2012; Trigo et al., 2013). In fact, drought events in the Iberian Peninsula (IP) can induce large socio-economic costs, often with widespread negative ecosystem impacts, such as signif- icant losses of agricultural production (e.g. Gouveia et al., 2009), hydro-electric production (e.g. Jerez et al., 2013), or an increasing risk of forest fires (e.g. Amraoui et al., 2013; Liberato et al., 2017). On the other hand, persistent large- scale precipitation periods may also be disruptive, often be- ing responsible for high negative socio-economic impacts, such as major floods, landslides, extensive property damage, and even loss of human lives, as described in the literature for wet winters occurring in the IP (e.g. Zêzere et al., 2005; Vicente-Serrano et al., 2011; Sousa and Bastos, 2013). Drought is a complex phenomenon and differs from other natural hazards in various ways (Wilhite, 1993). Its complex- ity is linked to the quantification of drought severity, which is usually performed by means of the drought’s impacts on dif- ferent sectors including the economy, ecology, forestry, and agriculture. The identification of drought onset and end as well as the quantification of its spatial extent and intensity Published by Copernicus Publications on behalf of the European Geosciences Union.
-
Upload
khangminh22 -
Category
Documents
-
view
1 -
download
0
Transcript of Rankings of extreme and widespread dry and wet events in ...
Earth Syst. Dynam., 12, 197–210, 2021https://doi.org/10.5194/esd-12-197-2021© Author(s) 2021. This work is distributed underthe Creative Commons Attribution 4.0 License.
Rankings of extreme and widespread dry and wet eventsin the Iberian Peninsula between 1901 and 2016
Margarida L. R. Liberato1,2, Irene Montero1, Célia Gouveia2,3, Ana Russo2, Alexandre M. Ramos2, andRicardo M. Trigo2
1Escola de Ciências e Tecnologia, Universidade de Trás-os-Montes e Alto Douro,UTAD, 5000-801 Vila Real, Portugal
2Instituto Dom Luiz, Faculdade de Ciências, Universidade de Lisboa, 1749-016 Lisbon, Portugal3Instituto Português do Mar e da Atmosfera Lisboa, 1749-077 Lisbon, Portugal
Correspondence: Margarida L. R. Liberato ([email protected])
Received: 10 July 2020 – Discussion started: 24 August 2020Accepted: 11 November 2020 – Published: 19 February 2021
Abstract. Extensive, long-standing dry and wet episodes are two of the most frequent climatic extreme eventsin the Iberian Peninsula. Here, a method for ranking regional extremes of persistent, widespread drought andwet events is presented, considering different timescales. The method is based on the multi-scalar StandardizedPrecipitation Evapotranspiration Index (SPEI) gridded dataset for the Iberian Peninsula. Climatic Research Unit(CRU) data are used to compute the SPEI between 1901 and 2016 by means of a log-logistic probability distri-bution function. The potential evapotranspiration (PET) is computed using the Penman–Monteith equation. Theranking classification method is based on the assessment of the magnitude of an event, which is obtained afterconsidering both the area affected by the respective dryness or wetness – defined by SPEI values over a certainthreshold – and its intensity in each grid point. A sensitivity analysis of the impact of different thresholds used todefine dry and wet events is also performed. For both the dry and wet periods, this simple yet robust tool allowsfor the identification and ranking of well-known regional extremes of persistent, extensive dry and wet periods atdifferent timescales. A comprehensive dataset of rankings of the most extreme, prolonged, widespread dry andwet periods in the Iberian Peninsula is presented for aggregated timescales of 6, 12, 18, and 24 months. Resultsshow that no region in the Iberian Peninsula is more prone to the occurrence of any of these long-term (dryand/or wet) extreme events. Finally, it is highlighted that the application of this methodology to other domainsand periods represents an important tool for extensive, long-standing, extreme event assessment worldwide.
1 Introduction
Similar to other Mediterranean regions, droughts representone of the most frequent damaging natural hazards in theIberian Peninsula (Sousa et al., 2011; Lionello et al., 2012;Trigo et al., 2013). In fact, drought events in the IberianPeninsula (IP) can induce large socio-economic costs, oftenwith widespread negative ecosystem impacts, such as signif-icant losses of agricultural production (e.g. Gouveia et al.,2009), hydro-electric production (e.g. Jerez et al., 2013), oran increasing risk of forest fires (e.g. Amraoui et al., 2013;Liberato et al., 2017). On the other hand, persistent large-scale precipitation periods may also be disruptive, often be-
ing responsible for high negative socio-economic impacts,such as major floods, landslides, extensive property damage,and even loss of human lives, as described in the literaturefor wet winters occurring in the IP (e.g. Zêzere et al., 2005;Vicente-Serrano et al., 2011; Sousa and Bastos, 2013).
Drought is a complex phenomenon and differs from othernatural hazards in various ways (Wilhite, 1993). Its complex-ity is linked to the quantification of drought severity, which isusually performed by means of the drought’s impacts on dif-ferent sectors including the economy, ecology, forestry, andagriculture. The identification of drought onset and end aswell as the quantification of its spatial extent and intensity
Published by Copernicus Publications on behalf of the European Geosciences Union.
198 M. L. R. Liberato: Rankings of extreme and widespread dry and wet events in the Iberian Peninsula
represents a challenge. The intricacy of this phenomenon isassociated with the impossibility of finding a single variableto measure in order to quantify the distinct characteristicsof droughts (Vicente-Serrano et al., 2012). Drought is es-sentially one consequence of an anomalous decrease in pre-cipitation (Palmer, 1965); however, drought intensity variesboth with timescale (McKee et al., 1993) and spatial extent(Vicente-Serrano, 2006). The World Meteorological Organi-zation (WMO, 2006) presents a commonly accepted classifi-cation of droughts into the following four categories:
1. meteorological drought, which is defined as a precipita-tion departure from normal over a predefined period oftime;
2. agricultural drought, which is defined in terms of thesoil water required to support healthy crop growth dur-ing the growing season and depends on the precipita-tion rate and soil characteristics that favour the water-holding capacity;
3. hydrological drought, which usually results from defi-ciencies in surface and subsurface water supplies, caus-ing reservoirs, lakes, and rivers to dry up as well as a de-cline in the groundwater level – there is a considerabletime lag between precipitation events and their impactson surface and subsurface components of the hydrologicsystem, with recovery also being slow due to the longrecharge periods;
4. socio-economic drought, which associates droughtswith the supply and demand of an economic good thatis dependent on precipitation.
In recent years, a special focus has been put on environmentalor ecologic droughts when considering long and widespreaddry events with strong impacts that may induce changesin natural and managed ecosystems (Crausbay et al., 2017;Vicente-Serrano et al., 2020a).
Drought analysis and monitoring have been conductedusing several methodological approaches (e.g. Heim, 2002;Mukherjee et al., 2018). The demanding task of objectivelyidentifying the onset and end of a drought as well as thequantification of drought severity has led to the developmentof a new set of drought indicators (Vicente-Serrano et al.,2010a): the Palmer Drought Severity Index (PDSI, Palmer,1965), founded on a soil water balance equation; the Stan-dardized Precipitation Index (SPI; McKee et al., 1993), builtusing a precipitation probabilistic approach; and the Stan-dardized Precipitation Evapotranspiration Index (SPEI), cal-culated using precipitation and temperature fields. The mainadvantage of the SPEI is that it combines the multi-scalarcharacter of the SPI with the ability to include the effectsof temperature variability on drought assessment (Vicente-Serrano et al., 2010b).
Several studies have shown the relationship between thetemporal variability of drought indices and the response
of natural ecosystems, such as tree growth (DeSoto et al.,2014), river discharge (Vicente-Serrano and López-Moreno,2005), crop yields (Vicente-Serrano et al., 2006; Páscoa etal., 2017a), and vegetation activity (Vicente-Serrano et al.,2013; Liberato et al., 2017). The multi-scalar character of theSPI and SPEI indices enables the quantification of differenttypes of droughts, which is something that neither the PDSInor the so-called self-calibrated PDSI (scPDSI), enhancedto assess droughts over the Mediterranean region (Wells etal., 2004; van der Schrier et al., 2006; Sousa et al., 2011),can provide. Shorter timescales (between 3 and 6 months)can be used to describe agricultural droughts (McKee et al.,1993), as they allow one to monitor the moisture condi-tions relative to soil and vegetation (Vicente-Serrano, 2006).Medium-length timescales (between 6 and 12 months) areoften useful to evaluate hydrological droughts due to theirability to monitor surface water resources (Vicente-Serranoand López-Moreno, 2005). Longer timescales (between 24and 36 months) indicate longer but less frequent droughtswith fewer wet or dry periods (Vicente-Serrano, 2006).
Vicente-Serrano et al. (2012) compared the performanceof the above-mentioned drought indices and found that theSPEI and SPI, both computed for different timescales, havean improved ability to capture drought impacts on hydrolog-ical, agricultural, and ecological systems. Additionally, theSPEI was the index that best captured the responses of theconsidered meteorological variables to drought in summerand was more sensitive to global warming (Vicente-Serranoet al., 2010b), as the general (not for a specific species) wa-ter balance is reflected in the SPEI computation by the in-clusion of the difference between monthly precipitation andthe potential evapotranspiration. Moreover, the PDSI, SPEI,and SPI allow for the quantification of both wetness (positivevalue) and dryness (negative values). The SPI and SPEI arealso standardized variables that allow for the detailed analy-sis of droughts across sites with very different climatology.Over the last few years, both have been used to character-ize the dry and wet periods in several regions, namely theSPI for the United States (Wu et al., 2007), Italy (Vergniand Todisco, 2011), and China (Du et al., 2013), and theSPEI for the Czech Republic (Potopová et al., 2015), cen-tral Europe (Spinoni et al., 2013), China (Tao et al., 2015),and Vietnam (Stojanovic et al., 2020). Several authors haveperformed drought characterization and the assessment ofimpacts, namely on vegetation dynamics (Gouveia et al.,2016; Liberato et al., 2017) and on crop production and yield(Páscoa et al., 2017a, b; Ribeiro et al., 2019a). The SPEIand SPI were used to identify drought severity and inten-sity, and both indices can identify the severest and longestevents. Despite the recent issues raised due to the uncer-tainties on atmospheric evaporative demand (AED) compu-tation (Domínguez-Castro et al., 2019; Vicente-Serrano etal., 2020b), some works have highlighted the ability of theSPEI to identify tendencies towards dryer conditions in the
Earth Syst. Dynam., 12, 197–210, 2021 https://doi.org/10.5194/esd-12-197-2021
M. L. R. Liberato: Rankings of extreme and widespread dry and wet events in the Iberian Peninsula 199
IP (Vicente-Serrano et al., 2014; Spinoni et al., 2015; Coll etal., 2016; Páscoa et al., 2017b).
The characterization of wet and dry periods in the IP be-comes extremely important as the region is frequently af-fected by extreme wet and dry events (Vicente-Serrano etal., 2011; Ramos et al., 2014, 2016; González-Hidalgo etal., 2018; Domínguez-Castro et al., 2019; Sorí et al., 2020;Vicente-Serrano et al., 2020b) and, consequently, by theirimpacts on several systems (Liberato, 2014; Trigo et al.,2016; Liberato et al., 2017; Pereira et al., 2018; Ribeiro etal., 2019a, b). The significant damage from these events jus-tifies the use of several timescales in the analyses, rangingfrom 6 to 24 months. Thus, it is important to carry out the as-sessment of the extreme wet and dry periods affecting an ex-tensive area of IP at longer timescales. Therefore, this workhas the main goal of ranking the most severe, widespreaddry and wet periods in Iberia at several timescales as well asanalysing their evolution over time from the beginning of the20th century to present.
In summary, the main goals of this paper are to
i present a tool that allows for the identification of re-gional extremes of persistent, widespread dry and wetperiods at different timescales;
ii build a comprehensive dataset of rankings of the mostextreme, prolonged, widespread drought and wet peri-ods in Iberia, for timescales of 6, 12, 18 and 24 months,spanning the period from 1901 to 2016, using the multi-scalar SPEI gridded dataset with a regular resolution of0.5◦.
It should be highlighted that the novelty of this study istwo-fold: on the one hand, the methodology introduced byRamos et al. (2014) for precipitation, which is adapted hereto build rankings of extreme and widespread dry and wetevents, accounting for several timescales, is applied. This ap-proach has the advantage of being easily scalable to otherdomains and indices. On the other hand, this article providesevidence of the importance of assessing extreme events con-sidering both the intensity and spatial extent. Developing aranking system is fundamental for future research on (dryand wet) extremes: from an impact study perspective, it is im-portant for the development of future risk assessments, but itis also important to understand the physical mechanisms be-hind each of these events to enable the attribution of theseevents to climate (natural or forced) variability or to climatechange.
2 Data and methodology
2.1 SPEI datasets
The Climatic Research Unit (CRU) TS4.01 high-resolutiongridded data for the 1901–2016 period are used in this study
to obtain the SPEI time series. The CRU TS4.01 dataset in-cludes month-by-month time series that are calculated onhigh-resolution (0.5× 0.5◦) grids based on an archive ofmonthly average daily data provided by more than 4000weather stations distributed around the world (Jones and Har-ris, 2013). At this resolution the study region of the IP corre-sponds to a square of 30× 30 grid pixels.
The CRU TS43.01 variables include cloud cover, diur-nal temperature range, frost day frequency, potential evap-otranspiration (PET), precipitation, daily mean temperature,monthly average daily maximum and minimum tempera-ture, vapour pressure, and wet-day frequency. Thus, thisdataset is very suitable for the study of climate variabilityand for drought analysis. The CRU potential evapotranspi-ration (PET) used is based on the Penman–Monteith equa-tion. This method is considered to be the standard proce-dure for computing PET by several international institutions,such as the Food and Agriculture Organization of the UnitedNations (FAO), the International Commission on Irrigationand Drainage (ICID), and the American Society of Civil En-gineers (ASCE). The log-logistic probability distribution isalso used to fit the SPEI, and the L-moment method is usedfor the parameter estimation. This formulation allows for avery good fit to the series of differences between precipita-tion and PET (Vicente-Serrano et al., 2010b).
SPEI values mostly range between −2.5 and 2.5, corre-sponding to exceedance probabilities of approximately 0.006and 0.994 respectively, although the theoretical limits are(−∞, ∞). The severe dry and wet events were selectedbased on a SPEI threshold of −1.28 and 1.28 respectively,which corresponds to approximately 10 % of the extremecases according to the probability distribution function (Ag-new, 2000).
The use of a long-term period (116 years) allows for theidentification of spatial patterns of droughts and wet peri-ods over the IP; this increases the knowledge on the mostintense and wide-ranging extremes in the region as well astheir temporal variability from a climatic perspective whilealso classifying the extreme events and the wet or drought-prone areas.
The usage of datasets that include data prior to 1950 iswidely discussed (e.g. Sousa et al., 2011). Nevertheless, itshould be recognized that the CRU TS 4.01 dataset orig-inates from thousands of stations dispersed non-randomly,with higher densities at mid-latitudes (Macias-Fauria et al.,2014). As the analysis of the present work is constrained tothe IP, which includes a relatively homogeneous number ofstations, we consider that the quality of the data ensures arobust analysis (keeping in mind that the number of stationsused has varied over time). Supplementary information onstations’ availability and on the interpolation methods usedis provided in New et al. (2000) and Mitchell and Jones(2005). With respect to the smaller number of meteorolog-ical stations available until the 1950s in comparison with theremaining period, Harris et al. (2013) showed that these pre-
https://doi.org/10.5194/esd-12-197-2021 Earth Syst. Dynam., 12, 197–210, 2021
200 M. L. R. Liberato: Rankings of extreme and widespread dry and wet events in the Iberian Peninsula
cipitation and temperature time series are highly correlatedwith other datasets. Moreover, this database has been used byRusso et al. (2015) and Páscoa et al. (2017a), who attainedgood results in the IP, including the earlier years (Páscoa etal., 2017a, b).
2.2 Ranking extreme widespread drought and wetevents
As previously mentioned, one of the main aims of this studyis to characterize and rank the most extreme, widespreaddrought (wet) events. Thus, only severe drought (wet) eventsshould be selected based on a SPEI threshold of −1.28(+1.28), which corresponds to 10 % of extreme cases ac-cording to the probability distribution function. This proce-dure allows for the selection of a dataset of extreme drought(wet) events for each grid point that is then analysed. Fol-lowing the approach used for daily extreme precipitation inIberia (Ramos et al., 2014), we adapt it for a monthly dataset.Thus, the spatial extent of the events is assessed for eachmonth of the dataset and for each timescale by multiplying
– the mean value of the SPEI for all of the grid pointsselected from the threshold criteria above – i.e. below(above) the threshold of −1.28 (+1.28);
– the area (hereafter A, in percent) affected by that ex-treme value.
It is worth mentioning that the sensitivity of this ranking tothe chosen threshold has also been assessed. Several testshave been performed, namely by using a less restrictive value(−0.83 and +0.83 for moderate dry and wet events respec-tively). As expected, these changes imply that the absolutemean values are reduced while the area increases. Final re-sults do not change the top rank of the most extreme eventssignificantly, even though some years appear in different rankorder.
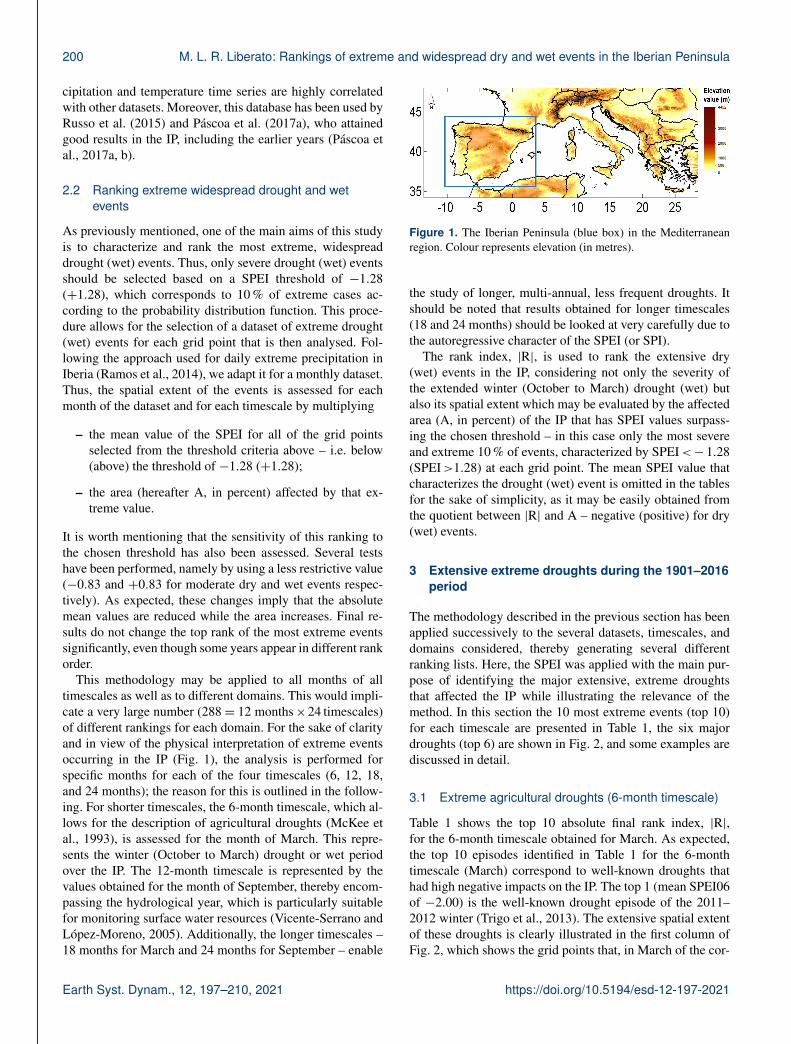
This methodology may be applied to all months of alltimescales as well as to different domains. This would impli-cate a very large number (288= 12 months×24 timescales)of different rankings for each domain. For the sake of clarityand in view of the physical interpretation of extreme eventsoccurring in the IP (Fig. 1), the analysis is performed forspecific months for each of the four timescales (6, 12, 18,and 24 months); the reason for this is outlined in the follow-ing. For shorter timescales, the 6-month timescale, which al-lows for the description of agricultural droughts (McKee etal., 1993), is assessed for the month of March. This repre-sents the winter (October to March) drought or wet periodover the IP. The 12-month timescale is represented by thevalues obtained for the month of September, thereby encom-passing the hydrological year, which is particularly suitablefor monitoring surface water resources (Vicente-Serrano andLópez-Moreno, 2005). Additionally, the longer timescales –18 months for March and 24 months for September – enable
Figure 1. The Iberian Peninsula (blue box) in the Mediterraneanregion. Colour represents elevation (in metres).
the study of longer, multi-annual, less frequent droughts. Itshould be noted that results obtained for longer timescales(18 and 24 months) should be looked at very carefully due tothe autoregressive character of the SPEI (or SPI).
The rank index, |R|, is used to rank the extensive dry(wet) events in the IP, considering not only the severity ofthe extended winter (October to March) drought (wet) butalso its spatial extent which may be evaluated by the affectedarea (A, in percent) of the IP that has SPEI values surpass-ing the chosen threshold – in this case only the most severeand extreme 10 % of events, characterized by SPEI <− 1.28(SPEI >1.28) at each grid point. The mean SPEI value thatcharacterizes the drought (wet) event is omitted in the tablesfor the sake of simplicity, as it may be easily obtained fromthe quotient between |R| and A – negative (positive) for dry(wet) events.
3 Extensive extreme droughts during the 1901–2016period
The methodology described in the previous section has beenapplied successively to the several datasets, timescales, anddomains considered, thereby generating several differentranking lists. Here, the SPEI was applied with the main pur-pose of identifying the major extensive, extreme droughtsthat affected the IP while illustrating the relevance of themethod. In this section the 10 most extreme events (top 10)for each timescale are presented in Table 1, the six majordroughts (top 6) are shown in Fig. 2, and some examples arediscussed in detail.
3.1 Extreme agricultural droughts (6-month timescale)
Table 1 shows the top 10 absolute final rank index, |R|,for the 6-month timescale obtained for March. As expected,the top 10 episodes identified in Table 1 for the 6-monthtimescale (March) correspond to well-known droughts thathad high negative impacts on the IP. The top 1 (mean SPEI06of −2.00) is the well-known drought episode of the 2011–2012 winter (Trigo et al., 2013). The extensive spatial extentof these droughts is clearly illustrated in the first column ofFig. 2, which shows the grid points that, in March of the cor-
Earth Syst. Dynam., 12, 197–210, 2021 https://doi.org/10.5194/esd-12-197-2021

M. L. R. Liberato: Rankings of extreme and widespread dry and wet events in the Iberian Peninsula 201
Table 1. The 10 most dry extreme events (top 10) for each timescale. Absolute final rank index, |R|, for the 6-month timescale obtained forMarch (SPEI 06), for the 12-month timescale obtained for September (SPEI 12), for the 18-month timescale obtained for March (SPEI 18),and for the 24-month timescale obtained for September (SPEI 24). “A” represents the area (in percent) where the respective index is belowthe −1.28 threshold.
Rank SPEI 06 (March) SPEI 12 (September) SPEI 18 (March) SPEI 24 (September)
No. Year A ( %) |R| Year A ( %) |R| Year A ( %) |R| Year A ( %) |R|
1 2012 73.86 147.47 2005 73.30 158.96 2012 78.98 172.34 2005 79.83 177.062 2000 69.32 129.45 2012 76.14 131.91 2005 71.59 114.41 2012 79.55 166.703 1983 56.25 91.50 2009 68.47 126.58 1949 62.22 109.02 2015 67.90 116.684 1907 54.55 87.60 2015 67.33 122.75 2008 62.50 100.84 1945 61.65 115.755 1961 55.97 85.96 2016 60.51 114.43 1992 53.13 99.07 1995 63.64 109.466 1992 51.14 85.96 1945 61.65 112.38 1981 49.43 78.94 2016 52.56 96.227 1945 49.15 75.89 2011 63.35 108.24 1995 39.20 72.32 2009 49.72 86.088 1993 44.89 72.21 2003 53.13 90.60 2000 40.06 61.41 2011 37.22 62.689 1995 40.63 71.10 1990 53.69 85.52 2016 32.95 59.81 2014 35.80 58.9010 1944 44.60 68.71 1995 39.77 59.18 1999 38.64 57.09 2006 34.94 50.10
responding year, had SPEI values lower than−1.28 (at the 6-month timescale). Another notable aspect of these results isthat the most extreme episodes also correspond to events thataffected a larger area. In fact, during the top 6 events, repre-sented in the first column of Fig. 2, more than 50 % of the IParea suffered from severe or extreme drought. Additionally,as seen from the first column of Fig. 2, there is no evidenceof the existence of a particular region in the IP that might bemore prone to extreme or severe agricultural droughts, eventhough there is prevalence on the western sectors of the IP,especially affecting Portugal.
3.2 Extreme hydrological droughts (12-month timescale)
As previously mentioned, the 12-month timescale SPEI forthe month of September is used here to assess severe andextreme hydrological (October of year n−1 to September ofyear n) droughts, which represent important negative impactson the water resources. The analysis of Table 1 shows thatmost of the top 10 episodes of agricultural droughts (SPEI06)developed into extreme hydrological droughts (SPEI12) thatare also in the respective top 10. In fact, the 2004–2005 (topno. 15) drought event (García-Herrera et al., 2007), which isclassified here as the 15th most extreme agricultural droughtin the IP (mean SPEI06 of −1.48 over circa 32 % of Iberia),is now top no. 1 (mean SPEI12 of −2.17) on the 12-monthtimescale, with more than 73 % of the IP suffering severeor extreme drought (second column of Fig. 2); the 2012(SPEI06, top no. 1) drought is now the top no. 2 (meanSPEI12 of−1.73) on the 12-month timescale, with more than76 % of the IP suffering severe or extreme drought (Fig. 2);the 1945 (SPEI06, top no. 7) drought is now top no. 6 (meanSPEI12 of −1.82) on the 12-month timescale, with almost62 % of the IP suffering severe or extreme drought (Fig. 2).Naturally, some events can drop even more significantly inthe ranking; thus, the 2000 (top no. 2) drought is now top
no. 19 (mean SPEI12 of −1.59) on the 12-month timescale,with only 17 % of the IP suffering severe or extreme drought.From Table 1, it is noticeable that the spatial extent of themost extreme hydrological droughts is generally larger. Thearea of 2012 (SPEI06, top no. 1) is 74 %, while its area(SPEI12, top no. 2) increases to 76 %; and the area of 1945(SPEI06, top no. 7 ) increases from 49 % to 62 %. On thecontrary, the disappearance of some events from the top 10is generally due to a reduction in the affected area. This de-crease in the affected area is evident from inspection of thesecond column of Fig. 2.
3.3 Extreme persistent droughts (18- and 24-monthtimescales)
The same methodology has also been applied to study longer,persistent extreme droughts. As mentioned above, the 18-month timescale SPEI for the month of March (third col-umn of Fig. 2) and the 24-month timescale SPEI for themonth of September (fourth column of Fig. 2) are used toassess severe and extreme persistent droughts, which repre-sent major negative societal impacts. The analysis of Table 1shows that most of the top 10 episodes of extensive agricul-tural and hydrological droughts in the IP developed into ex-treme persistent droughts which are also in the top 10 on 18-and 24-month timescales. Examples are the 2004–2005 and2011–2012 droughts, alternating as top no. 1 and top no. 2on both timescales (A18= 72 % and A24= 80 % for 2005;A18= 79 % and A24= 80 % for 2012), the 2015–2016 (topno. 9, A18= 33 %, top no. 6, A24= 53 %) and the 1995 (topno. 7, A18= 39 %, top no. 5, A24= 64 %) droughts.
In summary, when applying this method that was devel-oped to take two factors into consideration, namely the areaof influence of the drought (given by SPEI values below acertain threshold) and the severity of the episode (given bythe mean values of the SPEI below the chosen threshold), the
https://doi.org/10.5194/esd-12-197-2021 Earth Syst. Dynam., 12, 197–210, 2021

202 M. L. R. Liberato: Rankings of extreme and widespread dry and wet events in the Iberian Peninsula
Figure 2. The top 6 drought events in the Iberian Peninsula domain for the 6-month timescale SPEI for March (2012, 2000, 1983, 1907,1961, and 1992; first column), the 12-month timescale SPEI for September (2005, 2012, 2009, 2015, 2016, and 1945; second column),the 18-month timescale SPEI for March (2012, 2005, 1949, 2008, 1992, and 1981; third column), and the 24-month timescale SPEI forSeptember (2005, 2012, 2015, 1945, 1995, and 2016; fourth column).
well-known widespread, extreme droughts occurring in theIP are correctly hierarchized at the different timescales.
3.4 Frequency of widespread droughts
Until this point, the method developed has only been appliedto the severe and extreme droughts by considering, for eachmonth, the −1.28 threshold (i.e. pixels with SPEI <− 1.28).As it is important to evaluate the sensitivity of the resultsto this criterion, similar rankings have been built with the−0.83 threshold for the same timescales. Therefore, thesenew ranking lists correspond to widespread moderate, severe,or extreme droughts. As expected, when relaxing the severitycriterion (from−1.28 to−0.83), the mean values of SPEI de-crease, whereas the area affected by the droughts increases.Consequently, the years in the top 10 ranking lists remain
mostly the same, although they may occupy a different rank-ing order. Exceptions are top no. 9 for SPEI06, top no. 10 forSPEI18, and top no. 8 and top no. 10 for SPEI24, which areno longer classified on the 10 most extreme episodes. Unsur-prisingly, the SPEI06 ranking list, corresponding to agricul-tural droughts, is the most sensitive to the threshold choice.The consistency among ranking lists is evident in the analy-sis of the time evolution of the ranking index obtained fromthe SPEI as depicted by the different timescales considered(Fig. 3). In this figure, the red lines correspond to the rank-ing indices obtained from only severe and extreme droughts(threshold −1.28), and the blue lines represent the rankingindices obtained from the most extreme droughts (threshold−1.65). The correlation for each pair of lists is between 0.962and 0.966.
Earth Syst. Dynam., 12, 197–210, 2021 https://doi.org/10.5194/esd-12-197-2021
M. L. R. Liberato: Rankings of extreme and widespread dry and wet events in the Iberian Peninsula 203
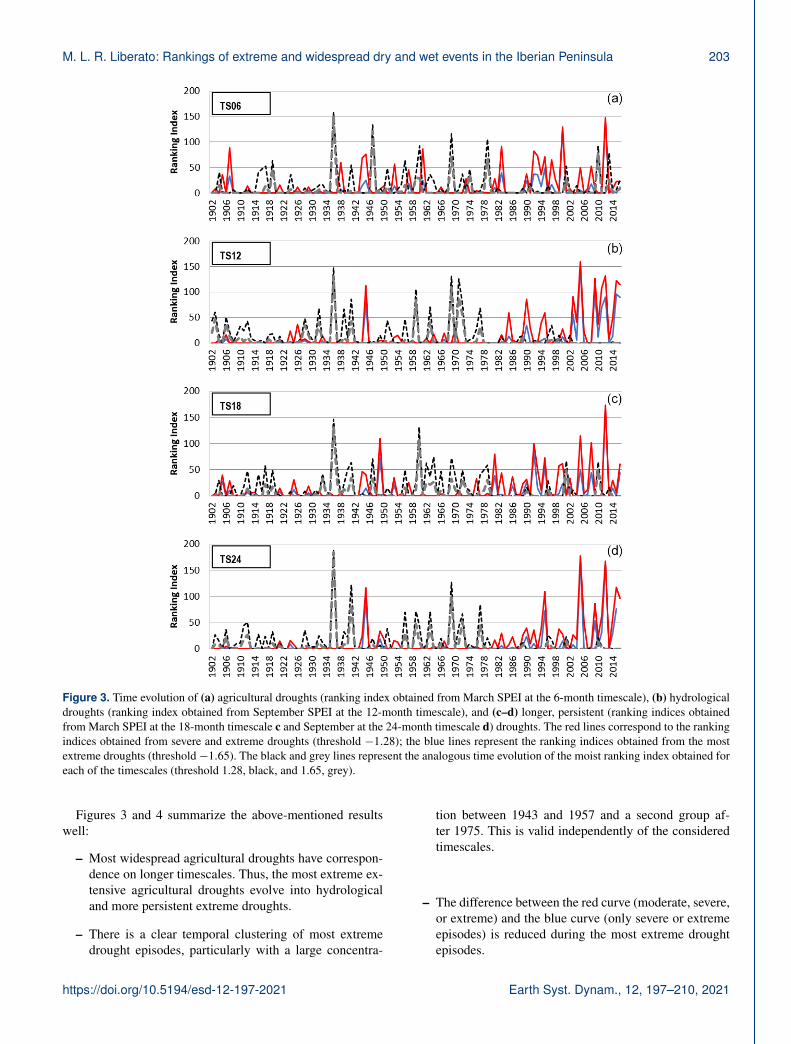
Figure 3. Time evolution of (a) agricultural droughts (ranking index obtained from March SPEI at the 6-month timescale), (b) hydrologicaldroughts (ranking index obtained from September SPEI at the 12-month timescale), and (c–d) longer, persistent (ranking indices obtainedfrom March SPEI at the 18-month timescale c and September at the 24-month timescale d) droughts. The red lines correspond to the rankingindices obtained from severe and extreme droughts (threshold −1.28); the blue lines represent the ranking indices obtained from the mostextreme droughts (threshold−1.65). The black and grey lines represent the analogous time evolution of the moist ranking index obtained foreach of the timescales (threshold 1.28, black, and 1.65, grey).
Figures 3 and 4 summarize the above-mentioned resultswell:
– Most widespread agricultural droughts have correspon-dence on longer timescales. Thus, the most extreme ex-tensive agricultural droughts evolve into hydrologicaland more persistent extreme droughts.
– There is a clear temporal clustering of most extremedrought episodes, particularly with a large concentra-
tion between 1943 and 1957 and a second group af-ter 1975. This is valid independently of the consideredtimescales.
– The difference between the red curve (moderate, severe,or extreme) and the blue curve (only severe or extremeepisodes) is reduced during the most extreme droughtepisodes.
https://doi.org/10.5194/esd-12-197-2021 Earth Syst. Dynam., 12, 197–210, 2021
204 M. L. R. Liberato: Rankings of extreme and widespread dry and wet events in the Iberian Peninsula
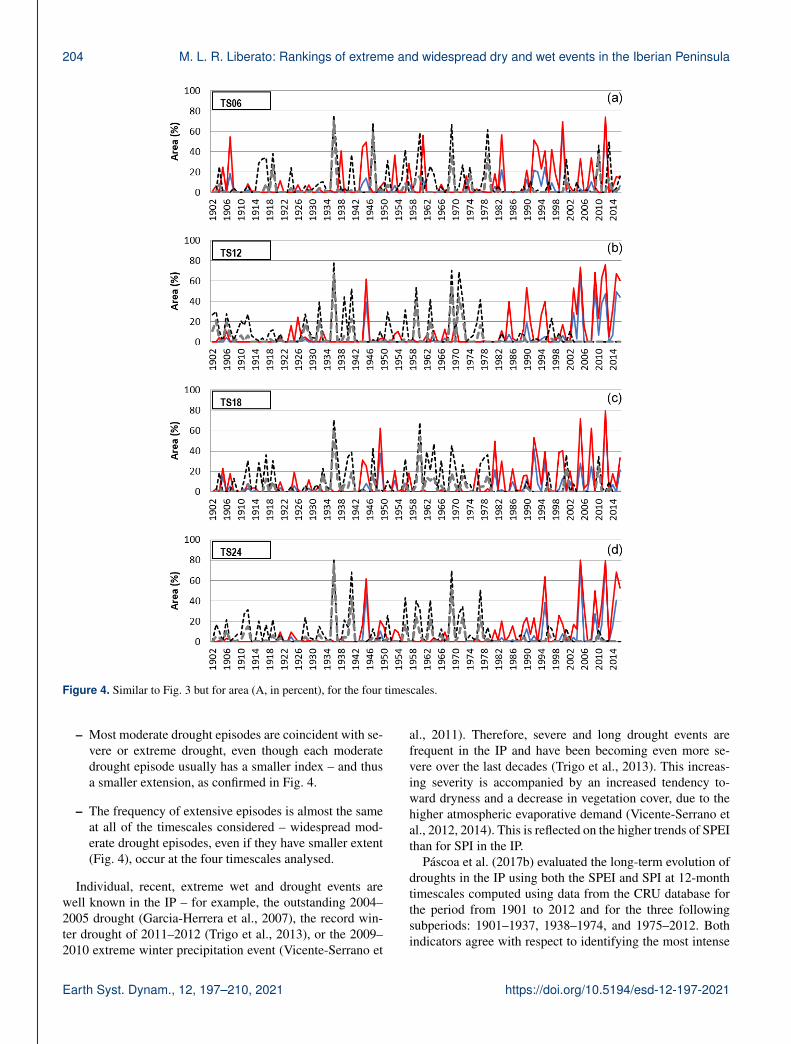
Figure 4. Similar to Fig. 3 but for area (A, in percent), for the four timescales.
– Most moderate drought episodes are coincident with se-vere or extreme drought, even though each moderatedrought episode usually has a smaller index – and thusa smaller extension, as confirmed in Fig. 4.
– The frequency of extensive episodes is almost the sameat all of the timescales considered – widespread mod-erate drought episodes, even if they have smaller extent(Fig. 4), occur at the four timescales analysed.
Individual, recent, extreme wet and drought events arewell known in the IP – for example, the outstanding 2004–2005 drought (Garcia-Herrera et al., 2007), the record win-ter drought of 2011–2012 (Trigo et al., 2013), or the 2009–2010 extreme winter precipitation event (Vicente-Serrano et
al., 2011). Therefore, severe and long drought events arefrequent in the IP and have been becoming even more se-vere over the last decades (Trigo et al., 2013). This increas-ing severity is accompanied by an increased tendency to-ward dryness and a decrease in vegetation cover, due to thehigher atmospheric evaporative demand (Vicente-Serrano etal., 2012, 2014). This is reflected on the higher trends of SPEIthan for SPI in the IP.
Páscoa et al. (2017b) evaluated the long-term evolution ofdroughts in the IP using both the SPEI and SPI at 12-monthtimescales computed using data from the CRU database forthe period from 1901 to 2012 and for the three followingsubperiods: 1901–1937, 1938–1974, and 1975–2012. Bothindicators agree with respect to identifying the most intense
Earth Syst. Dynam., 12, 197–210, 2021 https://doi.org/10.5194/esd-12-197-2021
M. L. R. Liberato: Rankings of extreme and widespread dry and wet events in the Iberian Peninsula 205
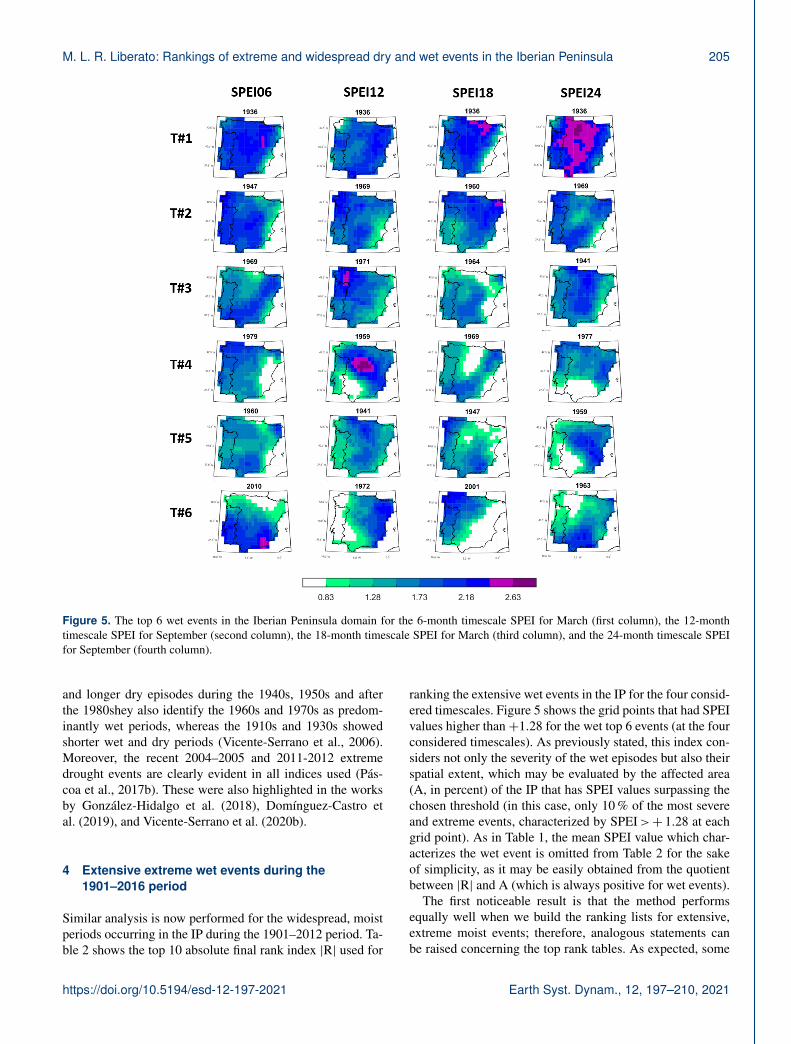
Figure 5. The top 6 wet events in the Iberian Peninsula domain for the 6-month timescale SPEI for March (first column), the 12-monthtimescale SPEI for September (second column), the 18-month timescale SPEI for March (third column), and the 24-month timescale SPEIfor September (fourth column).
and longer dry episodes during the 1940s, 1950s and afterthe 1980shey also identify the 1960s and 1970s as predom-inantly wet periods, whereas the 1910s and 1930s showedshorter wet and dry periods (Vicente-Serrano et al., 2006).Moreover, the recent 2004–2005 and 2011-2012 extremedrought events are clearly evident in all indices used (Pás-coa et al., 2017b). These were also highlighted in the worksby González-Hidalgo et al. (2018), Domínguez-Castro etal. (2019), and Vicente-Serrano et al. (2020b).
4 Extensive extreme wet events during the1901–2016 period
Similar analysis is now performed for the widespread, moistperiods occurring in the IP during the 1901–2012 period. Ta-ble 2 shows the top 10 absolute final rank index |R| used for
ranking the extensive wet events in the IP for the four consid-ered timescales. Figure 5 shows the grid points that had SPEIvalues higher than+1.28 for the wet top 6 events (at the fourconsidered timescales). As previously stated, this index con-siders not only the severity of the wet episodes but also theirspatial extent, which may be evaluated by the affected area(A, in percent) of the IP that has SPEI values surpassing thechosen threshold (in this case, only 10 % of the most severeand extreme events, characterized by SPEI >+ 1.28 at eachgrid point). As in Table 1, the mean SPEI value which char-acterizes the wet event is omitted from Table 2 for the sakeof simplicity, as it may be easily obtained from the quotientbetween |R| and A (which is always positive for wet events).
The first noticeable result is that the method performsequally well when we build the ranking lists for extensive,extreme moist events; therefore, analogous statements canbe raised concerning the top rank tables. As expected, some
https://doi.org/10.5194/esd-12-197-2021 Earth Syst. Dynam., 12, 197–210, 2021
206 M. L. R. Liberato: Rankings of extreme and widespread dry and wet events in the Iberian Peninsula
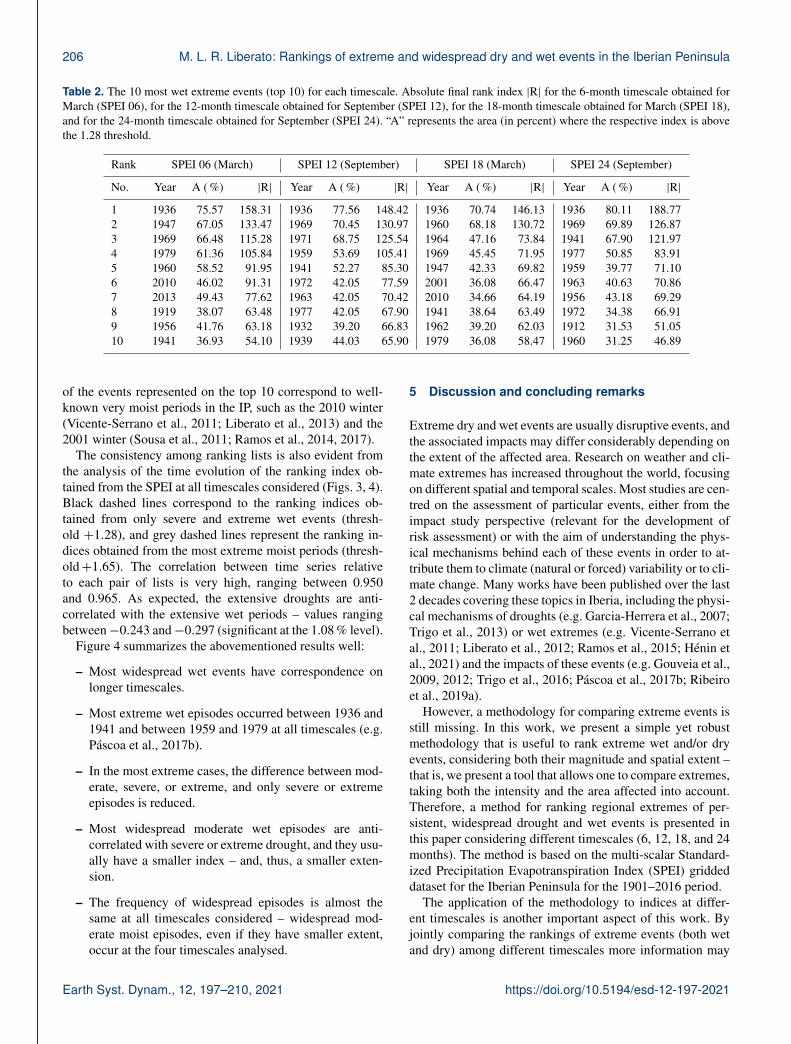
Table 2. The 10 most wet extreme events (top 10) for each timescale. Absolute final rank index |R| for the 6-month timescale obtained forMarch (SPEI 06), for the 12-month timescale obtained for September (SPEI 12), for the 18-month timescale obtained for March (SPEI 18),and for the 24-month timescale obtained for September (SPEI 24). “A” represents the area (in percent) where the respective index is abovethe 1.28 threshold.
Rank SPEI 06 (March) SPEI 12 (September) SPEI 18 (March) SPEI 24 (September)
No. Year A ( %) |R| Year A ( %) |R| Year A ( %) |R| Year A ( %) |R|
1 1936 75.57 158.31 1936 77.56 148.42 1936 70.74 146.13 1936 80.11 188.772 1947 67.05 133.47 1969 70.45 130.97 1960 68.18 130.72 1969 69.89 126.873 1969 66.48 115.28 1971 68.75 125.54 1964 47.16 73.84 1941 67.90 121.974 1979 61.36 105.84 1959 53.69 105.41 1969 45.45 71.95 1977 50.85 83.915 1960 58.52 91.95 1941 52.27 85.30 1947 42.33 69.82 1959 39.77 71.106 2010 46.02 91.31 1972 42.05 77.59 2001 36.08 66.47 1963 40.63 70.867 2013 49.43 77.62 1963 42.05 70.42 2010 34.66 64.19 1956 43.18 69.298 1919 38.07 63.48 1977 42.05 67.90 1941 38.64 63.49 1972 34.38 66.919 1956 41.76 63.18 1932 39.20 66.83 1962 39.20 62.03 1912 31.53 51.0510 1941 36.93 54.10 1939 44.03 65.90 1979 36.08 58.47 1960 31.25 46.89
of the events represented on the top 10 correspond to well-known very moist periods in the IP, such as the 2010 winter(Vicente-Serrano et al., 2011; Liberato et al., 2013) and the2001 winter (Sousa et al., 2011; Ramos et al., 2014, 2017).
The consistency among ranking lists is also evident fromthe analysis of the time evolution of the ranking index ob-tained from the SPEI at all timescales considered (Figs. 3, 4).Black dashed lines correspond to the ranking indices ob-tained from only severe and extreme wet events (thresh-old +1.28), and grey dashed lines represent the ranking in-dices obtained from the most extreme moist periods (thresh-old+1.65). The correlation between time series relativeto each pair of lists is very high, ranging between 0.950and 0.965. As expected, the extensive droughts are anti-correlated with the extensive wet periods – values rangingbetween−0.243 and−0.297 (significant at the 1.08 % level).
Figure 4 summarizes the abovementioned results well:
– Most widespread wet events have correspondence onlonger timescales.
– Most extreme wet episodes occurred between 1936 and1941 and between 1959 and 1979 at all timescales (e.g.Páscoa et al., 2017b).
– In the most extreme cases, the difference between mod-erate, severe, or extreme, and only severe or extremeepisodes is reduced.
– Most widespread moderate wet episodes are anti-correlated with severe or extreme drought, and they usu-ally have a smaller index – and, thus, a smaller exten-sion.
– The frequency of widespread episodes is almost thesame at all timescales considered – widespread mod-erate moist episodes, even if they have smaller extent,occur at the four timescales analysed.
5 Discussion and concluding remarks
Extreme dry and wet events are usually disruptive events, andthe associated impacts may differ considerably depending onthe extent of the affected area. Research on weather and cli-mate extremes has increased throughout the world, focusingon different spatial and temporal scales. Most studies are cen-tred on the assessment of particular events, either from theimpact study perspective (relevant for the development ofrisk assessment) or with the aim of understanding the phys-ical mechanisms behind each of these events in order to at-tribute them to climate (natural or forced) variability or to cli-mate change. Many works have been published over the last2 decades covering these topics in Iberia, including the physi-cal mechanisms of droughts (e.g. Garcia-Herrera et al., 2007;Trigo et al., 2013) or wet extremes (e.g. Vicente-Serrano etal., 2011; Liberato et al., 2012; Ramos et al., 2015; Hénin etal., 2021) and the impacts of these events (e.g. Gouveia et al.,2009, 2012; Trigo et al., 2016; Páscoa et al., 2017b; Ribeiroet al., 2019a).
However, a methodology for comparing extreme events isstill missing. In this work, we present a simple yet robustmethodology that is useful to rank extreme wet and/or dryevents, considering both their magnitude and spatial extent –that is, we present a tool that allows one to compare extremes,taking both the intensity and the area affected into account.Therefore, a method for ranking regional extremes of per-sistent, widespread drought and wet events is presented inthis paper considering different timescales (6, 12, 18, and 24months). The method is based on the multi-scalar Standard-ized Precipitation Evapotranspiration Index (SPEI) griddeddataset for the Iberian Peninsula for the 1901–2016 period.
The application of the methodology to indices at differ-ent timescales is another important aspect of this work. Byjointly comparing the rankings of extreme events (both wetand dry) among different timescales more information may
Earth Syst. Dynam., 12, 197–210, 2021 https://doi.org/10.5194/esd-12-197-2021
M. L. R. Liberato: Rankings of extreme and widespread dry and wet events in the Iberian Peninsula 207
be obtained on the real extreme character of the events.For both the dry and wet periods, this tool allows for theidentification of well-known regional extremes of persistent,widespread dry and wet periods at different timescales. Ad-ditionally, a comprehensive dataset of rankings of the mostextreme, prolonged, widespread drought and wet periods inIberia is built for 6-, 12-, 18-, and 24-month timescales, span-ning the period from 1901 to 2016, using the multi-scalarSPEI gridded dataset with a regular resolution of 0.5◦. Thisdataset will be available upon request for the following eightdomains: the Iberian Peninsula, Portugal, and each of the sixIberian regions. Future work will be performed in the frame-work of current projects based on the identified most extremeevents to better understand the common mechanisms behindeach of these events.
We would like to stress that, to the best of our knowl-edge, this is the first and only paper to present a methodol-ogy to rank extreme (dry and wet) events in the IP. Once themethodology is established, it would be extremely interest-ing to study precisely how the ranking’s positions comparewhen using other indices (such as the SPI or other impact-based indices that were not included in the construction ofthis methodology). This analysis will open new perspectivesregarding the understanding of the dynamics behind the mostextreme and widespread dry and wet events in the IP, as it isexpected that the behaviour is different between wet and dryextremes. By applying this method to different regions andindices, research on the most extreme events may be devel-oped worldwide.
Data availability. The rankings’ datasets are publicly availableat https://doi.org/10.6084/m9.figshare.13266440.v3 (Liberato et al.,2020) or on the project IMPECAF website (http://impecaf.rd.ciencias.ulisboa.pt/Ranking.html; IMPECAF, 2020). Please cite thearticle and database references. For further information, please con-tact the corresponding author.
Author contributions. AR performed the SPEI calculations andprovided the SPEI datasets; IM performed the ranking calculations;MLRL, IM, and AR designed and made the figures; MLRL and CGdesigned the study and wrote the article; and all authors contributedto the interpretation and discussion of the results and the revision ofthe paper.
Competing interests. The authors declare that they have no con-flict of interest.
Special issue statement. This article is part of the special issue“The 8th EGU Leonardo Conference: From evaporation to precip-itation: the atmospheric moisture transport”. It was presented atthe 8th EGU Leonardo Conference, Ourense, Spain, 25–27 Octo-ber 2016.
Acknowledgements. This work was supported by national fundsthrough FCT (Fundação para a Ciência e a Tecnologia, Por-tugal) and Portugal Horizon2020 under project WEx-Atlantic(PTDC/CTA-MET/29233/2017) and project UIDB/50019/2020 –IDL. The authors acknowledge the editor and three anonymous re-viewers for their pertinent comments that contributed to improvingthe paper.
Financial support. This research has been supported bythe Fundação para a Ciência e a Tecnologia (project nos.PTDC/CTA-MET/29233/2017, PTDC/CTA-CLI/28902/2017,CEECIND/00027/2017, and UIDB/50019/2020–IDL).
Review statement. This paper was edited by José Marengo andreviewed by three anonymous referees.
References
Agnew, C. T.: Using the SPI to identify drought, Drought Netw.News, 12, 6–12, 2000.
Amraoui, M., Liberato, M. L. R., Calado, T. J., DaCamara,C. C., Coelho, L. P. Trigo, R. M., and Gouveia, C. M.:Fire activity over Mediterranean Europe based on informa-tion from Meteosat-8, Forest Ecol. Manag., 294, 62–75,https://doi.org/10.1016/j.foreco.2012.08.032, 2013.
Coll, J., Aguilar, E., and Ashcroft, L.: Drought variability andchange across the Iberian Peninsula, Theor. Appl. Climatol., 130,901–916, 2016.
Crausbay, S. D., Ramirez, A. R., Carter, S. L., Cross, M. S., Hall,K. R., Bathke, D. J., Betancourt, J.L., Colt, S., Cravens, A.E., Dalton, M. S., Dunham, J. B., Hay, L. E., Hayes, M. J.,McEvoy, J., McNutt, C. A., Moritz, M.,A., Nislow, K. H., Ra-heem, N., and Sanford, T.: Defining Ecological Drought for theTwenty-First Century, B. Am. Meteorol. Soc., 98, 2543–2550,https://doi.org/10.1175/BAMS-D-16-0292.1, 2017.
DeSoto, L., Varino, F., Andrade, J. P., Gouveia, C. M., CampeloF., Trigo, R. M., and Nabais, C.: Different growth sensitiv-ity to climate of the conifer Juniperus thurifera on both sidesof the Mediterranean Sea, Int. J. Biometeorol., 58, 2095–2109,https://doi.org/10.1007/s00484-014-0811-y, 2014.
Domínguez-Castro, F, Vicente-Serrano, S. M., Tomás-Burguera,M, Peña-Gallardo, M., Beguería, S., El Kenawy, A., Luna, Y.,and Morata, A.: High spatial resolution climatology of droughtevents for Spain: 1961–2014, Int. J. Climatol., 39, 5046– 5062,https://doi.org/10.1002/joc.6126, 2019.
Du, J., Fang, J., Xu, W., and Shi, P.: Analysis of dry/wetconditions using the standardized precipitation index and itspotential usefulness for drought/flood monitoring in HunanProvince, China, Stoch. Environ. Res. Risk Assess., 27, 377–387,https://doi.org/10.1007/s00477-012-0589-6, 2013.
García-Herrera, R., Hernández, E., Barriopedro, D., Paredes,D.,Trigo, R. M., Trigo, I. F., and Mendes, M. A.: The Out-standing 2004/05 Drought in the Iberian Peninsula: Associ-ated Atmospheric Circulation, J. Hydrometeorol., 8, 483–498,https://doi.org/10.1175/JHM578.1, 2007.
https://doi.org/10.5194/esd-12-197-2021 Earth Syst. Dynam., 12, 197–210, 2021

208 M. L. R. Liberato: Rankings of extreme and widespread dry and wet events in the Iberian Peninsula
González-Hidalgo, J. C., Vicente-Serrano, S. M., Peña-Angulo, D., Salinas, C., Tomas-Burguera, M., and Beguería,S.: High-resolution spatio-temporal analyses of droughtepisodes in the western Mediterranean basin (Spanishmainland, Iberian Peninsula), Acta Geophys., 66, 381–392https://doi.org/10.1007/s11600-018-0138-x, 2018.
Gouveia, C., Trigo, R. M., and DaCamara, C. C.: Drought and vege-tation stress monitoring in Portugal using satellite data, Nat. Haz-ards Earth Syst. Sci., 9, 185–195, https://doi.org/10.5194/nhess-9-185-2009, 2009.
Gouveia, C. M., Bastos, A., Trigo, R. M., and DaCamara, C. C.:Drought impacts on vegetation in the pre- and post-fire eventsover Iberian Peninsula, Nat. Hazards Earth Syst. Sci., 12, 3123–3137, https://doi.org/10.5194/nhess-12-3123-2012, 2012.
Gouveia, C. M., Bistinas, I., Liberato, M. L. R., Bastos, A., Kout-siasd, N., and Trigo, R.: The outstanding synergy betweendrought, heatwaves and fuel on the 2007 Southern Greece ex-ceptional fire season, Agr. Forest Meteorol., 218–219, 135–145,https://doi.org/10.1016/j.agrformet.2015.11.023, 2016.
Harris I., Jones, P. D., Osborn, T. J., and Lister, D. H.: Updatedhigh-resolution grids of monthly climatic observations-the CRUTS3.10 Dataset, Int. J. Climatol., 34, 623–642, 2013.
Heim, R. R.: A Review of Twentieth-Century Drought Indices Usedin the United States, B. Am. Meteorol. Soc., 83, 1149–1166,https://doi.org/10.1175/1520-0477-83.8.1149, 2002.
Hénin, R., Ramos, A. M., Pinto, J. G., and Liberato, M. L.R.: A ranking of concurrent precipitation and wind eventsfor the Iberian Peninsula, Int. J. Climatol., 41, 1421–1437,https://doi.org/10.1002/joc.6829, 2021.
IMPECAF: Dataset, http://impecaf.rd.ciencias.ulisboa.pt/Ranking.html, last access: 22 December 2020.
Jerez S., Trigo R. M., Vicente-Serrano S. M., Pozo-Vazquez D.,Lorente-Plazas R., Lorenzo-Lacruz J., Santos-Alamillos F., andMontavez J. P.: The Impact of the North Atlantic Oscillation onRenewable Energy Resources in Southwestern Europe, J. Appl.Meteorol. Clim., 52, 2204–2225, https://doi.org/10.1175/JAMC-D-12-0257.1, 2013.
Jones, P. D. and Harris, I.: CRU TS3.21: Climatic ResearchUnit (CRU) Time-Series (TS) Version 3.21 of High ResolutionGridded Data of Month-by month Variation in Climate (Jan.1901 – Dec. 2012), NCAS British Atmospheric Data Centre,24th September 2013, https://doi.org/10.5285/D0E1585D-3417-485F-87AE-4FCECF10A992, 2013.
Liberato, M. L. R.: The 19 January 2013 windstorm overthe North Atlantic: large-scale dynamics and impactson Iberia, Weather and Climate Extremes, 5–6, 16–28https://doi.org/10.1016/j.wace.2014.06.002, 2014.
Liberato, M. L. R. and Trigo, R. M.: Extreme precipitation eventsand related impacts in Western Iberia, in: Hydrology in a Chang-ing World: Environmental and Human Dimensions, IAHS Press,IAHS Red Book No 363, 171–176, 2014.
Liberato, M. L. R., Ramos, A. M., Trigo, R. M., Trigo, I. F.,Durán-Quesada, A. M., Nieto, R., and Gimeno, L.: Moisturesources and large-scale dynamics associated with a flash floodevent. In Lagrangian Modeling of the Atmosphere, edited by:Lin, J., Brunner, D., Gerbig, C., Stohl, A., Luhar, A., and We-bley, P., pp. 111–126, Washington, DC, Am. Geophys. Union,https://doi.org/10.1029/2012GM001244, 2012.
Liberato, M. L. R., Pinto, J. G., Trigo, R. M., Ludwig, P.,Ordóñez, P., Yuen, D., and Trigo, I. F.: Explosive develop-ment of winter storm Xynthia over the subtropical North At-lantic Ocean, Nat. Hazards Earth Syst. Sci., 13, 2239–2251,https://doi.org/10.5194/nhess-13-2239-2013, 2013.
Liberato, M. L. R., Ramos, A. M., Gouveia, C. M., Sousa, P.,Russo, A., Trigo, R. M., and Santo, F. E.: Exceptionally ex-treme drought in Madeira Archipelago in 2012: Vegetation im-pacts and driving conditions, Agr. Forest Meteorol., 232, 195–209, https://doi.org/10.1016/j.agrformet.2016.08.010, 2017.
Liberato, M. L. R., Montero, I., Gouveia, C. M., Russo, A., Ramos,A. M., and Trigo, R. M.: Dry and wet events – Rankings forIberia, https://doi.org/10.6084/m9.figshare.13266440.v3, 2020.
Lionello P., Abrantes, F., Congedi, L., Dulac, F., Gacic, M., Gomis,D., Goodess, C., Hoff, H. Kutiel, H. Luterbacher, J., Planton, S.,Reale, M., Schröder, K., Struglia, M. V., Toreti, A., Tsimplis, M.,Ulbrich, U., and Xoplaki, E.: Introduction: Mediterranean Cli-mate: Background Information, in: The Climate of the Mediter-ranean Region. From the Past to the Future, edited by: LionelloP., Elsevier, the Netherlands, Amsterdam„ XXXV-IXXX, ISBN:9780124160422, 2012.
Macias-Fauria, M., Seddon, A. W. R., Benz, D., Long, P. R.,and Willis, K.: Spatiotemporal patterns of warming, Nat. Clim.Change, 4, 845–846, 2014.
McKee, T. B. N., Doesken, J., and Kleist, J.: The relationship ofdrought frecuency and duration to time scales, Eight Conf. OnApplied Climatology, Anaheim, CA, Amer. Meteor. Soc., 17–22January 1993, 179–184, 1993.
Mitchell, T. D. and Jones, P. D.: An improved method of construct-ing a database of monthly climate observations and associatedhigh-resolution grids, Int. J. Climatol., 25, 693–712, 2005.
Mukherjee, S., Mishra, A., and Trenberth, K. E.: Climate Changeand Drought: a Perspective on Drought Indices, Curr. Clim.Change Rep., 4, 145–163, https://doi.org/10.1007/s40641-018-0098-x, 2018.
New, M., Hulme, M., and Jones P.: Representing Twentieth-CenturySpaceTime Climate Variability. Part II: Development of MonthlyGrids of Terrestrial Surface Climate, J. Climate, 13, 2217–2238,2000.
Palmer, W. C.: Meteorological drought, Research Paper No. 45,U.S. Department of Commerce Weather Bureau, Washington,D.C., 1965.
Páscoa, P., Gouveia, C. M., Russo, A., and Trigo, R. M.:The roleof drought on wheat yield interannual variability in the IberianPeninsula from 1929 to 2012, Int. J. Biometeorol., 61, 439–451,https://doi.org/10.1007/s00484-016-1224-x, 2017a.
Páscoa, P., Gouveia, C. M., Russo, A., and Trigo, R.M.: Drought Trends in the Iberian Peninsula overthe Last 112 Years, Adv. Meteorol., 2017, 4653126,https://doi.org/10.1155/2017/4653126, 2017b.
Pereira, S., Ramos, A. M., Rebelo, L., Trigo, R. M., and Zêzere,J. L.: A centennial catalogue of hydro-geomorphological eventsand their atmospheric forcing, Adv. Water Resour., 122, 98–112,https://doi.org/10.1016/j.advwatres.2018.10.001, 2018.
Potopová, V., Štepánek, P., Možný, M., Türkott, L., and Soukup, J.:Performance of the standardised precipitation evapotranspirationindex at various lags for agricultural drought risk assessment inthe Czech Republic, Agr. Forest Meteorol., 202, 26–38, 2015.
Earth Syst. Dynam., 12, 197–210, 2021 https://doi.org/10.5194/esd-12-197-2021
M. L. R. Liberato: Rankings of extreme and widespread dry and wet events in the Iberian Peninsula 209
Ramos, A. M., Trigo, R. M., and Liberato, M. L. R.: Aranking of high-resolution daily precipitation extreme eventsfor the Iberian Peninsula, Atmos. Sci. Lett., 15, 328–334,https://doi.org/10.1002/asl2.507, 2014.
Ramos, A. M., Trigo, R. M., Liberato, M. L. R., and Tomé, R.:Daily precipitation extreme events in the Iberian Peninsula andits association with Atmospheric Rivers, J. Hydrometeorol., 16,579–597, https://doi.org/10.1175/JHM-D-14-0103.1, 2015.
Ramos, A. M., Trigo, R. M., and Liberato, M. L. R.:Ranking of multi-day extreme precipitation events overthe Iberian Peninsula, Int. J. Climatol., 37, 607–620,https://doi.org/10.1002/joc.4726, 2017.
Ribeiro, A. F. S., Russo, A., Gouveia, C. M., and Páscoa, P.: Mod-elling drought-related yield losses in Iberia using remote sensingand multiscalar indices, Theor. Appl. Climatol., 136, 203–220,https://doi.org/10.1007/s00704-018-2478-5, 2019a.
Ribeiro, A. F. S., Russo, A., Gouveia, C. M., Páscoa, P., andPires, C. A. L.: Probabilistic modelling of the dependence be-tween rainfed crops and drought hazard, Nat. Hazards EarthSyst. Sci., 19, 2795–2809, https://doi.org/10.5194/nhess-19-2795-2019, 2019b.
Russo, A. C., Gouveia, C. M. Trigo, R. M. Liberato, M.L., and DaCamara, C. C.: The influence of circulationweather patterns at different spatial scales on drought vari-ability in the Iberian Peninsula, Front. Environ. Sci., 3,https://doi.org/10.3389/fenvs.2015.00001, 2015.
Sorí, R., Vázquez, M., Stojanovic, M., Nieto, R., Liberato,M. L. R., and Gimeno, L.: Hydrometeorological droughts inthe Miño–Limia–Sil hydrographic demarcation (northwesternIberian Peninsula): the role of atmospheric drivers, Nat. HazardsEarth Syst. Sci., 20, 1805–1832, https://doi.org/10.5194/nhess-20-1805-2020, 2020.
Spinoni, J., Naumann, G., Vogt, J., and Barbosa, P.: Europeandrought climatologies and trends based on a multi-indicator ap-proach, Global Planet. Change, 127, 50–57, 2015.
Stojanovic, M., Liberato, M. L. R., Sorí, R., Vázquez, M., Phan-Van, T., Duongvan, H., Hoang Cong, T., Nguyen, P. N. B.,Nieto, R., and Gimeno, L.: Trends and Extremes of DroughtEpisodes in Vietnam Sub-Regions during 1980–2017 at DifferentTimescales, Water, 12, 813, https://doi.org/10.3390/w12030813,2020.
Sousa, J. J. and Bastos, L.: Multi-temporal SAR interferometry re-veals acceleration of bridge sinking before collapse, Nat. Haz-ards Earth Syst. Sci., 13, 659–667, https://doi.org/10.5194/nhess-13-659-2013, 2013.
Sousa, P. M., Trigo, R. M., Aizpurua, P., Nieto, R., Gimeno, L.,and Garcia-Herrera, R.: Trends and extremes of drought indicesthroughout the 20th century in the Mediterranean, Nat. HazardsEarth Syst. Sci., 11, 33–51, https://doi.org/10.5194/nhess-11-33-2011, 2011.
Spinoni J., Antofie T., Barbosa P., Bihari Z., Lakatos M., Szalai S.,Szentimrey T., and Vogt J.: An overview of drought events inthe Carpathian Region in 1961–2010, Adv. Sci. Res., 10, 21–32,https://doi.org/10.5194/asr-10-21-2013, 2013.
Tao, H., Borth, H., Fraedrich, K., Suc, B., and Zhub, X.: Droughtand wetness variability in the Tarim River Basin and connec-tion to large-scale atmospheric circulation, Int. J. Climatol., 34,2678–2684, https://doi.org/10.1002/joc.3867, 2015.
Trigo, R. M., Añel, J. A., Barriopedro, D., Garcia-Herrera, R., Gi-meno, L., Nieto, R., Castillo, R., Allen, M. R., and Massey, N.:The record winter drought of 2011–2012 in the Iberian Penin-sula, B. Am. Meteorol. Soc., 94, 41–45, 2013.
Trigo, R. M., Ramos, A. M., Pereira, S. Ramos, Zêzere, J., and Lib-erato, M. L. R.: The deadliest storm of the 20th century strikingPortugal: Flood impacts and atmospheric circulation, J. Hydrol.,541, 597–610, https://doi.org/10.1016/j.jhydrol.2015.10.036,2016.
van der Schrier, G., Briffa, K. R., Jones, P. D., and Osborn, T. J.:Summer moisture variability across Europe, J. Clim., 19, 2818–2834, 2006.
Vergni, L. and Todisco, F.: Spatio-temporal variability ofprecipitation, temperature and agricultural drought in-dices in central Italy, Agric. For. Meteor., 151, 301–313,https://doi.org/10.1016/j.agrformet.2010.11.005, 2011.
Vicente-Serrano, S. M.: Differences in spatial patterns of drought ondifferent time scales: an analysis of the Iberian Peninsula, WaterResour. Manage., 20, 37–60, 2006.
Vicente-Serrano, S. M. and López-Moreno, J. I.: Hydrological re-sponse to different time scales of climatological drought: an eval-uation of the Standardized Precipitation Index in a mountain-ous Mediterranean basin, Hydrol. Earth Syst. Sci., 9, 523–533,https://doi.org/10.5194/hess-9-523-2005, 2005.
Vicente-Serrano, S. M., Cuadrat-Prats J. M., and Romo A.: Earlyprediction of crop production using drought indices at differenttime-scales and remote sensing data: application in the Ebro Val-ley (northeast Spain), Int. J. Remote Sens., 27, 511–518, 2006.
Vicente-Serrano, S. M., Beguería, S., López-Moreno, J. I., An-gulo, M., and El Kenawy, A.: A new global 0.5◦ gridded dataset(1901–2006) of a multiscalar drought index: comparison withcurrent drought index datasets based on the Palmer DroughtSeverity Index, J. Hydrometeorol., 11, 1033–1043, 2010a.
Vicente-Serrano, S. M., Beguería, S., and López-Moreno, J. I.:A Multi-scalar drought index sensitive to global warming: TheStandardized Precipitation Evapotranspiration Index – SPEI, J.Clim., 23, 1696–1718, 2010b.
Vicente-Serrano, S. M., Trigo, R. M., Lopez-Moreno, J. I., Liber-ato, M. L. R., Lorenzo-Lacruz, J., Begueria, S., Moran-Tejeda,E., and El Kenawy, A.: The 2010 extreme winter North At-lantic Oscillation in Iberian precipitation: anomalies, drivingmechanisms and future projections, Clim. Res., 46, 51–65,https://doi.org/10.3354/cr00977, 2011.
Vicente-Serrano, S. M., Beguería, S., Lorenzo-Lacruz, J., Ca-marero, J. J., López-Moreno, J. I., Azorin-Molina, C., Revuelto,J., Morán-Tejeda, E., and Sánchez-Lorenzo A.: Performance ofdrought indices for ecological, agricultural and hydrological ap-plications, Earth Interact., 16, 1–27, 2012.
Vicente-Serrano, S. M., Gouveia, C., Camarero, J. J., Beguería, S.,Trigo, R. M., López-Moreno, J. I., Azorín-Molina, C., Pasho, E.,Lorenzo-Lacruz, J., Revuelto, J., Morán-Tejeda, E., and Sanchez-Lorenzo, A.: Response of vegetation to drought time-scalesacross global land biomes, P. Natl. Acad. Sci. USA, 110, 52–57,https://doi.org/10.1073/pnas.1207068110, 2013.
Vicente-Serrano, S. M., Lopez-Moreno, J. I., Beguería, S., Lorenzo-Lacruz, J., Sanchez-Lorenzo, A., García-Ruiz, J. M., Azorin-Molina, C., Morán-Tejeda, E., Revuelto, J., Trigo, R. M., Coelho,F., and Espejo, F.: Evidence of increasing drought severity caused
https://doi.org/10.5194/esd-12-197-2021 Earth Syst. Dynam., 12, 197–210, 2021
210 M. L. R. Liberato: Rankings of extreme and widespread dry and wet events in the Iberian Peninsula
by temperature rise in southern Europe, Environ. Res. Lett., 9,044001, https://doi.org/10.1088/1748-9326/9/4/044001, 2014.
Vicente-Serrano, S. M., Quiring, S. M., Peña-Gallardo, M., Yuan,S., and Domínguez-Castro, F.: A review of environmentaldroughts: Increased risk under global warming?, Earth-Sci. Rev.,201, 102953, https://doi.org/10.1016/j.earscirev.2019.102953,2020a.
Vicente-Serrano, S. M., Domínguez-Castro, F., Murphy, C., Han-naford, J., Reig, D., Peña-Angulo, F., Tramblay, Y., Trigo, R.M., Mac Donald, N., Luna, M. Y., Mc Carthy, M., Van derSchrier, G., Turco, D., Camuffo, M., Noguera, I., García-Herrera,R., Becherini, F., Della Valle, A., Tomas-Burguera, M., and ElKenawy, A.: Long-term variability and trends in meteorologicaldroughts in Western Europe (1851–2018), Int. J. Climatol., 2020,1–28, https://doi.org/10.1002/joc.6719, 2020b.
Wells, N., Goddard, S., and Hayes, M. J.: A self-calibrating PalmerDrought Severity Index, J. Clim., 17, 2335–2351, 2004.
Wilhite, D. A.: Drought Assessment, Management and Planning:Theory and Case Studies, Kluwer Academic Publishers, NewYork, 293 pp., 1993.
WMO: Drought monitoring and early warning: concepts, progressand future challenges, WMO-No. 1006, 2006, World Meteoro-logical Organization, ISBN 92-63-11006-9, available at: http://www.wamis.org/agm/pubs/brochures/WMO1006e.pdf (last ac-cess: 19 March 2020), 2006.
Wu, H., Svoboda, M. D., Hayes, M. J., Wilhite, D. A., and Wen, F.:Appropriate application of the Standardized Precipitation Indexin arid locations and dry seasons, Int. J. Climatol., 27, 65–79,https://doi.org/10.1002/joc.1371, 2007.
Zêzere, J. L., Trigo, R. M., and Trigo, I. F.: Shallow anddeep landslides induced by rainfall in the Lisbon region(Portugal): assessment of relationships with the North At-lantic Oscillation, Nat. Hazards Earth Syst. Sci., 5, 331–344,https://doi.org/10.5194/nhess-5-331-2005, 2005.
Earth Syst. Dynam., 12, 197–210, 2021 https://doi.org/10.5194/esd-12-197-2021