The sensitivity of TIMSS country rankings in science ...
31
The sensitivity of TIMSS country rankings in science achievement to differences in opportunity to learn at classroom level Stephan Daus * and Johan Braeken Background e recent move by Norway to shift its tested population on the Trends in International Mathematics and Science Study (TIMSS) 2015 from grade 4 to grade 5 and from grade 8 to grade 9 might seem a bit surprising. Since most of the participating countries test their eighth-grade pupils, why does Norway want its tested population to be out-of- grade? Norway justifies this move by noting that the Norwegian first grade corresponds to pre-school in most other countries. is means that, in terms of years of schooling, the Norwegian ninth grade might be more comparable to the TIMSS eighth-grade target population than Norwegian eighth graders would be. Abstract Background: Fair comparisons of educational systems in large-scale assessments can be made only if the differences in curricula have little impact on the outcomes. This study investigated the sensitivity of science achievement rankings to varying degrees of curriculum implementation in the Trends in International Mathematics and Science Study (TIMSS). Methods: Country-specific teacher-reported curriculum implementation profiles across the TIMSS science domains were charted including their within-country variabil- ity across the classrooms for 33 participating countries of TIMSS 2015. A sensitivity test compared the original ranking to TIMSS curriculum implementation scenarios (a least- possible, a most-possible, and more realistic country-specific median implementation). Results: In contrast to expectations, no support was found for a positive relationship between opportunity to learn and science achievement at the between-country level or the within-country level, with only minor exceptions. The sensitivity analysis under different curriculum implementation scenarios also suggests little impact on the rank order of the countries. Conclusions: Plausible explanations for this null finding are addressed; attention and research efforts should focus on improving the quality of curriculum implementation indicators in large-scale assessments. Keywords: Curriculum implementation, Country rankings, TIMSS, Science achievement Open Access © The Author(s) 2018. This article is distributed under the terms of the Creative Commons Attribution 4.0 International License (http://creativecommons.org/licenses/by/4.0/), which permits unrestricted use, distribution, and reproduction in any medium, provided you give appropriate credit to the original author(s) and the source, provide a link to the Creative Commons license, and indicate if changes were made. RESEARCH Daus and Braeken Large-scale Assess Educ (2018) 6:1 https://doi.org/10.1186/s40536-018-0054-1 *Correspondence: [email protected] Centre for Educational Measurement at the University of Oslo (CEMO), Faculty of Educational Sciences, University of Oslo, Blindern, Postboks 1161, 0318 Oslo, Norway
-
Upload
khangminh22 -
Category
Documents
-
view
1 -
download
0
Transcript of The sensitivity of TIMSS country rankings in science ...

The sensitivity of TIMSS country rankings in science achievement to differences in opportunity to learn at classroom levelStephan Daus* and Johan Braeken
BackgroundThe recent move by Norway to shift its tested population on the Trends in International Mathematics and Science Study (TIMSS) 2015 from grade 4 to grade 5 and from grade 8 to grade 9 might seem a bit surprising. Since most of the participating countries test their eighth-grade pupils, why does Norway want its tested population to be out-of-grade? Norway justifies this move by noting that the Norwegian first grade corresponds to pre-school in most other countries. This means that, in terms of years of schooling, the Norwegian ninth grade might be more comparable to the TIMSS eighth-grade target population than Norwegian eighth graders would be.
Abstract
Background: Fair comparisons of educational systems in large-scale assessments can be made only if the differences in curricula have little impact on the outcomes. This study investigated the sensitivity of science achievement rankings to varying degrees of curriculum implementation in the Trends in International Mathematics and Science Study (TIMSS).
Methods: Country-specific teacher-reported curriculum implementation profiles across the TIMSS science domains were charted including their within-country variabil-ity across the classrooms for 33 participating countries of TIMSS 2015. A sensitivity test compared the original ranking to TIMSS curriculum implementation scenarios (a least-possible, a most-possible, and more realistic country-specific median implementation).
Results: In contrast to expectations, no support was found for a positive relationship between opportunity to learn and science achievement at the between-country level or the within-country level, with only minor exceptions. The sensitivity analysis under different curriculum implementation scenarios also suggests little impact on the rank order of the countries.
Conclusions: Plausible explanations for this null finding are addressed; attention and research efforts should focus on improving the quality of curriculum implementation indicators in large-scale assessments.
Keywords: Curriculum implementation, Country rankings, TIMSS, Science achievement
Open Access
© The Author(s) 2018. This article is distributed under the terms of the Creative Commons Attribution 4.0 International License (http://creat iveco mmons .org/licen ses/by/4.0/), which permits unrestricted use, distribution, and reproduction in any medium, provided you give appropriate credit to the original author(s) and the source, provide a link to the Creative Commons license, and indicate if changes were made.
RESEARCH
Daus and Braeken Large-scale Assess Educ (2018) 6:1 https://doi.org/10.1186/s40536-018-0054-1
*Correspondence: [email protected] Centre for Educational Measurement at the University of Oslo (CEMO), Faculty of Educational Sciences, University of Oslo, Blindern, Postboks 1161, 0318 Oslo, Norway

Page 2 of 31Daus and Braeken Large-scale Assess Educ (2018) 6:1
As the international association for the evaluation of educational achievement (IEA) originally intended to use the world as a big educational laboratory (Husén 1973, as cited in Comber and Keeves 1973), its large-scale assessments were deeply rooted in a need for comparisons on equal and fair terms. Researchers and policy-makers have adhered to this principle when using international large-scale assessments such as the IEA’s TIMSS to compare educational systems. Hence, the assessment framework in TIMSS is centered around a shared curriculum across the participating countries (Mullis 2013). From this perspective, curriculum implementation, focus, and sequencing would be crucial for valid and contextualized interpretations of correlations between educational inputs and outcomes.
In the late 60s, the IEA established an influential interpretation of curriculum align-ment that considers the intended, implemented, and attained curriculum (Husén and Postlethwaite 1996). Whereupon the intended curriculum is obtained from the national standards, the implemented curriculum is obtained from teachers at the classroom level, and the attained curriculum is obtained from the pupils’ achievement data. Up until the Third International Mathematics and Mathematics Study (1995), a vast amount of information on curriculum alignment was collected. Although less attention has been given to collecting such information in the recent TIMSS cycles, such information is still collected and remains relevant with today’s attention toward country comparisons and rankings. A particular concern within curriculum alignment research is whether the pupils being tested have had opportunities to learn the tested material, which remains a challenge in international educational surveys.
With more than 40 countries participating in TIMSS, it should come as no surprise that most countries deviate from the commonly agreed-upon curriculum-based assess-ment framework. For instance, only half of the participating countries have covered reproduction, heredity and genetics, and human health by grade 8 (Mullis et al. 2016, p. 13). These country-specific deviations are almost guaranteed when there is an attempt to merge the curricula of the participating countries into the framework, while ensuring that the framework’s two-dimensional content-by-cognitive-demand blueprint matrix is filled with enough valid and reliable items (Mullis 2013). This raises the question of to what extent such country-specific opportunity to learn deviations impact the country’s achievement scores and rankings, which are used by educational policy-makers and often reach the news headlines.
Hencke et al. (2009) investigated what would happen to the TIMSS 2003 achievement scores in mathematics when accounting for which items had, and had not, been covered in the respective country’s intended curriculum. The countries’ mathematics achieve-ment scores were recomputed based only on the items listed as covered for a country, and consequently correlated with the original achievement scores. Repeating this pro-cedure for each country’s list of covered items showed that these correlations between the original mathematics scores and the intended-curriculum adjusted mathematic scores were very high. The authors concluded that “even if countries had selected the items covered in their intended curriculums, we would have found no statistically sig-nificant effects across the countries’ international standings” (p. 111). This robustness of the achievement country rankings might not come as a total surprise as most items are developed and assembled after being approved by the participating countries, resulting

Page 3 of 31Daus and Braeken Large-scale Assess Educ (2018) 6:1
in a relatively large common denominator in the item pool. However, some caution should be in place as there are some clear limitations in the curriculum indicator used to operationalize coverage of the item content.
Coarse‑grained intended curriculum information
When Hencke et al. recomputed the country scores, they based their analysis on the intended curriculum information from the TIMSS curriculum matching analysis (TCMA). The TCMA intended curriculum data is completed by each country’s National Research Coordinator for TIMSS who must struggle with coarse-grained curriculum information. For instance, regarding TIMSS 2015, only 9 of 40 countries had a nation-ally-specified intended science curriculum for grade eight, or a grade range that ended in grade eight (see Table 1, the “intended science curriculum grade range” [ICGR] varia-ble), whereas the test was conducted at the end of grade eight (Mullis et al. 2016). More-over, it is important to note that even those countries with a national curriculum exhibit wide variation in the level of prescription, ranging from a very detailed and prescribed curriculum in countries like England, to a much higher level and less detailed national curriculum as in Australia. Consequently, in most of the countries involved, the data on whether the national curriculum covered an item in the period leading up to the assess-ment relied on expert judgement or textbook analyses, generalized to the entire country.
Differences in educational systems
Focusing on life science, Matsubara et al. (2016) compared the fourth-grade intended curriculum of Japan with that of the international average in TIMSS 2011, and related the findings to the relevant percent correct for the items. They then proposed changes to the Japanese science curriculum. This is a reasonable approach in Japan which has a relatively centralized system with statewide-prescribed learning objectives, instruc-tional methods, and materials for science and mathematics, as well as specified learn-ing objectives for each grade (1–2, 3, 4, 5, 6, 7, and 8). Yet, 32 of the 56 participants for fourth grade in TIMSS 2015 reported a lack of statewide-prescribed instructional methods and materials in science (Mullis et al. 2016). In countries where there is more autonomy in the educational system, instructional materials such as textbooks will vary across authors and schools, and not all teachers will implement the intended curriculum to the same extent.
Current study
To supplement the perspective offered by the system-level intended curriculum indica-tor, we propose to move to a class-level implemented curriculum indicator. Opportu-nity to learn as measured at the implementation level has usually included whether the content was taught and how much it was covered, typically in terms of percentage of class time. Some authors have attempted to include cognitive aspects and the quality of instruction as well. However, such expansions of the construct risk crossing into instruc-tional quality (Scheerens 2016, p. 20), in itself a large construct. Although opportunity to learn is intuitively expected to have a relatively strong association with pupil achieve-ment, studies have not investigated how sensitive country-level scores and rankings are to differences in this classroom-level opportunity to learn indicator.

Page 4 of 31Daus and Braeken Large-scale Assess Educ (2018) 6:1
The purpose of this paper is thus to investigate how sensitive the country achievement scores and rankings are to opportunity to learn differences at the classroom level. We chose the science component of TIMSS 2015 as a case study. There are generally many
Table 1 Country-specific information for TIMSS 2015 participants
Sample sizes for schools, classes, teachers and students, average age (Mage), and the intended science curriculum grade range (ICGR). Countries below the line are excluded from further reporting because the amount of missing curriculum implementation data exceeds 50%. Intended curriculum grade range is retrieved from Mullis et al. (2016)
Country (grade) ISO Nschool Nclass Nteacher Nstudent Mage ICGR
United Arab Emirates ARE 477 763 580 18,012 13.9 6–9
Australia AUS 285 645 998 10338 14.0 7–10
Bahrain BHR 105 197 166 4918 13.9 7–9
Botswana (9) BWA 159 169 165 5964 15.6 8–10
Canada CAN 276 409 395 8757 14.0 Varies
Chile CHL 171 173 171 4849 14.3 7–8
Egypt EGY 211 215 213 7822 14.1
England ENG 143 213 606 4814 14.1 6–8
Hong Kong SAR HKG 133 145 144 4155 14.3 7–9
Ireland IRL 149 204 418 4704 14.4 7–9
Iran, Islamic Rep. of IRN 250 251 250 6130 14.1 7–9
Israel ISR 198 198 282 5463 14.0 7–9
Italy ITA 161 230 228 4481 13.8 6–8
Jordan JOR 252 260 254 7865 13.8 1–10
Japan JPN 147 147 147 4745 14.5 7, 8
Korea, Rep. of KOR 150 170 167 5309 14.4 7–9
Kuwait KWT 168 191 191 4503 13.8 6–9
Lebanon LBN 138 185 182 3873 14.2 7–9
Malta MLT 48 223 226 3817 13.8 7–11
Malaysia MYS 207 326 294 9726 14.3 7–9
Norway (8) NO8 142 216 207 4795 13.7 5–7, 8–10
Norway (9) NOR 143 215 205 4675 14.7 5–7, 8–10
New Zealand NZL 145 377 333 8142 14.1 7–9
Oman OMN 301 356 347 8883 13.9 5–10
Qatar QAT 131 238 222 5403 14.0 7–9
Saudi Arabia SAU 143 149 149 3759 14.1 7–9
Singapore SGP 167 334 320 6116 14.4 7, 8
Sweden SWE 150 206 221 4090 14.8 7–9
Thailand THA 204 213 205 6482 14.4 7–9
Turkey TUR 218 220 218 6079 13.9 6–8
Chinese Taipei TWN 190 191 201 5711 14.3 7–9
United States USA 246 534 396 10,221 14.2 Varies
South Africa (9) ZAF 292 328 319 12,514 15.7 7–9
Excluded countries
Georgia GEO 153 187 171 4035 13.8 7–9
Hungary HUN 144 241 171 4893 14.7 7–8
Kazakhstan KAZ 172 239 206 4887 14.3 5–9
Lithuania LTU 208 252 221 4347 14.6 7–8
Morocco MAR 345 375 365 13,035 14.5 7, 8, 9
Russian Federation RUS 204 221 209 4780 14.8 5–9
Slovenia SVN 148 217 162 4257 13.9 6–7, 8–9

Page 5 of 31Daus and Braeken Large-scale Assess Educ (2018) 6:1
more studies involving mathematics (or language) as outcome (Scheerens 2016), some of which have found a significant relationship between the implemented curriculum and achievement within and between many countries in the mathematics data of TIMSS 1995, 2011 and 2015 (e.g. Luyten 2016; Schmidt et al. 2001, 2015). The lack of studies in science suggests that science might be a less well-behaved subject to investigate. Fur-thermore, whereas curriculum topics in mathematics can be considered relatively “uni-versal”, certain curriculum topics in science might be taught or omitted conditional on the available natural resources, topography, or climate in a specific country. We begin by charting the country-specific opportunity to learn profiles across the TIMSS 2015 sci-ence domains and their variability across the classrooms. We then investigate, between and within countries, how achievement and opportunity to learn relate. Finally, we con-duct a sensitivity test to verify the robustness of TIMSS science country rankings when considering different opportunity to learn profiles.
MethodsSample
The TIMSS 2015 science data for grade 8 (or equivalent) were analyzed, excluding benchmarking educational systems and countries with more than 50% missing values on the curriculum information predictor variable for the overall subject and the con-tent domains. Many missing responses could be due to the teachers in that country not being presented with the questions, as was the case with the Russian Federation and Kazakhstan. Thus, 33 out of 40 countries were included. Table 1 shows the coun-try ISO-alpha codes used in subsequent tables and figures, the sample sizes of schools, teachers, classes, and pupils across countries, whether it is included in the analysis, and the intended science curriculum grade range (ICGR). In the TIMSS sampling design, schools were randomly sampled, and entire classes with teachers were sampled within these.
Measures
The TIMSS science assessment framework’s two-dimensional blueprint consists of a cognitive dimension that includes knowing, applying, and reasoning; and a content dimension that includes biology, chemistry, earth science, and physics. The latter four content domains are further divided into a total of 18 topics (e.g., Ecosystems, Light and Sound, or Chemical Change).
Opportunity to learn in the classroom was operationalized through a TIMSS imple-mented curriculum score (TICS). TIMSS contains teacher responses on which of the 18 science topics the class has covered earlier than the present year, during the present year, or not yet or just introduced. The teacher responses to whether and when each of the topics was taught were dummy coded into 1 (taught this year or taught before this year) and 0 (not yet taught or just introduced). Two topics were surveyed by an indicator pair, and the two indicators were consequently averaged. To treat classes with multiple and single science teachers alike, we identified the maximum value for each topic across the pupil’s teachers. The final measure (the TICS) was obtained by averaging across top-ics (within a domain, for a domain TICS) for each pupil. The TICS represents a coverage ratio (0–1), where 0 indicates that none of the content topics that the TIMSS items relate
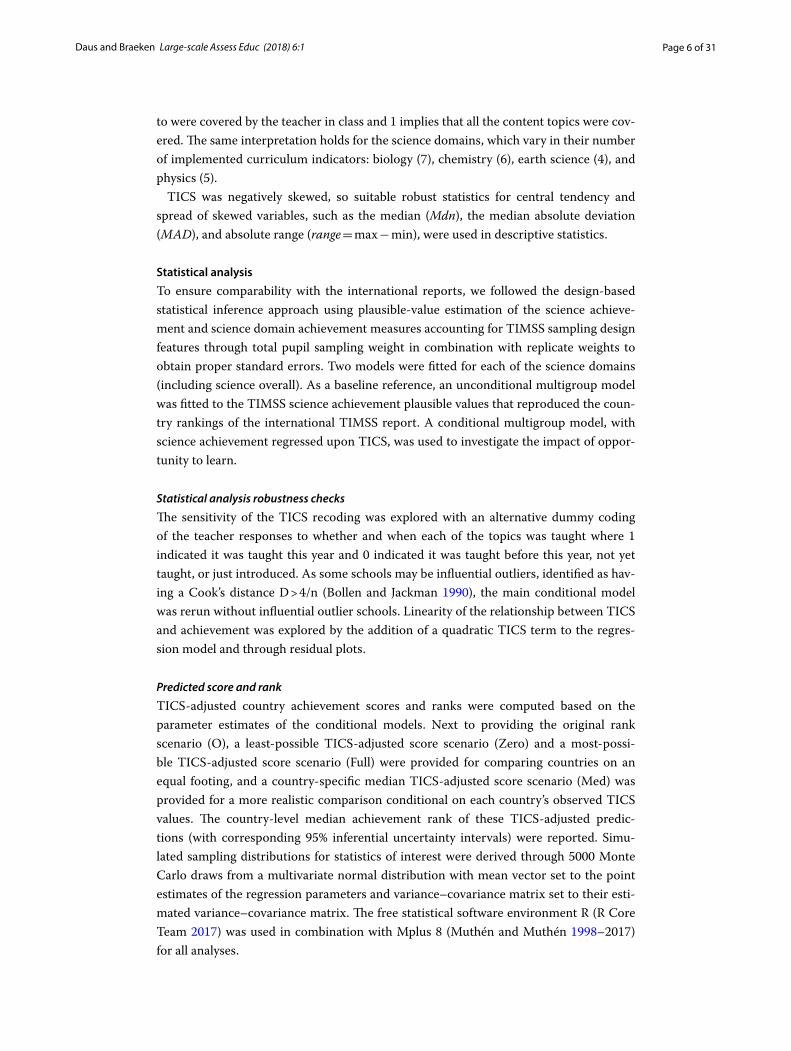
Page 6 of 31Daus and Braeken Large-scale Assess Educ (2018) 6:1
to were covered by the teacher in class and 1 implies that all the content topics were cov-ered. The same interpretation holds for the science domains, which vary in their number of implemented curriculum indicators: biology (7), chemistry (6), earth science (4), and physics (5).
TICS was negatively skewed, so suitable robust statistics for central tendency and spread of skewed variables, such as the median (Mdn), the median absolute deviation (MAD), and absolute range (range = max − min), were used in descriptive statistics.
Statistical analysis
To ensure comparability with the international reports, we followed the design-based statistical inference approach using plausible-value estimation of the science achieve-ment and science domain achievement measures accounting for TIMSS sampling design features through total pupil sampling weight in combination with replicate weights to obtain proper standard errors. Two models were fitted for each of the science domains (including science overall). As a baseline reference, an unconditional multigroup model was fitted to the TIMSS science achievement plausible values that reproduced the coun-try rankings of the international TIMSS report. A conditional multigroup model, with science achievement regressed upon TICS, was used to investigate the impact of oppor-tunity to learn.
Statistical analysis robustness checks
The sensitivity of the TICS recoding was explored with an alternative dummy coding of the teacher responses to whether and when each of the topics was taught where 1 indicated it was taught this year and 0 indicated it was taught before this year, not yet taught, or just introduced. As some schools may be influential outliers, identified as hav-ing a Cook’s distance D > 4/n (Bollen and Jackman 1990), the main conditional model was rerun without influential outlier schools. Linearity of the relationship between TICS and achievement was explored by the addition of a quadratic TICS term to the regres-sion model and through residual plots.
Predicted score and rank
TICS-adjusted country achievement scores and ranks were computed based on the parameter estimates of the conditional models. Next to providing the original rank scenario (O), a least-possible TICS-adjusted score scenario (Zero) and a most-possi-ble TICS-adjusted score scenario (Full) were provided for comparing countries on an equal footing, and a country-specific median TICS-adjusted score scenario (Med) was provided for a more realistic comparison conditional on each country’s observed TICS values. The country-level median achievement rank of these TICS-adjusted predic-tions (with corresponding 95% inferential uncertainty intervals) were reported. Simu-lated sampling distributions for statistics of interest were derived through 5000 Monte Carlo draws from a multivariate normal distribution with mean vector set to the point estimates of the regression parameters and variance–covariance matrix set to their esti-mated variance–covariance matrix. The free statistical software environment R (R Core Team 2017) was used in combination with Mplus 8 (Muthén and Muthén 1998–2017) for all analyses.

Page 7 of 31Daus and Braeken Large-scale Assess Educ (2018) 6:1
ResultsImplemented curriculum profiles
First, we explore the extent to which teachers of the participating countries report dif-ferent degrees of implemented TIMSS 2015 science curriculum. For this purpose, we analyzed the distribution of TICSs for overall science and for each of the four science domains across countries (see Table 1 and Fig. 1).
Overall science implementation
Consistent with the consensus-seeking curriculum foundation of the TIMSS item design, the TICS is generally high for most countries (median of country medians = .73), with
Fig. 1 Distribution of TICSs across schools for each science domain. The curriculum implementation score ranges from 0 (no implementation of the topics) to 1 (implementation of all the topics)

Page 8 of 31Daus and Braeken Large-scale Assess Educ (2018) 6:1
50% of the countries being within .11 absolute distance from this value (i.e., TICS = [.62, .84]). There are two notable exceptions with median TICS below .50: New Zealand and Norway’s grade 8. The previously mentioned move by Norway to shift its tested TIMSS population by one school grade upwards can be seen in the light of its low TICS for grade 8 (Mdn = .41) compared with grade 9 (Mdn = .64). The signs of a centralized edu-cational system in Japan, which were mentioned in the introduction, are also reflected in it having a low spread in TICS (MAD = .05: at least 50% of the classes in Japan have at most 1 topic [1 ≈ .05TICS × 18 topics in total] difference from the median TICS in the country). The largest spread in TICS is in Malta (MAD = .20), which is roughly the equivalent of 3 topics’ difference with the country’s median TICS.
Science domain implementation
The most implemented science domain across the countries was chemistry (Mdn = .83), followed by physics (.80), earth science (.75), and biology (.71). The between-country spread in how much the teachers implemented the TIMSS topics spanned from the more evenly implemented chemistry and physics domains (MAD = .00 and .00, respectively) to biology (MAD = .14) and the most unevenly implemented earth science (MAD = .25). Countries at both ends of the TICS scale could be found in all domains (rangebiology = .57, rangechemistry = .67, rangeearth science = 1.00, rangephysics = .80).
TICS was quite high in biology for most countries, with the notable exception of Nor-way (grade 8) and New Zealand (lowest, with Mdn = .43). TICS was very high in chemis-try, with all countries having median TICS above .50 except for Hong Kong (Mdn = .33). TICS in earth science was characterized by a split between high median in many coun-tries and low median in several countries, namely Hong Kong, Ireland, Israel, Malaysia, New Zealand, Chinese Taipei (Taiwan), and Singapore, all of which had a median below .50. TICS in physics was generally high, with only Norway grade 8 (Mdn = .20) and grade 9 (Mdn = .40) being below .50. Thus, TICS is lower for Norway’s grade 8 than grade 9 in overall science and all domains, and its grade 8 is lower than most other participating countries. These findings support the claim that the Norwegian eighth school year is not comparable with other countries’ eighth school year in terms of curriculum coverage, whereas Norway’s grade 9 is more comparable.
Although countries that show high overall implementation will logically also have high implementation across all four science domains, there are some distinct deviations from the overall pattern. The earth science topics are, for instance, not taught by the responding teachers before grade 9 in Taiwan (Chinese Taipei; Mdn = .00, MAD = .00), even though the intended curriculum information from the TIMSS curriculum match-ing analysis (TCMA) indicates complete coverage of all items there. The low implemen-tation of earth science topics in Singapore and Hong Kong is due to earth science being taught in other subjects and not by the science teachers (Mullis et al. 2016).
Within-country TICS profiles at school level The boxplots in Fig. 1 that represent spread in implemented curriculum scores for each domain are a good reflection of the country-level curriculum implementation profile. Yet, one might wonder whether they hide different within-country TICS profiles at school level. Schools within some countries might vary in the extent to which they implement the content domains. For instance, some schools might invest heavily in biology, whereas other schools might seek

Page 9 of 31Daus and Braeken Large-scale Assess Educ (2018) 6:1
a balance across domains. Moreover, in countries with federal structures, schools in dif-ferent states or provinces might follow different science curricula. Similarly, in countries with selective lower-secondary education, schools of different types and intake require-ments likely follow different science curricula. Each line of the spaghetti plot in Fig. 2 depicts a school, and the plot shows how much a school has implemented a domain. On the one hand, in Chinese Taipei (Taiwan) and Singapore, most schools vary greatly across science domains in the degree of TICS. On the other hand, in the United States and Jordan, most schools implement the same amount across all domains, as seen by the flat lines profile.
Fig. 2 Spaghetti plots of the between-domain TICS patterns across schools, where each gray line represents a school and the dark blue line represents the country median

Page 10 of 31Daus and Braeken Large-scale Assess Educ (2018) 6:1
However, these flat lines are also parallel, indicating that this heterogeneity across domains is very similar across schools. For instance, the implementation of domains seems parallel for most schools in the United Arab Emirates, England, and Japan, with only differences in the TICS ‘intercepts’ of the patterns (i.e., level of implemented cur-riculum scores). This implies that some schools generally implement more than other schools across all the domains. In contrast, in countries such as Singapore and Chinese Taipei (Taiwan), school-level profiles are less parallel and compared to the country’s average profile, many schools tend to implement more of some topic at the cost of other topics.
The country-level analysis of the teacher-reported implementation of TIMSS topics confirm that, although the implemented curriculum score is relatively high overall, there are noticeable differences in TICSs between the participating countries in TIMSS and between schools within a country. The next logical question to then ask is to what extent these differences impact the countries’ science achievement scores and rankings.
TIMSS implemented curriculum score (TICS) and achievement score
Logic dictates that we can expect the relationship between degree of TICS and achieve-ment to be positive: Countries whose curriculum is aligned with TIMSS and that gen-erally focus on width and depth of science education are expected to perform well (i.e., between-country regression effect of TICS on achievement: bTICS
(between) > 0). Simi-larly, students in schools that have high implementation of the TIMSS curriculum are expected to perform well (i.e., within-country regression effect of TICS on achievement: bTICS
(within) > 0 for all countries).Regardless of the outcome with respect to the relation between TICS and achieve-
ment, we investigated the sensitivity of the science achievement country rankings to differences in TICS. Five rankings were compiled, beginning with the original interna-tional TIMSS science achievement ranking, the ranking based on the predicted coun-try TIMSS science achievement score if all schools within the country had a TICS score equal to 1 (i.e., full coverage), and the ranking based on the predicted country TIMSS science achievement score if all schools within the country had a TICS score equal to the median reported TICS in that country. The two other rankings were predictions based on the TICS score equal to the within-country minimum and maximum reported TICS score, respectively. The latter two rankings would reflect the relative comparative performance of countries at their lowest and highest level of implemented curriculum, whereas the median-based ranking can be regarded as a more realistic TICS-adjusted ranking and the theoretical maximum TICS-adjusted ranking offers an absolute com-parison at a utopian equal footing.
Between‑country
The four panels in Fig. 3a–d depict the between-country relationships for overall sci-ence between the central tendency and spread of TICS and achievement. A simple linear fit line is overlaid with 95% confidence intervals (white line on gray area). For instance, Norway’s grade 8 pupils (NO8) have a low median implementation of the TIMSS con-tent that, combined with a mid-ranged average achievement score, makes them stand out on the left side in Fig. 3a. Norway’s grade 9 pupils (NOR) have a somewhat higher

Page 11 of 31Daus and Braeken Large-scale Assess Educ (2018) 6:1
level of TIMSS content implementation and a higher average achievement score, which hints at a positive link between TICS and achievement. Yet, counter to our expectations, the regression of country-level median TICS on mean achievement shows a significant negative slope, bTICS
(between) = −184 [− 342, − 25] (R2 = .153). A plausible explanation of this pattern is that quite a few of the lower-performing countries have relatively young edu-cational systems with (reformed) curricula being influenced by or in line with the inter-national educational assessments (i.e., higher TICS), whereas the higher-performing
Fig. 3 a–d Scatterplots of between-country relationships between central tendency (mean achievement and median TICS) and spread (standard deviation of achievement and median absolute deviation of TICS). The white line is the best simple linear fit line, and the gray band is its 95% confidence interval (bootstrapped from 10,000 draws). As there was little between-country variation in median absolute deviation (MAD) of TICS, the x-axis values in b and d were slightly jittered to increase visibility of points. The blue arrow indicates the shift from Norway grade 8 to grade 9

Page 12 of 31Daus and Braeken Large-scale Assess Educ (2018) 6:1
countries typically have more established educational systems with their own historical traditions and less tight formal connection to the international educational assessments.
The observation that countries having implemented more of the TIMSS content have more educational outcome inequality (see Fig. 3c) might lend further support for such an interpretation. Notice that, more in line with expectations, countries with more between-school differences in TIMSS content implementation tend to also have more between-school differences in school average achievement (see Fig. 3d). Yet, most coun-tries have rather similar degrees of within-country variation in TIMSS content imple-mentation, with the countries with the least spread (Bahrain) and the most spread (Malta) in TICS both having a rather average score on science achievement (see Fig. 3b).
Within‑country
The forest plot in Fig. 4 displays for each country the 95% confidence interval around bTICS(within), their within-country regression effect of TICS on science achievement. The bTICS(within) indicates the expected difference in science achievement points between a school whose teachers have reported full implementation of the TIMSS content (i.e., all 18 TIMSS topics were taught) and a school whose teachers have reported zero imple-mentation of the TIMSS content (i.e., none of the 18 TIMSS topics were taught). For instance, the expected science achievement score in Norway for grade 8 pupils with full opportunity to learn the TIMSS content would be 16 [− 20, 51] points higher than pupils with no opportunity to learn the content; however, the change is not significantly dif-ferent from zero as its gray confidence interval overlaps with the dashed line. A simi-lar pattern occurs for Norway’s grade 9 and most other countries, with wide confidence intervals around small point estimates for bTICS(within) reflecting the large uncertainty around these findings. Hence, counter to our expectations, a null finding is observed for the within-country relation between TICS and achievement.
There are some exceptions (where orange confidence intervals with triangles do not overlap with zero). Higher implementation of the TIMSS content is associated with higher achievement in Qatar (bTICS
(QAT) = 153 [50, 255], R2 = .05), Turkey (bTICS(TUR) = 120 [6,
233], R2 = .02), Singapore (bTICS(SGP) = 78 [11, 145], R2 = .03), and Malta (bTICS
(MLT) = 22 [3, 40], R2 = .01). However, even in these countries, TIMSS content implementation explains at best a tiny part of the within-country variation in achievement.1
Sensitivity
For the sensitivity analysis, the predicted achievement for one zero TICS (Zero) and one full TICS (Full) scenario allows for absolute comparison across countries, whereas the one country-specific median TICS (Med) scenario allows for a realistic relative compari-son. These scenarios were compared with the original scenario (O). Figure 5 illustrates the expected country ranks under these five scenarios, where a rank of 1 corresponds to the highest achievement score across all countries under the given condition. For exam-ple, Norway’s original rank (O) among the included countries in this study is 17 for its grade 8 and 13 for its grade 9. Irrespective of whether for all countries the schools have
1 The general null findings results remain stable during the statistical analysis robustness checks.

Page 13 of 31Daus and Braeken Large-scale Assess Educ (2018) 6:1
the least possible (Zero), the most possible (Full), or each country’s median (Med) level of TIMSS topics implementation, the ranks are quite stable. We do observe that compar-ing countries at the least possible TICS level increases the width of the confidence inter-vals and the uncertainty surrounding the ranking for all countries.
Stability across science domains
The forest plots for the science domains (see Appendix) also did not indicate much support for a relationship between the degree of TIMSS content implementation and achievement. Similarly, the ranks remained stable across the scenarios for each domain,
Fig. 4 Forest plot of the slope estimate with 95% CI for TICS on achievement by country. In Qatar, there is an expected difference of 153 achievement score points between a school with zero implementation of the TIMSS science topics and a school with full implementation of the TIMSS science topics

Page 14 of 31Daus and Braeken Large-scale Assess Educ (2018) 6:1
with only changes in the Zero TICS scenario (drop in rank for Qatar in biology and for Singapore in chemistry; see Appendix).
DiscussionTICS country profiles
This study partially supports Norway’s decision to shift its target population one school year up. The analysis of the TICS revealed that the Norwegian grade 8 pupils have experienced less opportunity to learn the science content that is tested in TIMSS across all science domains, as compared with pupils in their grade 9 and compared with
Fig. 5 Predicted rank across TICS scenarios. O = original unadjusted model; Med, Zero, and Full = all schools have implemented the country-specific median, the least possible, or most possible level of TICS within the country, respectively

Page 15 of 31Daus and Braeken Large-scale Assess Educ (2018) 6:1
pupils in most other participating countries. Yet, the analysis also revealed that New Zealand’s eighth graders have an equally low TICS level as those in Norway across all domains. New Zealand’s pupil sample is tested at the age (Mage = 14.1) and grade (8.5–9.5) between Norway’s grade 8 and grade 9 (see Table 1), and its achievement score is at the level of Norway’s grade 9. This raises a question of whether New Zealand and other countries with low implementation relative to other participating countries can or should make the same shift. Should more countries join the out-of-grade group of countries in TIMSS, then country comparisons might become even more challenging as the TIMSS participants could possibly lack both a common formal grade and a com-mon age link. Furthermore, analyses have yet to clarify whether such changes matter for achievement based on the differences in degree of implementation of TIMSS content across countries.
Between‑country pattern
Despite the finding of an increase in country average achievement and TICS level between Norwegian pupils in grade 8 and grade 9, there was generally no evidence of a positive between-country relationship between implementation and achievement. Instead, the relationship seemed negative: Countries with higher degrees of TIMSS content implementation tended to have lower average achievement scores. The plau-sible explanation raised for this pattern was that quite a few of the lower-performing countries have relatively young educational systems with (reformed) curricula being more influenced by or in line with the international educational assessments, whereas the higher-performing countries typically have more established educational systems with their own historical traditions and less tight formal connection to the international educational assessments (as noted previously). Hence, the between-country relationship might be driven by different factors than what goes on within countries.
Within‑country pattern
There was basically a lack of evidence of the within-country relationship between science achievement and TICS, with only minor exceptions. Hence, the support of Norway’s decision to move is limited because the within-country relationship between achieve-ment and implementation of TIMSS curriculum is weak across domains, making it generally difficult for countries to expect higher average achievement score with higher implementation of the TIMSS curriculum. Yet, a glance at the Norwegian data suggests that a large increase does occur in both average achievement score and median TICS between the eighth grade and the ninth grade. This suggests that there is more variation in TIMSS curriculum implementation scores across grades than across schools within a grade. However, the large increase in average achievement between cohorts might be explained by increased age, maturity, or familiarity with formal science assessments.
Sensitivity analysis
The sensitivity analysis indicated that the science achievement ranks were very stable across hypothetical scenarios compared with the original rank. In these scenarios, all schools in each country have implemented the same level of the TIMSS content, based on either the country-specific median or the least possible or most possible level of

Page 16 of 31Daus and Braeken Large-scale Assess Educ (2018) 6:1
TIMSS content implementation. This stability across scenarios is counter-intuitive, as one would expect most countries to drop or climb in ranks if all schools in all partici-pating countries implemented the same level as the least or most possible TIMSS con-tent implementation. Albeit counter-intuitive, the findings are supported by previous research that indicates that opportunity to learn might not matter much. Scheerens has noted how the empirical evidence of the effect of opportunity to learn is often weaker than first thought (Scheerens 2016). In Scheerens and Bosker’s meta-analyses of vari-ous experimental and non-experimental studies on instructional factors (Scheerens and Bosker 1997), only “small to negligible effects” on achievement were found for opportu-nity to learn. The lack of evidence seems particularly apparent in analyses of large-scale assessment data. The previously discussed study by Hencke et al. on the sensitivity of mathematics achievement scores and ranks in TIMSS 2003, using the TCMA informa-tion on each item’s coverage in a country, showed stability in achievement scores and ranks across countries. Hence, neither the use of intended curriculum information nor implemented curriculum information from TIMSS seems to explain much of the varia-tion in achievement.
Plausible explanations
The lack of evidence for a link between opportunity to learn and achievement could be due to one or more plausible factors. A third-variable explanation is possible, but the issue of operationalization of opportunity to learn and the validity of chosen indicators is the crucial one in our opinion.
Conditional opportunity to learn effects
First, although there was a lack of evidence for a marginal relationship between TICS and achievement, this might change depending on relevant contextual factors. For instance, the effect of opportunity to learn might be conditional on socio-economic status: Pupils from families of low socio-economic status might be more dependent on opportunity to learn at school, whereas pupils from families of higher socio-economic status have resources to counter poor teachers and insufficient coverage of topics. Previ-ous research has suggested a link between immigrant status and lower opportunity to learn the core curriculum (Wang and Goldschmidt 1999), and between socio-economic status, student-level acquaintance with content topics, and mathematics achievement in PISA (Schmidt et al. 2015). Future research could explore the link between opportunity to learn the TIMSS science content, indicators of socio-economic status, and science achievement.
Opportunity to learn indicators
This study initially raised issues with the use of the TCMA data on intended curriculum. The TCMA data, albeit precise on the content side of the test (i.e. the items), suffer from imprecise national curriculum goals and are too general for the nuances in implementa-tion across teachers. The current study benefits from greater precision on the teacher side, without too great loss of precision on the content side (i.e. topics). However, the information on implemented curriculum is still dependent upon the exact survey ques-tions and the interpretation of these questions by the teacher.

Page 17 of 31Daus and Braeken Large-scale Assess Educ (2018) 6:1
TIMSS surveys only the science and math teachers of the sampled classes. However, in some countries, certain science topics in TIMSS are covered by teachers that are not surveyed. For instance, some earth science topics are covered in the geography subject instead of the general science class in Norway, Taiwan, and England. This means that there might be gaps in the implemented curriculum information for some countries.
The response categories for curriculum implementation use coarse categories (taught earlier, taught this year, not yet taught) and lack nuance in qualitative degree and time of content implementation. Varying standards can influence when a topic is considered taught this year: Teacher A can argue that the topic was briefly mentioned in class and decide to respond the topic was “taught this year”, but teacher B might give the same response only if there was a whole month spent on the topic. Another factor is the level of detail in the teaching of the topic. For example, the cells topic could be taught at a very superficial level (e.g., only a plant cell) or at a more detailed level (e.g., multiple cell types and cell organelles). Different teachers are likely to have different opinions on whether they have “implemented” a topic or not depending on the level of detail with which they have covered it in lessons. What does it mean to have “implemented a topic” in a class across the different participating countries?
Furthermore, a science topic might cover a broad range of science curriculum content that does not necessarily relate to a recognizable content grouping within the teachers’ own training and teaching practice. Has a TIMSS topic such as “electricity and magnet-ism” been treated as a single didactical topic in the classroom? Aggregating these topics across domains might further obscure their intended connection to classroom practice. As research has already indicated that performance on topics within a TIMSS domain is heterogeneous (Daus et al. under review), a differential opportunity to learn perspective across more specific content groups might be more fruitful than seeking global effects at the aggregated domain level.
Our suspicion that the indicators for opportunity to learn in TIMSS indicators are to blame for our general lack of evidence might seem odd given the success of Schmidt et al. (2001) in finding a relationship between opportunity to learn and achievement using the TIMSS 1995 data. However, their findings were much weaker for science than mathematics, and the difference between our findings and those of Schmidt et al. might be related to the much richer and more diverse implemented curriculum indi-cators available in TIMSS 1995. In TIMSS 1995, intended curriculum information was collected on textbooks and curriculum guides with topic trace mapping of the TIMSS framework content topics across curriculum grades as well as document coding of cur-riculum documents using the TIMSS framework. Implemented curriculum informa-tion was collected from adjacent grades on more than 20 mathematics topics and more than 20 science topics regarding whether it was taught, how much it had been taught the last year, whether it was the subject of the last lesson, and for some topics whether four example items from the topic were appropriate for the class. However, TIMSS is under continuous development and has reduced the extent of the implemented curricu-lum information collection since 1995. This might be problematic because, in contrast to the intention of a “real-life literacy skills” framework in the PISA study, TIMSS is largely based on the common curriculum of the participating countries. Hence, analyses of the TIMSS data should include the implemented curriculum. Moreover, despite the lack of

Page 18 of 31Daus and Braeken Large-scale Assess Educ (2018) 6:1
evidence for a relationship between TICS and achievement in this study, and the poten-tial issues with the implemented curriculum indicators, the value of these indicators come also from their capacity to document changes in curriculum across time within countries and differences in curriculum between countries. Therefore, we would suggest revaluing these implemented curriculum indicators in TIMSS by continuing to improve their quality and scope.
ConclusionAttention to opportunity to learn is important for fair comparisons of educational sys-tems. At first sight of the results in this study, one might thus be inclined to appreciate that TIMSS achievement seems insensitive to differences in opportunity to learn within countries, based on current indicators. Yet, learning clearly occurs across a child’s devel-opment, so why is it so difficult to empirically connect the most obvious conceptual relationship (i.e., opportunity to learn and achievement) using data from the interna-tional educational assessments? Progress in research on the effects of curriculum imple-mentation can be gained only if more attention is placed on validity and precision of the measures. One place to start the debugging is deeper scrutiny of the indicators and instruments for opportunity to learn in TIMSS.
AbbreviationsTIMSS: Trends in International Mathematics and Science Study; TICS: TIMSS implemented curriculum score; TCMA: TIMSS curriculum matching analysis; ICGR : intended curriculum grade range; Mdn: median; MAD: median absolute deviation.
Authors’ contributionsSD analysis and writing. JB conceptualization and writing. Both authors read and approved the final manuscript.
AcknowledgementsThe authors are grateful for feedback on an early draft from Dr Trude Nilsen, Department of Teacher Education and School Research, University of Oslo.
Competing interestsWe have read and understood Large-scale Assessments in Education’s policy on declaration of interests and declare that we have no competing interests.
Availability of data and materialsThe TIMSS datasets supporting the conclusions of this article are available in the TIMSS & PIRLS repository (http://timss andpi rls.bc.edu/). Additional materials are available in https ://osf.io/4qbya /.
Ethics approval and consent to participateNot applicable.
FundingNot applicable.
AppendixThe following plots are the corresponding plots from the main text for each of the sci-ence domains biology, chemistry, earth science, and physics.
See Figs. 6, 7, 8, 9, 10, 11, 12, 13, 14, 15, 16 and 17.

Page 19 of 31Daus and Braeken Large-scale Assess Educ (2018) 6:1
Fig. 6 a–d Scatterplots of between-country relationships in biology between central tendency (mean achievement and median TICS) and spread (standard deviation of achievement and median absolute deviation of TICS). The white line is the best simple linear fit line, and the gray band is its 95% confidence interval (bootstrapped from 10,000 draws). As there was little between-country variation in median absolute deviation (MAD) of TICS, the x-axis values in b and d were slightly jittered to increase visibility of points. The blue arrow indicates the shift from Norway grade 8 to grade 9

Page 20 of 31Daus and Braeken Large-scale Assess Educ (2018) 6:1
Fig. 7 a–d Scatterplots of between-country relationships in chemistry between central tendency (mean achievement and median TICS) and spread (standard deviation of achievement and median absolute deviation of TICS). The white line is the best simple linear fit line, and the gray band is its 95% confidence interval (bootstrapped from 10,000 draws). As there was little between-country variation in median absolute deviation (MAD) of TICS, the x-axis values in b and d were slightly jittered to increase visibility of points. The blue arrow indicates the shift from Norway grade 8 to grade 9

Page 21 of 31Daus and Braeken Large-scale Assess Educ (2018) 6:1
Fig. 8 a–d Scatterplots of between-country relationships in earth science between central tendency (mean achievement and median TICS) and spread (standard deviation of achievement and median absolute deviation of TICS). The white line is the best simple linear fit line, and the gray band is its 95% confidence interval (bootstrapped from 10,000 draws). As there was little between-country variation in median absolute deviation (MAD) of TICS, the x-axis values in b and d were slightly jittered to increase visibility of points. The blue arrow indicates the shift from Norway grade 8 to grade 9

Page 22 of 31Daus and Braeken Large-scale Assess Educ (2018) 6:1
Fig. 9 a–d Scatterplots of between-country relationships in physics between central tendency (mean achievement and median TICS) and spread (standard deviation of achievement and median absolute deviation of TICS). The white line is the best simple linear fit line, and the gray band is its 95% confidence interval (bootstrapped from 10,000 draws). As there was little between-country variation in median absolute deviation (MAD) of TICS, the x-axis values in b and d were slightly jittered to increase visibility of points. The blue arrow indicates the shift from Norway grade 8 to grade 9

Page 23 of 31Daus and Braeken Large-scale Assess Educ (2018) 6:1
Fig. 10 Forest plot of the slope estimate in biology with 95% CI for TICS on achievement by country

Page 24 of 31Daus and Braeken Large-scale Assess Educ (2018) 6:1
Fig. 11 Forest plot of the slope estimate in chemistry with 95% CI for TICS on achievement by country

Page 25 of 31Daus and Braeken Large-scale Assess Educ (2018) 6:1
Fig. 12 Forest plot of the slope estimate in earth science with 95% CI for TICS on achievement by country

Page 26 of 31Daus and Braeken Large-scale Assess Educ (2018) 6:1
Fig. 13 Forest plot of the slope estimate in physics with 95% CI for TICS on achievement by country

Page 27 of 31Daus and Braeken Large-scale Assess Educ (2018) 6:1
Fig. 14 Predicted rank in biology across TICS scenarios. O = original unadjusted model; Med, Zero, and Full = all schools have implemented the country-specific median, the least possible, or most possible level of TICS within the country, respectively. A blue confidence interval with a downward arrow indicates a significantly lower rank than the original scenario (e.g. Qatar for zero TICS scenario in biology)

Page 28 of 31Daus and Braeken Large-scale Assess Educ (2018) 6:1
Fig. 15 Predicted rank in chemistry across TICS scenarios. O = original unadjusted model; Med, Zero, and Full = all schools have implemented the country-specific median, the least possible, or most possible level of TICS within the country, respectively. A blue confidence interval with a downward arrow indicates a significantly lower rank than the original scenario (e.g. Qatar for zero TICS scenario in biology)

Page 29 of 31Daus and Braeken Large-scale Assess Educ (2018) 6:1
Fig. 16 Predicted rank in earth science across TICS scenarios. O = original unadjusted model; Med, Zero, and Full = all schools have implemented the country-specific median, the least possible, or most possible level of TICS within the country, respectively. A blue confidence interval with a downward arrow indicates a significantly lower rank than the original scenario (e.g. Qatar for zero TICS scenario in biology)

Page 30 of 31Daus and Braeken Large-scale Assess Educ (2018) 6:1
Publisher’s NoteSpringer Nature remains neutral with regard to jurisdictional claims in published maps and institutional affiliations.
Received: 13 November 2017 Accepted: 12 March 2018
ReferencesBollen, K., & Jackman, R. (1990). Regression diagnostics: An expository treatment of outliers and influential cases. In J. Fox
& J. Long (Eds.), Modern methods of data analysis (pp. 257–291). Newbury Park: Sage.Comber, L. C., & Keeves, J. P. (1973). Science education in nineteen countries; an empirical study. New York: Wiley.
Fig. 17 Predicted rank in physics across TICS scenarios. O = original unadjusted model; Med, Zero, and Full = all schools have implemented the country-specific median, the least possible, or most possible level of TICS within the country, respectively. A blue confidence interval with a downward arrow indicates a significantly lower rank than the original scenario (e.g. Qatar for zero TICS scenario in biology)

Page 31 of 31Daus and Braeken Large-scale Assess Educ (2018) 6:1
Daus, S., Nilsen, T., & Braeken, J. (under review). Exploring content knowledge: Country profile of science strengths and weaknesses in TIMSS. Manuscript submitted for publication.
Hencke, J., Rutkowski, L., Neuschmidt, O., & Gonzalez, E. J. (2009). Curriculum coverage and scale correlation on TIMSS 2003. IERI Monograph Series Issues and Methodologies in Large Scale Assessments, 2(4), 85–112.
Husén, T., & Postlethwaite, T. N. (1996). a brief history of the international association for the evaluation of educa-tional achievement (TEA). Assessment in Education: Principles, Policy and Practice, 3(2), 129–141. https ://doi.org/10.1080/09695 94960 03020 2.
Luyten, H. (2016). Chapter 5: Predictive power of OTL measures in TIMSS and PISA. In J. Scheerens (Ed.), Opportunity to learn, curriculum alignment and test preparation: A research review (pp. 103–119). Dordrecht: Springer.
Matsubara, K., Hagiwara, Y., & Saruta, Y. (2016). A statistical analysis of the characteristics of the intended curriculum for Japanese primary science and its relationship to the attained curriculum. Large-scale Assessments in Educa-tion, 4(13), 1–18. https ://doi.org/10.1186/s4053 6-016-0028-0.
Mullis, I. V. S. (2013). TIMSS 2015 assessment frameworks. Chestnut Hill: TIMSS and PIRLS International Study Center, Lynch School of Education, Boston College.
Mullis, I. V. S., Martin, M. O., Goh, S., & Cotter, K. (2016). TIMSS 2015 Encyclopedia: Education policy and curriculum in mathematics and science. Boston: Boston College, TIMSS & PIRLS International Study Center.
Muthén, L. K., & Muthén, B. O. (1998). Mplus User’s Guide (8 ed.). Los Angeles: Muthén & Muthén.R Core Team. (2017). R: A language and environment for statistical computing. Vienna, Austria: R Foundation for
Statistical Computing. Retrieved from http://www.r-proje ct.org.Scheerens, J. (Ed.). (2016). Opportunity to learn, curriculum alignment and test preparation: A research review. Dordrecht:
Springer.Scheerens, J., & Bosker, R. J. (1997). The foundations of educational effectiveness (1st ed.). New York: Pergamon.Schmidt, W. H., Burroughs, N. A., Zoido, P., & Houang, R. T. (2015). The role of schooling in perpetuating educational
inequality: An international perspective. Educational Researcher, 44(7), 371–386. https ://doi.org/10.3102/00131 89x15 60398 2.
Schmidt, W. H., McKnight, C. C., Houang, R. T., Wang, H., Wiley, D. E., Cogan, L. S., et al. (2001). Why schools matter: A cross-national comparison of curriculum and learning. San Francisco: Jossey-Bass.
Wang, J., & Goldschmidt, P. (1999). Opportunity to learn, language proficiency, and immigrant status effects on math-ematics achievement. The Journal of Educational Research, 93(2), 101–111. https ://doi.org/10.1080/00220 67990 95976 34.