Contentiousness vs. sensitivity
10
Contentiousness vs. Sensitivity: Improving Contention Aware Runtime Systems on Multicore Architectures Lingjia Tang University of Virginia [email protected] Jason Mars University of Virginia [email protected] Mary Lou Soffa University of Virginia [email protected] ABSTRACT Runtime systems to mitigate memory resource contention problems on multicore processors have recently attracted much research attention. One critical component of these runtimes is the indicators to rank and classify applications based on their contention characteristics. However, although there has been significant research effort, application con- tention characteristics remain not well understood and indi- cators have not been thoroughly evaluated. In this paper we performed a thorough study of appli- cations’ contention characteristics to develop better indica- tors to improve contention-aware runtime systems. The con- tention characteristics are composed of an application’s con- tentiousness, and its sensitivity to contention. We show that contentiousness and sensitivity are not strongly correlated, and contrary to prior work, a single indicator is not adequate to predict both. Also, while prior work argues that last level cache miss rate is one of the best indicators to predict an ap- plication’s contention characteristics, we show that depend- ing on the workloads, it can often be misleading. We then present prediction models that consider contention in vari- ous memory resources. Our regression analysis establishes an accurate model to predict application contentiousness. The analysis also demonstrates that performance counters alone may not be sufficient to accurately predict applica- tion sensitivity to contention. Our evaluation using SPEC CPU2006 benchmarks shows that when predicting an ap- plication’s contentiousness, the linear correlation coefficient R 2 of our predictor and the real measured contentiousness is 0.834, as opposed to 0.224 when using last level cache miss rate. Categories and Subject Descriptors D.1.3 [Programming Techniques]: Concurrent Program- ming—parallel programming ; D.3.4 [Programming Lan- guages]: Processors—run-time environments, compilers, op- timization, debuggers ; D.4.8 [Operating Systems]: Per- formance—measurements, monitors Permission to make digital or hard copies of all or part of this work for personal or classroom use is granted without fee provided that copies are not made or distributed for profit or commercial advantage and that copies bear this notice and the full citation on the first page. To copy otherwise, to republish, to post on servers or to redistribute to lists, requires prior specific permission and/or a fee. EXADAPT ’11 June 5, 2011, San Jose, California, USA. Copyright 2011 ACM 978-1-4503-0708-6/11/06 ...$10.00. General Terms Performance, Design, Algorithms, Experimentation Keywords contention aware runtimes, contentiousness vs sensitivity, memory subsystems, multicore processors, scheduling 1. INTRODUCTION Multicore processors have become pervasive and can be found in a variety of computing domains, from the most basic desktop computers to the most sophisticated high per- formance datacenters. With each new generation of archi- tectures, more cores are being added to a single die. In currently available multicore designs, much of the memory sub-system is shared. These shared components include on- chip caches, the memory bus, memory controllers, under- lying interconnect and even on-chip data prefetchers. For such architectures equipped with multiple processing cores, contention for shared resources significantly aggravates the existing memory wall problem and restricts the performance benefit of multicore processors. There has been a significant research effort to mitigate the effects of contention using software runtime solutions. Techniques have been developed that perform runtime con- tention detection and execution control [17] and online job scheduling [13, 29, 11, 2, 27]. To most effectively design these runtime systems, there are two important underlying research challenges. [Challenge 1] It is important to have an in-depth under- standing of application contention characteristics, including an application’s contentiousness, which is the potential per- formance degradation it can cause to its co-runners, and an application’s sensitivity to contention, which is the poten- tial degradation it can suffer from its co-runners. In prior work, there have been conflicting conclusions about the re- lationship between an application’s contentiousness and its sensitivity to contention. Some prior works [26, 29] ar- gue that there is a clear distinction between an applica- tion’s contentiousness and contention sensitivity, while other works [11, 15] conclude that an application’s contentiousness and sensitivity are strongly correlated for most applications and thus can be represented and estimated using a unified model. To address this disagreement, we perform thorough investigation of the contentiousness and sensitivity of gen- eral purpose applications on current systems. [Challenge 2] Contention aware runtimes use indicators for application contention characteristics to predict the po-
-
Upload
independent -
Category
Documents
-
view
1 -
download
0
Transcript of Contentiousness vs. sensitivity

Contentiousness vs. Sensitivity: Improving ContentionAware Runtime Systems on Multicore Architectures
Lingjia TangUniversity of Virginia
Jason MarsUniversity of Virginia
Mary Lou SoffaUniversity of Virginia
ABSTRACT
Runtime systems to mitigate memory resource contentionproblems on multicore processors have recently attractedmuch research attention. One critical component of theseruntimes is the indicators to rank and classify applicationsbased on their contention characteristics. However, althoughthere has been significant research effort, application con-tention characteristics remain not well understood and indi-cators have not been thoroughly evaluated.
In this paper we performed a thorough study of appli-cations’ contention characteristics to develop better indica-tors to improve contention-aware runtime systems. The con-tention characteristics are composed of an application’s con-tentiousness, and its sensitivity to contention. We show thatcontentiousness and sensitivity are not strongly correlated,and contrary to prior work, a single indicator is not adequateto predict both. Also, while prior work argues that last levelcache miss rate is one of the best indicators to predict an ap-plication’s contention characteristics, we show that depend-ing on the workloads, it can often be misleading. We thenpresent prediction models that consider contention in vari-ous memory resources. Our regression analysis establishesan accurate model to predict application contentiousness.The analysis also demonstrates that performance countersalone may not be sufficient to accurately predict applica-tion sensitivity to contention. Our evaluation using SPECCPU2006 benchmarks shows that when predicting an ap-plication’s contentiousness, the linear correlation coefficientR2 of our predictor and the real measured contentiousness is0.834, as opposed to 0.224 when using last level cache missrate.
Categories and Subject Descriptors
D.1.3 [Programming Techniques]: Concurrent Program-ming—parallel programming ; D.3.4 [Programming Lan-guages]: Processors—run-time environments, compilers, op-timization, debuggers; D.4.8 [Operating Systems]: Per-formance—measurements, monitors
Permission to make digital or hard copies of all or part of this work forpersonal or classroom use is granted without fee provided that copies arenot made or distributed for profit or commercial advantage and that copiesbear this notice and the full citation on the first page. To copy otherwise, torepublish, to post on servers or to redistribute to lists, requires prior specificpermission and/or a fee.EXADAPT ’11 June 5, 2011, San Jose, California, USA.Copyright 2011 ACM 978-1-4503-0708-6/11/06 ...$10.00.
General Terms
Performance, Design, Algorithms, Experimentation
Keywords
contention aware runtimes, contentiousness vs sensitivity,memory subsystems, multicore processors, scheduling
1. INTRODUCTIONMulticore processors have become pervasive and can be
found in a variety of computing domains, from the mostbasic desktop computers to the most sophisticated high per-formance datacenters. With each new generation of archi-tectures, more cores are being added to a single die. Incurrently available multicore designs, much of the memorysub-system is shared. These shared components include on-chip caches, the memory bus, memory controllers, under-lying interconnect and even on-chip data prefetchers. Forsuch architectures equipped with multiple processing cores,contention for shared resources significantly aggravates theexisting memory wall problem and restricts the performancebenefit of multicore processors.
There has been a significant research effort to mitigatethe effects of contention using software runtime solutions.Techniques have been developed that perform runtime con-tention detection and execution control [17] and online jobscheduling [13, 29, 11, 2, 27]. To most effectively designthese runtime systems, there are two important underlyingresearch challenges.
[Challenge 1] It is important to have an in-depth under-standing of application contention characteristics, includingan application’s contentiousness, which is the potential per-formance degradation it can cause to its co-runners, and anapplication’s sensitivity to contention, which is the poten-tial degradation it can suffer from its co-runners. In priorwork, there have been conflicting conclusions about the re-lationship between an application’s contentiousness and itssensitivity to contention. Some prior works [26, 29] ar-gue that there is a clear distinction between an applica-tion’s contentiousness and contention sensitivity, while otherworks [11, 15] conclude that an application’s contentiousnessand sensitivity are strongly correlated for most applicationsand thus can be represented and estimated using a unifiedmodel. To address this disagreement, we perform thoroughinvestigation of the contentiousness and sensitivity of gen-eral purpose applications on current systems.
[Challenge 2] Contention aware runtimes use indicatorsfor application contention characteristics to predict the po-

tential performance degradation that may occur due to con-tention or detect contention as it occurs. Prior works use anapplication’s last level cache (LLC) miss rate as an indicatorto detect contention or to predict applications’ contentioncharacteristics in order to classify the applications [17, 13,29]. In fact, LLC miss rate is argued to be one of the mostprecise indicators for contention aware scheduling [29]. How-ever, to the best of our knowledge, no prior work has thor-oughly investigated how to use microarchitectural eventsto best construct indicators for an application’s contentioncharacteristics. It remains unclear that LLC miss rate is thebest performance monitor based indicator for all workloads.In particular, its accuracy for memory intensive workloadshas not been thoroughly evaluated.
[Contributions] The specific contributions of this paperare as follows.
1. We investigate application contention characteristicsthrough systematic experiments on latest multicorehardware and show that although contentiousness andcontention sensitivity are consistent characteristics ofan application on a given platform, they are not stronglycorrelated.
2. We explore the effectiveness of using LLC miss rate asan indicator for contentiousness and contention sensi-tivity and find that it can sometimes be misleading forboth. One key insight of our work is that since con-tentiousness and contention sensitivity are not stronglycorrelated, no single indicator can accurately predictboth.
3. We construct two models that combine usages of mul-tiple memory resources including LLC, memory band-width and prefetchers to indicate an application’s con-tention characteristics. Our insights are firstly, un-derstanding contention characteristics require a holis-tic view of the entire memory subsystem. Secondly,a good indicator for an application’s contentiousnessmust capture the pressure an application puts on theshared resources; meanwhile, a good indicator for anapplication’s sensitivity must capture its reliance onthe shared memory resources. And for many memoryresources, pressure and reliance are very different.
4. We select appropriate performance counters that cancapture the usage of various memory resources. Wethen use regression analysis on a synthetic benchmarksuite to establish an accurate model to predict an ap-plication’s contentiousness. Regression also demon-strates that performance counters alone may not besufficient to accurately predict an application’s sensi-tivity to contention. Evaluation using SPEC CPU2006benchmarks shows that when predicting an applica-tion’s contentiousness, our predictor is much more ac-curate. The linear correlation coefficient R2 of our pre-dictor and the real measured contentiousness is 0.834,as opposed to 0.224 when using last level cache missrate.
The rest of the paper is organized as follows. In Section 2we present a thorough investigation in both application con-tentiousness and contention sensitivity. We then investigatethe effectiveness of using last level cache misses to predictboth contentiousness and contention sensitivity in Section 3.
Next, we present our prediction models and regression analy-sis for predicting contention characteristics in Section 4. Wethen evaluate our predictor for an application’s contentious-ness using SPEC CPU2006 benchmarks in Section 5. Wepresent related work in Section 6, and finally conclude inSection 7.
2. CONTENTIOUSNESS VS. SENSITIVITYIn this section we present formal definitions of both con-
tentiousness and contention sensitivity, and then investigatekey questions about the nature of each and how they relate.
2.1 DefinitionOn multicore processors, an application’s contentiousness
is defined as the potential performance degradation it cancause to co-running application(s) due to its heavy demandon shared resources. On the other hand, an application’ssensitivity to contention is defined by its potential to sufferperformance degradation from the interference caused by itscontentious co-runners.
As demonstrated in previous work [11], an application A’ssensitivity is formally defined using the following formula,
SensitivityA =IPCA(solo) − IPCA(co−run)
IPCA(solo)
(1)
where IPCA(solo) is A’s IPC when it is running alone and
IPCA(co−run) is the statistical expectation of the A’s IPCwhen it co-runs with random co-runners. We extend thisdefinition to include A’s contentiousness as,
ContentiousnessA =IPCBi(solo) − IPCBi(co−runA)
IPCBi(solo)
(2)
where A’s contentiousness is quantified as the statisticalexpectation of the IPC degradation A causes to its randomco-runner.
We can estimate SensitivityA and ContentiousnessA byco-locating A with various co-runners Bi, and take the av-erage of A’s measured contentiousness and contention sen-sitivity. A’s sensitivity to corunner Bi can be defined as,
SensitivityA(co−runBi) =
IPCA(solo) − IPCA(co−runBi)
IPCA(solo)
(3)and the A’s average measured sensitivity is,
SensitivityA(avg) =
Pn
i SensitivityA(co−runBi)
n(4)
Similarly, we can define A’s contentiousness when it isco-running with Bi and its average contentiousness as,
ContentiousnessA(co−runBi) =
IPCBi(solo) − IPCi(co−runA)
IPCBi(solo)
(5)
ContentiousnessA(avg) =
Pn
i ContentiousnessA(co−runBi)
n(6)
In this work we use Equation 4 to estimate sensitivityA,and Equation 6 to estimate contentiousnessA.
2.2 Contentiousness and SensitivityIn this section we address two important questions about
an application’s contentiousness and sensitivity to contention.
!"#
$"#
%!"#
%$"#
&!"#
&$"#
'!"#
'$"#
(!"#
!"#$
!%"&'()*'
#$$
#%!+$
,-.!/0$
#+1$
,.2%)0$
-#)/*..$
0(!()+"#3$
4++$
(,*(5$
"6%.$
2##/5$
7/(!88$
29:;$
./5!"/)+2$
,</)4$
.-=5(>$
)(#7$
+-)*/)?-',)/,,$
#)*+#
),*-./01.+#
+,)2#
+23#
456)78#
469,08#
5+07166#
8/)/0#
:;<=#>?@AB@C?DE@BEE#
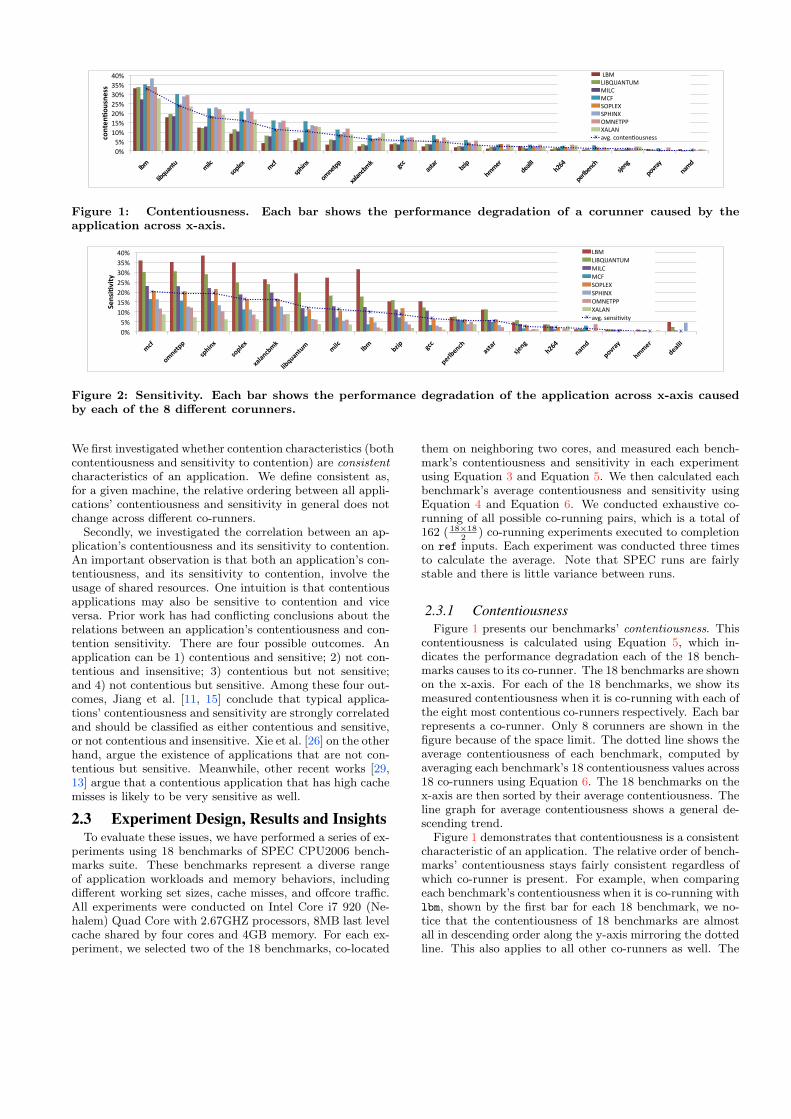
Figure 1: Contentiousness. Each bar shows the performance degradation of a corunner caused by theapplication across x-axis.
!"#
$"#
%!"#
%$"#
&!"#
&$"#
'!"#
'$"#
(!"#
!"#$
%!&'())$
*)+,&-$
*%).'-$
-/./&"0!1$
.,023/&(3!$$
!,."$
.0!$
04,)$
5""$
)'6.0'&"+$
/*(/6$
*7'&5$
+89:$
&/!;$
)%<6/=$
+!!'6$
;'/.>>$
?'&*,@<,(=$
)*+#
),*-./01.+#
+,)2#
+23#
456)78#
469,08#
5+07166#
8/)/0#
:;<=#>?@>AB;ACD#
Figure 2: Sensitivity. Each bar shows the performance degradation of the application across x-axis causedby each of the 8 different corunners.
We first investigated whether contention characteristics (bothcontentiousness and sensitivity to contention) are consistentcharacteristics of an application. We define consistent as,for a given machine, the relative ordering between all appli-cations’ contentiousness and sensitivity in general does notchange across different co-runners.
Secondly, we investigated the correlation between an ap-plication’s contentiousness and its sensitivity to contention.An important observation is that both an application’s con-tentiousness, and its sensitivity to contention, involve theusage of shared resources. One intuition is that contentiousapplications may also be sensitive to contention and viceversa. Prior work has had conflicting conclusions about therelations between an application’s contentiousness and con-tention sensitivity. There are four possible outcomes. Anapplication can be 1) contentious and sensitive; 2) not con-tentious and insensitive; 3) contentious but not sensitive;and 4) not contentious but sensitive. Among these four out-comes, Jiang et al. [11, 15] conclude that typical applica-tions’ contentiousness and sensitivity are strongly correlatedand should be classified as either contentious and sensitive,or not contentious and insensitive. Xie et al. [26] on the otherhand, argue the existence of applications that are not con-tentious but sensitive. Meanwhile, other recent works [29,13] argue that a contentious application that has high cachemisses is likely to be very sensitive as well.
2.3 Experiment Design, Results and InsightsTo evaluate these issues, we have performed a series of ex-
periments using 18 benchmarks of SPEC CPU2006 bench-marks suite. These benchmarks represent a diverse rangeof application workloads and memory behaviors, includingdifferent working set sizes, cache misses, and offcore traffic.All experiments were conducted on Intel Core i7 920 (Ne-halem) Quad Core with 2.67GHZ processors, 8MB last levelcache shared by four cores and 4GB memory. For each ex-periment, we selected two of the 18 benchmarks, co-located
them on neighboring two cores, and measured each bench-mark’s contentiousness and sensitivity in each experimentusing Equation 3 and Equation 5. We then calculated eachbenchmark’s average contentiousness and sensitivity usingEquation 4 and Equation 6. We conducted exhaustive co-running of all possible co-running pairs, which is a total of162 ( 18×18
2) co-running experiments executed to completion
on ref inputs. Each experiment was conducted three timesto calculate the average. Note that SPEC runs are fairlystable and there is little variance between runs.
2.3.1 Contentiousness
Figure 1 presents our benchmarks’ contentiousness. Thiscontentiousness is calculated using Equation 5, which in-dicates the performance degradation each of the 18 bench-marks causes to its co-runner. The 18 benchmarks are shownon the x-axis. For each of the 18 benchmarks, we show itsmeasured contentiousness when it is co-running with each ofthe eight most contentious co-runners respectively. Each barrepresents a co-runner. Only 8 corunners are shown in thefigure because of the space limit. The dotted line shows theaverage contentiousness of each benchmark, computed byaveraging each benchmark’s 18 contentiousness values across18 co-runners using Equation 6. The 18 benchmarks on thex-axis are then sorted by their average contentiousness. Theline graph for average contentiousness shows a general de-scending trend.
Figure 1 demonstrates that contentiousness is a consistentcharacteristic of an application. The relative order of bench-marks’ contentiousness stays fairly consistent regardless ofwhich co-runner is present. For example, when comparingeach benchmark’s contentiousness when it is co-running withlbm, shown by the first bar for each 18 benchmark, we no-tice that the contentiousness of 18 benchmarks are almostall in descending order along the y-axis mirroring the dottedline. This also applies to all other co-runners as well. The

!"#
$"#
%!"#
%$"#
&!"#
&$"#
'!"#
'$"#
!"#!$%
&'()%
*+!,--%
.//%
0123%
044+$%
,&4%
,(&56!7#64%%
4/8%
4(,/%
7!4*%
947+#))%
)+$,&+7/0%
)9:$!;%
"<+7.%
"9),+=%
")0(7=%
=!,!7/&4>%?
97#+7@96"7+""%!7*%A+7"(@:(#;%
()*+#,-./0.1-23.033#
()*+#30.341)4/5#
Figure 3: Average Contentiousness vs. Sensitivity
graph also shows that lbm is the most contentious bench-mark among the 18 benchmarks.
2.3.2 Sensitivity
Similar to Figure 1, Figure 2 shows the sensitivity to con-tention of each of the 18 benchmarks when co-located withthe most contentious applications. This sensitivity is cal-culated using Equation 3, indicating how much degradationthe eight co-runners cause to each of the 18 benchmarks.These 18 benchmarks are sorted according to their averagesensitivity, calculated using Equation 4. Similar to Figure 1,this figure shows that sensitivity is also consistent for eachapplication. Although the descending trend is not as consis-tent as Figure 1, the general trend is strong.
2.3.3 Contentiousness vs. Sensitivity
In Figure 3, we juxtapose contentiousness and sensitivity.In this graph, for each application across the x-axis, the firstbar shows the average contentiousness of this applicationwith the eighteen co-runners presented in Figures 1 and 2.The second bar shows each benchmark’s average sensitivityto the same set of co-runners. Figure 3 clearly demonstratesa large disparity between application contentiousness andsensitivity. As shown in the figure, applications such as lbmand libquantum are highly contentious and only mildly sen-sitive, while other applications such as omnetpp and xalan
are highly sensitive, and slightly contentious. Also noticethat, in Figures 1 and 2, the sorted ordering of the 18 bench-marks (x-axis) are almost completely different. In fact, thecorrelation coefficient between contentiousness and sensitiv-ity using linear regression is 0.48, which further shows theyare not strongly correlated.
To summarize, through our experimentation we find,
1. Contentiousness and sensitivity are an application’sconsistent characteristics. Figure 1 shows that appli-cations with higher contentiousness tend to be consis-tently more contentious regardless of co-runners. Thisgeneral trend also applies to sensitivity, as shown inFigure 2.
2. Contentiousness and sensitivity of general purpose ap-plications are not strongly correlated as shown in Fig-ure 3. While we do not observe applications that areonly sensitive or only contentious, four outcomes oc-cur in practice; applications can be 1) contentious andsensitive; 2) not contentious and insensitive; 3) con-tentious but not highly sensitive; 4) not highly con-tentious but sensitive.
We present analysis as why contentiousness and sensitiv-ity are different in Section 4.1. Section 4.2.2 also presents
more experimental data on a different set of benchmarksto demonstrate the difference between contentiousness andsensitivity.
3. LLC MISSES AS AN INDICATOR?The ability to predict application contention characteris-
tics is important for contention aware runtime systems. Inthis paper we focus on indicators using performance mon-itoring units (PMUs). Last level cache (LLC) miss rate isone of the most commonly used indicators of an applica-tion’s contentiousness and is used to classify applications toachieve sensible co-scheduling decisions [29, 13] and detectcontention online [17]. In this section we evaluate the ef-fectiveness of using last level cache misses to indicate anapplication’s level of contentiousness and sensitivity to con-tention.
Both LLC miss rate, the number of misses for a givenamount of time, and miss ratio, the number of misses fora given number of instructions, have been used by priorwork to perform contention aware scheduling. To evalu-ate whether LLC miss rate or ratio is a good indicator foran application’s contentiousness, we measure LLC miss rateand miss ratio for the 18 SPEC2006 benchmarks used in Sec-tion 2, and compare each benchmark’s rate and ratio againstthe average degradation it causes to its co-runners. We alsocompare each benchmark’s miss rate and ratio to the averagedegradation it suffers due to contention to evaluate if LLCmiss is a good indicator for sensitivity. Experiment set upis as described in Section 2.3. Both the LLC miss rate andratio are collected when each benchmark is running aloneusing pfmon [6].
Figures 4 and 5 compare the average contentiousness andsensitivity of the benchmarks with their LLC misses permillion instructions. Figures 6 and 7 compare the averagecontentiousness and sensitivity with LLC misses per mil-lisecond. In these four figures, each bar shows the averagecontentiousness or sensitivity of each application as mea-sured from our experimentation in Section 2. The dottedline shows the each benchmark’s LLC miss rate or ratio. Weuse line graphs to better demonstrate the difference betweenthe trend of LLC misses and each application’s contentious-ness or sensitivity. The left y-axis shows the contentiousnessand sensitivity, respectively, and the right y-axis shows theLLC misses rate and ratio.
These figures demonstrate two key observations. The firstobservation is that LLC miss rate and ratio are good in-dicators to distinguish CPU-bound applications andmemory-bound applications. Applications that are shownto the right of each figure, such as hmmer, sjeng, and povray
are CPU bound applications. They tend to have little con-tentiousness or sensitivity to contention, and this is accu-rately predicted by their extremely low cache miss rate/ratio.This insight indicates that a contention aware runtime sys-tem that uses LLC misses to predict performance degrada-tion or detect contention may be quite effective for work-loads that contain a balanced mix of CPU bound appli-cations and memory bound applications, as co-schedulingCPU bound and memory bound applications does indeedminimize contention effectively. The scheduler would simplyhave to pair low LLC miss benchmarks (e.g, povray) withhigh LLC misses benchmarks (e.g milc). Also contentionmay not occur when CPU bound applications are executingand thus using LLC miss rate can fairly effectively detect

!"
#!!!"
$!!!"
%!!!"
&!!!"
'!!!!"
'#!!!"
'$!!!"
'%!!!"
!("
)("
'!("
')("
#!("
#)("
*!("
*)("
+,-"
+.,/01230-""
-.+4"
567+89"
-4:"
57;.29"
6-28377"
91+124,-<"
=44"
1531>"
,?.7"
;--8>"
@81+AA"
;#%$"
78>+,824;"
5B82="
76C>1D"
21-@"
!!"#$
%&&'&($%))%*+#%+&,-./0*+&#
"*+,'+0*.&+'&&#
EC=F"G62382H6052855"
IIG"-.5585J-.++.62".253>"
Figure 4: LLC miss ratio vs. average contentious-ness
!"
#!!!"
$!!!"
%!!!"
&!!!"
'!!!!"
'#!!!"
'$!!!"
'%!!!"
!("
)("
'!("
')("
#!("
#)("
*+,"
-*./011"
2134.5"
2-16/5"
5767.+8*9"
648:;7.0;
*"" *46+"
68*"
8<41"
=++"
1/>68/.+3"
7207>"
2?/.="
3#%$"
.7*@"
1-A>7B"
3**/>"
@/76CC"
!!"#$
%&&'&($%))%*+#%+&,-./0*+&#
1'+&%02%,3#
DA=E"F/.24GA40B"
HHI"J422/2K*4664-."
4.20>"
Figure 5: LLC miss ratio vs. average sensitivity
!"
#!!!"
$!!!!"
$#!!!"
%!!!!"
%#!!!"
&!!!!"
&#!!!"
!'"
#'"
$!'"
$#'"
%!'"
%#'"
&!'"
&#'"
()*"
(+),-./0-*""
*+(1"
234(56"
*17"
248+/6"
3*/5044"
6.(./1)*9"
:11"
.20.;"
)<+4"
8**5;"
=5.(>>"
8%?@"
45;()5/18"
2A5/:"
43B;.C"
/.*="
!!"#$
%&&'&($&#
")*+'*,)-&*'&&#
DB:E"F3/05/G3-2/522"
HHF"*+2252I*2"
Figure 6: LLC miss rate vs. average contentiousness
!"
#!!!"
$!!!!"
$#!!!"
%!!!!"
%#!!!"
&!!!!"
&#!!!"
!'"
#'"
$!'"
$#'"
%!'"
%#'"
()*"
+(,-.//"
0/12,3"
0+/4-3"
3545,)6(7"
426895,.9(""
(24)"
46("
6:2/"
;))"
/-<46-,)1"
50.5<"
0=-,;"
1%>?"
,5(@"
/+A<5B"
1((-<"
@-54CC"
!!"#$
%&&'&($&#
)'*&%+,%-.#
DA;E"F-,02GA2.B"
HHI"J200-0K(0"
Figure 7: LLC miss rate vs. average sensitivity
when contention is not occuring. This observation may ex-plain the good results in prior work.
The second key observation is that LLC cache miss rateand ratio are not good at predicting the degree ofcontentiousness and sensitivity for memory boundapplications. This is demonstrated by the mismatch be-tween the dotted line and bars for benchmarks to the left ofeach figure. These benchmarks exhibit various levels of con-tentiousness and sensitivity ranging from 5% to 35% for con-tentiousness and 20% for sensitivity). However using LLCmiss rate and ratio gives little indication of the magnitudeof the contentiousness or sensitivity. For example, in Fig-ure 4 and Figure 6, lbm and libquantum are the two mostcontentious benchmarks, yet their LLC misses rate and ra-tio are quite low. In Figure 5 and 7, sphinx is shown to beone of the most sensitive benchmarks, yet its LLC miss rateand ratio are almost negligible. From these observations, weconclude that LLC miss rate or ratio is not a good indicatorfor predicting the magnitude of contentiousness and sensi-tivity of a memory bound application, and therefore is notsuitable for scheduling workloads that are memory boundbiased (containing more memory bound applications thancpu bound) or detecting the severity of contention amongsuch workloads.
Section 4.2.1 presents more details on why LLC miss rateis not a good indicator for contentiousness or sensitivity.
4. PREDICTING CONTENTION CHARAC-
TERISTICSIn this section we construct models to indicate contention
characteristics for all types of workloads including memory
bound workloads. One of the key insights of this work is thatbecause an application’s contentiousness and its sensitivity tocontention are two distinct characteristics, we need separatepredictors for each. Also, based on the results presented inSection 3, we conclude that contention also occurs in othershared components in the memory subsystem in addition tolast level caches. Therefore, understanding the contentioncharacteristics of an application requires a holistic view ofthe memory subsystem and a comprehensive predictor mustcapture how an application uses and relies on the shared re-sources beyond last level cache such as memory bandwidth,prefetchers, memory controllers, etc.
In this section, we first construct general models to es-timate an application’s contention characteristics that takesharing of multiple memory components into consideration.We then select PMUs that can reflect application’s activityin regard to these shared memory components. Finally, wedetermine the detailed prediction models using regressionanalysis between an application’s selected PMUs profile andits contention characteristics.
4.1 Modeling Contention CharacteristicsWhy are applications’ contentiousness and sensi-
tivity are different?The fundamental difference between contentiousness and
sensitivity is that contentiousness reflects how much pres-
sure an application puts on the shared resources; meanwhile,application sensitivity to contention reflects an application’sreliance on the shared memory resources. Last level cachesand prefetchers are both essentially performance optimiza-tion mechanisms whose effectiveness is depending on ap-plication’s data reuse patterns, therefore for these two re-

sources, there is a difference between an application’s pres-sure and reliance on them. Pressure is directly linked tohow much the shared resource (LLC or prefetcher) an appli-cation is using; while reliance is how much an application’sprogress is benefiting from using the shared resource.
For example, an application’s working set may occupy agreat amount of LLC space but the application’s perfor-mance may or may not rely on the LLC, depending onwhether it reuses its data residing in the LLC. Another ex-ample is that an application can issue a large amount ofprefetching requests but may not benefit or only benefitslightly from these requests. In this case, the applicationis heavily using but not depending on the prefetcher. Forother components such as memory bandwidth, pressure andreliance can be more correlated.
To model an application’s contention characteristics, weuse a linear model to combine the effect of shared resources,including LLC, memory bandwidth and prefetchers. We alsoconsider contentiousness and sensitivity to contention sepa-rately.
Contentiousness An application’s contentiousness is de-termined by the amount of pressure it puts on the sharedmemory subsystem. Thus it can be directly predicted usingthe application’s usage of the shared resources.
C = a1 × LLC usage + b1 × BW usage + c1 × Pref usage, (7)
where C stands for contentiousness, BW is bandwidth andPref is prefetchers. It is fairly easy to quantify and mea-sure the bandwidth usage (e.g., bus transactions per second).However, it is difficult to quantify cache usage because it ismultifaceted. For example, both the cache access frequencyand the cache footprint reflect dimensions of the cache us-age.
Each application may have a different combination of cache,bandwidth and prefetch usage. For example, a cache inten-sive application whose working set is similar to the size of theLLC has a heavy LLC usage and probably little bandwidthusage. Streaming applications may have little to mediumcache usage but heavy bandwidth usage. How contentiousthese applications are relative to each other depends on therelative importance between the cache contention and thebandwidth contention. Note that the goal of the predictionmodel is to rank the relative contentiousness of a group of ap-plications to make scheduling decisions, instead of predictingthe exact average contentiousness or the exact performancedegradation. Therefore identifying the relative importanceof contention in shared caches, bandwidth and prefetchers,reflected as coefficients a1, b1 and c1, is one of the main ob-jectives of the modeling and regression. The next sectionwill present the regression analysis for determining coeffi-cients of the model. It is worth noting that a1, b1, c1 arearchitecture specific.
Sensitivity A good prediction model for sensitivity shouldcapture how much the application is relying on the sharedmemory system. However, this is much more challengingthan predicting contentiousness using PMUs.
S = a2 × LLC usage + b2 × BW usage + c2 × Pref usage, (8)
As shown in Equation 8, to capture the difference betweencontentiousness and sensitivity, we use difference coefficients(e.g, a1 vs. a2). In addition to being architecture-specific,coefficients a2, b2 and c2 are also application specific. This isbecause, as we discussed earlier, even with the same amount
of resource usage, how much an application relies on theshared resources is different. And it is heavily depending onhow applications reuse data.
4.2 Approximation using PMUsIn this section, we identify performance counters (PMUs)
to estimate the usage of memory resources including LLCand memory bandwidth. We then profile a set of syntheticbenchmarks to collect the selected performance counters aswell as the contention characteristics of these benchmarkson a real architecture. Using performance counter profilesto estimate resource usages in Equation 7 and 8, we can useregression analysis to determine coefficients of the models.The platform we use in this section is a quad-core Intel Corei7 described in Section 2.3.
4.2.1 PMUs for Memory Resource Usage
Contentiousness On our Intel Core i7 platform, we iden-tify the number of cache lines the last level cache bringsin per millisecond (LLC Lines In/ms), as shown in Fig-ure 8, to measure the memory bandwidth usage. This isbecause that LLC lines in rate can better capture the ac-tual aggregate pressure an application is putting on thebandwidth than LLC miss rate or ratio because it includesprefetchers’ effect on the bandwidth. We identify (L2LinesIn- L3LinesIn)/ms to estimate the shared cache (L3) usage.(L2LinesIn - L3LinesIn) rate shows how much data is usedin an interval that is coming from only L3 and not theDRAM. However, unlike using L3LinesIn/ms to estimatethe bandwidth usage, (L2LinesIn - L3LinesIn) rate is an ap-proximation of the L3 cache usage. As we discussed, boththe cache footprint and the access frequency are dimensionsof the cache usage. Bigger footprint and higher access fre-quency indicate more pressure on the cache. (L2LinesIn -L3LinesIn) rate only reflects the frequency but may not fullyreflect the application’s footprint in the L3 cache becausePMUs do not reflect the amount of data reuse. However,we will show that this is a sufficient approximation whenindicating contentiousness. Prefetcher usage is manifestedin both cache and bandwidth usage. The main impact ofprefetchers is the increased bandwidth and the cache spacethe prefetched data occupy. Because both L3LinesIn andL2LinesIn include the prefetchers’ traffic, we do not need anextra PMU to measure the prefetcher usage. Although weuse an Intel Core i7 platform here, the reasoning of selectingPMUs should be general for other multicore architectures.Using the above PMUs, Equation 7 becomes:
C = a1×(L2LinesIn rate−L3LinesIn rate)+b1×L3LinesIn rate
(9)
Why LLC miss rate is not a good indicator for con-tentiousness? Our experiments in Section 3 show that soloLLC miss rate and ratio do not accurately indicate an appli-cation’s level of contentiousness. There are two main reasonsthat our model (Equation 9) can be more accurate. Firstly,LLC miss rate does not fully reflect the contention for thememory bandwidth or prefetcher. LLC miss rate or ratio, asan architectural performance monitoring event on most plat-forms, does not capture the prefetching bandwidth, whichoften consumes a large portion of the memory bandwidthon modern architectures. Secondly, LLC miss rate and ratioalso cannot accurately capture cache contentiousness of anapplication. An application can have a working set that fitsin the L3 cache. The application can frequently access its

Shared Cache
L2 L2 L2 L2
Core Core Core Core
Remaining Memory Subsystem
Application
LLC Lines In
(contentiousness)
L2 Lines In
(sensitivity)
Figure 8: PMUs used for predicting contention charac-teristics
!"#
$!"#
%!"#
&!"#
'!"#
(!!"#
($!"#
)*+%,)#
)*+',)#
)*+-!,)#
./012%,)#
./012',)#
./012-!,)#
234./012%,)#
234./012',)#
234./012-!,)#
)567802(!#
)5678029!#
)567802-!#
*52:;2(#
*52:;2$#
*52:;29#
<1;=#>6.+2.?6@*.2**#
<1;=#A2.*0?10+B#
Figure 9: Average contentiousness and sensi-tivity of synthetic benchmarks
working set without incurring many cache misses. However,since it is heavily using the shared cache, it can be verycache contentious when co-located and causing cache missesto its co-runners. LLC miss rate cannot accurately predictcache-intensive applications’ contentiousness but (L2LinesIn- L3LinesIn) rate can.
Sensitivity We use the same PMUs to estimate the re-liance an application has on the shared resources and topredict the application’s sensitivity to contention.
S = a2×(L2LinesIn rate−L3LinesIn rate)+b2×L3LinesIn rate
(10)
As we mentioned in Section 4.1, a2 and b2 are application-specific coefficients that are related to how an applicationreuses its data. However, due to the limitation of currentavailable PMUs on most hardware, we cannot accuratelymeasure data reuse. Therefore, the goal of the regressionanalysis for the sensitivity model is to investigate whetherthese application specific factors are not negligible when pre-dicting an application’s sensitivity.
Why LLC miss rate is not a good indicator forsensitivity? As we discussed in the previous section, LLCmiss rate does not always reflect the reliance an applica-tion has on LLC or the rest of the shared memory system.Firstly, an application can be highly relying on the LLC, oc-cupying large portion of the LLC and frequently accessingit without incurring LLC misses. This type of applicationsactually may be highly sensitive. However, the LLC missrate does not reflect that. Secondly, multiple shared mem-ory components also need to be considered for sensitivityto contention. For example, sensitivity to bandwidth con-tention is not considered previously. Streaming applicationsare considered to be contentious but not necessarily sensi-tive because they are already having cache misses when it isrunning alone. So it would seem that co-running with otherapplications would not make the situation worse. However,they are highly sensitive to memory bandwidth contentionalthough not to cache contention. These applications alsomay not have high LLC miss rates.
4.2.2 Regression to Determine Coefficients
In this section, we use multiple regression to determinethe coefficients in Equation 9 and 10. The goal of the re-gression analysis is to firstly test that whether there is astrong correlation between an application’s resource usageand its contention characteristics; and secondly to determinethe relative importance of contention in various resources.
Table 1: Synthetic Benchmarks
Benchmark Footprint Description
bst 4mb, 8mb,50mb
random accessing a binary searchtree
naive 4mb, 8mb,50mb
random accessing an array
er-naive 4mb, 8mb,50mb
fast random accessing an array
blockie small,medium,large
a number of large 3D arrays. Aportion of one array is continu-ously copied to another.
sledge small,medium,large
two large arrays, copies databack and forth between arrayswith this sledgehammer pattern.
Synthetic Benchmarks To conduct regression analysis,we collect PMU profiles and contention characteristics of asuite of synthetic benchmarks. Table 1 presents our syn-thetic benchmarks. Bst, naive, blockie and sledge arefrom the contention benchmark suite developed by Mars etal. [15]. The benchmarks are memory intensive applicationswith various memory access patterns. They are run using3 different inputs with different working set sizes to stressdifferent memory resources. The only difference betweennaive and er-naive is that er-naive uses a much fasterrandom number generator. The goal is to test how con-tention characteristics would change when an application’scache access frequency increases but everything else remainsthe same. Figure 9 presents each benchmark’s average con-tention characteristics calculated using Equation 4 and 6.As the figure shows, the benchmark suite presents a fairlywide range of contentiousness and sensitivity. Also this fig-ure again demonstrates that an application’s contentious-ness and sensitivity are not strongly correlated.
Regression We conduct multiple linear regression on Equa-tion 9 using each benchmark’s L2LinesIn rate, L3LinesInrate and average C (contentiousness), shown in Figure 9.The regression result for contentiousness is:
C = 1.663 × (L2LinesIn/ns − L3LinesIn/ns)
+ 8.890 × L3LinesIn/ns + 0.044 (11)
The p value for (L2LinesIn/ns - L3LinesIn/ns) is 0.018;for L3LinesIn/ns, 5.11e-07; for the entire regression, 2.015e-06; all smaller than 0.5, indicating statistically significanteffects. The R-squared is 0.8876, indicating a strong fit.
!"
!#$"
!#%"
!#&"
!#'"
!#("
!#)"
!#*"
!#+"
!#,"
$"
!" !#%" !#'" !#)" !#+" $"
!"#$%&'#$()*+'#+,*-.+#..(
/#0.-"#$(1234()*+'#+,*-.+#..(
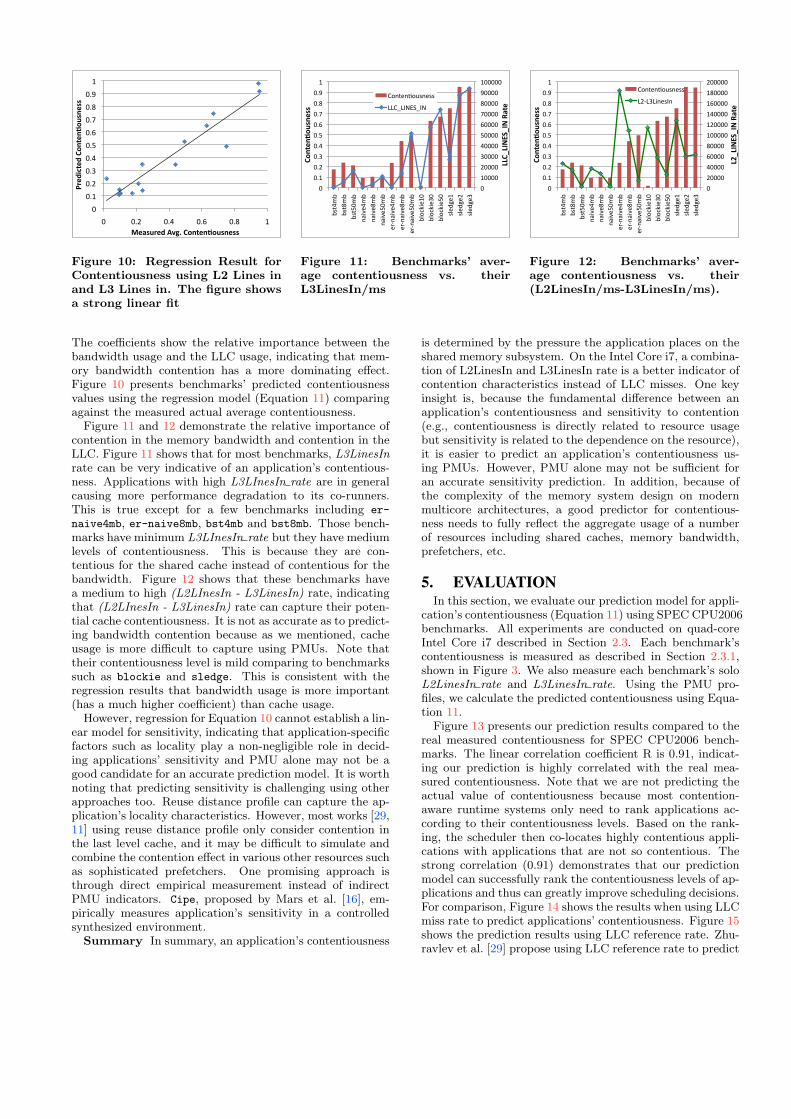
Figure 10: Regression Result forContentiousness using L2 Lines inand L3 Lines in. The figure showsa strong linear fit
!"
#!!!!"
$!!!!"
%!!!!"
&!!!!"
'!!!!"
(!!!!"
)!!!!"
*!!!!"
+!!!!"
#!!!!!"
!"
!,#"
!,$"
!,%"
!,&"
!,'"
!,("
!,)"
!,*"
!,+"
#"
-./&0-"
-./*0-"
-./'!0-"
12345&0-"
12345*0-"
12345'!0-"
56712345&0-"
56712345*0-"
56712345'!0-"
-89:;35#!"
-89:;35%!"
-89:;35'!"
.85<=5#"
.85<=5$"
.85<=5%"
!!"#!$%&'#$%()*+,(
"-.+,./-01.,11(
>91/[email protected].."
AA>BACDEFBCD"
Figure 11: Benchmarks’ aver-age contentiousness vs. theirL3LinesIn/ms
!"
#!!!!"
$!!!!"
%!!!!"
&!!!!"
'!!!!!"
'#!!!!"
'$!!!!"
'%!!!!"
'&!!!!"
#!!!!!"
!"
!('"
!(#"
!()"
!($"
!(*"
!(%"
!(+"
!(&"
!(,"
'"
-./$0-"
-./&0-"
-./*!0-"
12345$0-"
12345&0-"
12345*!0-"
56712345$0-"
56712345&0-"
56712345*!0-"
-89:;35'!"
-89:;35)!"
-89:;35*!"
.85<=5'"
.85<=5#"
.85<=5)"
!"#!$%&'#$%()*+,(
-./+,/0.12/,22(
>91/[email protected].."
A#7A)A315.B1"
Figure 12: Benchmarks’ aver-age contentiousness vs. their(L2LinesIn/ms-L3LinesIn/ms).
The coefficients show the relative importance between thebandwidth usage and the LLC usage, indicating that mem-ory bandwidth contention has a more dominating effect.Figure 10 presents benchmarks’ predicted contentiousnessvalues using the regression model (Equation 11) comparingagainst the measured actual average contentiousness.
Figure 11 and 12 demonstrate the relative importance ofcontention in the memory bandwidth and contention in theLLC. Figure 11 shows that for most benchmarks, L3LinesInrate can be very indicative of an application’s contentious-ness. Applications with high L3LInesIn rate are in generalcausing more performance degradation to its co-runners.This is true except for a few benchmarks including er-
naive4mb, er-naive8mb, bst4mb and bst8mb. Those bench-marks have minimum L3LInesIn rate but they have mediumlevels of contentiousness. This is because they are con-tentious for the shared cache instead of contentious for thebandwidth. Figure 12 shows that these benchmarks havea medium to high (L2LInesIn - L3LinesIn) rate, indicatingthat (L2LInesIn - L3LinesIn) rate can capture their poten-tial cache contentiousness. It is not as accurate as to predict-ing bandwidth contention because as we mentioned, cacheusage is more difficult to capture using PMUs. Note thattheir contentiousness level is mild comparing to benchmarkssuch as blockie and sledge. This is consistent with theregression results that bandwidth usage is more important(has a much higher coefficient) than cache usage.
However, regression for Equation 10 cannot establish a lin-ear model for sensitivity, indicating that application-specificfactors such as locality play a non-negligible role in decid-ing applications’ sensitivity and PMU alone may not be agood candidate for an accurate prediction model. It is worthnoting that predicting sensitivity is challenging using otherapproaches too. Reuse distance profile can capture the ap-plication’s locality characteristics. However, most works [29,11] using reuse distance profile only consider contention inthe last level cache, and it may be difficult to simulate andcombine the contention effect in various other resources suchas sophisticated prefetchers. One promising approach isthrough direct empirical measurement instead of indirectPMU indicators. Cipe, proposed by Mars et al. [16], em-pirically measures application’s sensitivity in a controlledsynthesized environment.
Summary In summary, an application’s contentiousness
is determined by the pressure the application places on theshared memory subsystem. On the Intel Core i7, a combina-tion of L2LinesIn and L3LinesIn rate is a better indicator ofcontention characteristics instead of LLC misses. One keyinsight is, because the fundamental difference between anapplication’s contentiousness and sensitivity to contention(e.g., contentiousness is directly related to resource usagebut sensitivity is related to the dependence on the resource),it is easier to predict an application’s contentiousness us-ing PMUs. However, PMU alone may not be sufficient foran accurate sensitivity prediction. In addition, because ofthe complexity of the memory system design on modernmulticore architectures, a good predictor for contentious-ness needs to fully reflect the aggregate usage of a numberof resources including shared caches, memory bandwidth,prefetchers, etc.
5. EVALUATIONIn this section, we evaluate our prediction model for appli-
cation’s contentiousness (Equation 11) using SPEC CPU2006benchmarks. All experiments are conducted on quad-coreIntel Core i7 described in Section 2.3. Each benchmark’scontentiousness is measured as described in Section 2.3.1,shown in Figure 3. We also measure each benchmark’s soloL2LinesIn rate and L3LinesIn rate. Using the PMU pro-files, we calculate the predicted contentiousness using Equa-tion 11.
Figure 13 presents our prediction results compared to thereal measured contentiousness for SPEC CPU2006 bench-marks. The linear correlation coefficient R is 0.91, indicat-ing our prediction is highly correlated with the real mea-sured contentiousness. Note that we are not predicting theactual value of contentiousness because most contention-aware runtime systems only need to rank applications ac-cording to their contentiousness levels. Based on the rank-ing, the scheduler then co-locates highly contentious appli-cations with applications that are not so contentious. Thestrong correlation (0.91) demonstrates that our predictionmodel can successfully rank the contentiousness levels of ap-plications and thus can greatly improve scheduling decisions.For comparison, Figure 14 shows the results when using LLCmiss rate to predict applications’ contentiousness. Figure 15shows the prediction results using LLC reference rate. Zhu-ravlev et al. [29] propose using LLC reference rate to predict

!"#$#%&'()*+#
%#
%&,#
%&*#
%&(#
%&)#
%&-#
%&.#
%&+#
%&'#
%&/#
%# %&,# %&*# %&(# %&)#
!"#$%&'#$()(*+%,-(./012/0(
3#4+*"#$(56-7()8,'#,98*+,#++(
Figure 13: Predicted contentious-ness using our model is highlycorrelated with the real measuredcontentiousness for SPEC bench-marks
!"#$#%&''()#
%#
*%%%#
+%%%%#
+*%%%#
'%%%%#
'*%%%#
(%%%%#
(*%%%#
%# %&%*# %&+# %&+*# %&'# %&'*# %&(# %&(*#
!"#$%&&'()*+'
$+)&,-+.'/012'345*+564,&5+&&'
Figure 14: L3 Miss Rate is notstrongly correlated with the realcontentiousness
!"#$#%&%'()*#
%#
+%%%%#
*%%%%#
)%%%%#
,%%%%#
-%%%%#
(%%%%#
'%%%%#
.%%%%#
%# %&+# %&*# %&)# %&,#
!"#$%&%'%()%*$+,%*
-%+./'%0*1234*56(,%(76/.(%..*
Figure 15: L3 Reference rateis not strongly correlted with thereal contentiousness
an application’s intensity (contentiousness). The correlationcoefficients (R) are 0.47 and 0.28, respectively, showing thatneither LLC miss rate nor LLC reference rate can accuratelyindicate application contentiousness.
Our evaluation shows that our prediction model can in-dicate applications’ contentiousness much more accuratelythan the state of the art LLC miss rate indicator. And ourcontentiousness model can improve contention-aware run-time solutions that base on PMUs to indicate applications’contentiousness levels.
6. RELATED WORKThere has been a wealth of research on the challenge of
shared resource contention on multicore processors. Con-tention aware runtime systems have been proposed to miti-gate the effect of contention [17, 13, 29, 11, 2, 18, 27]. Jianget al. develop a locality model to predict co-running appli-cations’ degradation and use the model for co-scheduling toreduce performance degradation and unfairness [11]. Zhu-ravlev et al. demonstrate that cache contention is not thedominant cause for performance degradation of co-runningapplications on CMPs; contention that happens in manycomponents of the memory sub-system all contributes tothe performance degradation. They also conclude that lastlevel cache miss ratio is one of the best predictor for co-running applications’ performance degradation [29]. Jianget al. and Tian et al. study the theoretical complexity ofco-scheduling and provide approximate algorithms [10, 25].Also, there has been a number of contention aware schedul-ing schemes proposed that guarantee fairness and Quality-of-Service for multiprogrammed and multithreaded applica-tions [13, 7, 1]. Fedorova et al. use cache model prediction toenhance the OS scheduler to provide performance isolationby allocating CPU resources according to contention inter-ference [7]. Hardware techniques and related algorithms toenable cache management such as cache partitioning andmemory scheduler have been proposed [24, 12, 21, 19, 4].Iyer et al. proposed a QoS-enabled memory architecture forCMP platforms to allocate memory resources such as cacheand memory bandwidth [9]. Other hardware solutions havebeen developed to guarantee fairness and QoS [20, 22, 14,8]. Related to novel cache designs and architectural support,analytical models to predict the impact of cache sharing are
also proposed by Chandra et al. [3]. In addition to newhardware cache management, other approaches manage theshared cache through the OS [23, 5, 7, 28].
7. CONCLUSIONIn this paper we performed a thorough study of contention
characteristics to develop an improved predictor for con-tention aware runtime systems. We studied the two aspectsof an application’s contention characteristics: an applica-tion’s contentiousness, e.g. the amount of degradation ittends to cause to its co-runners due to its demand on sharedresources, and an application’s sensitivity, e.g. the amountof degradation the application is likely to suffer due to co-running with contentious applications. Our study found thatalthough these two characteristics are consistent for each ap-plication, they are not strongly correlated for general pur-pose applications. We also found that although last levelcache miss rate is a commonly perceived good indicator forapplication contention characteristic, it could often be mis-leading. Based on the findings and insights, we then presentprediction models that comprehensively consider contentionin various memory resources. Our regression analysis estab-lishes an accurate model to predict application contentious-ness. Further evaluation using SPEC CPU2006 benchmarksshows that our predictor significantly out performs the state-of-art PMU indicators.
8. REFERENCES[1] M. Banikazemi, D. Poff, and B. Abali. PAM: a novel
performance/power aware meta-scheduler formulti-core systems. In SC ’08: Proceedings of the 2008ACM/IEEE conference on Supercomputing, 2008.
[2] M. Bhadauria and S. McKee. An approach toresource-aware co-scheduling for cmps. ICS ’10:Proceedings of the 24th ACM International Conferenceon Supercomputing, Jun 2010.
[3] D. Chandra, F. Guo, S. Kim, and Y. Solihin.Predicting Inter-Thread Cache Contention on a ChipMulti-Processor Architecture. In HPCA ’05:Proceedings of the 11th International Symposium onHigh-Performance Computer Architecture, 2005.
[4] J. Chang and G. S. Sohi. Cooperative cachepartitioning for chip multiprocessors. In ICS ’07:

Proceedings of the 21st annual internationalconference on Supercomputing, 2007.
[5] S. Cho and L. Jin. Managing Distributed, Shared L2Caches through OS-Level Page Allocation. MICRO39: Proceedings of the 39th Annual IEEE/ACMInternational Symposium on Microarchitecture, 2006.
[6] S. Eranian. What can performance counters do formemory subsystem analysis? Proceedings of the 2008ACM SIGPLAN workshop on Memory systemsperformance and correctness: held in conjunction withthe Thirteenth International Conference onArchitectural Support for Programming Languages andOperating Systems (ASPLOS’08), pages 26–30, 2008.
[7] A. Fedorova, M. Seltzer, and M. D. Smith. ImprovingPerformance Isolation on Chip Multiprocessors via anOperating System Scheduler. In PACT ’07:Proceedings of the 16th International Conference onParallel Architecture and Compilation Techniques,2007.
[8] A. Herdrich, R. Illikkal, R. Iyer, D. Newell,V. Chadha, and J. Moses. Rate-based QoS techniquesfor cache/memory in CMP platforms. In ICS ’09:Proceedings of the 23rd international conference onSupercomputing, 2009.
[9] R. Iyer, L. Zhao, F. Guo, R. Illikkal, S. Makineni,D. Newell, Y. Solihin, L. Hsu, and S. Reinhardt. QoSpolicies and architecture for cache/memory in CMPplatforms. In ACM SIGMETRICS PerformanceEvaluation Review, volume 35, 2007.
[10] Y. Jiang, X. Shen, J. Chen, and R. Tripathi. Analysisand approximation of optimal co-scheduling on chipmultiprocessors. In PACT ’08: Proceedings of the 17thinternational conference on Parallel architectures andcompilation techniques, 2008.
[11] Y. Jiang, K. Tian, and X. Shen. Combining localityanalysis with online proactive job co-scheduling inchip multiprocessors. High Performance EmbeddedArchitectures and Compilers, page 201aAS215, 2010.
[12] S. Kim, D. Chandra, and Y. Solihin. Fair CacheSharing and Partitioning in a Chip MultiprocessorArchitecture. In PACT ’04: Proceedings of the 13thInternational Conference on Parallel Architectures andCompilation Techniques, 2004.
[13] R. Knauerhase, P. Brett, B. Hohlt, T. Li, and S. Hahn.Using OS Observations to Improve Performance inMulticore Systems. IEEE Micro, 28(3), 2008.
[14] J. Lin, Q. Lu, X. Ding, Z. Zhang, X. Zhang, andP. Sadayappan. Gaining Insights into Multicore CachePartitioning: Bridging the Gap between Simulationand Real Systems. In The IEEE 14th InternationalSymposium on High Performance ComputerArchitecture, pages 367–378, 2008.
[15] J. Mars and M. L. Soffa. Synthesizing Contention. InWorkshop on Binary Instrumentation andApplications, 2009.
[16] J. Mars, L. Tang, and M. L. Soffa. Directlycharacterizing cross core interference throughcontention synthesis. In Proceedings of the 6thInternational Conference on High Performance andEmbedded Architectures and Compilers, HiPEAC ’11,pages 167–176, New York, NY, USA, 2011. ACM.
[17] J. Mars, N. Vachharajani, R. Hundt, and M. Soffa.Contention aware execution: online contentiondetection and response. CGO ’10: Proceedings of the8th annual IEEE/ACM international symposium onCode generation and optimization, Apr 2010.
[18] A. Merkel, J. Stoess, and F. Bellosa.Resource-conscious scheduling for energy efficiency onmulticore processors. EuroSys ’10: Proceedings of the5th European conference on Computer systems, Apr2010.
[19] K. J. Nesbit, N. Aggarwal, J. Laudon, and J. E.Smith. Fair Queuing Memory Systems. In MICRO 39:Proceedings of the 39th Annual IEEE/ACMInternational Symposium on Microarchitecture, 2006.
[20] K. J. Nesbit, J. Laudon, and J. E. Smith. Virtualprivate caches. ISCA ’07: Proceedings of the 34thannual international symposium on Computerarchitecture, 35(2), 2007.
[21] M. K. Qureshi and Y. N. Patt. Utility-Based CachePartitioning: A Low-Overhead, High-Performance,Runtime Mechanism to Partition Shared Caches.MICRO 39: Proceedings of the 39th AnnualIEEE/ACM International Symposium onMicroarchitecture, 2006.
[22] N. Rafique, W.-T. Lim, and M. Thottethodi.Architectural support for operating system-drivenCMP cache management. PACT ’06: Proceedings ofthe 15th international conference on Parallelarchitectures and compilation techniques, 2006.
[23] L. Soares, D. Tam, and M. Stumm. Reducing theharmful effects of last-level cache polluters with anOS-level, software-only pollute buffer. In MICRO ’08:Proceedings of the 2008 41st IEEE/ACM InternationalSymposium on Microarchitecture, 2008.
[24] G. E. Suh, S. Devadas, and L. Rudolph. A NewMemory Monitoring Scheme for Memory-AwareScheduling and Partitioning. In HPCA ’02:Proceedings of the 8th International Symposium onHigh-Performance Computer Architecture, 2002.
[25] K. Tian, Y. Jiang, and X. Shen. A study on optimallyco-scheduling jobs of different lengths on chipmultiprocessors. In CF ’09: Proceedings of the 6thACM conference on Computing frontiers, 2009.
[26] Y. Xie and G. H. Loh. Dynamic Classification ofProgram Memory Behaviors in CMPs. In The 2ndWorkshop on Chip Multiprocessor Memory Systemsand Interconnects, 2008.
[27] D. Xu, C. Wu, and P. Yew. On mitigating memorybandwidth contention through bandwidth-awarescheduling. . . . of the 19th international conference on. . . , Dec 2010.
[28] X. Zhang, S. Dwarkadas, and K. Shen. Towardspractical page coloring-based multicore cachemanagement. EuroSys ’09: Proceedings of the 4thACM European conference on Computer systems,2009.
[29] S. Zhuravlev, S. Blagodurov, and A. Fedorova.Addressing shared resource contention in multicoreprocessors via scheduling. In ASPLOS ’10:Proceedings of the fifteenth edition of ASPLOS onArchitectural support for programming languages andoperating systems, volume 38, 2010.