Rankings are the sorcerer’s new apprentice
27
ETHICS IN SCIENCE AND ENVIRONMENTAL POLITICS Ethics Sci Environ Polit Vol. 13: pp10, 2014 doi: 10.3354/esep00146 Published online March 25 INTRODUCTION In 1797, Goethe wrote a poem called ‘Der Zauber- lehrling’ - the sorcerer’s apprentice. In the poem, an old sorcerer leaves his apprentice to do chores in his workshop. Tired of mundanely fetching water, the apprentice enchants a broom to fetch a pail of water using magic in which he is not yet fully trained. Unable to stop the broom from bringing more and more water, the apprentice splits it into 2 with an axe, but then each piece becomes a new broom. With every swing of the axe, 2 brooms become 4, and 4 become 8. The apprentice is soon in a state of panic, unable to stop the tide. Just when the workshop is on the verge of being flooded, the sorcerer returns. The poem ends with the sorcerer chiding the apprentice and reminding him that ‘powerful spirits should only be called by the master himself’. With the passage of © Inter-Research 2014 · www.int-res.com *Corresponding author: [email protected] Rankings are the sorcerer’s new apprentice Michael Taylor 1, *, Pandelis Perakakis 2,3 , Varvara Trachana 4 , Stelios Gialis 5,6 1 Institute for Environmental Research and Sustainable Development (IERSD), National Observatory of Athens (NOA), Metaxa & Vas. Pavlou, Penteli, 15236 Athens, Greece 2 Department of Psychology, University of Granada, Campus Cartuja, 18071 Granada, Spain 3 Laboratory of Experimental Economics, Universitat Jaume I, 12071 Castellón, Spain 4 Laboratory of Animal Physiology, School of Biology, Aristotle University of Thessaloniki, University Campus, 54124 Thessaloniki, Greece 5 Department of Geography, University of Georgia, 210 Field St., Athens, Georgia 30601, USA 6 Hellenic Open University, Par. Aristotelous 18, 26331 Patras, Greece ABSTRACT: Global university rankings are a powerful force shaping higher education policy worldwide. Several different ranking systems exist, but they all suffer from the same mathemati- cal shortcoming - their ranking index is constructed from a list of arbitrary indicators combined using subjective weightings. Yet, different ranking systems consistently point to a cohort of mostly US and UK privately-funded universities as being the ‘best’. Moreover, the status of these nations as leaders in global higher education is reinforced each year with the exclusion of world-class uni- versities from other countries from the top 200. Rankings correlate neither with Nobel Prize win- ners, nor with the contribution of national research output to the most highly cited publications. They misrepresent the social sciences and are strongly biased towards English language sources. Furthermore, teaching performance, pedagogy and student-centred issues, such as tuition fees and contact time, are absent from the vast majority of ranking systems. We performed a critical and comparative analysis of 6 of the most popular global university ranking systems to help eluci- date these issues and to identify some pertinent trends. As a case study, we analysed the ranking trajectory of Greek universities as an extreme example of some of the contradictions inherent in ranking systems. We also probed various socio-economic and psychological mechanisms at work in an attempt to better understand what lies behind the fixation on rankings, despite their lack of validity. We close with a protocol to help end-users of rankings find their way back onto more meaningful paths towards assessment of the quality of higher education. KEY WORDS: Global university rankings · Higher education · Multi-parametric indices · Greek crisis · Education system · Policy · Perception · Value-based judgement Resale or republication not permitted without written consent of the publisher FREE REE ACCESS CCESS Contribution to the Theme Section ‘Global university rankings uncovered’
Transcript of Rankings are the sorcerer’s new apprentice

ETHICS IN SCIENCE AND ENVIRONMENTAL POLITICSEthics Sci Environ Polit
Vol. 13: pp10, 2014doi: 10.3354/esep00146
Published online March 25
INTRODUCTION
In 1797, Goethe wrote a poem called ‘Der Zauber-lehrling’ − the sorcerer’s apprentice. In the poem, anold sorcerer leaves his apprentice to do chores in hisworkshop. Tired of mundanely fetching water, theapprentice enchants a broom to fetch a pail of waterusing magic in which he is not yet fully trained.Unable to stop the broom from bringing more and
more water, the apprentice splits it into 2 with an axe,but then each piece becomes a new broom. Withevery swing of the axe, 2 brooms become 4, and 4become 8. The apprentice is soon in a state of panic,unable to stop the tide. Just when the workshop is onthe verge of being flooded, the sorcerer returns. Thepoem ends with the sorcerer chiding the apprenticeand reminding him that ‘powerful spirits should onlybe called by the master himself’. With the passage of
© Inter-Research 2014 · www.int-res.com*Corresponding author: [email protected]
Rankings are the sorcerer’s new apprentice
Michael Taylor1,*, Pandelis Perakakis2,3, Varvara Trachana4, Stelios Gialis5,6
1Institute for Environmental Research and Sustainable Development (IERSD), National Observatory of Athens (NOA), Metaxa & Vas. Pavlou, Penteli, 15236 Athens, Greece
2Department of Psychology, University of Granada, Campus Cartuja, 18071 Granada, Spain3Laboratory of Experimental Economics, Universitat Jaume I, 12071 Castellón, Spain
4Laboratory of Animal Physiology, School of Biology, Aristotle University of Thessaloniki, University Campus, 54124 Thessaloniki, Greece
5Department of Geography, University of Georgia, 210 Field St., Athens, Georgia 30601, USA6Hellenic Open University, Par. Aristotelous 18, 26331 Patras, Greece
ABSTRACT: Global university rankings are a powerful force shaping higher education policyworldwide. Several different ranking systems exist, but they all suffer from the same mathemati-cal shortcoming − their ranking index is constructed from a list of arbitrary indicators combinedusing subjective weightings. Yet, different ranking systems consistently point to a cohort of mostlyUS and UK privately-funded universities as being the ‘best’. Moreover, the status of these nationsas leaders in global higher education is reinforced each year with the exclusion of world-class uni-versities from other countries from the top 200. Rankings correlate neither with Nobel Prize win-ners, nor with the contribution of national research output to the most highly cited publications.They misrepresent the social sciences and are strongly biased towards English language sources.Furthermore, teaching performance, pedagogy and student-centred issues, such as tuition feesand contact time, are absent from the vast majority of ranking systems. We performed a criticaland comparative analysis of 6 of the most popular global university ranking systems to help eluci-date these issues and to identify some pertinent trends. As a case study, we analysed the rankingtrajectory of Greek universities as an extreme example of some of the contradictions inherent inranking systems. We also probed various socio-economic and psychological mechanisms at workin an attempt to better understand what lies behind the fixation on rankings, despite their lack ofvalidity. We close with a protocol to help end-users of rankings find their way back onto moremeaningful paths towards assessment of the quality of higher education.
KEY WORDS: Global university rankings · Higher education · Multi-parametric indices · Greekcrisis · Education system · Policy · Perception · Value-based judgement
Resale or republication not permitted without written consent of the publisher
FREEREE ACCESSCCESS
Contribution to the Theme Section ‘Global university rankings uncovered’

Ethics Sci Environ Polit 13: pp10, 20142
time, the ‘workshop’ has become a ‘cyberlab’ — adigital space teaming with data and information.Apprentices have come and gone, and the sorcererhas intervened to ensure that knowledge continuesto stably accumulate. But the latest apprentices,ranking agencies, are particularly careless. Theirlack of attention to mathematical and statistical pro-tocols has lured them into unfamiliar territory wheretheir numbers and charts are wreaking havoc. Thesorcerer may appear elusive but is still exerting apresence — some say on the semantic web, others sayin the truth or wisdom hiding behind the 1s and 0s;perhaps the sorcerer is the embodiment of qualityitself.
Global university rankings influence not only edu-cational policy decisions, but also the allocation offunds due to the wealth creation potential associatedwith highly skilled labour. In parallel, the status ofacademics working in universities is also beingranked via other single parameter indices like cita-tion impact. While it is now widely accepted that thejournal impact factor and its variants are unsoundmetrics of citation impact and should not be reliedupon to measure academic status (Seglen 1997,Bollen et al. 2005, 2009), university rankings are onlyrecently being subjected to criticism. Invented by themagazine US News & World Report in 1983 as a wayto boost sales, global university rankings are nowcoming under fire from scholars, investigators atinternational organisations like UNESCO (Marope2013) and the OECD (2006), and universities them-selves. In one significant public relations exercise, aset of guidelines known as ‘the Berlin Principles’(IREG 2006) were adopted. However, while theBerlin Principles were developed in an attempt toprovide quality assurance on ranking systems, theyare now being used to audit and approve rankings bytheir own lobby groups. Criticisms of global rankingshave led to regional and national ranking systemsbeing developed to help increase the visibility oflocal world-class universities that are being ex -cluded. In this paper, we analyse how and why thisstate of affairs has come about. We discuss whyglobal university rankings have led to a new orderingof the diverse taxonomy of academic institutions andfaculties, and how they have single-handedly cre-ated a monopoly ruled by Anglo-American universi-ties that is disjointed from the real global distributionof world-class universities, faculties and evencourses. We describe what mechanisms we believeare at play and what role they have played in helpingcreate the current hierarchy. We also discuss theeffect that the omnipotence of rankings is having on
higher education at the national and local level, andwe delve into the underlying problem of why theconstruction of indices from a multitude of weightedfactors is so problematic. ‘Not everything that countscan be counted; not everything that can be countedcounts’ (Cameron 1963).1
The layout of this paper is as follows. First, we com-pare and contrast 6 of the most popular global uni-versity ranking systems in order to provide anoverview of what they measure. With publishedrankings for 2012 as a context, we then analyse thenational and continental composition of the top 200universities as well as the top 50 universities by sub-ject area/faculty, to highlight and explain someimportant new trends. The next section is devoted toa case study of the 10 yr ranking trajectory of univer-sities in one country, Greece, chosen to investigatethe impact of serious economic restructuring onhigher education. This is followed by a discussion ofsome of the possible mechanisms at work, whereinwe identify the problems associated with the currentapproach for constructing multi-parametric rankingindices. Finally, we draw some conclusions and pres-ent a protocol that we hope will help end-users ofrankings avoid many pitfalls.
RANKMART
The publishing of global university rankings, con-ducted by academics, magazines, newspapers, web-sites and education ministries, has become a multi-million dollar business. Rankings are acquiring aprominent role in the policies of university adminis-trators and national governments (Holmes 2012),whose decisions are increasingly based on a‘favourite’ ranking (Hazelkorn 2013). Rankings areserious business; just how serious, is exemplified byBrazil, Russia, India and China (collectively, the‘BRIC’ countries). Brazil’s Science without BordersProgramme for 100 000 students comprises a gigantic£1.3 billion (US$2 billion) fund that draws heavily onthe Times Higher Education Ranking to select hostinstitutions. Russia’s Global Education Programmehas set aside an astonishing 5 billion Roubles(US$152 million) for study-abroad scholarships fortens of thousands of students who must attend a uni-versity in the top 200 of a world ranking. India’s Uni-versities Grants Commission recently laid down a
1See http:// quoteinvestigator. com/ 2010/ 05/ 26/ everything-counts-einstein/ for a detailed discussion.

Taylor et al.: Rankings: the sorcerer’s new apprentice
new set of rules to ensure that only top 500 universi-ties are entitled to run joint degree or twinningcourses with Indian partners (Baty 2012). On 4 May1998, Project 985 was initiated by the Chinese gov-ernment in order to advance its higher education sys-tem. Nine universities were singled out and named‘the C9 league’ in analogy to the US ‘Ivy League’.They were allocated funding totalling 11.4 billionYuan Renminbi (US$1.86 billion) and as of 2010made a spectacular entry into global university rank-ings. Of the C9 League, Peking University andTsinghua University came in at 44th and 48th posi-tion, respectively, in the QS World Universities Rank-ing in 2012. Incidentally, these 2 universities havespawned 63 and 53 billionaires according to theForbes magazine, and China is currently the onlycountry making ranking lists for colleges and univer-sities according to the number of billionaires theyhave produced.
Rankings can be either national or global in scope.National university rankings tend to focus more oneducation as they cater primarily to aspiring studentsin helping them choose where to study. The US Newsand World Report for example, ranks universities inthe US using the following percentage-weighted fac-tors: student retention rate (20%), spending per stu-dent (10%), alumni donations (5%), graduation rate(5%), student selectivity (15%), faculty resources(20%) and peer assessment (25%). In the UK, TheGuardian newspaper publishes The UniversityGuide, which has many similar indicators, and alsoincludes a factor for graduate job prospects (weighted17%). Global university rankings differ greatly fromnational rankings, and place emphasis on researchoutput. Global university ranking agencies justify notfocussing on education with claims such as, ‘edu -cation systems and cultural contexts are so vastly dif-ferent from country to country’ (Enserink 2007,p. 1027) — an admission that these things are difficultto compare. But isn’t this precisely one of the factorsthat we would hope a university ranking would re-flect? We shall see that conundrums such as this areabound in relation to global university rankings.
A logical assessment of global university rankingsrequires an understanding of (1) what they measure,(2) how they are constructed, (3) how objective theyare and (4) how they can be improved, if at all. Since2003, 6 ranking systems have come to dominate:
(1) the Chinese Jiao Tong University’s 2003−2013Academic Ranking of World Universities (‘ARWURanking’ or ‘Shanghai Ranking’; www. arwu. org/)
(2) the British 2010−2013 Times Higher Educa-tion World University Rankings (or ‘THE Ranking’;
www. timeshighereducation. co. uk/ world-university-rankings/)
(3) the Taiwanese National Technical University’s2007−2012 Performance Ranking of Scientific Papersfor world universities published by the Higher Edu-cation Evaluation and Accreditation Council of Tai-wan (‘HEEACT Ranking’; http:// nturanking. lis. ntu.edu. tw/ Default. aspx)
(4) the US 2004−2013 Quacquarelli-Symonds TopUniversities Ranking published by the US News andWorld Report (or ‘QS Ranking’; www.topuniversi-ties.com/)
(5) the Spanish 2004−2013 Webometrics Ranking ofWorld Universities produced by the CybermetricsLab, a unit of the Spanish National Research Council(CSIC) (or ‘Ranking Web’; http:// webo metrics. info)
(6) the Dutch 2012−2013 Centre for Science andTechnology Studies Ranking (‘CSTS Ranking’ or‘Leiden Ranking’; www. leidenranking. com).
All of these systems aim to rank universities in amulti-dimensional way based on a set of indicators.In Table 1, we tour the ‘supermarket aisle’ of globaluniversity rankings we call Rankmart.
We constructed Rankmart by collecting free onlineinformation provided from the 6 ranking systemsabove for the year 2012. We focused on the indicatorsthey use and how they are weighted with percent-ages to produce the final ranking. In addition toranking universities, the ranking systems also rankspecific programmes, departments and schools/fac-ulties. Note that the Leiden Ranking uses a countingmethod to calculate its ranks instead of combiningweighted indicators (Waltman et al. 2012); as such,no percentage weightings are provided. We alsohave grouped the indicators into the following gen-eral categories: (1) teaching, (2) international out-look, (3) research, (4) impact and (5) prestige, inaccordance with the rankings’ own general classifi-cation described in the methodology sections of theirwebsites. This, in itself, presents a problem that hasto do with mis-categorisation. For example, it is diffi-cult to understand why the QS ranking systemassigns the results of ‘reputation’ surveys to ‘pres-tige’, or why the THE ranking system assigns the sur-vey results to ‘teaching’ or ‘research’ categories. Inaddition, there is obviously great diversity in themethodologies used by the different ranking sys-tems. What this reflects is a lack of consensus overwhat exactly constitutes a ‘good’ university. Beforedelving into macroscopic effects caused by rankingsin the next section, it is worth considering exactlywhat ranking systems claim to measure, and whetherthere is any validity in the methodology used.
3

Ethics Sci Environ Polit 13: pp10, 20144T
able
1. R
ank
mar
ta c
omp
aris
on o
f th
e in
dic
ator
s u
sed
by
6 d
iffe
ren
t glo
bal
un
iver
sity
ran
kin
g s
chem
es to
mea
sure
the
‘qu
alit
y’ o
f un
iver
siti
es. V
alu
es w
ith
in c
olu
mn
hea
din
gs
are
un
iver
siti
es a
nal
ysed
an
d u
niv
ersi
ties
ran
ked
(b
old
). I
nd
icat
ors
are
gro
up
ed b
y ty
pe
(Tea
chin
g,
Inte
rnat
ion
al O
utl
ook
, R
esea
rch
, Im
pac
t an
d P
rest
ige)
acc
ord
ing
to
the
ran
kin
g s
yste
ms’
ow
n c
lass
ific
atio
n.
Per
cen
tag
es r
efer
to
the
wei
gh
tin
g o
f ea
ch g
iven
in
dic
ator
use
d b
y ea
ch r
ank
ing
sys
tem
. S
&S
SC
I is
th
e co
mb
ined
sci
ence
an
d s
ocia
l sc
ien
ce c
itat
ion
ind
ex p
ub
lish
ed b
y T
hom
son
-Reu
ters
. Th
e h
-in
dex
is t
he
Hir
sch
ind
ex o
r H
irsc
h n
um
ber
Ind
icat
orT
HE
(20
12/2
013)
(%
)A
RW
U (
2011
) (%
)H
EE
AC
T (
2011
) (%
)Q
S (
2012
/201
3) (
z-sc
ores
)W
ebom
etri
cs (
log
-nor
mal
)L
eid
en (
2013
) (%
)
2000
3000
3500
2000
1700
0
500+
%50
0%
500
%40
0%
6000
%50
0%
Tea
chin
g 1
Lec
ture
rs t
o st
ud
ent
rati
o4.
50A
lum
ni
Nob
el p
rize
s&
Fie
lds
med
als
10.0
0F
acu
lty
to s
tud
ent
rati
o20
.00
Tea
chin
g 2
Aca
dem
ic r
epu
tati
onsu
rvey
15.0
0
Tea
chin
g 3
Ph
D t
o B
Sc
rati
o2.
25
Tea
chin
g 4
Ph
Ds
per
dis
cip
lin
e6.
00
Tea
chin
g 5
Inst
itu
tion
al i
nco
me
tost
aff
rati
o2.
25
Inte
rnat
ion
alou
tloo
k 1
Inte
rnat
ion
al t
o d
omes
tic
stu
den
t ra
tio
2.50
Inte
rnat
ion
al t
od
omes
tic
stu
den
tra
tio
5.00
Pro
por
tion
of
inte
rna-
tion
al c
olla
bor
ativ
ep
ub
lica
tion
s
Inte
rnat
ion
alou
tloo
k 2
Inte
rnat
ion
al t
o d
omes
tic
staf
f ra
tio
2.50
Inte
rnat
ion
al t
od
omes
tic
staf
f ra
tio
5.00
Mea
n g
eog
rap
hic
alco
llab
orat
ion
dis
tan
ce(k
m)
Inte
rnat
ion
alou
tloo
k 3
Pro
por
tion
of
pu
bli
cati
ons
wit
h >
1 in
tern
atio
nal
co-a
uth
or
2.50
Res
earc
h 1
Aca
dem
ic r
epu
tati
onal
surv
ey18
.00
Nat
ure
& S
cien
cear
ticl
es20
.00
Art
icle
s in
las
t 11
year
s in
S&
SS
CI
10.0
0P
rop
orti
on o
f in
ter-
inst
itu
tion
al c
olla
bor
a-ti
ve p
ub
lica
tion
s
Res
earc
h 2
Res
earc
h i
nco
me
(sca
led
)6.
00A
rtic
les
in S
&S
SC
I20
.00
Art
icle
s in
cu
rren
tye
ar i
n S
&S
SC
I10
.00
Pro
por
tion
of
coll
abo-
rati
ve p
ub
lica
tion
s w
ith
ind
ust
ry
Res
earc
h 3
Art
icle
s p
er d
isci
pli
ne
6.00
Imp
act
1C
itat
ion
im
pac
t (n
or-
mal
ised
ave
rag
e ci
tati
onp
er a
rtic
le)
30.0
0H
igh
ly c
ited
rese
arch
ers
20.0
0C
itat
ion
s in
las
t 11
year
s in
S&
SS
CI
10.0
0S
CIV
ER
SE
SC
OP
US
Cit
atio
ns
per
fac
ult
y20
.00
Web
pag
es i
n t
he
mai
n w
eb d
omai
n16
.66
Pro
por
tion
of
10%
of
hig
hly
cit
ed a
rtic
les
Imp
act
2C
itat
ion
s in
las
t 2
year
s in
S&
SS
CI
10.0
0D
epos
ited
sel
f-ar
chiv
ed f
iles
16.6
6M
ean
cit
atio
n s
core
Imp
act
3A
vera
ge
cita
tion
s in
last
11
year
s in
S&
SS
CI
10.0
0A
rtic
les
in t
op10
% o
f h
igh
lyci
ted
art
icle
s
16.6
6M
ean
cit
atio
n s
core
(fie
ld n
orm
alis
ed)
Imp
act
4E
xter
nal
in
-lin
ks
to U
niv
ersi
ty50
.00
Pre
stig
e 1
Ind
ust
ry i
nco
me
2.50
Fac
ult
y N
obel
pri
zes
& F
ield
s m
edal
s20
.00
h-i
nd
ex o
f th
e la
st 2
year
s20
.00
Aca
dem
ic r
epu
tati
onsu
rvey
40.0
0
Pre
stig
e 2
Aca
dem
ic p
erfo
rm-
ance
wit
h r
esp
ect
tosi
ze o
f in
stit
uti
on
10.0
0N
um
ber
of
hig
hly
cite
d a
rtic
les
in l
ast
11 y
ears
15.0
0E
mp
loye
r re
pu
tati
onsu
rvey
10.0
0
Pre
stig
e 3
Nu
mb
er o
f ar
ticl
es i
ncu
rren
t ye
ar i
n h
igh
imp
act
jou
rnal
s
15.0
0

Taylor et al.: Rankings: the sorcerer’s new apprentice
‘The Berlin Quarrel’ and methodological faux pas
Global university rankings aim to capture a com-plex reality in a small set of numbers. This imposesserious limitations. As we shall see, the problem issystemic. It is a methodological problem related tothe way the rankings are constructed. In this paper,we will not therefore assess the pros and cons of thevarious rankings systems. This has been done to avery high standard by academic experts in the fieldand we refer the interested reader to their latest ana -lyses (Aguillo et al. 2010, Hazelkorn 2013, Marope2013, Rauhvargers 2013). Instead, here we focus ontrying to understand the problems associated withmulti-parametric ranking systems in general.
No analysis would be complete without taking alook at how it all began. The first global universityranking on the scene was the ARWU Ranking, whichwas introduced in 2003. Being the oldest, it hastaking a severe beating and has possibly been over-criticized with respect to other systems. A tirade of ar-ticles has been published that reveal how the weightsof its 6 constituent indicators are completely arbitrary(Van Raan 2005, Florian 2007, Ioannidis et al. 2007,Billaut et al. 2009, Saisana et al. 2011). Of course, thisis true for all ranking systems that combine weightedparameters. What makes the ARWU Ranking uniqueis that its indicators are based on Nobel Prizes andFields Medals as well as publications in Nature andScience. One problem is that prestigious academicprizes reflect past rather than current performanceand hence disadvantage younger universities (En-serink 2007). Another problem is that they are inher-ently biased against universities and faculties spe-cialising in fields where such prizes do not apply. Thefact that Nobel Prizes bagged long ago also count hasled to some interesting dilemmas. One such conun-drum is ‘the Berlin Quarrel’, a spat be tween the FreeUniversity of West Berlin and the Humboldt Univer-sity on the other side of the former Berlin Wall overwho should take the credit for Albert Einstein’s NobelPrizes. Both universities claim to be heirs of the Uni-versity of Berlin where Einstein worked. In 2003, theARWU Ranking assigned the pre-war Einstein NobelPrizes to the Free University, causing it to come in at arespectable 95th place on the world stage. But thenext year, following a flood of protests from HumboldtUniversity, the 2004 ARWU Ranking assigned theNobel Prizes to Humboldt instead, causing it to takethe 95th place. The disenfranchised Free Universitycrashed out of the top 200. Following this controversy,the ARWU Ranking solved the problem by removingboth universities from their rankings (Enserink 2007).
Out of the 736 Nobel Prizes awarded up until Jan-uary 2003, some 670 (91%) went to people fromhigh-income countries (the majority to the USA),3.8% to the former Soviet Union countries, and just5.2% to all other emerging and developing nations(Bloom 2005). Furthermore, ranking systems like theARWU Ranking rely on Nature and Science asbenchmarks of research impact and do not take intoaccount other high-quality publication routes avail-able in fields outside of science (Enserink 2007). TheARWU Ranking is also biased towards large univer-sities, since the academic performance per capitaindicator depends on staff numbers that vary consid-erably between universities and countries (Zitt & Filliatreau 2007). The ARWU Ranking calculationsfavour large universities that are very strong in thesciences, and from English-language nations (mainlythe US and the UK). This is because non-English lan-guage work is published less and cited less (Margin-son 2006a). A second source of such country bias isthat the ARWU Ranking is driven strongly by thenumber of Thomson/ISI ‘HighCi’ (highly-cited) re -searchers. For example, there are 3614 ‘HighCi’researchers in the US, only 224 in Germany and 221in Japan, and just 20 in China (Marginson 2006a). Itis no surprise that in the same year global universityrankings were born; UNESCO made a direct linkbetween higher education and wealth production:‘At no time in human history was the welfare ofnations so closely linked to the quality and outreachof their higher education systems and institutions’(UNESCO 2003).
As Rankmart shows, different ranking systems usea diverse range of indicators to measure differentaspects of higher education. The choice of indicatorsis decided by the promoters of each system, witheach indicator acting as a proxy for a real objectbecause often no direct measurement is available(e.g. there is no agreed way to measure the quality ofteaching and learning). Each indicator is also consid-ered independently of the others, although in realitythere is some co-linearity and interaction betweenmany if not all of the indicators. For example, olderwell-established private universities are more likelyto have higher faculty:student ratios and per studentexpenditures compared with newer public institu-tions or institutions in developing countries. The indi-cators are usually assigned a percentage of the totalscore, with research indicators in particular beinggiven the highest weights. A final score that claims tomeasure academic excellence is then obtained byaggregating the contributing indicators. The scoresare then ranked sequentially.
5

Ethics Sci Environ Polit 13: pp10, 2014
With such high stakes riding on university rank-ings, it is not surprising that they have caught theattention of academics interested in checking thevalidity of their underlying assumptions. To performa systemic analysis, we refer to Rankmart again andgroup indicators by what they claim to measure. Thisallows us to assess the methodological problems, notof each ranking system, but of the things they claimto measure. Our grouping of methodological prob-lems is as follows: (1) research prestige, (2) reputa-tion analysis via surveys and data provision, (3)research citation impact, (4) educational demograph-ics, (5) income, (6) web presence.
Methodological problem 1: Research prestigemeasures are biased
This is only relevant to the ARWU Ranking, whichuses faculty and alumni Nobel Prizes and FieldsMedals as indicators weighted at 20% and 10% of itsoverall rank, respectively. A further 20% comes fromthe number of Nature and Science articles producedby an institution. In the previous section, we dis-cussed how huge biases and methodological prob-lems are associated with using science prizes andpublications in the mainstream science press. On thisbasis, 50% of the ARWU Ranking is invalidated.
Methodological problem 2: Reputational surveysand data sources are biased
Rankings use information from 4 main sources: (1)government or ministerial databases, (2) proprietarycitation databases such as Thompson-Reuters Web ofKnowledge and ISI’s Science and Social ScienceCitation Index (S&SSCI), Elsevier’s SCOPUS andGoogle Scholar, (3) institutional data from univer -sities and their departments and (4) reputation sur-veys (by students, academic peers and/or employers;Hazelkorn 2013). However, the data from all of thesesources are strongly inhomogeneous. For example,not all countries have the same policy instruments inplace to guarantee public access and transparency totest the validity of governmental data. Proprietarycitation databases are not comprehensive in theircoverage of journals, in particular open-access jour-nals, and are biased towards life and natural sciencesand English language publications (Taylor et al.2008). The data provided by institutions, while gen-erally public, transparent and verifiable, suffer fromwhat Gladwell (2011, p. 8) called ‘the self-fulfilling
pro phecy’ effect: many rankings rely on universitiesthemselves to provide key data − which is like mak-ing a deal with the devil.
There are many documented cases of universitiescheating. For example, in the US News & WorldReport rankings, universities started encouragingmore applications just so they could reject more stu-dents, hence boosting their score on the ‘studentselectivity’ indicator (weighted 15%; Enserink 2007).Systems like the THE Ranking are therefore subjectto a biasing positive feedback loop that inflates theprestige of well-known universities (Ioannidis et al.2007, Bookstein et al. 2010, Saisana et al. 2011).
Reputational surveys, a key component of manyrankings, are often opaque and contain strong sam-pling errors due to geographical and linguistic bias(Van Raan 2005). Another problem is that reputationsurveys favour large and older, well-established uni-versities (Enserink 2007) and that ‘reputational rank-ings recycle reputation’. Also, it is not specified whois surveyed or what questions are asked (Marginson2006b). Reputation surveys also protect known repu-tations. One study of rankings found that one-third ofthose who responded to the survey knew little aboutthe institutions concerned apart from their own (Mar-ginson 2006a). The classical example is the Americansurvey of students that placed Princeton law schoolin the Top 10 law schools in the country. But Prince-ton did not have a Law school (Frank & Cook 1995).Reputational ratings are simply inferences frombroad, readily observable features of an institution’sidentity, such as its history, its prominence in themedia or the elegance of its architecture. They areprejudices (Gladwell 2011). And where do thesekinds of reputational prejudices come from? Rank-ings are heavily weighted by reputational surveyswhich are in turn heavily influenced by rankings. It isa self-fulfilling prophecy (Gladwell 2011). The onlytime that reputation ratings can work is when theyare one-dimensional. For example, it makes sense toask professors within a field to rate other professorsin their field, because they read each other’s work,attend the same conferences and hire one another’sgraduate students. In this case, they have real knowl-edge on which to base an opinion. Expert opinion ismore than a proxy. In the same vein, the extent towhich students chose one institute over another toenhance their job prospects based on the views ofcorporate recruiters is also a valid one-dimensionalmeasure.
Finally, there are also important differences in thelength of the online-accessible data record of eachinstitution and indeed each country due to variation
6

Taylor et al.: Rankings: the sorcerer’s new apprentice
in age and digitization capability. The volume ofavailable data also varies enormously according tolanguage. For example, until recently, reputationsurveys were conducted in only a few languages.The THE Ranking only now has starting issuing themin 9 languages. Issues such as these prevent normal-isation to remove such biases. National rankings, log-ically, are more homogeneous. Institutional data andin particular reputational surveys provided by uni-versities themselves are subject to huge bias as thereis an obvious conflict of interest. Who can check alle-gations of ‘gaming’ or data manipulation? It has beensuggested that proxies can avoid such problems, forexample, with research citation impact replacingacademic surveys, student entry levels replacing stu-dent selectivity; faculty to student ratios replacingeducation performance, and institutional budgetsreplacing infrastructure quality. However, even inthis case, what is the guarantee that such proxies areindependent, valid measures? And, more impor-tantly, the ghost of weightings comes back to haunteven proxies for the real thing.
For example, the THE Ranking assigns an aston-ishing 40% to the opinions of more than 3700 aca-demics from around the globe, and the judgement ofrecruiters at international companies is worthanother 10%, i.e. together, they make up half of thetotal ranking. However, when researchers from theCentre for Science and Technology Studies (CWTS)at Leiden University in the Netherlands comparedthe reviewers’ judgements with their own analysisbased on counting citations to measure scholarlyimpact, they found no correlation whatsoever.
Two ranking systems place large emphasis on reputational surveys: (1) QS (faculty reputation froma survey of peers = 40%, institutional reputation froma survey of employers = 10%); (2) THE (faculty rep-utation from a survey of peers = 18%, faculty teach-ing reputation from a survey of peers = 15%). Themethodological problems described above mean that50% of the QS Ranking and 33% of the THE Rankingare invalidated.
Methodological problem 3: Research citation impactis biased
The ranking systems assess research citationimpact by the volume of published articles and thecitations they have received. All ranking systems usedata provided by Thomson-Reuters’ S&SSCI reportswith the exception of the QS Ranking that uses dataprovided by Elsevier’s SCOPUS Sciverse. Some
rankings use the total number of articles publishedby an institution (ARWU: 20%), normalised by disci-pline (THE: 6%), the fraction of institutional articleshaving at least one international co-author (THE:2.5%, Leiden), or the number of institutional articlespublished in the current year (HEEACT: 10%) or thelast 11 yr (HEEACT: 10%). Citations are used by allranking systems in various ways:• HEEACT (last 11 yr = 10%, last 2 yr = 10%, 11 yraverage = 10%, 2 yr h-index = 20%, ‘HighCi’ articlesin last 11 yr = 15%, current year high impact factorjournal articles = 15%)• ARWU (number of ‘HighCi’ researchers = 20%,per capita academic performance = 10%)• QS (citations per faculty = 20%)• THE (average citation impact = 30%)• WEBOMETRICS (‘HighCi’ articles in top 10% =16.667%)• Leiden (‘HighCi’ articles in top 10%, mean citationscore and normalised by field, fraction of articles with>1 inter-institutional collaboration, fraction of articleswith >1 industry collaboration).
However, serious methodological problems under-pin both counts of articles and citations. Journalimpact factors have been found to be invalid meas-ures (Seglen 1997, Taylor et al. 2008, Stergiou &Lessenich 2013 this Theme Section).
Citation data themselves are considered only to bean approximately accurate measure of impact forbiomedicine and medical science research, and theyare less reliable for natural sciences and much lessreliable for the arts, humanities and social sciencedisciplines (Hazelkorn 2013). While some rankingsystems normalise citation impact for differences incitation behaviour between academic fields, theexact normalisation procedure is not documented(Waltman et al. 2012). It has also been demonstratedthat different faculties of a university may differ sub-stantially in their levels of performance and hence itis not advisable to draw conclusions about subjectareas/faculty performance based on the overall per-formance of a university (López-Illescas et al. 2011).Subject area bias also creeps in for other reasons.The balance of power shifts between life and naturalscience faculties and arts, humanities and social sci-ence faculties. Since citations are based predomi-nantly on publications in English language journals,and they rarely acknowledge vernacular languageresearch results, especially for papers in social sci-ences and humanities. The knock-on effect is disas-trous as faculty funding is diverted from humanitiesand social sciences to natural and life sciences toboost university rankings (Ishikawa 2009).
7

Ethics Sci Environ Polit 13: pp10, 20148
It is therefore obvious that another significant sourceof bias is due to linguistic preference in publications.For example, 2 recent publications have shown a sys-tematic bias in the use of citation data analysis for theevaluation of national science systems (Van Leeuwenet al. 2001) with a strong negative bias in particularagainst France and Germany (Van Raan et al. 2011).The emergence of English as a global academic lan-guage has handed a major rankings advantage to uni-versities from nations whose first language is English.Furthermore, many good scholarly ideas conceived inother linguistic frames are not being recognized glob-ally (Marginson 2006a). Approximately 10 times asmany books are translated from English to other lan-guages as are translated from other languages intoEnglish (Held et al. 1999). Here, the global reliance onEnglish is driven not by the demographics of languageitself but by the weight of the Anglo-American blocwithin global higher education, the world economy,cultural industries and the Internet (Marginson 2006c).In terms of demographics, English is only one of thelanguages spoken by a billion people; the other is Pu-tonghua (‘Mandarin’ Chinese). In addition, 2 pairingsof languages are spoken by more than half a billionpeople: Hindi/Urdu and Spanish/ Portuguese (Margin-son 2006a). Global rankings must account for the biasdue to the effect of English (Marginson 2006a). An in-teresting measure introduced by the Leiden Rankingis the mean geographical collaboration distance in km.We are not clear how this relates to quality but are in-terested nonetheless in what it is able to proxy for.These examples give a flavour of some of the difficul-ties encountered when trying to perform quantitativeassessments of qualitative entities like quality or inter-nationality for that matter (Buela-Casal et al. 2006).
It is also wrong to assume that citations reflectquality in general. For example, there are a numberof interesting cases of highly-cited articles that createhuge bias. Some issues:
(1) Huge authorship lists can include severalresearchers from the same institute; for example,2932 authors co-authored the ATLAS collaborationpaper announcing the discovery of the Higgs boson(Van Noorden 2012). The geographical distributionof authors in very high-profile articles like this cancreate a large biasing effect at the departmental,institutional and country level.
(2) Retracted articles do not mean that citationsalso get subtracted; for example, the anaesthesiolo-gist Yoshitaka Fujii is thought to have fabricatedresults in 172 publications (Van Noorden 2012). Thisraises the questions: Should citations to these articlesbe deducted from institutes where he worked?
(3) Incorrect results can generate citations thatlater become irrelevant to quality; e.g. by March2012 as a result of a Twitter open commentary,researchers overturned the 2011 suggestion thatneutrinos might travel faster than light. In anothercase, the 2010 claim that a bacterium can use arsenicin its DNA was also refuted (Van Noorden 2012).Recent efforts like the Reproducibility Initiative thatencourages independent labs to replicate high-pro-file research support the view that this is a crucialissue. Furthermore, it is vital so that science can self-correct. It also requires that results are both visibleand openly accessible. In this regard, scholars havestarted launching open-access journals such as eLifeand PeerJ and are pressuring for the issuing of self-archiving mandates at both the institutional and thenational level.
Finally, citations are reliant on the visibility andopen access of the hosting publication (Taylor et al.2008). A particularly dangerous development is thatThomson-Reuters is the sole source of citation datafor the majority of the ranking systems. The idea thata single organisation is shaping rankings — andhence policy-making and higher education practicesaround the world — is not an attractive one (Holmes2012). A very dark recent development reveals theimplication of rankings in ethical and ethnographicaldecision-making:
In 2010, politicians in Denmark suggested using gradu-ation from one of the top 20 universities as a criterion forimmigration to the country. The Netherlands has goneeven further. To be considered a ‘highly skilled migrant’you need a masters degree or doctorate from a recog-nised Dutch institution of higher education listed in theCentral Register of Higher Education Study Pro-grammes (CROHO) or a masters degree or doctoratefrom a non-Dutch institution of higher education whichis ranked in the top 150 establishments in either theTimes Higher Education 2007 list or the AcademicRanking of World Universities 2007 issued by Jiao TonShanghai University [sic] in 2007 (Holmes 2012).
The methodological problems described abovemean that 80% of the HEEACT Ranking, 30% of theARWU Ranking, 20% of the QS Ranking, 30% of theTHE Ranking, 16.667% of the Webometrics Rankingand potentially the entire Leiden Ranking are invali-dated.
Methodological problem 4: Proxies do not implyquality teaching
Two ranking systems include weighted indicatorsrelated to educational demographics. They classify
Taylor et al.: Rankings: the sorcerer’s new apprentice
these as measures of ‘teaching’. The THE Rankingincludes the number of PhDs per discipline (6%)and a number of ratios: lecturers:student (4.5%),PhDs: BScs (2.25%), international:domestic students(2.5%) and international:domestic staff (2.5%) — asizeable 17.75% of their score. The QS Ranking alsoincludes a number of common ratios: lecturers:stu-dent (20%), international:domestic students (2.5%)and international:domestic staff (2.5%) — again, asizeable 25% of their score. A serious problem isthat teaching quality cannot be adequately assessedusing student:staff ratios (Marginson 2006a). Fur-thermore, all ranking systems make the mistakethat high-impact staff equates with high-qualityteaching. The latter problem is also present in theWebometrics Ranking. Until a quantitative linkbetween citation metrics and/or alt-metrics (down-load and web-usage statistics) and quality is estab-lished and validated, such ratings cannot be reliedupon (Waltman et al. 2012).
We have seen that rankings focus disproportion-ately on research compared to proxies for teaching.This is due to the fact that citation impact data, whichare claimed to be a good proxy of research quality,are available (to some extent). Furthermore, rankingsfall into the trap of making a huge and erroneousassumption, namely that research quality is an indi-cator of higher educational performance in general.This simply ignores the fuller extent of higher edu -cation activity that includes teaching and learning,the student experience and student ‘added value’such as personal development. Moreover, Rankmartshows that research indicators account for 100% ofindicators used by the ARWU Ranking, 100% of theHEEACT Ranking, 62.5% of the THE Ranking, 33%of the Webometrics Ranking and 20% of the QSRanking.
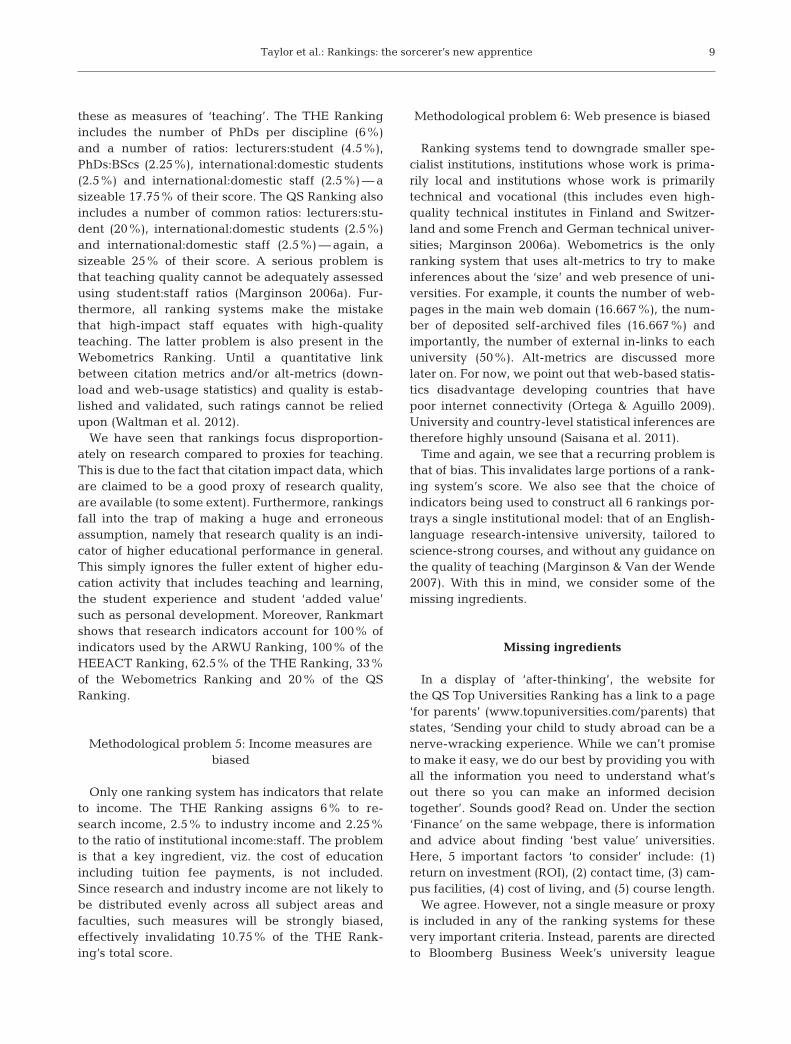
Methodological problem 5: Income measures arebiased
Only one ranking system has indicators that relateto income. The THE Ranking assigns 6% to re -search income, 2.5% to industry income and 2.25%to the ratio of institutional income:staff. The problemis that a key ingredient, viz. the cost of educationincluding tuition fee payments, is not included.Since research and industry income are not likely tobe distributed evenly across all subject areas andfaculties, such measures will be strongly biased,effectively invalidating 10.75% of the THE Rank-ing’s total score.
Methodological problem 6: Web presence is biased
Ranking systems tend to downgrade smaller spe-cialist institutions, institutions whose work is prima-rily local and institutions whose work is primarilytechnical and vocational (this includes even high-quality technical institutes in Finland and Switzer-land and some French and German technical univer-sities; Marginson 2006a). Webometrics is the onlyranking system that uses alt-metrics to try to makeinferences about the ‘size’ and web presence of uni-versities. For example, it counts the number of web-pages in the main web domain (16.667%), the num-ber of deposited self-archived files (16.667%) andimportantly, the number of external in-links to eachuniversity (50%). Alt-metrics are discussed morelater on. For now, we point out that web-based statis-tics disadvantage developing countries that havepoor internet connectivity (Ortega & Aguillo 2009).University and country-level statistical inferences aretherefore highly unsound (Saisana et al. 2011).
Time and again, we see that a recurring problem isthat of bias. This invalidates large portions of a rank-ing system’s score. We also see that the choice ofindicators being used to construct all 6 rankings por-trays a single institutional model: that of an English-language research-intensive university, tailored toscience-strong courses, and without any guidance onthe quality of teaching (Marginson & Van der Wende2007). With this in mind, we consider some of themissing ingredients.
Missing ingredients
In a display of ‘after-thinking’, the website forthe QS Top Universities Ranking has a link to a page‘for parents’ (www.topuniversities.com/parents) thatstates, ‘Sending your child to study abroad can be anerve-wracking experience. While we can’t promiseto make it easy, we do our best by providing you withall the information you need to understand what’sout there so you can make an informed decisiontogether’. Sounds good? Read on. Under the section‘Finance’ on the same webpage, there is informationand advice about finding ‘best value’ universities.Here, 5 important factors ‘to consider’ include: (1)return on investment (ROI), (2) contact time, (3) cam-pus facilities, (4) cost of living, and (5) course length.
We agree. However, not a single measure or proxyis included in any of the ranking systems for thesevery important criteria. Instead, parents are directedto Bloomberg Business Week’s university league
9

Ethics Sci Environ Polit 13: pp10, 2014
table of the US colleges with the best ROI and to aParthenon Group UK publication that ranks the top30 best-value universities based on graduates’ aver-age salaries. Outside the US and the UK, no data areprovided. No measure is offered to reflect the timestudents can expect to have with teaching staff, thenumber of lectures and the class size. Indeed, criticsof rising tuition fees for domestic students havepointed out that since the fee increased from £1000 to£3000 and now stands at £9000 per year in the UK,students have not benefitted from more contact timewith teaching staff. This is based on a survey con-ducted by the Higher Education Policy Institute(HEPI), which also found that students with the low-est number of timetabled classes per week were themost likely to be unhappy with the quality of theircourse. The QS Ranking website states in regard tocampus facilities, ‘The quality of the learning envi-ronment will make a big difference to your universityexperience, and could even have an impact on thelevel of degree you graduate with’.
Yet, none of this is captured by any indicator. Withregard to cost of living, parents are directed to Mer-cer’s Cost of Living report; again, no indication of howthis compares among institutions. Most shocking of allis what is said in relation to the length of courses:‘There are schemes that allow students to pay per-year or per-semester and the choice of fast-track de-grees offered by some universities which allow stu-dents to graduate in as little as two years. Completingyour degree more quickly could save you a significantamount — in both fees and living expenses’.
What about the quality of this form of condensededucation? Once again, no incorporation of this infor-mation is available via either a proxy or an indicator.For graduate students, the QS Ranking page for par-ents points them to the QS World University Rank-ings by Subject and reminds them that there are dif-ferential fees. There is advice on how to apply for ascholarship, support services you can expect fromyour university as an international student, and evena country guide — which reads like a copy-pastefrom WikiTravel rather than a serious metric analysis.The 5 steps to help you choose are: (1) use the univer-sity ranking, (2) refer to QS stars (research quality,teaching quality, graduate employability, specialistsubject, internationalization, infrastructure, commu-nity en gagement and innovation), (3) read expertcommentary (follow articles written by people whoknow a lot about higher education, and are able tooffer advice and speculate about future develop-ments, follow tweets from experts in the sector onTwitter, or keep up-to-date with research on whether
or not universities are set to increase their fees or cutbudgets), (4) attend university fairs and (5) researchinto the location (climate, principal and secondarylanguages, available music/sports/social scenes — allvery important — and totally absent from rankingindicators. The QS Ranking is not alone. None of theranking systems consider any of these issues that arevery much at the forefront of the minds of studentsand parents.
As we have seen, ranking algorithms rely heavilyon proxies for quality, but the proxies for educationalquality are poor. In the content of teaching, the prox-ies are especially poor.
Do professors who get paid more money really taketheir teaching roles more seriously? And why does itmatter whether a professor has the highest degree in hisor her field? Salaries and degree attainment are knownto be predictors of research productivity. But studiesshow that being oriented toward research has very littleto do with being good at teaching (Gladwell 2011, p. 6).
The notion that research performance is positivelycorrelated to teaching quality is false. Empiricalresearch suggests that the correlation betweenresearch productivity and undergraduate instructionis very low (Marginson 2006a). Achievements inteaching, learning, professional preparation andscholarship within the framework of national cultureare not captured by global university rankings. Thereis also a lack of information on student pre-gradua-tion and the alumni experience in general.
State funding is another key missing ingredientfrom the rankings, especially in the ‘Age of Aus-terity’. While China boosted its spending onscience by nearly 12.5%, Canada has slashedspending on the environment and has shut down astring of research programmes including the re -nowned Experimental Lakes Area, a collection of58 remote freshwater lakes in Ontario used tostudy pollutants for more than 40 yr. Even NASA’splanetary scientists have held a bake sale to high-light their field’s dwindling support (http:// www.space. com/ 16062-bake-sale-nasa-planetary-scien-ce. html). Spain’s 2013 budget proposal will reduceresearch funds for a fourth consecutive year andfollows a 25% cut in 2012 (Van Noorden 2012).India scaled down its historic funding growth tomore cautious inflation-level increases for 2012−2013 (Van Noorden 2012), but most concerning ofall is that since 2007 Greece has stopped publish-ing figures on state funding of higher education. In2007, university and research funding in Greecestood at a miserable 0.6% of the GDP, way belowthe EU average of 1.9% (Trachana 2013).
10
Taylor et al.: Rankings: the sorcerer’s new apprentice
Rankings also ignore the social and economicimpact of knowledge and technology transfer, thecontribution of regional or civic engagement or ‘thirdmission’ activities to communities and student learn-ing outcomes, despite these aspects being a majorpolicy objective for many governments and univer-sity administrators (Hazelkorn 2013).
Systemic problems are rife and rankings are posingmany more problems than solutions offered. Stu-dents and parents have high expectations of them:they want to know whether they really measurequality (Hazelkorn 2013). Do they raise standards byencouraging competition or do they undermine thebroader mission of universities to provide highereducation? How useful are they in choosing where tostudy? Are they an appropriate guide for jobprospects or for employers to use when recruiting?
The hidden hand
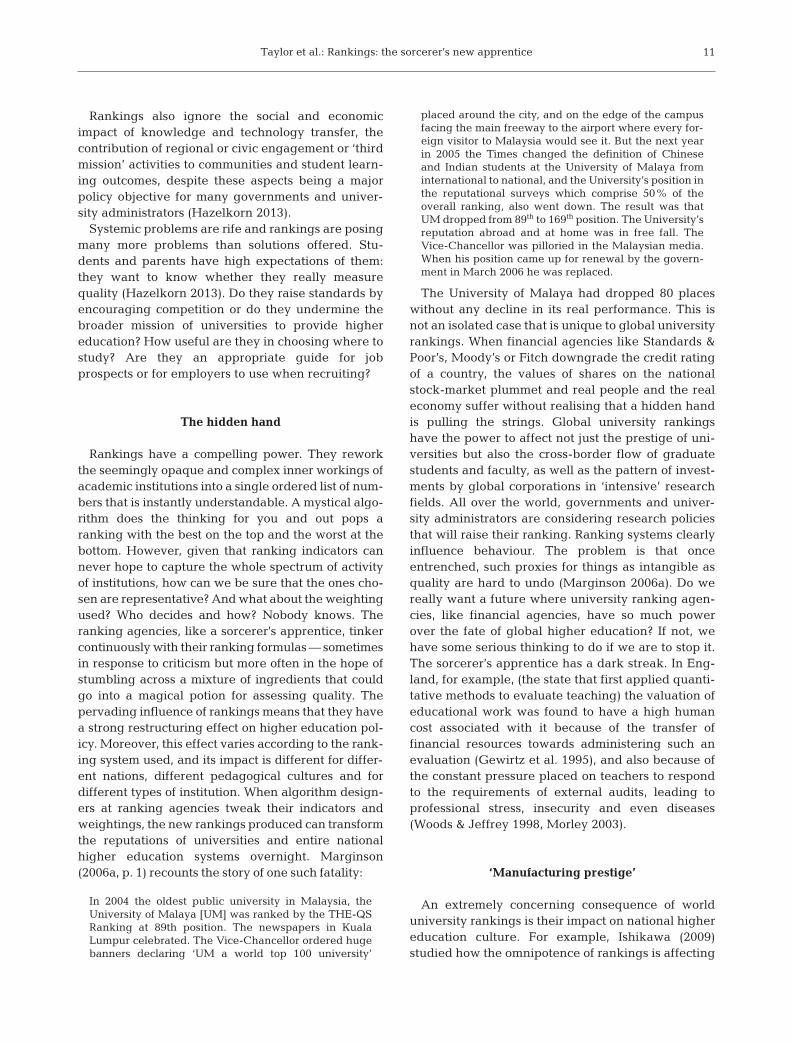
Rankings have a compelling power. They reworkthe seemingly opaque and complex inner workings ofacademic institutions into a single ordered list of num-bers that is instantly understandable. A mystical algo-rithm does the thinking for you and out pops aranking with the best on the top and the worst at thebottom. However, given that ranking indicators cannever hope to capture the whole spectrum of activityof institutions, how can we be sure that the ones cho-sen are representative? And what about the weightingused? Who decides and how? Nobody knows. Theranking agencies, like a sorcerer’s apprentice, tinkercontinuously with their ranking formulas — sometimesin response to criticism but more often in the hope ofstumbling across a mixture of ingredients that couldgo into a magical potion for assessing quality. Thepervading influence of rankings means that they havea strong restructuring effect on higher education pol-icy. Moreover, this effect varies according to the rank-ing system used, and its impact is different for differ-ent nations, different pedagogical cultures and fordifferent types of institution. When algorithm design-ers at ranking agencies tweak their indicators andweightings, the new rankings produced can transformthe reputations of universities and entire nationalhigher education systems over night. Marginson(2006a, p. 1) recounts the story of one such fatality:
In 2004 the oldest public university in Malaysia, theUniversity of Malaya [UM] was ranked by the THE-QSRanking at 89th position. The newspapers in KualaLumpur celebrated. The Vice-Chancellor ordered hugebanners declaring ‘UM a world top 100 university’
placed around the city, and on the edge of the campusfacing the main freeway to the airport where every for-eign visitor to Malaysia would see it. But the next yearin 2005 the Times changed the definition of Chineseand Indian students at the University of Malaya frominternational to national, and the University’s position inthe reputational surveys which comprise 50% of theoverall ranking, also went down. The result was thatUM dropped from 89th to 169th position. The University’sreputation abroad and at home was in free fall. TheVice-Chancellor was pilloried in the Malaysian media.When his position came up for renewal by the govern-ment in March 2006 he was replaced.
The University of Malaya had dropped 80 placeswithout any decline in its real performance. This isnot an isolated case that is unique to global universityrankings. When financial agencies like Standards &Poor’s, Moody’s or Fitch downgrade the credit ratingof a country, the values of shares on the nationalstock-market plummet and real people and the realeconomy suffer without realising that a hidden handis pulling the strings. Global university rankingshave the power to affect not just the prestige of uni-versities but also the cross-border flow of graduatestudents and faculty, as well as the pattern of invest-ments by global corporations in ‘intensive’ researchfields. All over the world, governments and univer-sity administrators are considering research policiesthat will raise their ranking. Ranking systems clearlyinfluence behaviour. The problem is that onceentrenched, such proxies for things as intangible asquality are hard to undo (Marginson 2006a). Do wereally want a future where university ranking agen-cies, like financial agencies, have so much powerover the fate of global higher education? If not, wehave some serious thinking to do if we are to stop it.The sorcerer’s apprentice has a dark streak. In Eng-land, for example, (the state that first applied quanti-tative methods to evaluate teaching) the valuation ofeducational work was found to have a high humancost associated with it because of the transfer offinancial resources towards administering such anevaluation (Gewirtz et al. 1995), and also because ofthe constant pressure placed on teachers to respondto the requirements of external audits, leading toprofessional stress, insecurity and even diseases(Woods & Jeffrey 1998, Morley 2003).
‘Manufacturing prestige’
An extremely concerning consequence of worlduniversity rankings is their impact on national highereducation culture. For example, Ishikawa (2009)studied how the omnipotence of rankings is affecting
11

Ethics Sci Environ Polit 13: pp10, 2014
non-Western, non-English language world-class uni-versities such as those in Japan. Japan had a previ-ously self-sustained, national language-based highereducation model with a stratification mechanism toselect and produce future leaders and professionals.Japan’s higher education system had existed outsidethe realm of Western higher education power dom -ains, and Western university degrees were of littlerelevance to the upward mobility in the existingnational social ladder. Ishikawa pointed out that thecompetition brought about by rankings is leveragingunprecedented and unwanted changes in Japan’shigher education system. Foreign students coming toJapan, far from benefiting from a Japanese perspec-tive, are likely to find that they will be educated inEnglish and that their studies are simply a mirror-image of those offered at highly ranked US universi-ties, but on Japanese soil. Ishikawa (2009) alsodescribed in some detail the process by which Japan-ese universities were approached by rankers and thelegal and logistic problems that domestic universitiesfaced in trying to procure the data requested. Worsestill, the published rankings that followed immedi-ately had negative effects on the local higher educa-tion ethos and caused discontent. For example,Japanese universities were being placed in low-ranking positions (>100th place) despite the fact thatJapan occupies the second highest position only afterthe US in terms of the volume of academic paperslisted in the Thomson Scientific database (King2007). ‘The prevalence of world university rankingssuggests the emerging hegemony in higher educa-tion in the world today’ (Ishikawa 2009, p. 170).
What is striking is that, ‘there have been few con-certed efforts to discredit the rankings process, whichappears to have secured public credibility’ (Margin-son & Van der Wende 2007, p. 309). In an excellentportrayal of the emerging empire of knowledge, Alt-bach (2007) talked of a mania to identify world-classuniversities: universities at the top of a prestige andquality hierarchy. Rankings have created an image ofwhat are the world’s best and strongest universities.Out of the top 30 universities on the 2007 lists, thecombined number of American and British universi-ties amount to 26/30 and 22/30 for the ARWURanking and the THE Ranking, respectively. Univer-sities that usually occupy the top 10 positions includethe so-called ‘Big Three’ (Harvard, Yale and Prince-ton) as well as ‘prestige’ or ‘elite’ colleges in the US(Karabel 2005) and ‘Oxbridge’ in the UK. They pres-ent a powerful image of being on the top of the worldand thus function as ‘global models’ to emulate(Ishikawa 2009). Alliance with such top-tiered uni-
versities is actively sought after by non-American,non-European universities aspiring to cultivate animage as being among this global elite — whatIshikawa calls ‘manufacturing prestige’ (Ishikawa2009). Some transnational ‘alliances’ include joint ordouble degree programs, accredited offshore institu-tions and for-profit institutions whose degrees havepaid-for validation by principally US and UK insti-tutes, for example: the MIT−National University ofSingapore alliance and a recent high-profile deal be-tween Stanford University and UC Berkeley with theKing Abdullah University of Science and Technologyin Saudi Arabia (Schevitz 2008). Curriculum develop-ment is based on the model of top universities withEnglish as the medium of instruction. Linguistic andcultural autonomy is being eroded and leading to ex-tinction of local knowledge. Global rankings demon-strate the reality of a global hierarchy in higher edu-cation. They portray the powerful image of theworld’s top-class universities in a way that drowns outthe most competitive domestic counterparts. Studentsfrom wealthy backgrounds, who previously wouldhave chosen the leading universities at home, appearto now be going overseas, courted by the promise offuture success in the global marketplace, superior ac-ademic training and the cultivation of personal con-nections (Ishikawa 2009). ‘As the gap between win-ners and losers in America grows ever wider — as ithas since the early 1970s — the desire to gain everypossible edge has only grown stronger’ and ‘the ac-quisition of education credentials is increasingly rec-ognized as a major vehicle for the transmission ofprivilege from parents to child’ (Karabel 2005, p. 3).
Playing the ranking game has caused Japanese uni-versities to increase their intake of foreign students,thereby further reducing the access to higher educa-tion of the potential domestic pool. Such changes arehaving important macroscopic effects on the globalhigher education landscape. In the next section, weidentify and try to explain some of these trends.
MACROSCOPIC TRENDS
In an attempt to contribute to the debate on rank-ings, we collected data for the year 2012 from 6global university ranking systems that provide free,online data. We analysed both their Top 200 rankingof universities distributed by country, and also theirTop 50 ranking by subject area/faculty, in orderto compare their level of agreement and to try toidentify underlying trends and mechanisms that mayexplain them.
12

Taylor et al.: Rankings: the sorcerer’s new apprentice
National, continental and subject area composition
Using 2012 as a reference year, we analysed theTop 200 ranking offered by 6 world university rank-ing systems. Table 2 shows the number of universi-ties per nation contributing to the number of Top 200universities in each continent using these systems.
Note that we have adopted the ISO-3166.1 countrycode naming system (https:// en. wikipedia. org/ wiki/ISO_3166-1). The number of universities that con-tributed to the Top 200 by country is plotted in Fig. 1.
Again, with 2012 as a reference year, we also ana-lysed the number of universities per nation that con-tributed to the Top 50 universities by subject area/
13
Top 200 by continent THE 2012 ARWU 2012
Africa 1 (ZA) 0Asia 20 (CN=6, JP=5, KP=4, IL=3, SG=2) 20 (JP=9, CN=5, IL=4, KP=1, SG=1)Europe 78 (GB=31, NL=12, DE=11, FR=8, 67 (GB=19, DE=14, NL=8, FR=8,
CH=7, SE=5, BE=4) CH=6, SE=5, BE=4, IT=4, DK=3)North America 84 (US=76, CA=8) 92 (US=85, CA=7)Oceania 9 (AU=8, NZ=1) 8 (AU=7, NZ=1)South America 1 (BR) 3 (BR=1, MX=1, RA=1)
Top 200 by continent HEEACT 2012 QS 2012
Africa 0 1 (ZA)Asia 23 (JP=8, CN=8, IL=3, KP=2, SG=2) 33 (CN=14, JP=10, KP=6, SG=2, IL=1)Europe 72 (GB=19, DE=14, NL=9, CH=7, FR=6, 73 (GB=30, NL=11, DE=11, CH=7,
IT=6, SE=5, BE=2, DK=2, ES=2) SE=5, BE=5, FR=4)North America 93 (US=84, CA=9) 63 (US=54, CA=9)Oceania 7 (AU=7) 9 (AU=8, NZ=1)South America 2 (BR=1, MX=1) 2 (BR=1, MX=1)
Top 200 by continent Webometrics 2012 Leiden 2012
Africa 0 0Asia 17 (CN=12, JP=2, IL=1, SG=1, RU=1) 16 (CN=11, KP=2, SG=2, IL=1)Europe 57 (DE=13, GB=11, NL=7, SE=6, IT=5, 83 (GB=29, DE=15, NL=12, FR=10,
ES=5, CH=4, BE=3, DK=3) CH=7, BE=4, DK=4, IE=2North America 101 (US=87, CA=14) 81 (US=77, CA=4)Oceania 7 (AU=6, NZ=1) 5 (AU=5)South America 5 (BR=4, MX=1) 0
Table 2. Contribution of each continent to the ‘Top’ 200 universities in 2012 using 6 common global university ranking systems. Country codes are as per the ISO-3166.1 system
0
20
40
60
80
100
US
GB
NL
DE
FR CA
AU
CH
CN JP ES
KP
BE IL
SG
ZA
NZ
BR
RU IT
DK
ES IE
MX
RA
No.
of u
nive
rsiti
es in
the
Top
200
Country Code (ISO-3166)
THE ARWU HEEACT QS Webometrics Leiden
Fig. 1. Distribution of ‘Top 200’ universities by country, using freely available online data for the year 2012 from 6 different world university ranking schemes

Ethics Sci Environ Polit 13: pp10, 2014
faculty. The results of our analysis for 4 world univer-sity ranking systems making these data available areshown in Table 3. Gathering the data into continentalcomponents, a very large skew in the data is appar-ent for all rating schemes as shown in Fig. 2.
Categorisation of the Top 50 universities by subjectarea/faculty reveals a shocking finding: Africa andSouth America are not represented at all. Further-more, despite their strong economies, Australia andNew Zealand (‘Oceania’) hardly make an impact inthe Top 50 of each subject area/faculty. The same istrue for the whole of Asia in all subject areas/facul-ties apart from the field of Engineering and Technol-ogy/Computer Sciences, where their impact is repre-sentative according to all 4 rating systems. WhileEurope is seen to be on an equal footing in this sub-ject area/faculty, it clearly dominates over Asia in allof the other subject areas/faculties. The most domi-nant player is North America, which is massivelyover-represented in all subject areas/faculties.
It seems that rankings are a reflection of theunequal academic division of labour, the latter result-ing from the uneven economic and geographical con-ditions under which both production of knowledgeand education occurs across different countries andregions. The academic inequalities that rankingsdepict can be better explained when critical theoriesof unequal socio-spatial development, such as thecumulative-causation effect, are used (Amsler &
Bolsmann 2012). The cumulative-causation theoryexplains why development ‘needs’ under-develop-ment, in our case how highly-ranked institutions‘need’ low-ranked ones (Myrdal 1957). In sharp con-trast to neoclassical models of development, cumula-tive-causation theory shows that economic growthincreased rather than closed the gap betweenwealthier and less-privileged/poor socio-spatial enti-ties. Thus, the majority of less powerful and low-ranked universities follow the economic ‘fate’ of thecountries/regions they belong to and lag even furtherbehind their prevailing and developed counterpartsover time. This is partly substantiated by the Greekcase studied below.
Another explanation for the enormous inequalityof continental representation across all subject areas/faculties lies, as we explain below, in 2 psycho-socialmechanisms at work in the selection process ofhow students together with their parents choose auniversity.
Mechanisms at work
Mechanism I: The ‘blink mentality’
Typing ‘Top 10’ into Google.com returns 402 mil-lion ranked webpages. This is a phenomenal numberand reflects a strong social tendency at work in the
14
Top 50 by faculty THE 2012 ARWU 2012
Arts & Humanities 45 (US=25, GB=10, DE=4, CA=3, AU=3) 0Clinical Medicine, 45 (US=24, GB=7, CA=5, AU=5, NL=2, JP=2) 47 (US=32, GB=7, DE=1, CA=3, CH=2,Health & Pharmacy AU=1, JP=1)
Engineering & Technology/ 45 (US=24, GB=5, AU=3, KP=3, JP=3, CN=3, 48 (US=31, GB=4, CN=5, JP=3, CA=2,Computer Sciences CA=2, CH=2) KP=1, CH=2)
Life & Agriculture Sciences/ 45 (US=24, GB=6, CA=4, AU=3, CH=3, JP=2, 47 (US=32, GB=7, CA=3, AU=3, CH=2)Agriculture NL=1,SG=1,SE=1)
Physical Sciences/Natural 48 (US=27, GB=6, FR=4, DE=3, CA=2, AU=2, 48 (US=33, GB=4, JP=3, IL=2, CH=2,Sciences & Mathematics CH=2, JP=2) FR=2, DE=1, CA=1)
Social Sciences 48 (US=29, GB=8, AU=5, CA=3, CN=3) 50 (US=42, GB=5, CA=3)
Top 50 by faculty HEEACT 2012 Leiden 2012
Arts & Humanities 0 0Clinical Medicine, 45 (US=32, GB=4, CA=4, AU=2, DE=1, SE=1, 50 (US=36, GB=8, CH=2, IL=1, DE=1,Health & Pharmacy DK=1) FR=1, IE=1)
Engineering & Technology/ 45 (US=24, CN=10, GB=3, JP=3, CH=2, 50 (US=30, CN=9, GB=2, CH=2, TR=2,Computer Sciences CA=1, NL=1, BE=1) IT=1, DE=1, IR=1, ES=1, AU=1)
Life & Agriculture Sciences/ 45 (US=31, GB=6, CA=3, JP=3, NL=1, CH=1, 50 (US=34, GB=11, CH=1, FR=1, IL=1,Agriculture AU=1) KP=1, AU=1)
Physical Sciences/ Natural 46 (US=29, JP=5, CN=4, GB=4, FR=2, CH=2) 50 (US=34, GB=3, NL=3, CH=3, DK=2,Sciences & Mathematics CN=1, IL=1, SG=1, IE=1)
Social Sciences 47 (US=37, GB=4, NL=4, CA=2) 50 (US=39, GB=6, NL=2, CA=1, SE=1, CH=1)
Table 3. Comparison of the contribution of each faculty area to the ‘Top’ 50 universities in 2012 using 4 global universityranking systems for which data were freely and publicly available. Country codes are as per the ISO-3166.1 system

Taylor et al.: Rankings: the sorcerer’s new apprentice
social web. For would-be students of higher educa-tion, there are webpages presenting ‘top 10 degreesubjects for getting a job’ and even the ‘top 10 uni-versities for joining the super-rich’. Students andtheir parents act on a range of criteria that influenceto some degree their final choice of higher educationestablishment — tuition fees, the local cost of living,ease of relocation (including returning home duringholidays), academic reputation, education qualityand post-graduation employment potential. Global
university rankings (and the general global percep-tion they have engendered) measure very little of thisoverall decision-making process, and yet, they areone of the most impor tant opinion-forming yardsticksthat constrain people’s final choice. It is worth askingourselves: Why have we become so fixated and de -pendent on rankings in our daily lives? According tothe book ‘Blink: the power of thinking without think-ing’ (Gladwell 2007), one reason is that instanta-neous and unconscious decision-making was, and
15
0
5
10
15
20
25
30
35
Africa Asia Europe NorthAmerica
Oceania SouthAmerica
Uni
vers
ities
in T
op 5
0
Engineering & Technology / Computer Sciences
0
5
10
15
20
25
30
35
40
Africa Asia Europe NorthAmerica
Oceania SouthAmerica
Life & Agriculture Sciences
0
5
10
15
20
25
30
35
40
Uni
vers
ities
in T
op 5
0
Physical Sciences / Natural Sciences & Mathematics
0
5
10
15
20
25
30
35
40
45
50 Social Sciences
0
5
10
15
20
25
30
35
40
Uni
vers
ities
in T
op 5
0
Clinical Medicine, Health & Pharmacy THEARWUHEEACTLeiden
Fig. 2. Distribution of ‘Top 50’ universities by continent,for each of 5 different faculties using freely availableonline data for the year 2012 from 4 global university
ranking systems

Ethics Sci Environ Polit 13: pp10, 2014
still is, part of our survival instinct. Being able to reactto potential threats and to exploit potential opportu-nities in the blink of an eye is one reason our specieshas not yet disappeared off the face of the Earth.Online rankings feed this survival instinct by helpingsurfers of large volumes of web content to processinformation rapidly and to make snap decisions ineach clickstream.
In the same way that a photographer’s choice offrame and moment ‘boxes’ reality in space and time,our habit of considering only the first 10 or so rankedentries in an ordered list precludes a thoroughassessment of all available items. For example, howoften do we delve more than 5 pages deep in aGoogle search before clicking on a result? Andhow often do we stop to consider what criteria arebeing used to rank the search results and whether ornot they are valid? Without often realising it, ourdependence on rankings and the speedy conven-ience they offer makes us vulnerable to a processwhich Herman & Chomsky (1988) called ‘manufac-turing consent’. The ranker, through their choice ofranking system, guides our perception of what is bestand what is not.
Mechanism II: ‘Preferential attachment’
Acting on perceptions acquired from rankings, par-ents and their children then become agents in thenetwork of universities, preferentially attaching tothose establishments they consider to be the ‘best’. Ifthe 25 different countries contributing universities tothe Top 200 in Fig. 1 had an equal share, then eachwould contribute 8 universities and Fig. 1 would be astraight horizontal line. Variance would then be ex -pected to be superimposed on this horizontal line by
small differences in the way the different systemscalculate their ranking, and due to small differencesyear on year — a ‘normal’ (in the Gaussian sense) dis-tribution. Instead, what is seen is a highly skewed (tothe left) rank-frequency distribution. Such distribu-tions are commonplace and arise from the action ofpreferential attachment in complex networks (New-man 2001, Jeong et al. 2003). Statisticians have evencreated competition models of the dynamics of uni-versity ranking changes year on year (Grewal et al.2008) and found that with greater than 90% proba-bility, a university’s rank will be within 4 units of itsrank the previous year. Not only are ‘the rich gettingricher’, their privilege is maintained and stable.
Ranking tables have a compelling popularity, re -gardless of questions of validity, and of the uses towhich the data are put, and of the effects on the or-ganisation of global higher education. Rankings areeasily recalled as lists and have quickly become partof ‘common-sense’ knowledge. Given that glo bal uni-versity rankings are a potent device for framinghigher education on a global scale, the developmentof internationally agreed-on principles for good prac-tice is going to be crucial. It is vital that rankings sys-tems are crafted so as to serve the purposes of highereducation (Marginson & Van der Wende 2007).
‘Greece is a special case’
Last year in an interview on the role of the ‘Troika’(the International Monetary Fund, IMF; the Euro-pean Central Bank, ECB; and the European Commis-sion, EC) in helping struggling economies in thesouthern periphery of Europe, the head of the IMF,Christine Lagarde, was quoted as saying, ‘Greece isa special case’. When it comes to ranking of its uni-
16
University THE ARWU HEEACT QS Webometrics Leiden 2012 2012 2012 2012 2011 2010 2009 2008 2007 2012 2012
Aristotle University ≈360 347 451−500 451−500 401−450 401−500 430 194of Thessaloniki
University of Crete 468 451−500 451−500 401−500 401−500 437 460National and Kapodistrian ≈300 214 501−550 387 177 200 248 268University of Athens
National Technical 551−600 551−600 401−450 401−450 356 417University of Athens
Athens University of 601+ 601+ 501−600 501+ 472 1269Economy and Business
University of Patras 601+ 551−600 501−550 501+ 457 556
Table 4. Available data for the ‘Top’ 6 ranked Greek universities. Entires refer to position rank. Year on year statistics for the period2007−2012 are only available online for the QS Ranking. 2012 data for the ARWU ranking were estimated from online data

Taylor et al.: Rankings: the sorcerer’s new apprentice
versities, we will see that Rankmart paints a paradox-ical picture of Greece’s higher education institutionsover the period 2007−2012. We collected the avail-able online data in Table 4.
The QS Ranking shows that all universities (apartfrom the National and Kapodistrian University ofAthens) slid down to the bottom end of the rankingscale over the period 2007−2012. Despite substan-tially improving its position in the QS Ranking from2007−2009, even the prestigious National and Ka -podistrian University of Athens suffered the samefate in the years that followed. Somewhat surpris-ingly, the 2012 rankings provided by HEEACT, Web -ometrics and ARWU show that all universities withthe exception of the University of Crete and theAthens University of Economics and Business areperforming better than the QS ranking suggests.Rankmart suggests that the difference may be attrib-utable to the fact that the QS ranking is reputationalsurvey-dominated whereas the other rankingsystems are citation-dominated. It is possible that, inthe absence of expert knowledge, opinion-providersare associating rising government debt and escalat-ing socio-political instability with an expecteddecline in higher education quality and are down-grading Greek universities as a result. The QS rank-ing is therefore prone to a perception bias. However,while it is true that Greek higher education is facingextreme pressures (Trachana 2013), when assessedby citation-based metrics, their ranks appear to beslightly cushioned against this biasing effect. Itshould also be borne in mind that time-lag factors onthe scale of 1 to 2 yr frequently exist be tween the ap-pearance of publications and the citations they ac-crue. This creates uncertainty in the analysis of data(particularly post-2012), but it is expected that thesomewhat longer-term trends described above forthe period 2007−2012 are indi cative of the expectedtrend also in the post-2012 period.
In the context of citation impact, Van Noorden(2012) compiled data for the contribution of eachcountry to the top 1% of the highest-cited articles,and ranked the results. Greece is extremely highlyranked in this world list (13th position), ahead ofmuch stronger economies such as Canada andFrance. In particular, while the US required 311 975publications to account for its 1.19% share of themost highly-cited articles, Greece achieved an al -most equal share (1.13%) with just 9281 publishedarticles. In terms of citation impact, Greece is actuallyfaring surprisingly well in research performance.This points toward a possible explanation for thelarge deviation in the results of the different ranking
systems in the case of Greece. While funding of its‘real economy’ has totally collapsed as a result of theimpact of the 2008 Eurozone crisis and the diversionof expenditure towards debt repayment, the QSranking reflects a perception that Greek universitiesare in decline, while at the same time the ARWU,HEEACT and Webometrics rankings are reflectingresearch accomplishment. In most nations, the levelof basic research capacity is largely determined bythe level of public and philanthropic investment(Marginson 2006a), but in Greece it appears thatresearch quality is being sustained by sheer effortand the international collaborations of Greek aca-demics. Our analysis of the available ranking infor-mation for Greek universities suggests that• There is a very large deviation in the ranking ofGreek universities according to the different rankingsystems• There is suggestion of a strong perception bias inthe QS ranking• There is a contradiction between observabletrends in the ARWU ranking and QS rankings overthe period 2007−2012, which is related to the mainte-nance of a stable source of citations.
The contradiction between the ARWU and QSranking of Greek universities echoes the results of arecent comparison of QS and ARWU rankings on theglobal scale performed by Jöns & Hoyler (2013).Their study revealed that differences in the rankingcriteria used produce partial and biased, but alsovery different and uneven, geographies of highereducation on the global scale. The authors suggestedthat the emergence of these 2 rankings in particularreflects a radical shift in the geopolitics and geo-eco-nomics of higher education from the national to theglobal scale that is prioritising academic practicesand discourses in particular places and fields ofresearch. The authors also suggested that theserankings are having a significant public impact in thecontext of the on-going neo-liberalization of highereducation and reveal a wider tension in the globalknowledge-based economy:
An examination of different geographical scales andindividual ranking criteria provided further evidencethat both league tables [world rankings] produce highlypartial geographies of global higher education that areto some extent reflective of wider economic and socio-cultural inequalities but also convey a very narrow viewof science and scholarship, namely one that can be cap-tured by Anglophone neoliberal audit cultures (Jöns &Hoyler 2013, p. 56).
The case of Greece is no exception to this pictureand presents uneven results that depend on whichranking system is applied. While not obvious, there
17

Ethics Sci Environ Polit 13: pp10, 2014
are signs that successive Greek governments are re-sponding to rankings. In recent years, emphasis hasbeen placed on securing the role of Greek science inEuropean projects in particular. In parallel, there is atrend towards liberalization of private higher educa-tion institutions. While the funding tap has effectivelybeen switched off to state universities, more privatecolleges and for-profit educational institutions havestarted to appear. There are currently 25 such institu-tions, but at the moment they are manufacturingprestige by paying for the validation of their degreesby accredited universities and institutions in the USand the UK. On 9 July 2012, the Troika pressedGreek authorities to progress towards full recognitionof degrees granted by private colleges operating asfranchises of foreign universities in Greece, part of aplan to liberalize the country’s higher education sec-tor. This is confirmed by the findings reported by the2013 annual report ‘Greek higher education institu-tions in the world rankings’ (Interuniversity HigherEducation Policy Network 2013), which used datafrom the Webometrics Ranking over the years2011−2013. The report revealed that Greek privateeducation institutions are starting to be noticed over-seas, as evidenced by the fact that they are beingevaluated by world rankings like Webometrics inspite of constitutional and other bans (InteruniversityHigher Education Policy Network 2013). For example,out of the 64 Greek institutions or structures appear-ing in the 2013 Webometrics Ranking, 23 are univer-sities, 16 are Technological Educational Institutions(TEIs), 20 are private structures, 2 are military acade-mies, 2 are schools of music, and 1 is mysteriouslyclassified as ‘other’. Despite making up 25/64 (or39%) of all Greek higher education institutions, only3 of these private education institutions can be foundin the top third of the 21 250 institutions appearing inthe 2013 Webometrics Ranking list (InteruniversityHigher Education Policy Network 2013). The authorsof the Interuniversity Higher Education Policy Net-work (2013) report concluded that private higher ed-ucation institutions in Greece are of low quality com-pared to their public counterparts:
at the base of this evaluation, the view that these [pri-vate education institutions] are low-level educationalstructures is substantiated, with a tendency towards fur-ther deterioration and in every case they have a muchworse ranking than the public higher education institu-tions (Interuniversity Higher Education Policy Network,2013, p. 17).
Interestingly, the report also compared indicatorsfor Greek higher education institutes with other EUmember states of similar GDP and found that Greek
higher education institutions are by no means infe-rior to those in European countries with GDP compa-rable to that of Greece. However, the report also rec-ognized that the distance between the better and‘less good’ institutions is growing (InteruniversityHigher Education Policy Network 2013), suggestinga change away from a systemic (social democratic)approach towards a neoliberal outlook based on indi-vidual institutions, i.e. towards a logic of ‘excellence’:
The new laws for higher education supported the needfor its existence [TEI ‘excellence’] and laid the founda-tions for its legalization not so much in the developmentand improvement of a satisfactory institution, but in themore generalized discrediting of the Greek public uni-versity (Interuniversity Higher Education Policy Net-work 2013, p. 5).
Summarizing this section, with the passing of eachsubsequent year from 2007 to 2013, Greek universi-ties appear to follow the cumulative-causation effectdescribed in the section above entitled ‘National,continental and subject area composition’. Rankingsystems that are reputational survey-based like theQS ranking are imitating the credit agencies’ percep-tion of Greece’s economy and are driving a devalua-tion of the status of Greece’s state universities.National policy makers are then using these rankingsto justify implementing a neoliberal agenda support-ing the drive to large-scale privatisation of Greece’suniversities and research institutes. The paradox isthat Greece’s research output from public institutionsis maintaining its high international quality impact asreflected by citation-based rankings. Ironically, ifcost was a strongly weighted indicator in rankingsystems, Greece would have a glowing place, sinceits undergraduate education, and a significant part ofits post-graduate education, is still free.
THINKING IT THROUGH
The causes
We have seen how rankings have become popular,hierarchical and entrenched, but that in their currentform, they are irreproducible and also invalid meas-ures of the ‘quality’ of universities. We have arguedthat one key mechanism behind their popularity is‘blink mentality’. With the advent of the social webwhere instant one-dimensional ordered lists likerankings have become a simple device for helpingend-users make numerous instant decisions, theblink mentality comes to the fore as they processlarge volumes of data. We also claim that the main
18

Taylor et al.: Rankings: the sorcerer’s new apprentice
mechanism responsible for the rise of an elite cohortof universities is ‘preferential attachment’. This wasacutely present in the distribution of the top 200 uni-versities by country. The nature of the blink mental-ity necessitates that end-users of rankings train theireyes on the top part of the ranking lists, and thisselection effect dramatically changes the dynamics oftheir interaction with the entire network of universi-ties. They are drawn to and tend to reinforce the topuniversities by preferentially attaching to an elitecore. The popularity of rankings and, in particular,the way they are easily interpreted by non-expertpolicy makers, has created an image that they are thestandard against which higher education qualityshould be benchmarked and assessed. This processhas entrenched them on the global scale with some-times disastrous consequences as we have described.However, we have also seen that all of the rankingsystems are invalid to a large degree. There is noconsensus on which variables should be used asdirect measures or even as proxy indicators. There isalso no consensus on how many of them there shouldbe. Ranking systems that aggregate and combine thevariables using arbitrary or subjectively-chosenweights cannot be relied upon. The results of theranking process are inconsistent even when method-ological tweaking is kept constant (e.g. by comparinguniversities during a given year). The results are alsonot reproducible due to a lack of transparency in thesharing of source data. Another very important prob-lem involves the end-users of rankings. They seerankings as a holistic measure of universities ratherthan a measure of their research performance in cer-tain fields:
Holistic rankings become an end in themselves withoutregard to exactly what they measure or whether theycontribute to institutional and system improvement.The desire for rank ordering overrules all else. Once arankings system is understood as holistic and reputa-tional in form it fosters its own illusion (Marginson2006a, p. 8).
The effects
Global rankings have generated international com-petitive pressures in higher education. On this theyhave also superimposed a layer of competition onestablished national higher education systems (Mar-ginson 2006a). In some countries, like Japan andGreece, the effect has been to make national univer-sities less attractive and also more vulnerable to theirown people. Their best clients, the best students, are
increasingly likely to cross the border and slip fromtheir grasp. This is especially damaging in emergingnations that lack capacity in research and communi-cations technologies. While only certain kinds of uni-versities are able to do well in global rankings, otherinstitutions are being pushed towards imitationregardless of their rank.
Effect 1: Globalisation of higher education
Global higher education is changing rapidly for 4key reasons. Firstly, policy-makers have understoodthat higher education is a principal source of wealthcreation, and that skilled citizens are healthier, moreprosperous and have the knowledge to contribute tosociety throughout their lives. As a result there hasbeen a rapid growth in the global research popula-tion and the academic social web. This in turn has ledto a large increase in mobility and global knowledgeproduction and dissemination (Hazelkorn 2013). Sec-ondly, participation in ‘world-class’ research de -pends on the ability of nations to develop, attract andretain talent. However, despite global populationgrowth, the availability of skilled labour is actuallydeclining. In 2005, young people represented 13.7%of the population in developed countries but theirshare is expected to fall to 10.5% by 2050 (Bremneret al. 2009). In response, governments around theworld are introducing policies to attract the most tal-ented migrants and internationally mobile students,especially postgraduate students in science and tech-nology (Hazelkorn 2013). Thirdly, the quality of indi-vidual higher education institutions as a whole(teaching and learning excellence, research andknowledge creation, commercialisation and knowl-edge transfer, graduate employability) has become astrong indicator of how well a nation can compete inthe global economy (Hazelkorn 2013). This has pro-duced a bias in favour of demonstrating value-for-money and investor confidence. Last, but by nomeans least, students (and their parents) who arepaying for higher education as consumers, are select-ing institutions and education programmes accord-ing to their perception of return on investment, i.e. bybalancing the cost of tuition fees and the cost-of-liv-ing with career and salary-earning potential. Rank-ings feed their needs and the needs of many otherdifferent stakeholders by apparently measuring thequality of the educational product. Employers usethem to rank new recruits by their perceived leveland capability. Policy makers and university admin-istrators use them as proxies of performance, quality,
19

Ethics Sci Environ Polit 13: pp10, 2014
status and impact on the national economy. For thepublic, they provide an at-a-glance check of the per-formance and productivity of higher education insti-tutes funded by tax payers’ money.
Effect 2: Authoritarian irresponsibility
Lobbying of decision makers by ranking agencieshas brought them financial dividends but has dam-aged the global higher education landscape bycreating the perception of ‘good’ and ‘bad’ univer-sities. The rankers have let out a beast. They havesupported and have reproduced an expandingscale of educational inequality, and are now tryingto warn people that the rankings should be han-dled with care; but the responses by rankers tocriticisms of their ranking systems verges on schiz-ophrenia. In one breath they tell us that, ‘no uni-versity ranking can ever be ex haustive or objective’(Baty 2012), and in another breath that, ‘[the rank-ings] can play a role in helping governments toselect potential partners for their home institutionsand determine where to invest their scholarships’(Baty 2012). Why don’t governments cut out theranking middle-men and simply ask the experts —their own academics? Governments also are con-tradicting themselves:
We are blessed in Britain to have a world-leadinghigher education sector. Our universities are a greatsource of strength for the country and their role—in anincreasingly knowledge-based economy—is becomingmore and more central to our future prosperity. Univer-sities are also becoming increasingly central to ourfuture social prospects (Social Mobility and ChildPoverty Commission 2013, p. 2).
The UK government’s Social Mobility and ChildPoverty Commission (2013) then goes on to showhow the proportion of state-educated pupils attend-ing elite ‘Russell Group’ universities (the club of UKresearch-intensive universities that includes Oxfordand Cambridge, as well as the London School of Eco-nomics and Imperial College) has declined since2002, and that the UK’s ‘most academically selectiveuniversities are becoming less socially representa-tive’ (Wintour & Adams 2013). This is despite ‘thegrowing evidence base that students from lessadvantaged backgrounds tend to outperform otherstudents with similar A-level grades on their degree’(Wintour & Adams 2013). So which is it? Enablingable students to fulfil their potential is central even toeconomic efficiency. We agree with the man behindthe THE Ranking when he says that,
The authority that comes with the dominance of a givenranking system, brings with it great responsibility… Allglobal university ranking tables are inherently crude asthey reduce universities and all their diverse missionsand strengths to a single, composite score… One of thegreat strengths of global higher education is its extraor-dinarily rich diversity and this can never be captured byany global ranking, which judges all institutions againsta single set of criteria (Baty 2012)
This is the best argument we have heard yet forimmediately abandoning his ranking the THE Rank-ing. There is, as we have seen, absolutely no mathe-matical basis for arbitrary choices of indicatorweights and, as we have also seen, there is not evena consensus over which indicators should be in -cluded. In fact, the field of multi-parametric indexingis still in a state of early evolution while re searcherswork towards a meaningful protocol for their generalcalculation and evaluation. As such, policy makershave jumped the gun. They should have trusted theadvice of academic experts and waited until a repre-sentative, reproducible and reliable (the 3 ‘R’s)methodology can be designed. Instead they havechosen to side with an opportunistic ranking lobby.This is power and irresponsibility.
Effect 3: Academic mutinies
In 2007, there was a mutiny by academics in theUS. They boycotted the most influential universityranking system in use in the country, the US Newsand World Report, claiming that the ranking is basedon a dubious methodology and on spurious data (But-ler 2007). Presidents of more than 60 liberal arts col-leges refused to participate in providing data for thereport, writing that the rankings, ‘imply a false preci-sion and authority’ and ‘say nothing or very littleabout whether students are actually learning at par-ticular colleges or universities’ (Enserink 2007, p.1026). In 2006, 26 Canadian universities revoltedagainst a similar exercise by Maclean’s magazine.Soon after, academics in highly influential universi-ties including MIT, CalTech and Harvard beganrebelling against another ranking, the impact factor,and started a challenge to the conventional publish-ing system that they saw as costly, slow, opaque andprone to bias, and which had erected barriers toaccess to potential readers (Taylor et al. 2008). Theyboycotted key culprit journals and began issuingmandates in institutes for academics to self-archiveand peer-review each other’s articles. The mutiny isstill gathering momentum and the fall-out is unfore-seeable. If one considers for a moment the near
20

Taylor et al.: Rankings: the sorcerer’s new apprentice
absence in the top rankings of nations such as Ger-many, Japan and South Korea that drive world-classeconomies, it is easy to ask: Who and what are therankings really representing? There is growingpotential for a global mutiny in higher educationcaused by rankings. The critics take aim not only atthe rankings’ methodology but also at their undueinfluence. For instance, some UK employers usethem in hiring decisions (Enserink 2007). MIT, Cal-Tech and Harvard did not only rebel against theranking schemes; they also established OpenCourse-Ware, a platform for providing free, online openaccess to teaching materials and resources producedby their faculty staff. In one fell swoop they made ahuge contribution to knowledge conservation. As wewill discuss below, ‘cloud’ education is vital for thesustainability of higher education in countries suffer-ing from ‘brain drain’.
Effect 4: Brain drain and the threat to globalknowledge conservation
The brain drain of highly skilled professionalsfleeing the crisis in southern Europe is a brain gainfor the countries to which they migrate. This has asignificant impact on higher education and researchat both ends, as universities and research centresmust adjust to the new conditions brought aboutand have to strive to retain potential creators ofknowledge and therefore wealth. Most skilled expa-triates have the willingness and capacity to con-tribute to the development of their new host country.The gap they leave behind is sorely felt at homeand the new beneficiaries of their talent have asocial responsibility to support information and dis-tributed computing technologies that enable dis-tance cooperation. In this way, a digitally literategeneration of young people will be able to continueto benefit from the knowledge acquired by theirpeers. Knowledge can be conserved via virtualclassrooms and virtual laboratories, or by remoteaccess to rare or expensive resources of colleaguesin host countries and will help keep afloat small,low-budget universities at home by providing themaccess to the infrastructure and quality of large, for-eign ones. Such approaches are needed if a segre-gation of nations into high and low knowledge capi-tal is to be avoided. Brain drain without knowledgeconservation will simply lead to intellectual and cul-tural extinction of nations (Wilson et al. 2006). Theimpact of this on the global scale, while not yet fullyunderstood, is irreversible.
Effect 5: Ranking agencies are under pressure
Well aware of their influence, and also the criticisms,the rankers themselves are starting to acknowledgethat their charts are not the last word. The ARWURanking website has a pop-up window warning that:‘there are still many methodological and technicalproblems’ and urges ‘caution’ when using the results.In a self-critique of the THE Ranking, Baty (2012) ex-plained that it ‘should be handled with care’. In re-sponse to the critics, some rankers are also continu-ously tinkering with their formulas. But this opensthem up to another criticism, namely that this invali-dates comparisons of the results of their ranking sys-tem over different years. They are losing their grip. Inanother attempt to boost their credibility, big playersin the ranking game (UNESCO European Centre forHigher Education in Bucharest and the Institute forHigher Education Policy in Washington, DC) foundedthe International Rankings Expert Group (IREG) in2004. During their second meeting, convened inBerlin from 18 to 20 May 2006, they set forthprinciples of quality and good practice in higher edu-cation institute rankings called the ‘Berlin Principles’(IREG 2006). They stress factors such as the impor-tance of transparency, relevant indicators and the useverifiable data. The principles are very general in na-ture and focus on the ‘biggest common denominators’be tween ranking systems. Sounds good? It turns outthat it was simply a public relations exercise. Most ofthe rankers are still not yet compliant with their ownagreed principles (Enserink 2007). In a worrying re-cent turn, the IREG Executive Committee at its meet-ing in Warsaw on 15 May 2013 decided to grant QSthe rights to use the ‘IREG Approved’ label in relationto the following 3 rankings: QS World UniversityRankings, QS University Rankings: Asia and QS Uni-versity Rankings: Latin America. With all of the sys-tematic problems inherent to Rankmart’s ranking sys-tems still to be addressed, it is not possible to believethe results of an auditing and approval process. Withpowerful ranking companies using their own lobbiesto approve themselves, this is a dangerous precedent.What is needed, in addition to a truly independentcommission free from self-interests, is a clear state-ment of the purpose of the rankings, as measuring ex-cellence is clearly not the same as measuring thequality of teaching, cost, graduate employability or in-novation potential (Saisana et al. 2011). ‘It is importantto secure “clean” rankings, transparent, free of self-interest, and methodologically coherent - that createincentives to broad-based improvement’ (Marginson& Van der Wende 2007, p. 306).
21

In league tables and ranking systems, ranks areoften presented as if they had been calculated underconditions of certainty. Media and stakeholders takethese measures at face value, as if they were un -equivocal, all-purpose yardsticks of quality. To theconsumers of composite indicators, the numbersseem crisp and convincing. Some may argue thatrankings are here to stay and that it is thereforeworth the time and effort to get them right. Signs arethat this is incorrect. Rankings are coming undermounting pressure. As their negative effects takeroot, resistance to them will grow, and new and bet-ter modes will be developed. This is what happenedwith journal impact factors. Resistance to them gavebirth to open access, open source, open repositories,OpenCourseWare and institutional mandates forself-archiving. Another important initiative is theSan Francisco Declaration on Research Assessment(DORA; http:// am. ascb. org/ dora/), produced by theAmerican Society for Cell Biology (ASCB) in collabo-ration with a group of editors and publishers of schol-arly journals:
There is a pressing need to improve the ways in whichthe output of scientific research is evaluated by fundingagencies, academic institutions, and other parties…[there exists]• the need to eliminate the use of journal-based met-rics, such as Journal Impact Factors, in funding,appointment, and promotion considerations;• the need to assess research on its own merits ratherthan on the basis of the journal in which the research ispublished.
The jury is still out on the construction of multi-parametric indices. When it comes back in, be readyfor a surprise.
The solutions
It should be possible to understand worldwidehigher education as a combination of differing natio -nal and local traditions, models and innovations — inwhich some universities do better than others but nosingle model is supreme. There could be a large rangeof possible global models (Marginson 2006a). In avery recent report for UNESCO, Hazelkorn (2013,p.1) asked the question: ‘Should higher educationpolicies aim to develop world-class universities orshould the emphasis be on raising standards world-wide, i.e. making the entire system world-class?’
Her report ends by explaining very clearly that thedevelopment of an elite group of world-class univer-sities is ‘the neoliberal model’ while the developmentof a world-class system of higher education is ‘the
social democratic model’. We have seen that the cur-rent state of affairs and the host of harmful effectsproduced by the rampant rankings of apprenticeranking agencies is due to the former. As with the USacademic mutiny of 2007, the problems are givingbirth to new solutions that have the potential to putsocial democracy back on the map.
The Leiden Ranking is the only ranking system inRankmart that does not aggregate weighted indica-tors. Instead, it uses a simple counting method forcalculating ranks based on the rank of each univer-sity according to each indicator treated separately(Waltman et al. 2012). Its indicators are also correctlynormalised to account for differences existing be -tween subject areas/faculties, and it does not rely ondata supplied by the universities themselves andavoids potential bias associated with self-inflationarypolicies. However, like the HEEACT Ranking, theLeiden Ranking focuses exclusively on research per-formance, and it limits these data to only journalslisted in the Web of Science. This is problematic dueto the existence of a power law associated with jour-nal impact factors (Taylor et al. 2008). The LeidenRanking also assesses universities as a whole andtherefore cannot be used to draw conclusions regard-ing the performance of individual research groups,departments or institutes within a university. It alsodoes not attempt to capture the teaching perform-ance of universities. In a very welcome step, thedesigners of the ranking themselves admit that theranking focuses exclusively on universities’ aca-demic performance, and we give them credit for not-ing that scientific performance need not be a goodpredictor of its teaching performance (Waltman et al.2012). Furthermore, other ‘input’ variables such asthe number of research staff of a university or theamount of money a university has available forresearch, are not taken into account and again, theauthors of the ranking explain that this is due to alack of accurate internationally standardized data onthese parameters (Waltman et al. 2012).
A second interesting development is from the Cen-tre for Higher Education Development (CHE) inGütersloh, Germany (www.che.de), which assessesGerman university departments and assigns them tomore ‘fuzzy’ top, middle and lower tiers. It also allowsthe user to choose which indicators they want to useto sort universities. CHE collects survey data fromfaculty and students. These data are used to generatespecific comparisons between institutions of re -search, teaching and services within each separatediscipline and function. The CHE data are providedvia an interactive web-enabled database that permits
Ethics Sci Environ Polit 13: pp10, 201422

Taylor et al.: Rankings: the sorcerer’s new apprentice
each student to examine and rank identified pro-grammes and/or institutional services based on theirown chosen criteria (CHE 2006). The idea of basingthe classification on fuzzy sets and what we call‘interactive ranking’ is something we strongly sup-port. While the CHE data themselves are subject tothe same problems described in the section onRankmart, it does offer a new and less problematicmethodology. Those interrogating the data decidethemselves which indicators meet their desiredobjectives; this is healthy acknowledgement that‘quality is in the eye of the beholder’. The CHE rank-ings dispense with the holistic rank ordering of insti-tutions, noting that there is no ‘one best university’across all areas (Marginson 2006a).
The real problems start to arise when rankings tryto be both heterogeneous and comprehensive at thesame time. The attraction of a single score judgingbetween entities that would otherwise be impossibleto compare is logical, but statistically-flawed. ‘Aranking can be heterogeneous (universally applica-ble) as long as it doesn’t try to be too comprehensive(including all possible variables); it can be compre-hensive as long as it doesn’t try to measure thingsthat are heterogeneous’ (Gladwell 2011, p. 3).
For several years, Jeffrey Stake, a professor at theIndiana University law school, has run a Web sitecalled ‘the Ranking Game’ (http:// monoborg. law.indiana. edu/ Law Rank/ play. shtml). It contains aspreadsheet loaded with statistics on every lawschool in the US and allows users to pick their owncriteria, assign their own weights and construct anyranking system they want. Stake’s intention is todemonstrate just how subjective rankings are, toshow how determinations of ‘quality’ rely on arbi-trary judgments about how different variables shouldbe weighted (Gladwell 2011). Rankings, it turn out,are full of implicit ideological choices, like not includ-ing the price of education or value for money, or effi-cacy (how likely you are to graduate with a degree):‘Who comes out on top, in any ranking system, isreally about who is doing the ranking’ (Gladwell2011, p. 13).
It is vital that rankings systems are crafted so as toserve the purposes of higher education, rather thanpurposes being reshaped as an unintended conse-quence of rankings (Marginson & Van der Wende2007). Gladwell (2011) eloquently expressed the dif-ficulty of creating a comprehensive ranking forsomething as complex and multi-faceted as highereducation. The reality is that the science of how toconstruct multi-parametric indices is still embryonicand disputable. Multi-parametric indices reflect the
diachronic, ontological and epistemological tensionbetween the need of simplification and quantificationon the one hand, and the apparent integrative andqualitative character of phenomena on the other. Thelimited socio-economic interests commonly repre-sented through the ranking systems and the fact thatthey tell us little in relation to social exclusion andstratification should also be taken into account. Inany case, ranking systems should be subject to theo-retically informed analysis and discussed within awider framework that encompasses society, econ-omy, restructuring and the underlying uneven forcesthat determine such procedures. If analysed from acritical realist perspective, it is possible perhaps thatrankings may be able to offer estimates that are help-ful for comparative analyses between different aca-demic systems and environments. Having said that,intricate and socially and historically determinedprocedures such as knowledge production, academicperformance and teaching quality, are not easilyreducible to simple quantitative groupings and cate-gorisation. This was also verified by Bollen et al.(2009), who, in the content of research impact, per-formed a principal component analysis of 39 scien-tific and scholarly impact measures and found thatimpact is a multi-dimensional construct that cannotbe adequately measured by any single indicator − inparticular citation counts. Their analysis includedsocial network statistics and usage log data, 2 impor-tant alt-metrics parameters.
The semantic web, armed with metadata harvestingtools, provides a rich source of new information thatshould also be harnessed to support the assessment ofhigher education. Our belief is that alt-metrics have acentral role to play. Perhaps a system like that pro-posed by the CHE in Gütersloh or the new U-multi-rank (www.u-multirank.eu/) can be expanded to in-clude indicators related to the real educationalexperiences of students, i.e. how they perceive theireducational training, the quality of contact time, tu-ition fees, the cost of living, future job prospects andsocial development. Such things can even be crowd-sourced to students who can rate universities and thedepartments (and even staff) with which they haveexperience. This source of collective wisdom is ex-tremely valuable and should be given more promi-nence. In the context of research assessment, alt-met-rics are gaining in popularity as early indicators ofarticle impact and usefulness. Why is this so? The fun-damental reason is that traditional citations need timeto accrue and hence they are not the best indicator ofimportant recently published work. Alt-metrics ap-pear more rapidly. A typical article is likely to be most
23
Ethics Sci Environ Polit 13: pp10, 2014
tweeted on its publication day and most bloggedwithin a month or so of publication (Thelwall et al.2013). The fact that citations take typically over a yearto start accumulating casts into doubt the annual va-lidity of rankings that rely heavily on citation counts.Social media mentions, being available immediatelyafter publication (and even before publication in thecase of preprints), offer a more rapid assessment ofimpact. Evidence of this trend was published in a pa-per last year by Shuai et al. (2012), who analysed theonline response to 4606 articles submitted to thepreprint server arXiv.org between October 2010 andMay 2011. The authors found that Twitter mentionshave shorter delays and narrower time spans andtheir volume is statistically correlated with thenumber of arXiv downloads and also early citationsjust months after the publication of a preprint. Brodyet al. (2006) described how early web usage statisticscan be used as predictors of later citation impact, andTaraborelli (2008) outlined how social software anddistributed (bottom-up) methods of academic evalua-tion can be applied to a form of peer-review he called‘soft’ peer-review. In the context of crowdsourcingstudent opinion about the quality of their higher edu-cation, alt-metrics appear to have the potential to befast, transparent and more objective. More evidencesupporting crowdsourcing comes from a recent paperpublished in the journal PLOS One that developed amethod to derive impact scores for publications basedon a survey of their quantified importance to end-users of research (Sutherland et al. 2011). The processwas able to identify publications containing high-quality evidence in relation to issues of strong publicconcern. We see alt-metrics as a welcome addition tothe toolbox for assessing higher education quality.
Universities can be very complex institutions withdozens of schools and departments, thousands of fac-ulty members and tens of thousands of students. Inshort, as things stand: ‘There’s no direct way to meas-ure the quality of an institution — how well a collegemanages to inform, inspire, and challenge its stu-dents’ (Gladwell 2011, p. 6).
CONCLUSIONS
Picking a university to attend can be a harrowingexperience for students and their parents, and canresemble an exercise in e-shopping. Rankingsappear to offer a quick-fix solution. However, as wehave shown, the rankings have been produced byapprentices. They are a quick-fix precisely because,like the sorcerer’s apprentice tired of doing chores,
the ranking agencies are not skilled in the handlingof multi-dimensional data and have come up with asimpleton’s ‘solution’. They have let out a beastthat has been reproducing and exaggerating globalhigher education inequality. The inequalities pro-duced by global economics and production, and aca-demic hierarchy are then reproduced by the rankingsystem, which serves as a commercial and stratifyingtool at the service of global academic competition.This system is now threatening to destroy not justnational higher education systems, but also the sus-tainability of local and cultural wisdom. Metrics havemade their way into many spheres of academia, andthe same old problems keep resurfacing, viz. theinaccuracy of single-parameter metrics to captureholistic features as well as inconsistencies betweenvarious multi-parametric indices. Taylor et al. (2008)argued that the citation-based impact factor wasresponsible for creating and exaggerating a journalmonopoly that laid siege to science. Lessons seem notto have been learned. Global university rankings aredoing to universities and the higher education sectorwhat the journal impact factor did to tenure evalua-tion and the research sector.
Rankings are not representative of the averagequality of education at a university or faculty, nor arethey representative of the average quality of re -searchers at these institutions. In some of the globaluniversity ranking systems, the academic establish-ments of entire continents (like Africa or South Amer-ica) are not even present in the top 200. We haveseen also how the brain gain of the top 200 universi-ties and their host countries is a brain drain for therest of the world. The Global Financial Crisis of 2008and the on-going Eurozone crisis is testament to this,as we saw how the case of Greece brings to lightmany of the contradictions. The Greek drama unfold-ing will sooner or later have a negative impact uponuniversities’ performance, a fact that would be ex -pected to correlate with them descending the ranks.Yet, rankings themselves are misleading as they donot measure many of the aspects highlighted here(such as free tuition), and will continue to mislead aslong as they are constructed in the current manner.Essentially, as the cumulative-causation effect ex -plains, as Greece is devaluated, the country’s univer-sities are also expected to devaluate, with neoliberalrankings re-enforcing and accelerating this devalua-tion process. This is a huge warning bell of possiblefuture trends in other nations like Cyprus, Spain, Por-tugal, Italy and Ireland in Europe also being sub-jected to severe austerity. With contagion spreading,other countries will no doubt suffer similar fates.
24

Taylor et al.: Rankings: the sorcerer’s new apprentice
The loss of highly skilled labour via brain drain andthe under-funding of higher education is a threat toknowledge acquisition and therefore also wealth cre-ation in these countries and indeed, whole conti-nents. This loss of local knowledge and the local cul-ture it embodies is not in the interests of humanity.Action needs to be taken immediately to conserveknowledge creation and re-production and to tamethe rankings and the policy-makers that exploitthem. What is needed is a return to the global vil-lage — a network of universities worldwide whereeach is valued and accessible, and where quality isclearly defined and can be monitored. At the close ofthe last century, Stiglitz (1999) described how knowl-edge is one of the global public goods and how it is arequirement for international cooperation in the 21stcentury. To conserve our collective educational her-itage, we are going to have to embrace this idea andflatten the global higher education hierarchy. IsaacNewton, in a letter to his rival Robert Hooke in 1676,said, ‘we stand on the shoulders of giants’. A goodhigher education, wherever we receive it, and inwhichever language, is one that gives us the helpinghand we need to stand on these shoulders and lookout onto new knowledge horizons. Pedagogical gemsexist the world over; our job is not to count them, butto find them, embrace them and conserve them.
The digital age, while giving birth to new liberat-ing modes of scholarly communication, has alsogiven birth to many sorcerers’ apprentices — finan-cial agencies producing credit ratings, proprietarycitation providers producing journal impact factorsand now media agencies producing global universityrankings. Every time, the apprentices have wieldedtheir power irresponsibly. In the case of credit rat-ings, the destruction of national economies hassparked rebellions spreading like wildfire acrosscontinents. Citation impact has led to tenure insecu-rity and citation-based malpractices, but also gavebirth to a global free open-access movement. Globaluniversity rankings are increasing brain drain andleading to knowledge extinction in large areas of theplanet, but here too there is strong resistance;national policy makers and university ad ministratorsare starting to refuse to play this rigged game. Weknow that the sorcerer is out there and has hiddenthe truth about the quality of higher education in thenumbers. Our job is to unravel the mystery hidden inthe 1s and 0s so that the sorcerer, freed from theapprentices’ ‘services’, can regain control of theworkshop. Until that time, we propose the followingprotocol be followed to tame wayward apprenticesand their rankings:
• Reject all rankings based on irreproducible repu-tational survey data• Reject all rankings that involve arbitrary weight-ings in the aggregation of their indicators• Reject all rankings that focus exclusively onresearch performance or on teaching• Reject all rankings that do not include cost of edu-cation indicators• Reject all rankings that do not normalise for disci-pline and language• Reject all higher education policies based on rank-ings alone• Foster interactive, user-specified combinations ofindicators that are open and transparent• Foster the issuing of statements of purpose toaccompany all rankings• Foster the use of independent agents to collect,process and analyse data• Foster research into new proxies and assess theirapplicability and co-linearity.
Acknowledgements. M.T. is supported by a FP7-PEOPLE-2011-IEF grant. P.P. was supported by grants JCI–2010–06790, ECO–2011–23634 and P1–1B2012–27.
LITERATURE CITED
Aguillo IF, Ortega JL, Fernández M (2008) Webometricranking of world universities: introduction, methodology,and future developments. High Educ Eur 33: 233−244
Aguillo IF, Bar-Ilan J, Levene M, Ortega JL (2010) Compar-ing university rankings. Scientometrics 85: 243−256
Altbach PG (2007) Empire of knowledge and development.In: Altbach PG, Balán J (eds) World class worldwide: transforming research universities in Asia and LatinAmerica. Johns Hopkins University Press, Baltimore,MD, p 1−28
Amsler SS, Bolsmann C (2012) University ranking as socialexclusion. Br J Sociol Educ 33: 283−301
Baty P (2012) Rankings don’t tell the whole story − Handlethem with care. University World News 227. Available atwww.universityworldnews.com/article.php?story=20120626171938451
Billaut JC, Bouyssou D, Vincke P (2009) Should you believein the Shanghai ranking? An MCDM view. Sciento -metrics 84: 237−263
Bloom D (2005) Raising the pressure: globalization and theneed for higher education reform. In: Jones GA, McCar-ney PL, Skolnik ML (Eds) Creating knowledge: strength-ening nations: the changing role of higher education.University of Toronto Press, Toronto, p 21−41
Bollen J, Van de Sompel H, Smith JA, Luce R (2005) Towardalternative metrics of journal impact: a comparison ofdownload and citation data. Inf Process Manag 41: 1419−1440
Bollen J, Van de Sompel H, Hagberg A, Chute R (2009) Aprincipal component analysis of 39 scientific impactmeasures. PLoS ONE 4: e6022
25

Ethics Sci Environ Polit 13: pp10, 2014
Bookstein FL, Seidler H, Fieder M, Winckler G (2010) Toomuch noise in the Times Higher Education rankings. Scientometrics 85: 295−299
Bremner J, Haub C, Lee M, Mather M, Zuehlke E (2009)World population prospects: key findings from PRB’s2009 World Population Data Sheet. Population ReferenceBureau, United Nations, Washington, DC
Brody T, Harnad S, Carr L (2006) Earlier Web usage statis-tics as predictors of later citation impact. J Am Soc Inf SciTechnol 57: 1060−1072
Buela-Casal G, Perakakis P, Taylor M, Checa P (2006) Meas-uring internationality: reflections and perspectives onacademic journals. Scientometrics 67: 45−65
Butler D (2007) Academics strike back at spurious rankings.Nature 447: 514−515
Cameron WB (1963) Informal sociology, a casual introductionto sociological thinking. Random House, New York, NY
Center for Higher Education Development (CHE) (2006)Study and research in Germany. University rankings,published in association with Die Zeit. http:// www. daad.de/ deutschland/studium/ hochschulranking/ 04708. en. html
Enserink M (2007) Who ranks the university rankers? Science 317: 1026−1028
Florian RV (2007) Irreproducibility of the results of theShanghai academic ranking of world universities. Scien-tometrics 72: 25−32
Frank R, Cook P (1995) The winner-take-all society. TheFree Press, New York, NY
Gewirtz P, Ball SJ, Bowe R (1995) Markets, choice andequity in education. Open University Press, Buckingham
Gladwell M (2007) Blink: the power of thinking withoutthinking. Back Bay Books, New York, NY
Gladwell M (2011) The order of things. New Yorker 87: 68−75
Grewal R, Dearden JA, Llilien GL (2008) The universityrankings game. Am Stat 62: 232-237
Hazelkorn E (2013) World-class universities or world classsystems? Rankings and higher education policy choices.In: Marope PTM, Wells, PJ, Hazelkorn E (eds) Rankingsand accountability in higher education: uses and mis-uses, UNESCO, Paris, Forthcoming
Held D, McGrew A, Goldblatt D, Perraton J (1999) Globaltransformations: politics, economics and culture. Stan-ford University Press, Stanford, CA
Herman EYC, Chomsky NN (1988) Manufacturing consent: the political economy of the mass media. Pantheon, NewYork, NY
Holmes R (2012) Power and responsibility: the growinginfluence of global rankings. University World News 228.Available at www. universityworldnews. com/ article. php?story= 20120630083447805
International Rankings Expert Group (IREG) (2006) TheBerlin Principles on ranking of higher education institu-tions, 20th of May, 2006. Available at www. ireg-observ-atory. org/ index. php? option= com_ content& task= view&id= 41& Itemid= 48
Interuniversity Higher Education Policy Network (2013) TheGreek higher education institutions in the world rank-ings: universities, technical institutions, private struc-tures. Study 8, 2013. Available at http:// hepnet. upatras.gr/ xfiles/ pubs/ HEP%20translation%20final.pdf.
Ioannidis JPA, Patsopoulos NA, Kavvoura FK, Tatsioni Aand others (2007) International ranking systems for uni-versities and institutions: a critical appraisal. BMC Med5: 30
Ishikawa M (2009) University rankings, global models, andemerging hegemony: critical analysis from Japan. J StudInt Educ 13: 159−173
Jeong H, Néda Z, Barabási AL (2003) Measuring preferen-tial attachment in evolving networks. Europhys Lett 61: 567
Jöns H, Hoyler M (2013) Global geographies of higher edu-cation: the perspective of world university rankings.Geoforum 46: 45−59
Karabel J (2005) The chosen: the hidden history of admis-sion and exclusion at Harvard, Yale, and Princeton.Houghton Mifflin, Boston, MA
King C (2007) Of nations and top citations: Whose papersrate as elite? ScienceWatch 18(3)
López-Illescas C, De Moya-Anegón F, Moed HF (2011) Aranking of universities should account for differences intheir disciplinary specialization. Scientometrics 88: 563−574
Marginson S (2006a) Dynamics of national and global com-petition in higher education. High Educ 52: 1−39
Marginson S (2006b) Global university rankings at the endof 2006: Is this the hierarchy we have to have?OECD/IMHE & Hochschulrektorenkonferenz Workshopon Institutional Diversity: rankings and typologies inhigher education, Bonn, 4–5 Dec
Marginson S (2006c) The Anglo-American university at itsglobal high tide. Minerva 44: 65−87
Marginson S, Van der Wende M (2007) To rank or to beranked: the impact of global rankings in higher educa-tion. J Stud Int Educ 11: 306−329
Marope M (2013) Rankings and accountability in highereducation: uses and misuses. Education on the move.UNESCO, Paris
Morley L (2003) Quality and power in higher education.Open University Press, Buckingham
Myrdal G (1957) Economic theory and underdevelopedregions. Gerald Duckworth Press, London
Newman ME (2001) Clustering and preferential attachmentin growing networks. Phys Rev E Stat Nonlin Soft MatterPhys 64: 025102
Organization for Economic Cooperation and Development(OECD) (2006) Education at a glance. OECD Publishing,Paris
Ortega JL, Aguillo IF (2009) Mapping world-class universi-ties on the Web. Inf Process Manag 45: 272−279
Rauhvargers A (2013) Global university rankings and theirimpact - Report II. Report on Rankings 2013. EuropeanUniversity Association, Brussels
Saisana M, d’Hombres B, Saltelli A (2011) Rickety numbers: volatility of university rankings and policy implications.J Reg Policy 40: 165−177
Schevitz T (2008) Stanford, UC Berkeley to set up Saudi college. San Francisco Chronicle, March 5. http:// www.sfgate. com/ bayarea/ article/ Stanford-UC-Berkeley-to-set-up-Saudi-college-3292715.php
Seglen PO (1997) Why the impact factor of journals shouldnot be used for evaluating research. BMJ 314: 498−502
Shuai X, Pepe A, Bollen J (2012) How the scientific commu-nity reacts to newly submitted preprints: article down-loads, Twitter mentions, and citations. PLoS ONE 7: e47523
Social Mobility and Child Poverty Commission (ed) (2013)Higher education: the fair access challenge. SocialMobility Report 2013, UK Government, London
Stergiou KI, Lessenich S (2013) On impact factors and uni-
26

Taylor et al.: Rankings: the sorcerer’s new apprentice 27
versity rankings: from birth to boycott. Ethics Sci EnvironPolit 13, doi: 10. 3354/ esep 00141
Stiglitz J (1999) Knowledge as a global public good. In: KaulI, Grunberg I, Stern M, (eds) Global public goods: inter-national cooperation in the 21st century. Oxford Univer-sity Press, New York, NY, p. 308–325
Sutherland WJ, Goulson D, Potts SG, Dicks LV (2011) Quan-tifying the impact and relevance of scientific research.PLoS ONE 6: e27537
Taraborelli D (2008) Soft peer review: social software anddistributed scientific evaluation. In: Hassanaly P, Ramra-jsingh A, Randall D, Salembier P, Tixier M (eds) Proc 8thInt Conf Design of Cooperative Systems (COOP ’08),Carry-Le-Rouet, May 20-23, Institut d'Etudes Politiquesd'Aix-en-Provence, Aix-en-Provence
Taylor M, Perakakis P, Trachana V (2008) The siege of science. Ethics Sci Environ Polit 8: 17–40
Thelwall M, Haustein S, Lariviere V, Sugimoto CR (2013)Do alt-metrics work? Twitter and ten other social webservices. PLoS ONE 8: e64841
Trachana V (2013) Austerity-led brain drain is killing Greekscience. Nature 496: 271
UNESCO (2003) World conference on higher educationpartners, final report: foreword by J. Daniel. Paris 23–25 June 2003. http:// unesdoc. unesco. org/ images/ 0013/001352/ 135213e. pdf. June 2003.
Van Leeuwen TN, Moed HF, Tijssen RJ, Visser MS, VanRaan AF (2001) Language biases in the coverage of theScience Citation Index and its consequences for interna-tional comparisons of national research performance.
Scientometrics 51: 335−346Van Noorden R (2012) 366 days: 2012 in review. Nature 492:
324–327Van Raan AF (2005) Fatal attraction: conceptual and
methodological problems in the ranking of univer sitiesby bibliometric methods. Scientometrics 62: 133−143
Van Raan AF, Van Leeuwen TN, Visser MS (2011) Severelanguage effect in university rankings: particularly Ger-many and France are wronged in citation-based rank-ings. Scientometrics 88: 495−498
Waltman L, Calero Medina C, Kosten J, Noyons E and oth-ers (2012) The Leiden Ranking 2011/2012: data collec-tion, indicators, and interpretation. J Am Soc Inf SciTechnol 63(12): 2419−2432
Wilson KA, McBride MF, Bode M, Possingham HP (2006)Prioritizing global conservation efforts. Nature 440: 337−340
Wintour P, Adams R (2013) Universities failing on equality ofaccess, research suggests. The Guardian, Sunday 16June. http:// www. theguardian. com/ education/ 2013/ jun/16/ universities-failing-equality-state-school-admissions
Woods P, Jeffrey B (1998) Choosing positions: living the con-tradictions of Ofsted. Br J Sociol Educ 19: 547−570
Zitt M, Filliatreau G (2007) Big is (made) beautiful: somecomments about the Shanghai ranking of world-classuniversities. In: Sadlak J, Liu NC (eds) The world-classuniversity and ranking: aiming beyond status. UNESCO-CEPES, Institute of Higher Education, Bucharest, Shang-hai Jiao Tong University, Shanghai, and Cluj UniversityPress, Cluj-Napoca, p 141−160
Editorial responsibility: Konstantinos Stergiou,Thessaloniki, Greece
Submitted: July 19, 2013; Accepted: November 23, 2013Proofs received from author(s): February 20, 2014