Performance evaluation & rankings of players in IPL 2019 by ...
11
Malaya Journal of Matematik, Vol. S, No. 1, 46-56, 2021 https://doi.org/10.26637/MJMS2101/0009 Performance evaluation & rankings of players in IPL 2019 by DEA & SEM Arijit Ghosh 1 , Munmun Dey 2 , Banhi Guha 3 , Subrata Jana 4 and Anirban Sarkar 5 Abstract The quantitative study of sports data, especially cricket team sport is an interesting field. This paper investigates the efficiency of batsmen, bowlers and all-rounder who participated in the Indian Premier League competition 2019. First, input data and output data were validated using Structural Equation Modeling (SEM) and then Data Envelopment Analysis (DEA), a Linear Programming (LP) based technique was used for evaluating the efficiency measurement of the batsmen, bowlers and all-rounder by ranking them on the basis of DEA Scores. The Auction Price was also taken as a parameter for evaluating the value for money spent on each player. The ranking without auction price is based solely on Cricketing parameters. Cricketing parameters along with Auction price depicts the ranking from the context of value for money. The results assist the decision makers in figuring out the position of the players on the basis of Cricketing performance as well as Cricketing return based on the money invested. This is the first study applying DEA and SEM to rank batsmen, bowlers and all-rounder in IPL 2019. This model has been validated with Structural Equation Modeling (SEM). The uniqueness of the study lies in the fact that both cricketing performance on the ground by the players and the return on money invested on those players have been taken into consideration individually and collectively for ranking. Keywords Quantitative study, Efficiency, Modeling, IPL Competition, Skill. 1 St. Xavier’s College (Autonomous), Kolkata. 2 Department of Commerce, Vivekananda Mission Mahavidyalaya, West Bengal, India. 3 Amity University, Kolkata. 4 Seacom Engineering College, Howrah. 5 Department of Commerce & Management, West Bengal State University, Barasat. 1 [email protected]; 2 [email protected]; 3 [email protected]; 4 [email protected]; 5 anirban [email protected]. Article History: Received 01 December 2020; Accepted 28 January 2021 c 2021 MJM. Contents 1 Introduction ........................................ 46 1.1 ICC Player Rankings ................... 47 1.2 IPL Player Rankings .................... 48 2 Literature Survey ................................... 48 3 Novelities ........................................... 49 4 Methodology ........................................ 49 4.1 Structural Equation Model (SEM) .......... 49 4.2 Data Envelopment Analysis .............. 49 5 Data ................................................. 50 6 Results & Analysis ................................. 51 6.1 Analysis of Performance of Batsmen ........ 51 6.2 Analysis of Performance of Bowlers ........ 53 6.3 Analysis of Performance of All-rounder ...... 54 7 Conclusions, Limitations & Future scope ......... 55 References ......................................... 55 1. Introduction Indian Premier League (IPL) is a franchise-based T-20 cricket competition launched by BCCI on 13th September, 2007 with a grandiloquent celebration in April, 2008. Lots of money, big corporate and celebrities are involved in this tournament. Eight teams play one another twice in a home and away for- mat. Eventually, the top ranking teams of round robin league qualify for the play offs. From the league phase the highest ranking two teams play against each other, which is called first qualifying match, the winner of this match goes to the IPL final and the loser gets second chance to qualify for the IPL
-
Upload
khangminh22 -
Category
Documents
-
view
0 -
download
0
Transcript of Performance evaluation & rankings of players in IPL 2019 by ...

Malaya Journal of Matematik, Vol. S, No. 1, 46-56, 2021
https://doi.org/10.26637/MJMS2101/0009
Performance evaluation & rankings of players in IPL2019 by DEA & SEMArijit Ghosh1, Munmun Dey2, Banhi Guha3, Subrata Jana4 and Anirban Sarkar5
AbstractThe quantitative study of sports data, especially cricket team sport is an interesting field. This paper investigatesthe efficiency of batsmen, bowlers and all-rounder who participated in the Indian Premier League competition2019. First, input data and output data were validated using Structural Equation Modeling (SEM) and then DataEnvelopment Analysis (DEA), a Linear Programming (LP) based technique was used for evaluating the efficiencymeasurement of the batsmen, bowlers and all-rounder by ranking them on the basis of DEA Scores. The AuctionPrice was also taken as a parameter for evaluating the value for money spent on each player. The rankingwithout auction price is based solely on Cricketing parameters. Cricketing parameters along with Auction pricedepicts the ranking from the context of value for money.The results assist the decision makers in figuring out the position of the players on the basis of Cricketingperformance as well as Cricketing return based on the money invested. This is the first study applying DEAand SEM to rank batsmen, bowlers and all-rounder in IPL 2019. This model has been validated with StructuralEquation Modeling (SEM). The uniqueness of the study lies in the fact that both cricketing performance on theground by the players and the return on money invested on those players have been taken into considerationindividually and collectively for ranking.
KeywordsQuantitative study, Efficiency, Modeling, IPL Competition, Skill.
1 St. Xavier’s College (Autonomous), Kolkata.2 Department of Commerce, Vivekananda Mission Mahavidyalaya, West Bengal, India.3Amity University, Kolkata.4Seacom Engineering College, Howrah.5Department of Commerce & Management, West Bengal State University, Barasat.1 [email protected]; [email protected]; [email protected]; [email protected]; 5anirban [email protected] History: Received 01 December 2020; Accepted 28 January 2021 c©2021 MJM.
Contents
1 Introduction . . . . . . . . . . . . . . . . . . . . . . . . . . . . . . . . . . . . . . . . 46
1.1 ICC Player Rankings . . . . . . . . . . . . . . . . . . . 471.2 IPL Player Rankings . . . . . . . . . . . . . . . . . . . . 48
2 Literature Survey . . . . . . . . . . . . . . . . . . . . . . . . . . . . . . . . . . . 48
3 Novelities . . . . . . . . . . . . . . . . . . . . . . . . . . . . . . . . . . . . . . . . . . . 49
4 Methodology. . . . . . . . . . . . . . . . . . . . . . . . . . . . . . . . . . . . . . . .49
4.1 Structural Equation Model (SEM) . . . . . . . . . . 494.2 Data Envelopment Analysis . . . . . . . . . . . . . . 49
5 Data . . . . . . . . . . . . . . . . . . . . . . . . . . . . . . . . . . . . . . . . . . . . . . . . . 50
6 Results & Analysis . . . . . . . . . . . . . . . . . . . . . . . . . . . . . . . . . 51
6.1 Analysis of Performance of Batsmen . . . . . . . . 516.2 Analysis of Performance of Bowlers . . . . . . . . 53
6.3 Analysis of Performance of All-rounder . . . . . . 54
7 Conclusions, Limitations & Future scope . . . . . . . . . 55
References . . . . . . . . . . . . . . . . . . . . . . . . . . . . . . . . . . . . . . . . . 55
1. IntroductionIndian Premier League (IPL) is a franchise-based T-20 cricketcompetition launched by BCCI on 13th September, 2007 witha grandiloquent celebration in April, 2008. Lots of money,big corporate and celebrities are involved in this tournament.Eight teams play one another twice in a home and away for-mat. Eventually, the top ranking teams of round robin leaguequalify for the play offs. From the league phase the highestranking two teams play against each other, which is called firstqualifying match, the winner of this match goes to the IPLfinal and the loser gets second chance to qualify for the IPL
Performance evaluation & rankings of players in IPL 2019 by DEA & SEM — 47/56
final by playing another match called second qualifier. Fromleague phase the 3rd and 4th team play against each otherand the winner plays the loser of the first qualifying match.Eventually in the IPL final match the two winners from thesecond and the first qualifying match play the final and thewinner receives the IPL trophy.The IPL auction is a gala event every year garnering a lot ofenthusiasm among the worldwide cricket fans. Each of theeight teams is given a budget of Rs.85 crore to complete theirsquads with a maximum of 25 players including a maximumof 8 overseas players. Before the auction begins, the teamsare given an opportunity to retain the players from last season.The budget that remains after the retention process is thenspent in the auction. A team can retain a maximum of fiveplayers through a combination of pre-auction retention and‘Right To Match’ (RTM) Cards. A maximum of three cappedIndia players and two capped overseas players can be retainedby each team. The RTM allows a player’s previous teamto match any winning bid for the player that they have justreleased. Often teams releases a player with the intention ofsigning him back at a cheaper price using a ‘Right To Match’card.The players that go under the hammer are first grouped bytheir specialty into categories of batsmen, all-rounder, wicket-keepers, fast bowlers and spinners who are auctioned sepa-rately. Players who sign up for the auction, set their base price,and are bought by the highest bidder. The unsold players goback and can be brought back in the final phase of the auc-tions if the franchises want them. Final unsold players at theauction are eligible to be signed up as replacement signingseither before or during the tournament.
1.1 ICC Player RankingsThe ICC Player Rankings uses a complicated moving averagewhere the players are rated on a scale of 0 to 1000 points.If a player’s performance improves over his past record, hispoints increase and if his performance declines against hispast accomplishment he loses his points. The value of eachplayer’s performance within every match is calculated usinga pre-programmed algorithm, based on objective evaluationof various circumstances in the match. The Test ratings areupdated within 12 hours after each Test match and ODI ratingsare updated at the end of each ODI series. Each individualplayer’s performance is given a different score for every singlematch.Test Match RankingsFor a batsman, the following factors are considered whilecalculating the total points:
• Runs scored i.e., more runs means more bonus points
• Strength of the opposing bowling attack- the higher thecombined ratings of the opposition’s bowling attack,proportionately more value is given to the batsman’sinnings.
• The level of run-scoring in the match- If both teamsscore 500runs in respective innings, then the computerrates it as a high scoring match, and hence 100 runsscored by a player in this innings is worth lesser than100 runs scored in a low scoring match in which bothteams score just 150 runs. Similarly, if a team scores500runs in the first innings and 200runs in the secondinnings, a century in the second innings will get morecredit than in the first innings as the general level of runscoring was higher in the first innings.
• The result of the match- If a player has scored moreruns in a match, in which his team wins then he getsbonus points. Further, bonus points will be more ifthe victory is against a strong team. For example, winbonus against the present Australian team is higher thanthe bonus against Bangladesh team.
• Out or not out -A not out innings receives a bonus as inTest match wickets matter more than in ODI.
• At which juncture the runs are scored- If a player scoreruns when his team is in crisis, then player gets morerating points.
For a bowler, the factors that are important to decide hisranking include:
• Wickets taken and runs conceded.
• Ratings of the batsmen dismissed- For example, atpresent Kohli holds the number one rank in the Test, sohis wicket will carry more rating points to bowlers thanthe wicket of Jaspreet Bumrah.
• The level of run-scoring in the match- Consider in an in-nings, the Australian team has scored 350 runs and Bhu-vneshwar Kumar took three wickets for 50 runs (3-50)and in another innings, Australian team scored 180 runsand Hardik Pandya took 3-50. So Bhuvneshwar Ku-mar will get more rating points than Pandya because hehas conceded 50 runs in a high scoring match whereasPandya has spent 50 runs in a low scoring match of just180 runs.
• Heavy workload - bowlers who bowl a large numberof overs in the match get some credit for the heavyworkload, even if they take no wickets;
• The result of the match-Bowlers who take a lot of wick-ets in a match in which his team wins, receive a bonus.That bonus will be higher if it is against a highly ratedopposition teams.
• Bowlers who do not bowl in a high-scoring innings arepenalized.
The players’ ratings are calculated by combining their weightedperformance in the latest match with their previous rating.
47
Performance evaluation & rankings of players in IPL 2019 by DEA & SEM — 48/56
This new ‘weighted average’ is then converted into points.Though recent accomplishments have more weightage thanearlier performances in his career, all his performances aretaken into account while calculating the rating points. Playerswho miss a Test match for their country, for whatever reason,lose one per cent of their points.New players start at zero points, and need to establish them-selves before they get full ratings. For example, a batsmanwho has played 10 Test innings gets 70 per cent of his rating(i.e. his rating will be between 0 and 700 points). He gets 100per cent only after he has played 40 Test innings. Similarly, abowler who has taken 30 wickets also gets 70 per cent of hisfull rating. He gets 100 per cent only after he has taken 100Test wickets. This means that successful new players need toplay a considerable number of test matches to be counted inthe world top five.One-Day RankingsThe objectives behind the ODI Ratings are similar to the TestRatings, with the following significant differences:
• Batsmen gain bonus for rapid scoring. Unlike testmatches they do not get much credit for being not out asa not out batsman is, by definition, batting at the latterpart of the innings when the value of his wicket is low
• Bowlers gain bonus for economy. A bowler who con-cedes just 26 runs in 10 overs will have his ratingimprove significantly, even though he hasn’t taken awicket.
• Unlike test match, players lose only a half per cent(1/2%) of their points for missing a match for theircountry. All ODI matches are given equal weights,except for ICC Cricket World Cup matches, where goodperformances earn bonus points.
• Big scores or wicket hauls against very weak teams getmuch less credit than the same performances againstthe strong ODI teams.
1.2 IPL Player RankingsWe can see that the ICC cricket ranking is a complex andrigorous ranking structure with varied weightage given tothe different circumstances of each match. The ICC doesnot consider the IPL performance in calculating the rankingpoints. In IPL, the Most Valuable Player Award is given tothe player who contributes most to his team in all the areaslike batting, bowling and fielding. The parameters taken intoconsideration for calculation of the players points are numberof 4s and 6s hit, number of wickets taken, number of dotballs bowled, number of catches taken or stumping done byeach player. The points added to the player for this awardare: 2.5 points will be given for each four 3.5 points will begiven for each six 3.5 points will be given for each wickettaken 1 point for each dot ball bowled by a player 2.5 pointsfor each catch or stumping by a player After adding all thepoints from the above aspects from every match, the total
points for each player will be calculated. However, there islack of evidence on selection of the few chosen parametersand the basis of determination of the points allocated for eachparameters. Hence, there is a need to devise a simplified andlogical model for ranking the performance of the cricketersin the IPL. The model suggested in this paper is a simplifiedstructure for measuring the player’s performance in one of thebiggest league of the sub-continent.
2. Literature SurveyKimber and Hansford (1993) analyzed batting in cricket sta-tistically. This study was expended by Barr and Kantor (2004)by suggesting a method to compare and select batsmen incricket. Swartz et al. (2006) projected a simulation procedurefor optimal batting order in One Day Cricket. This work wasexpanded by Swartz et al. (2009) by modeling and simula-tion for one day cricket. Karnik (2009) derived the hedonicprice equations to estimate a bid price for all the cricketersin the Indian Premier League (IPL) auction. He proposed aprice model using the data from the 2008 season and fruitfullytested next to the data from the 2009 season. The variablesin the equations were the regular playing factors such as runsscored, wickets taken and age. Van Staden (2009) proposeda graphical technique for comparison of cricketers’ bowlingand batting performances. Singh (2011) made an effort formeasuring the performance of teams in the IPL using DEA.He took both playing and non-playing factors to analyze theefficiencies of the teams in 2009 season. Lenten et al. (2012)used various playing and non-playing factors of the athletesof cricket sport that determine their biding value in the auc-tion of IPL. Sharma (2013) applied Factor Analysis approachin performance measurement of T20 cricket. Gholam et al.(2014) applied DEA for cricket team selection. Sankaran S(2014) explored the association between player performanceand valuation. He developed a new performance metrics andapplied K-means cluster analysis to identify distinct groups ofbowlers. Lin et al. (2016) applied window analysis techniqueof Data Envelopment Analysis (DEA) on Chinese Profes-sional Baseball League teams to measure offense, defense andintegrated efficiency from 2007 to 2014. Zambom-Ferraresiet al. (2015) applied DEA to measure technical efficiency ofteams UEFA Champions League. Choudhury et al. (2019)used DEA model to select Cricketers for Indian Cricket team.
In 1918, Wright used the first application of path analysis,which modeled the bone size of rabbits. Pearl (1998) arguesthat SEM allows us to test out theories with non-experimentaldata under the assumption that a causal model is true. Accord-ing the Ullman (2006), SEM is used to estimate the populationcovariance matrix and then compare the estimated populationcovariance matrix with the sample covariance matrix. If thesetwo matrices turn out to be similar, it means that the structuralmodel best fits with the data. Hershberger 2003 explored thegrowth of SEM. Manhas 2013 studied the role of SEM in the-ory testing. Teo T 2010 applied path analysis in educationalcontext. Lemmer et al. 2013 discussed techniques for team
48
Performance evaluation & rankings of players in IPL 2019 by DEA & SEM — 49/56
selection after short cricket series. De Stobbeleir et al. (2011)studied the complex relationship among variables. Saikia etal. (2019) has summarized the application of Statistics andData Mining based noteworthy works on various dimensionsof cricketing data.
3. NovelitiesCricket is an important component of entertainment in India aswell as the rest of the cricket playing countries. It is generallyagreed that the main roles of cricketers are batting and bowl-ing. Various parameters may be used to rank the players. Themost frequent parameters are batting average, striking rate forbatsmen and Economy rate, number of wickets for bowlers.All rounder are also gaining importance in this new formatof the game. Hence we cannot overlook their performancein both these areas. The ranking method used by ICC is toosophisticated and that used by IPL is unscientific. Hence thereis a need to develop a ranking method that can be appliedwith ease to scientifically rank the players as per the importantcricketing parameters.
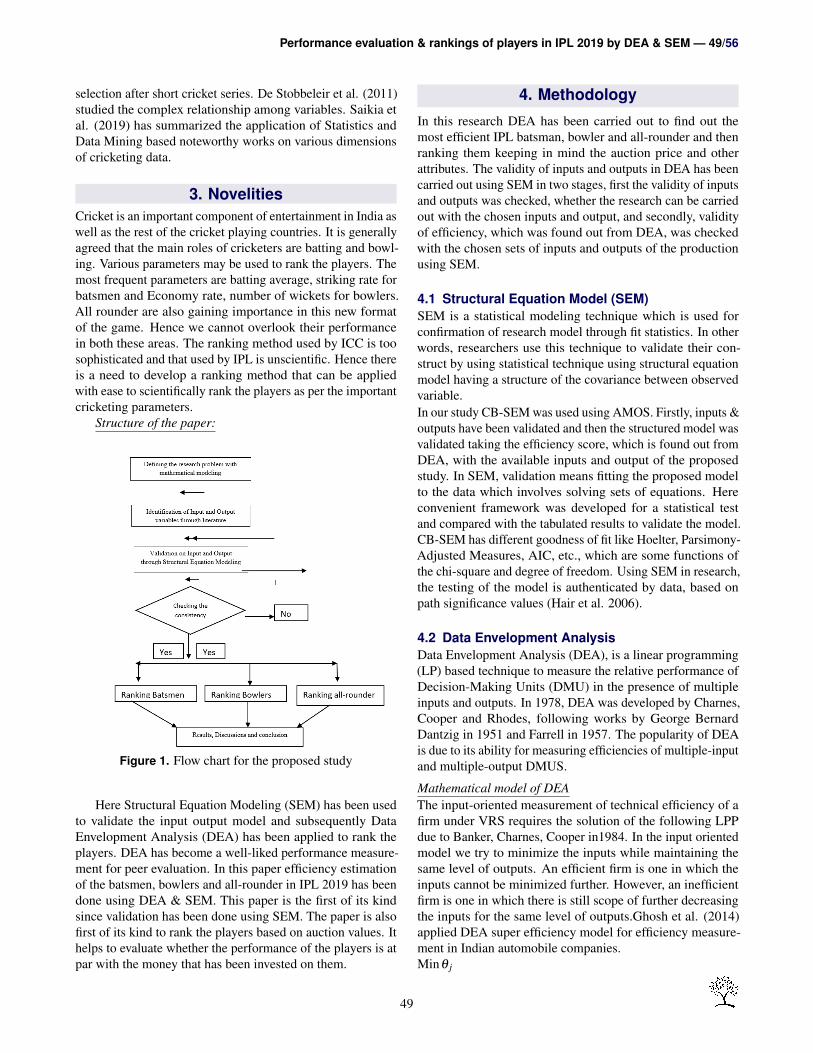
Structure of the paper:
Figure 1. Flow chart for the proposed study
Here Structural Equation Modeling (SEM) has been usedto validate the input output model and subsequently DataEnvelopment Analysis (DEA) has been applied to rank theplayers. DEA has become a well-liked performance measure-ment for peer evaluation. In this paper efficiency estimationof the batsmen, bowlers and all-rounder in IPL 2019 has beendone using DEA & SEM. This paper is the first of its kindsince validation has been done using SEM. The paper is alsofirst of its kind to rank the players based on auction values. Ithelps to evaluate whether the performance of the players is atpar with the money that has been invested on them.
4. Methodology
In this research DEA has been carried out to find out themost efficient IPL batsman, bowler and all-rounder and thenranking them keeping in mind the auction price and otherattributes. The validity of inputs and outputs in DEA has beencarried out using SEM in two stages, first the validity of inputsand outputs was checked, whether the research can be carriedout with the chosen inputs and output, and secondly, validityof efficiency, which was found out from DEA, was checkedwith the chosen sets of inputs and outputs of the productionusing SEM.
4.1 Structural Equation Model (SEM)SEM is a statistical modeling technique which is used forconfirmation of research model through fit statistics. In otherwords, researchers use this technique to validate their con-struct by using statistical technique using structural equationmodel having a structure of the covariance between observedvariable.In our study CB-SEM was used using AMOS. Firstly, inputs &outputs have been validated and then the structured model wasvalidated taking the efficiency score, which is found out fromDEA, with the available inputs and output of the proposedstudy. In SEM, validation means fitting the proposed modelto the data which involves solving sets of equations. Hereconvenient framework was developed for a statistical testand compared with the tabulated results to validate the model.CB-SEM has different goodness of fit like Hoelter, Parsimony-Adjusted Measures, AIC, etc., which are some functions ofthe chi-square and degree of freedom. Using SEM in research,the testing of the model is authenticated by data, based onpath significance values (Hair et al. 2006).
4.2 Data Envelopment AnalysisData Envelopment Analysis (DEA), is a linear programming(LP) based technique to measure the relative performance ofDecision-Making Units (DMU) in the presence of multipleinputs and outputs. In 1978, DEA was developed by Charnes,Cooper and Rhodes, following works by George BernardDantzig in 1951 and Farrell in 1957. The popularity of DEAis due to its ability for measuring efficiencies of multiple-inputand multiple-output DMUS.
Mathematical model of DEAThe input-oriented measurement of technical efficiency of afirm under VRS requires the solution of the following LPPdue to Banker, Charnes, Cooper in1984. In the input orientedmodel we try to minimize the inputs while maintaining thesame level of outputs. An efficient firm is one in which theinputs cannot be minimized further. However, an inefficientfirm is one in which there is still scope of further decreasingthe inputs for the same level of outputs.Ghosh et al. (2014)applied DEA super efficiency model for efficiency measure-ment in Indian automobile companies.Minθ j
49
Performance evaluation & rankings of players in IPL 2019 by DEA & SEM — 50/56
Subject to
p
∑j=1
λ jxm j ≤ θx jm;(m = 1,2,3, . . .1),( j = 1,2,3, . . .p)
∞
∑j=1
λ jym j ≥ y jm; i( m = 1,2,3, . . .k),(j = 1,2,3, . . .n)
p
∑j=1
λ j = 1;
λ1 ≥ 0( j = 1,2,3, . . . ,p)
Assume a set of p DMU’s, such as: DMU1,DMU2, . . . ,DMUp.Every DMU j,( j = 1,2, . . . , p), produces k outputs y jm(m =1,2, . . . ,k) by the xm j(m = 1,2, . . . , l). Suppose the inputweights use of l inputs and output weights are denoted asλ j( j = 1,2, . . . , p). The efficiency of individual DMUj can
be calculated by using the above input oriented linear pro-gramming. The process is repeated p times to calculate theoperational efficiency scores of all DMU’s. The input andoutput weights selected such that it maximises the efficiencyvalue. In general, a DMU is considered efficient, if it scores avalue 1, otherwise it is inefficient.
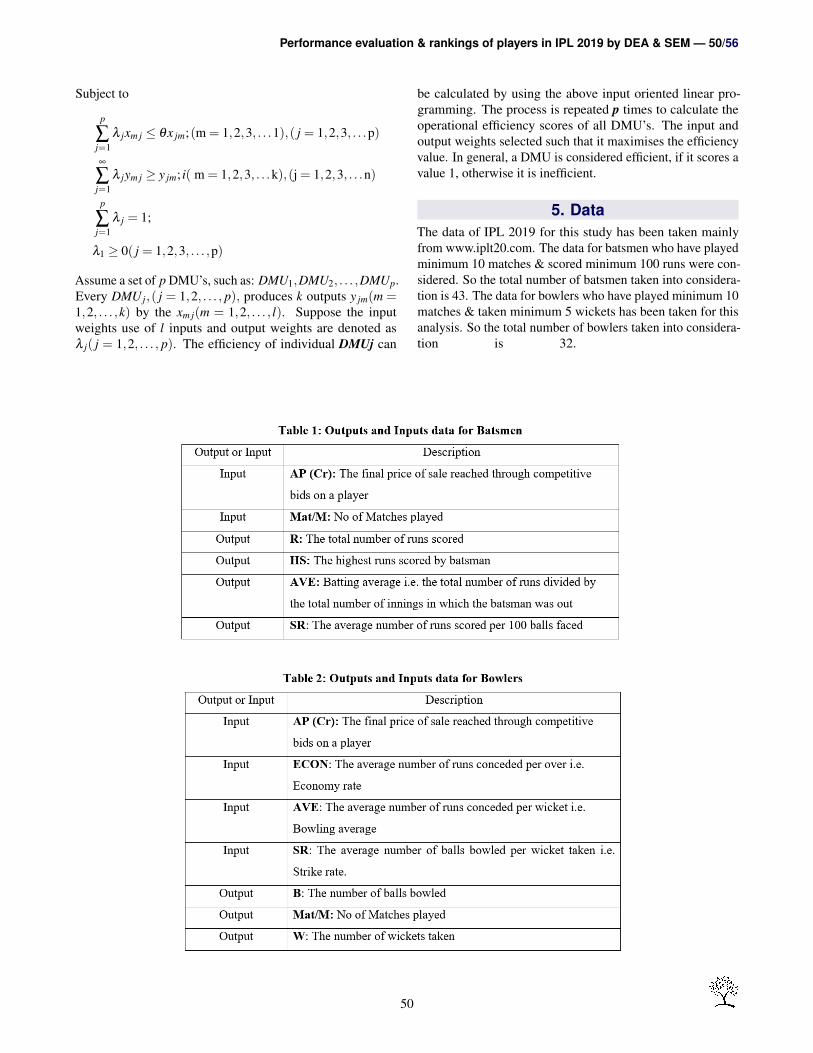
5. DataThe data of IPL 2019 for this study has been taken mainlyfrom www.iplt20.com. The data for batsmen who have playedminimum 10 matches & scored minimum 100 runs were con-sidered. So the total number of batsmen taken into considera-tion is 43. The data for bowlers who have played minimum 10matches & taken minimum 5 wickets has been taken for thisanalysis. So the total number of bowlers taken into considera-tion is 32.
50
Performance evaluation & rankings of players in IPL 2019 by DEA & SEM — 51/56
6. Results & Analysis
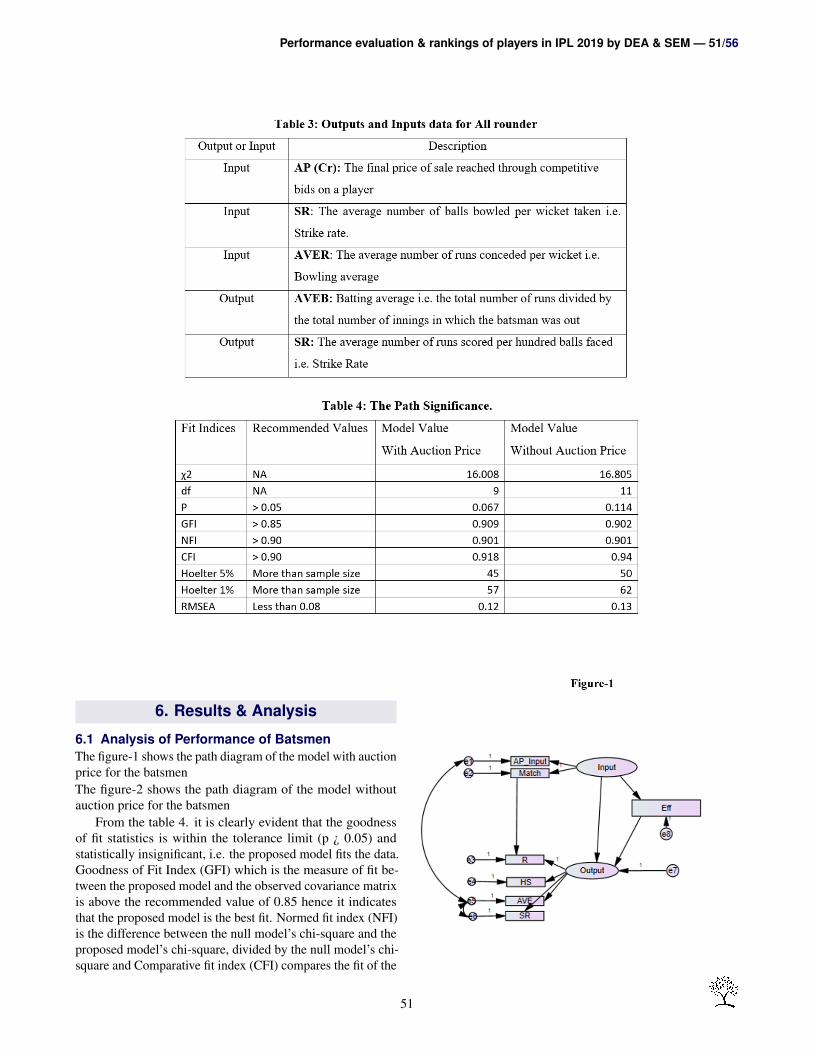
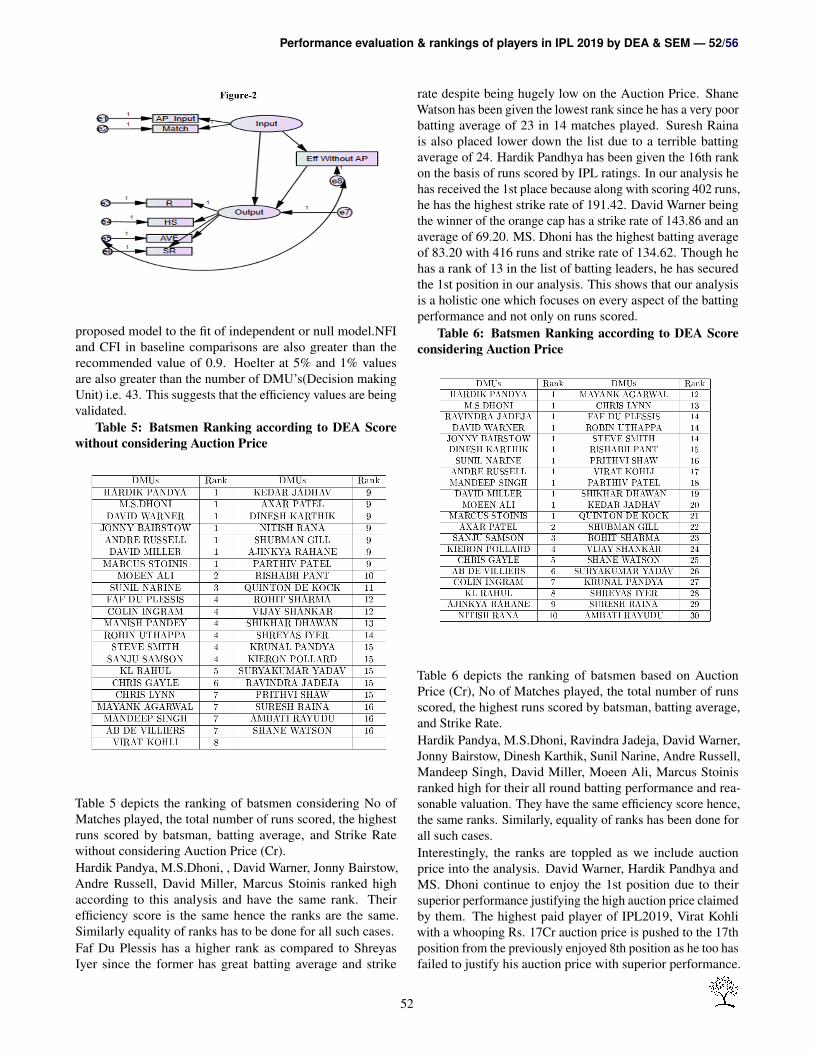
6.1 Analysis of Performance of BatsmenThe figure-1 shows the path diagram of the model with auctionprice for the batsmenThe figure-2 shows the path diagram of the model withoutauction price for the batsmen
From the table 4. it is clearly evident that the goodnessof fit statistics is within the tolerance limit (p ¿ 0.05) andstatistically insignificant, i.e. the proposed model fits the data.Goodness of Fit Index (GFI) which is the measure of fit be-tween the proposed model and the observed covariance matrixis above the recommended value of 0.85 hence it indicatesthat the proposed model is the best fit. Normed fit index (NFI)is the difference between the null model’s chi-square and theproposed model’s chi-square, divided by the null model’s chi-square and Comparative fit index (CFI) compares the fit of the
51
Performance evaluation & rankings of players in IPL 2019 by DEA & SEM — 52/56
proposed model to the fit of independent or null model.NFIand CFI in baseline comparisons are also greater than therecommended value of 0.9. Hoelter at 5% and 1% valuesare also greater than the number of DMU’s(Decision makingUnit) i.e. 43. This suggests that the efficiency values are beingvalidated.
Table 5: Batsmen Ranking according to DEA Scorewithout considering Auction Price
Table 5 depicts the ranking of batsmen considering No ofMatches played, the total number of runs scored, the highestruns scored by batsman, batting average, and Strike Ratewithout considering Auction Price (Cr).Hardik Pandya, M.S.Dhoni, , David Warner, Jonny Bairstow,Andre Russell, David Miller, Marcus Stoinis ranked highaccording to this analysis and have the same rank. Theirefficiency score is the same hence the ranks are the same.Similarly equality of ranks has to be done for all such cases.Faf Du Plessis has a higher rank as compared to ShreyasIyer since the former has great batting average and strike
rate despite being hugely low on the Auction Price. ShaneWatson has been given the lowest rank since he has a very poorbatting average of 23 in 14 matches played. Suresh Rainais also placed lower down the list due to a terrible battingaverage of 24. Hardik Pandhya has been given the 16th rankon the basis of runs scored by IPL ratings. In our analysis hehas received the 1st place because along with scoring 402 runs,he has the highest strike rate of 191.42. David Warner beingthe winner of the orange cap has a strike rate of 143.86 and anaverage of 69.20. MS. Dhoni has the highest batting averageof 83.20 with 416 runs and strike rate of 134.62. Though hehas a rank of 13 in the list of batting leaders, he has securedthe 1st position in our analysis. This shows that our analysisis a holistic one which focuses on every aspect of the battingperformance and not only on runs scored.
Table 6: Batsmen Ranking according to DEA Scoreconsidering Auction Price
Table 6 depicts the ranking of batsmen based on AuctionPrice (Cr), No of Matches played, the total number of runsscored, the highest runs scored by batsman, batting average,and Strike Rate.Hardik Pandya, M.S.Dhoni, Ravindra Jadeja, David Warner,Jonny Bairstow, Dinesh Karthik, Sunil Narine, Andre Russell,Mandeep Singh, David Miller, Moeen Ali, Marcus Stoinisranked high for their all round batting performance and rea-sonable valuation. They have the same efficiency score hence,the same ranks. Similarly, equality of ranks has been done forall such cases.Interestingly, the ranks are toppled as we include auctionprice into the analysis. David Warner, Hardik Pandhya andMS. Dhoni continue to enjoy the 1st position due to theirsuperior performance justifying the high auction price claimedby them. The highest paid player of IPL2019, Virat Kohliwith a whooping Rs. 17Cr auction price is pushed to the 17thposition from the previously enjoyed 8th position as he too hasfailed to justify his auction price with superior performance.
52
Performance evaluation & rankings of players in IPL 2019 by DEA & SEM — 53/56
On the other hand, Ravinder Jadeja who had a performancerank of 15 moves up to secure the 1st position with an auctionprice of Rs. 7Cr. Moen Ali with a pay packet of only Rs.1.7Crhas scored 220 runs for his side with a strike rate of 165.41.Moreover, Pollard with 4th rank has performed exceptionallywell at Rs.5.4Cr. with a performance rank of 15 in table 5. Onthe other hand, Steve Smith being the highest paid overseesbatsman in our list has been pushed down from the 4th to the14th rank because his strike rate and batting average are lowerthan all others in his price bracket. Ambati Rayudu continuewith the low rank as at rs.2.2 Crores, he has a poor battingaverage of 24 only.
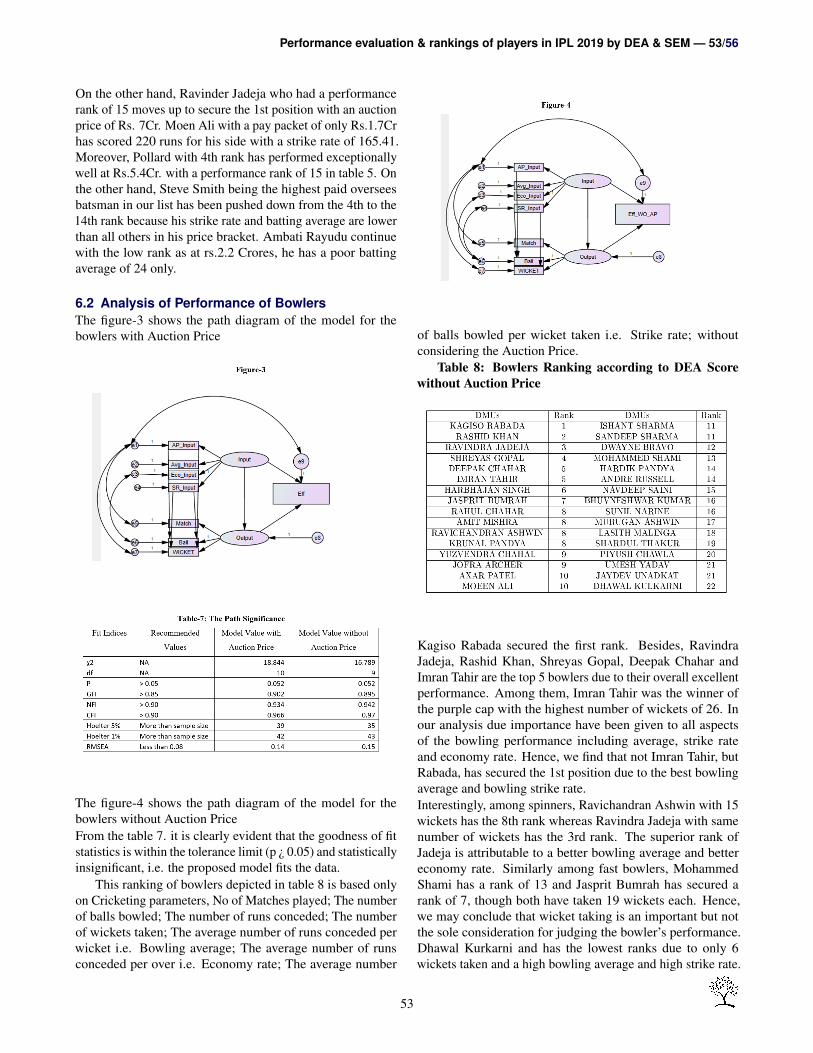
6.2 Analysis of Performance of BowlersThe figure-3 shows the path diagram of the model for thebowlers with Auction Price
The figure-4 shows the path diagram of the model for thebowlers without Auction PriceFrom the table 7. it is clearly evident that the goodness of fitstatistics is within the tolerance limit (p ¿ 0.05) and statisticallyinsignificant, i.e. the proposed model fits the data.
This ranking of bowlers depicted in table 8 is based onlyon Cricketing parameters, No of Matches played; The numberof balls bowled; The number of runs conceded; The numberof wickets taken; The average number of runs conceded perwicket i.e. Bowling average; The average number of runsconceded per over i.e. Economy rate; The average number
of balls bowled per wicket taken i.e. Strike rate; withoutconsidering the Auction Price.
Table 8: Bowlers Ranking according to DEA Scorewithout Auction Price
Kagiso Rabada secured the first rank. Besides, RavindraJadeja, Rashid Khan, Shreyas Gopal, Deepak Chahar andImran Tahir are the top 5 bowlers due to their overall excellentperformance. Among them, Imran Tahir was the winner ofthe purple cap with the highest number of wickets of 26. Inour analysis due importance have been given to all aspectsof the bowling performance including average, strike rateand economy rate. Hence, we find that not Imran Tahir, butRabada, has secured the 1st position due to the best bowlingaverage and bowling strike rate.Interestingly, among spinners, Ravichandran Ashwin with 15wickets has the 8th rank whereas Ravindra Jadeja with samenumber of wickets has the 3rd rank. The superior rank ofJadeja is attributable to a better bowling average and bettereconomy rate. Similarly among fast bowlers, MohammedShami has a rank of 13 and Jasprit Bumrah has secured arank of 7, though both have taken 19 wickets each. Hence,we may conclude that wicket taking is an important but notthe sole consideration for judging the bowler’s performance.Dhawal Kurkarni and has the lowest ranks due to only 6wickets taken and a high bowling average and high strike rate.
53
Performance evaluation & rankings of players in IPL 2019 by DEA & SEM — 54/56
Jaydev Unadkat with 10 wickets has got the 21st rank as hehas a very high bowling average.
Table 9: Bowlers Ranking according to DEA Scorewith Auction Price
Table 9 depicts the ranking of bowlers based on Auction Price(Cr); No of Matches played; The number of balls bowled; Thenumber of runs conceded; The number of wickets taken; Theaverage number of runs conceded per wicket i.e. Bowlingaverage; The average number of runs conceded per over i.e.Economy rate; The average number of balls bowled per wickettaken i.e. Strike rate.Shreyas Gopal with his twenty wickets haul and better econ-omy rate has surpassed Rabada (Auction Price of Rs.4.2 Cr.)to secure the 1st position due to a very low auction price ofRs.0.2 Cr.. Efficiency score is the same for few players hencethey been given the same ranks. Equality of ranks has to bedone for all such cases. Jaydev Unadkat with 10 wickets hasthe lowest rank as his overall performance does not commen-surate the high auction price. In fact there was a lot of buzzafter Unadkat, being an uncapped player bagged a whoppingRs.8.4 Cr. in the auction. Hardik Pandhya with the highestauction price of Rs. 11 Cr. has a rank of 16 which clearlyhighlights his poor performance. Bhuvaneswar Kumar andSunil Narine both auctioned for Rs. 8.5 Cr. and have secured17th and 18th rank respectively due to their not so impressiveperformance.
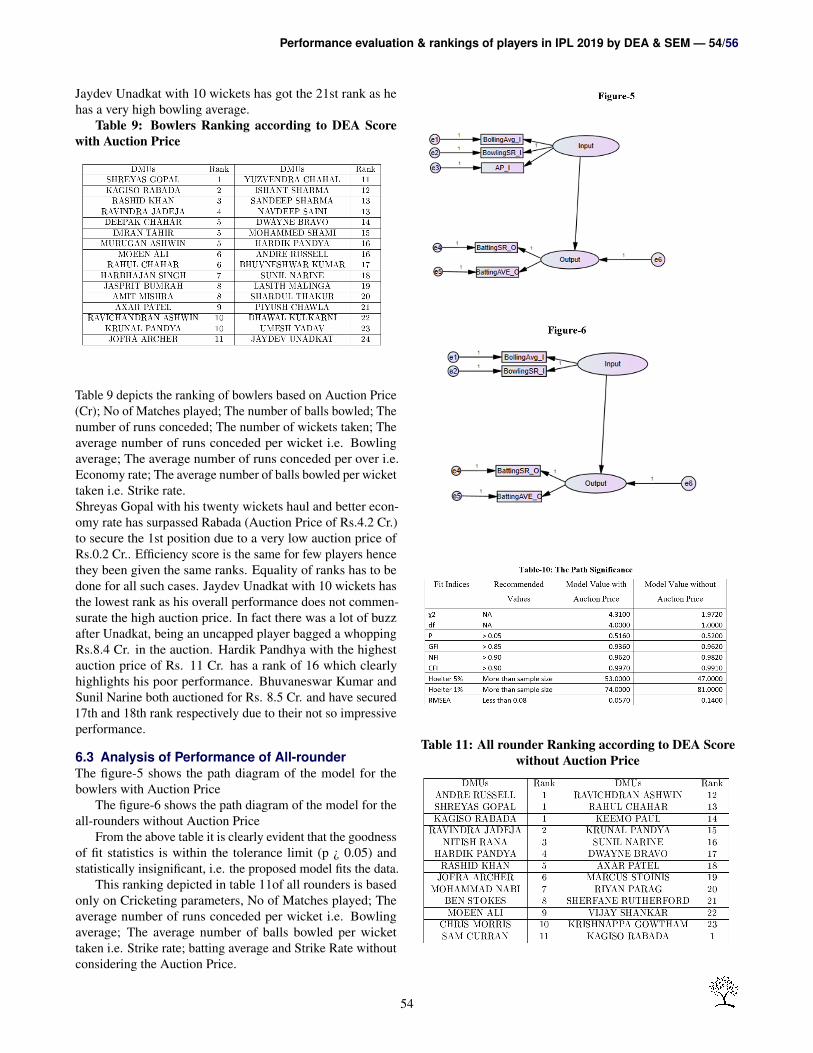
6.3 Analysis of Performance of All-rounderThe figure-5 shows the path diagram of the model for thebowlers with Auction Price
The figure-6 shows the path diagram of the model for theall-rounders without Auction Price
From the above table it is clearly evident that the goodnessof fit statistics is within the tolerance limit (p ¿ 0.05) andstatistically insignificant, i.e. the proposed model fits the data.
This ranking depicted in table 11of all rounders is basedonly on Cricketing parameters, No of Matches played; Theaverage number of runs conceded per wicket i.e. Bowlingaverage; The average number of balls bowled per wickettaken i.e. Strike rate; batting average and Strike Rate withoutconsidering the Auction Price.
Table 11: All rounder Ranking according to DEA Scorewithout Auction Price
54
Performance evaluation & rankings of players in IPL 2019 by DEA & SEM — 55/56
Andre Russell, Kagiso Rabada and Shreyas Gopal havereceived the 1st rank based on their overall excellent perfor-mance in both the areas of bowling and batting. Andre Russellhas secured the 1st rank among batsmen and with a bowlingaverage of 26 and 11 wickets, he was impressive with theball too. Russell was the top most player in the IPL players’points table with 369 points. Hardik Pandhya with 342 pointsclosely follows Russell and in our analysis too he has secureda high rank of 4 due to his all round performance. RavinderJadeja with 3rd rank among the bowlers had done well with abatting average of 35 and strike rate of 120.45, thus enablinghim to be ranked 2nd among the all-rounder. Sunil Narine andDwayne Bravo though reckoned as best All-rounder in theworld arena have failed to impress with 16th and 17th rankrespectively. Bravo has a batting average of 16 and Narine hasa poor batting average of 18 only and a high bowling averageof 35.
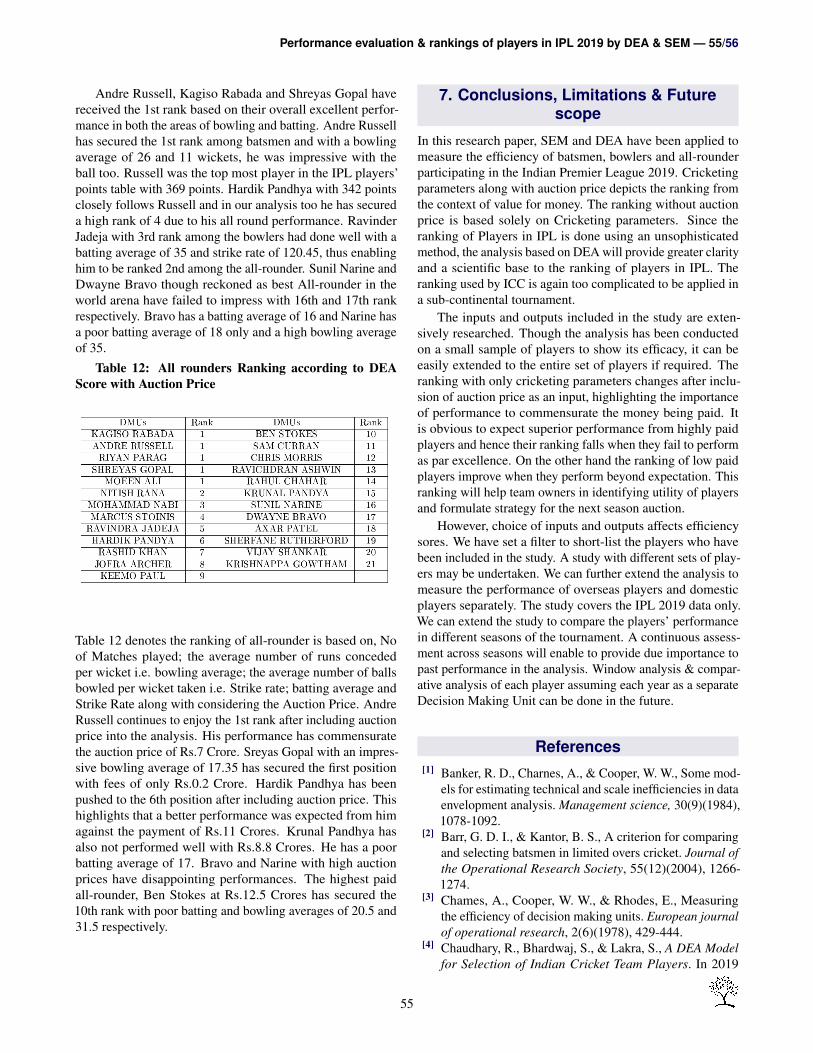
Table 12: All rounders Ranking according to DEAScore with Auction Price
Table 12 denotes the ranking of all-rounder is based on, Noof Matches played; the average number of runs concededper wicket i.e. bowling average; the average number of ballsbowled per wicket taken i.e. Strike rate; batting average andStrike Rate along with considering the Auction Price. AndreRussell continues to enjoy the 1st rank after including auctionprice into the analysis. His performance has commensuratethe auction price of Rs.7 Crore. Sreyas Gopal with an impres-sive bowling average of 17.35 has secured the first positionwith fees of only Rs.0.2 Crore. Hardik Pandhya has beenpushed to the 6th position after including auction price. Thishighlights that a better performance was expected from himagainst the payment of Rs.11 Crores. Krunal Pandhya hasalso not performed well with Rs.8.8 Crores. He has a poorbatting average of 17. Bravo and Narine with high auctionprices have disappointing performances. The highest paidall-rounder, Ben Stokes at Rs.12.5 Crores has secured the10th rank with poor batting and bowling averages of 20.5 and31.5 respectively.
7. Conclusions, Limitations & Futurescope
In this research paper, SEM and DEA have been applied tomeasure the efficiency of batsmen, bowlers and all-rounderparticipating in the Indian Premier League 2019. Cricketingparameters along with auction price depicts the ranking fromthe context of value for money. The ranking without auctionprice is based solely on Cricketing parameters. Since theranking of Players in IPL is done using an unsophisticatedmethod, the analysis based on DEA will provide greater clarityand a scientific base to the ranking of players in IPL. Theranking used by ICC is again too complicated to be applied ina sub-continental tournament.
The inputs and outputs included in the study are exten-sively researched. Though the analysis has been conductedon a small sample of players to show its efficacy, it can beeasily extended to the entire set of players if required. Theranking with only cricketing parameters changes after inclu-sion of auction price as an input, highlighting the importanceof performance to commensurate the money being paid. Itis obvious to expect superior performance from highly paidplayers and hence their ranking falls when they fail to performas par excellence. On the other hand the ranking of low paidplayers improve when they perform beyond expectation. Thisranking will help team owners in identifying utility of playersand formulate strategy for the next season auction.
However, choice of inputs and outputs affects efficiencysores. We have set a filter to short-list the players who havebeen included in the study. A study with different sets of play-ers may be undertaken. We can further extend the analysis tomeasure the performance of overseas players and domesticplayers separately. The study covers the IPL 2019 data only.We can extend the study to compare the players’ performancein different seasons of the tournament. A continuous assess-ment across seasons will enable to provide due importance topast performance in the analysis. Window analysis & compar-ative analysis of each player assuming each year as a separateDecision Making Unit can be done in the future.
References[1] Banker, R. D., Charnes, A., & Cooper, W. W., Some mod-
els for estimating technical and scale inefficiencies in dataenvelopment analysis. Management science, 30(9)(1984),1078-1092.
[2] Barr, G. D. I., & Kantor, B. S., A criterion for comparingand selecting batsmen in limited overs cricket. Journal ofthe Operational Research Society, 55(12)(2004), 1266-1274.
[3] Chames, A., Cooper, W. W., & Rhodes, E., Measuringthe efficiency of decision making units. European journalof operational research, 2(6)(1978), 429-444.
[4] Chaudhary, R., Bhardwaj, S., & Lakra, S., A DEA Modelfor Selection of Indian Cricket Team Players. In 2019
55
Performance evaluation & rankings of players in IPL 2019 by DEA & SEM — 56/56
Amity International Conference on Artificial Intelligence(AICAI), (2019), 224-227.
[5] Dantzig, G. B., Maximization of a linear function ofvariables subject to linear inequalities. Activity analysisof production and allocation, 13(1951), 339-347.
[6] De Stobbeleir, K. E., Ashford, S. J., & Buyens, D., Self-regulation of creativity at work: The role of feedback-seeking behavior in creative performance. Academy ofmanagement journal, 54(4)(2011), 811-831.
[7] Farrell, M. J., The measurement of productive efficiency.Journal of the Royal Statistical Society: Series A (Gen-eral), 120(3)(1957), 253-281.
[8] Gholam, R. A.,& Sharma, S. K. Cricket team selectionusing data envelopment analysis. European journal ofsport science, 14(1)(2014), S369-S376.
[9] Ghosh, A., Agarwal, B., Bandyopadhyay, G., & Choud-huri, K., Indian automobile companies’ financial effi-ciency measurement: An investigation using super ef-ficiency and factor analysis. Global Business Review,15(1)(2014), 121-145.
[10] Hair, J. F., Black, W. C., Babin, B. J., Anderson, R. E., &Tatham, R., Multivariate Data Analysis: Pearson Educa-tion. New Jersey: Hoboken, (2006).
[11] Hershberger, S. L., The growth of structural equationmodeling: 1994-2001. Structural Equation Modeling,10(1)(2003), 35-46.
[12] Karnik, A., Valuing cricketers using hedonic price models.Journal of Sports Economics, 11(4)(2010), 456-469.
[13] Kimber, A. C., & Hansford, A. R., A statistical analysis ofbatting in cricket. Journal of the Royal Statistical Society:Series A (Statistics in Society), 156(3)(1993), 443-455.
[14] Lemmer, H. H., Team selection after a short cricket series.European Journal of Sport Science, 13(2)(2013), 200-206.
[15] Lenten, L. J., Geerling, W., & Konya, L., A hedonicmodel of player wage determination from the Indian Pre-mier League auction: Further evidence. Sport Manage-ment Review, 15(1)(2012), 60-71.
[16] Lin*, W. B., Hsu, C. Y., Chen, C. H., & Chen, M. Y., Of-fensive or defensive?–Application of DEA bootstrappingmethodology on Chinese Professional Baseball League.International Journal of Performance Analysis in Sport,16(3)(2016), 1033-1052.
[17] Manhas, P. S., Manrai, A. K., Manrai, L. A., & Ramjit.,Role Of Structural Equation Modelling In Theory TestingAnd Development. In Quantitative Modelling In Market-ing And Management, (2013), 27-42.
[18] Pearl, J., Graphs, causality, and structural equation mod-els. Sociological Methods & Research, 27(2)(1998), 226-284.
[19] Saikia, H., Bhattacharjee, D., & Mukherjee, D., CricketPerformance Management: Mathematical Formulationand Analytics. Springer Nature, (2019).
[20] Sankaran, S., Comparing pay versus performance of IPLBowlers: an application of cluster analysis. International
Journal of Performance Analysis in Sport, 14(1)(2014),174-187.
[21] Sharma, S. K., A factor analysis approach in performanceanalysis of t-20 cricket. Journal of Reliability and Statis-tical Studies, 6(1)(2013), 69-76.
[22] Swartz, T. B., Gill, P. S., Beaudoin, D., & desilva, B. M.,Optimal batting orders in one-day cricket. Computers &operations research, 33(7)(2006), 1939-1950.
[23] Swartz, T. B., Gill, P. S., & Muthukumarana, S., Mod-elling and simulation for one-day cricket. Canadian Jour-nal of Statistics, 37(2)(2009), 143-160.
[24] Singh, S., Measuring the performance of teams in theIndian Premier League. American Journal of OperationsResearch, 1(3)(2011), 180.
[25] Teo, T., A path analysis of pre-service teachers’ attitudesto computer use: applying and extending the technologyacceptance model in an educational context. InteractiveLearning Environments, 18(1)(2010), 65-79.
[26] Ullman, J. B., Reviewing the basics and moving forward.Journal of personality assessment, 87(1)(2006), 35-50.
[27] Van Staden, P. J., Comparison of cricketers’ bowling andbatting performances using graphical displays, (2009).
[28] Wright, S., On the nature of size factors. Genetics,3(4)(1918), 367.
[29] Zambom-Ferraresi, F., Garcıa-Cebrian, L. I., Lera-Lopez, F., & Iraizoz, B., Performance evaluation in theUEFA Champions League. Journal of Sports Economics,18(5)(2017), 448-470.
[30] www.jrss.in[31] www.iplt20.com
?????????ISSN(P):2319−3786
Malaya Journal of MatematikISSN(O):2321−5666
?????????
56