IPL-13-Commercial-Advertising-Report.pdf - MxMIndia
16
Source: TAM Sports (A Division of TAM Media Research) Base : All Matches of IPL 13 and IPL 12; Only Live Matches Considered; Excluding Pre-Mid-Post Programs
-
Upload
khangminh22 -
Category
Documents
-
view
4 -
download
0
Transcript of IPL-13-Commercial-Advertising-Report.pdf - MxMIndia
Source: TAM Sports (A Division of TAM Media Research)
Base : All Matches of IPL 13 and IPL 12; Only Live Matches Considered; Excluding Pre-Mid-Post Programs
Analysis of Commercial advertising is based on Ad Volumes.
Ad Volumes are for advertising across 24 Star Network channels for both IPL 13 and IPL 12.
The study is on All Live matches during IPL Season 13 and 12 only i.e. excluding PRE-MID-POST
Programs.
The analysis is based on Pure Advertising [i.e. Excluding Franchisees, Promos, Filler, Film Trailer &
Official Broadcaster (Star Network)]
4
5
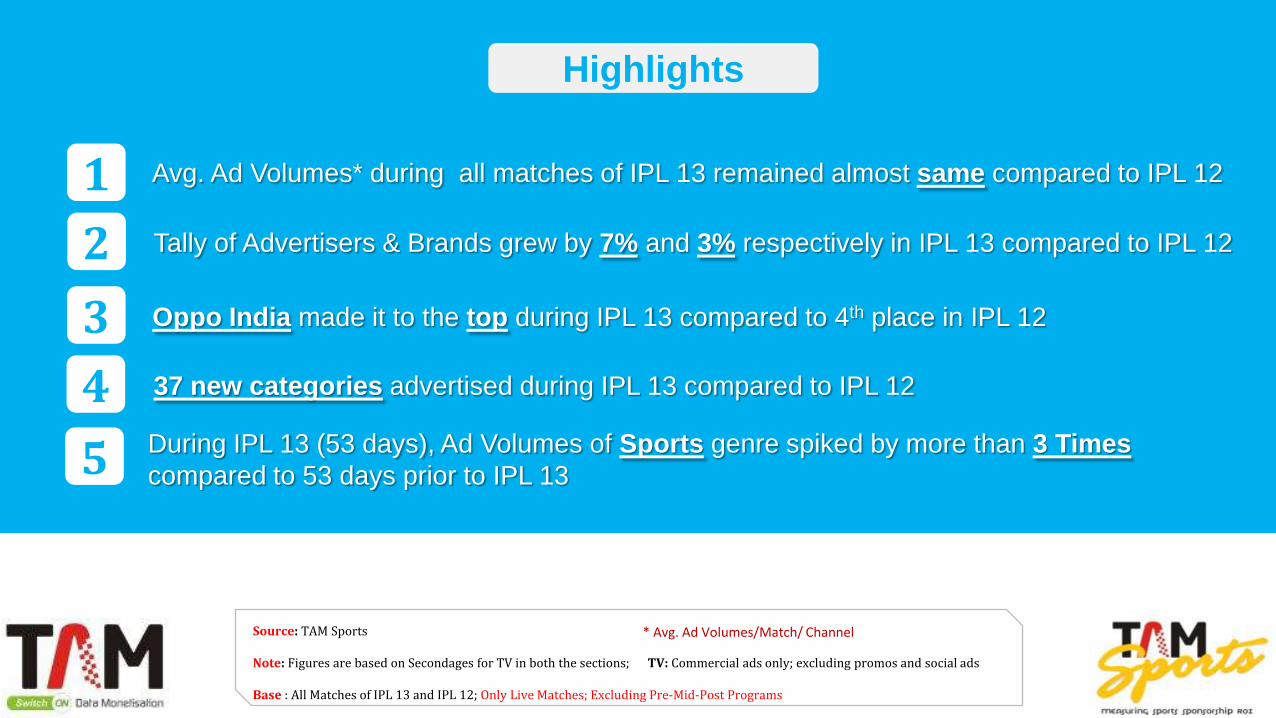
37 new categories advertised during IPL 13 compared to IPL 12
Source: TAM Sports Note: Figures are based on Secondages for TV in both the sections; TV: Commercial ads only; excluding promos and social ads Base : All Matches of IPL 13 and IPL 12; Only Live Matches; Excluding Pre-Mid-Post Programs
Avg. Ad Volumes* during all matches of IPL 13 remained almost same compared to IPL 12
Highlights
1
2
3
Tally of Advertisers & Brands grew by 7% and 3% respectively in IPL 13 compared to IPL 12
Oppo India made it to the top during IPL 13 compared to 4th place in IPL 12
During IPL 13 (53 days), Ad Volumes of Sports genre spiked by more than 3 Times
compared to 53 days prior to IPL 13
* Avg. Ad Volumes/Match/ Channel
(Including Comparison with IPL 12) Advertising Overview during IPL 13
Source: TAM Sports Note: Figures are based on Secondages for TV; Commercial ads only; excluding promos and social ads Base : All Matches of IPL 13 and IPL 12; Only Live Matches; Excluding Pre-Mid-Post Programs
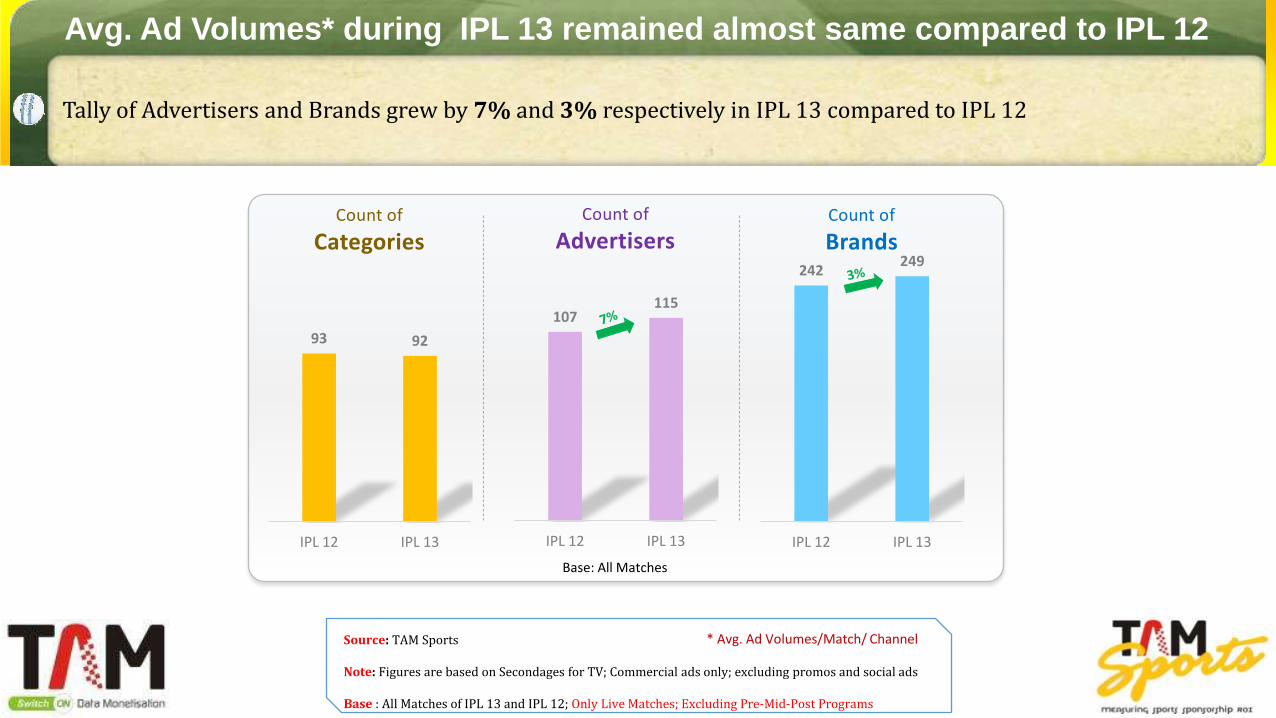
Avg. Ad Volumes* during IPL 13 remained almost same compared to IPL 12
93 92
IPL 12 IPL 13
Count of
Categories
107 115
IPL 12 IPL 13
Count of
Advertisers 242
249
IPL 12 IPL 13
Count of
Brands
Base: All Matches
Tally of Advertisers and Brands grew by 7% and 3% respectively in IPL 13 compared to IPL 12
* Avg. Ad Volumes/Match/ Channel
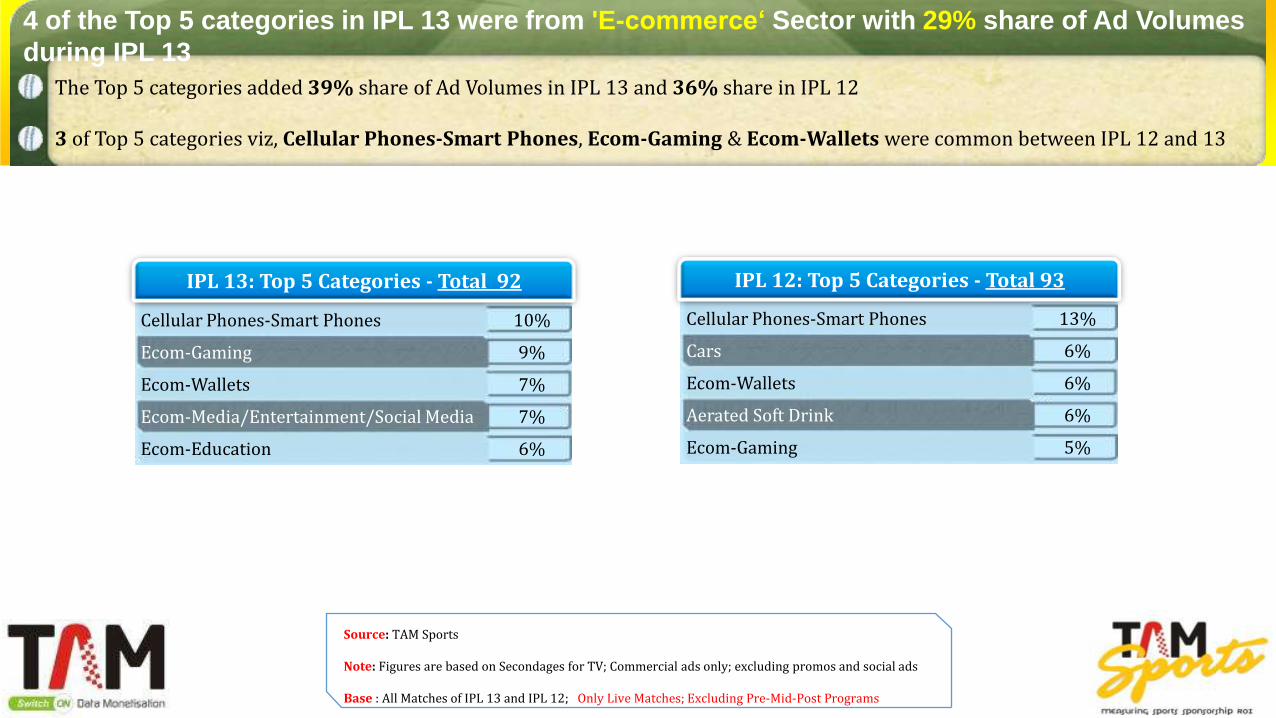
Cellular Phones-Smart Phones 13%
Cars 6%
Ecom-Wallets 6%
Aerated Soft Drink 6%
Ecom-Gaming 5%
Cellular Phones-Smart Phones 10%
Ecom-Gaming 9%
Ecom-Wallets 7%
Ecom-Media/Entertainment/Social Media 7%
Ecom-Education 6%
4 of the Top 5 categories in IPL 13 were from 'E-commerce‘ Sector with 29% share of Ad Volumes
during IPL 13
The Top 5 categories added 39% share of Ad Volumes in IPL 13 and 36% share in IPL 12 3 of Top 5 categories viz, Cellular Phones-Smart Phones, Ecom-Gaming & Ecom-Wallets were common between IPL 12 and 13
IPL 13: Top 5 Categories - Total 92 IPL 12: Top 5 Categories - Total 93
Source: TAM Sports Note: Figures are based on Secondages for TV; Commercial ads only; excluding promos and social ads Base : All Matches of IPL 13 and IPL 12; Only Live Matches; Excluding Pre-Mid-Post Programs
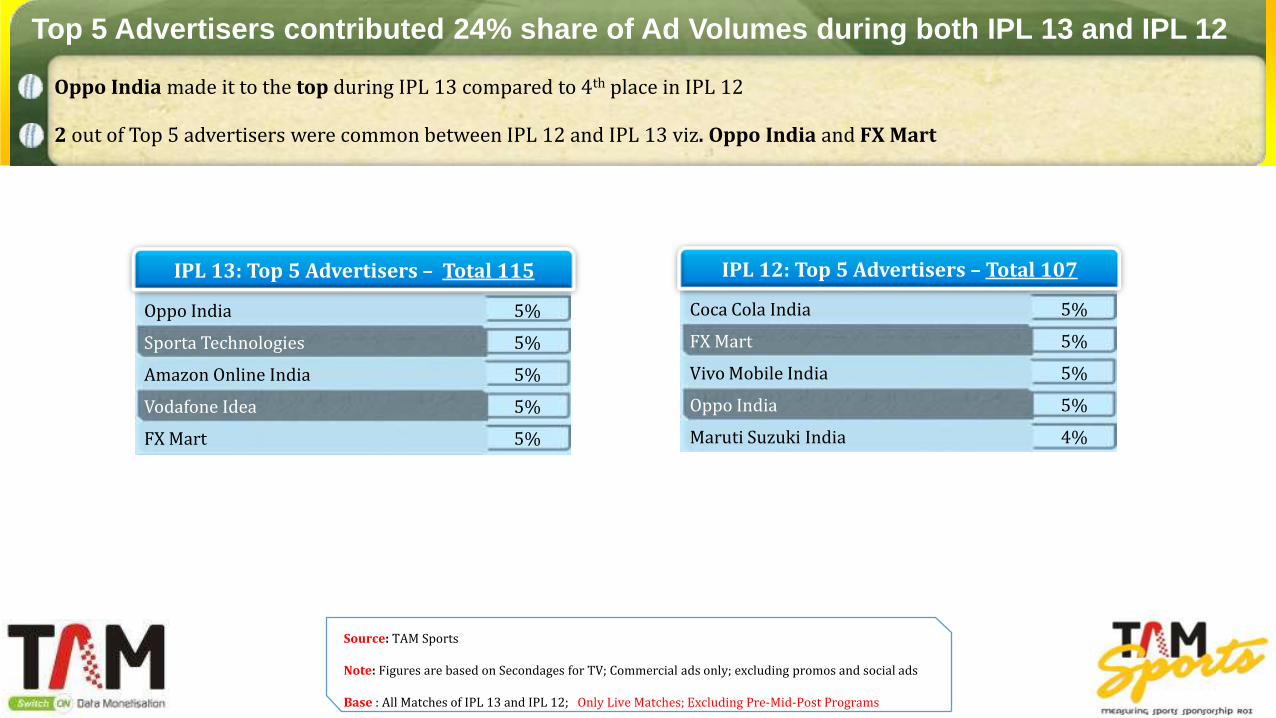
Coca Cola India 5%
FX Mart 5%
Vivo Mobile India 5%
Oppo India 5%
Maruti Suzuki India 4%
Oppo India 5%
Sporta Technologies 5%
Amazon Online India 5%
Vodafone Idea 5%
FX Mart 5%
Top 5 Advertisers contributed 24% share of Ad Volumes during both IPL 13 and IPL 12
Oppo India made it to the top during IPL 13 compared to 4th place in IPL 12
2 out of Top 5 advertisers were common between IPL 12 and IPL 13 viz. Oppo India and FX Mart
IPL 13: Top 5 Advertisers – Total 115 IPL 12: Top 5 Advertisers – Total 107
Source: TAM Sports Note: Figures are based on Secondages for TV; Commercial ads only; excluding promos and social ads Base : All Matches of IPL 13 and IPL 12; Only Live Matches; Excluding Pre-Mid-Post Programs

Sporta Technologies
Vivo Mobile India
Oppo India
Samsung India
Cellular Phones-
Smart Phones Ecom-Gaming
Playgames 24x7
Galactus Funware Technology
Ecom-Wallets
One97 Communications (Paytm.com)
Dreamplug Technologies (CRED)
FX Mart (Phonepe)
Ecom-Media/
Entertainment/ Social
Media
Facebook Inc
Eterno Infotech
Ecom-Education
Think & Learn
Whitehat Education
Advertisers under Top 5 Categories – IPL 13
Netflix International B V Upgrad Education
Source: TAM Sports Note: Figures are based on Secondages for TV; Commercial ads only; excluding promos and social ads Base : All Matches of IPL 13; Only Live Matches; Excluding Pre-Mid-Post Programs

Phonepe 5%
Vivo V15/V15 Pro 5%
Oppo F11 Pro 5%
Vimal Elaichi Pan Masala 3%
Dream11.com 3%
Dream11.com 5%
Vi Cellular Phone Service 5%
Phonepe 5%
Amazon.in 4%
Kamla Pasand Pan Masala 3%
Top 5 Brands added 21% share of Ad Volumes during both IPL 13 and IPL 12
Dream11.com moved up by 4 position to achieve 1st rank in advertising during IPL 13 compared to IPL 12 2 brands were common among the Top 5 between IPL 12 and IPL 13. viz. Dream11.com and Phonepe
IPL 13: Top 5 Brands – Total 249 IPL 12: Top 5 Brands – Total 242
Source: TAM Sports Note: Figures are based on Secondages for TV; Commercial ads only; excluding promos and social ads Base : All Matches of IPL 13 and IPL 12; Only Live Matches; Excluding Pre-Mid-Post Programs
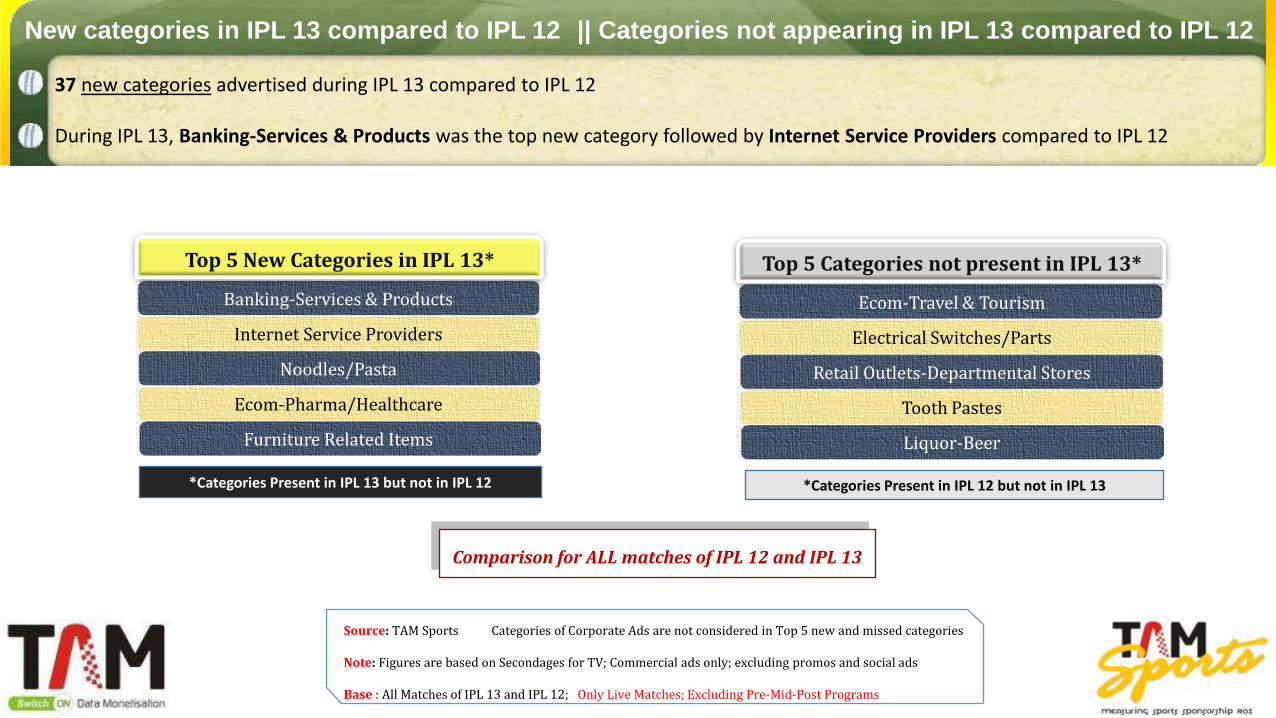
New categories in IPL 13 compared to IPL 12 || Categories not appearing in IPL 13 compared to IPL 12
37 new categories advertised during IPL 13 compared to IPL 12 During IPL 13, Banking-Services & Products was the top new category followed by Internet Service Providers compared to IPL 12
Banking-Services & Products
Internet Service Providers
Noodles/Pasta
Ecom-Pharma/Healthcare
Furniture Related Items
Top 5 New Categories in IPL 13*
Source: TAM Sports Categories of Corporate Ads are not considered in Top 5 new and missed categories Note: Figures are based on Secondages for TV; Commercial ads only; excluding promos and social ads Base : All Matches of IPL 13 and IPL 12; Only Live Matches; Excluding Pre-Mid-Post Programs
Ecom-Travel & Tourism
Electrical Switches/Parts
Retail Outlets-Departmental Stores
Tooth Pastes
Liquor-Beer
Top 5 Categories not present in IPL 13*
*Categories Present in IPL 12 but not in IPL 13 *Categories Present in IPL 13 but not in IPL 12
Comparison for ALL matches of IPL 12 and IPL 13

Ad Length (10, 20, 30 Seconds) - IPL 13
10-20 seconds ads were utilized the most during commercial breaks, followed by 21-30 seconds ads
< 10 10-20 21-30 >30
8% 79% 11% 1% Source: TAM Sports Note: Figures are based on Secondages for TV; Commercial ads only; excluding promos and social ads Base : All Matches of IPL 13; Only Live Matches; Excluding Pre-Mid-Post Programs
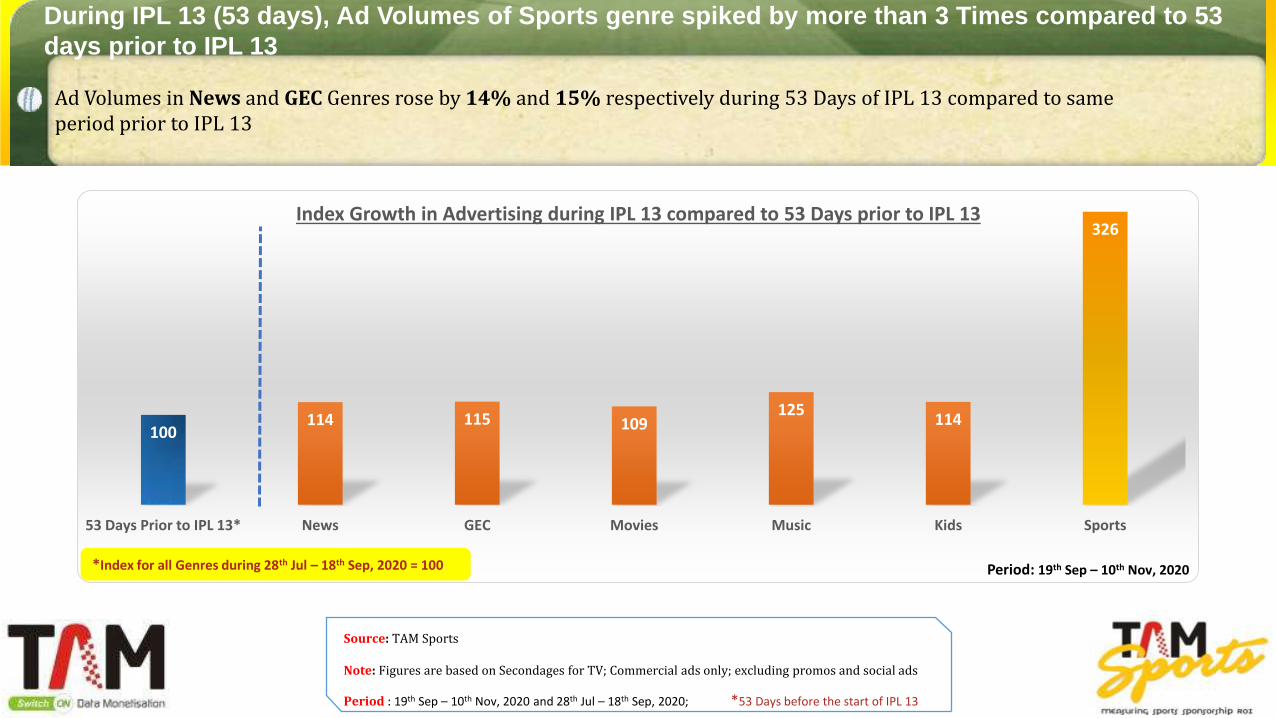
During IPL 13 (53 days), Ad Volumes of Sports genre spiked by more than 3 Times compared to 53
days prior to IPL 13
Ad Volumes in News and GEC Genres rose by 14% and 15% respectively during 53 Days of IPL 13 compared to same period prior to IPL 13
Source: TAM Sports Note: Figures are based on Secondages for TV; Commercial ads only; excluding promos and social ads
Period : 19th Sep – 10th Nov, 2020 and 28th Jul – 18th Sep, 2020; *53 Days before the start of IPL 13
100 114 115 109
125 114
326
53 Days Prior to IPL 13* News GEC Movies Music Kids Sports
Index Growth in Advertising during IPL 13 compared to 53 Days prior to IPL 13
*Index for all Genres during 28th Jul – 18th Sep, 2020 = 100 Period: 19th Sep – 10th Nov, 2020
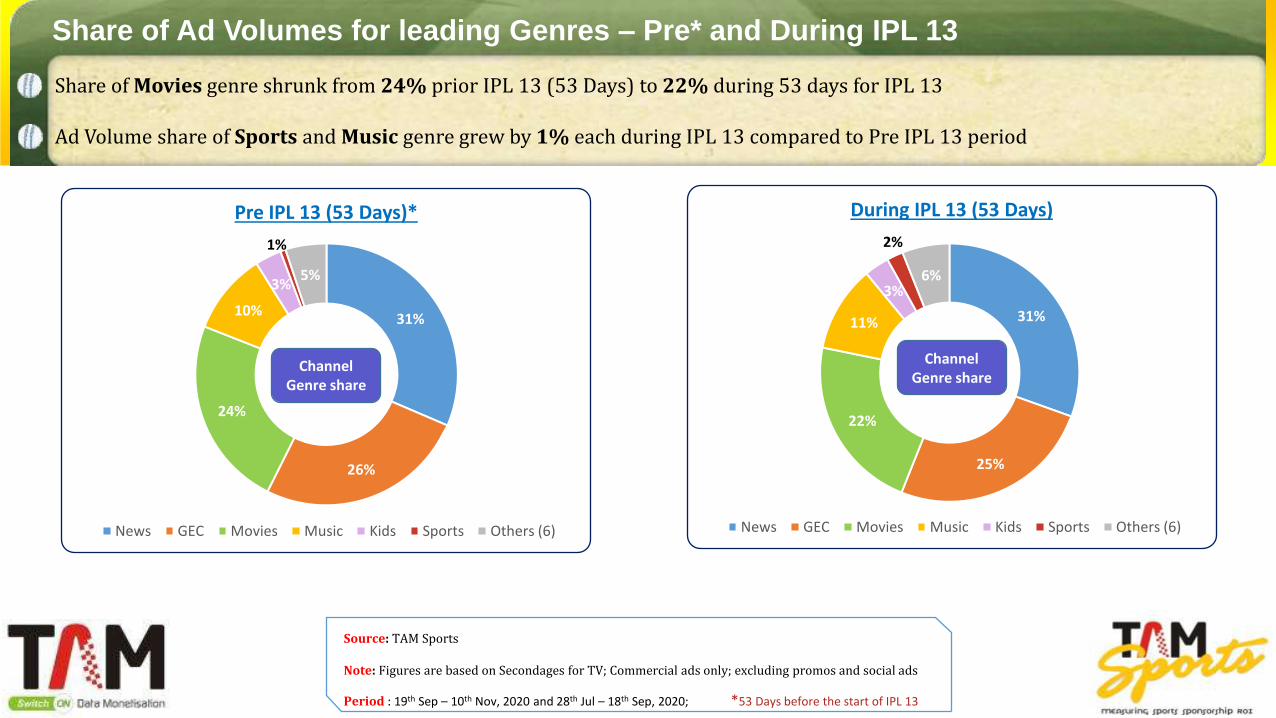
Share of Ad Volumes for leading Genres – Pre* and During IPL 13
Share of Movies genre shrunk from 24% prior IPL 13 (53 Days) to 22% during 53 days for IPL 13 Ad Volume share of Sports and Music genre grew by 1% each during IPL 13 compared to Pre IPL 13 period
Source: TAM Sports Note: Figures are based on Secondages for TV; Commercial ads only; excluding promos and social ads
Period : 19th Sep – 10th Nov, 2020 and 28th Jul – 18th Sep, 2020; *53 Days before the start of IPL 13
31%
26%
24%
10%
3%
1%
5%
Pre IPL 13 (53 Days)*
News GEC Movies Music Kids Sports Others (6)
31%
25%
22%
11%
3%
2%
6%
During IPL 13 (53 Days)
News GEC Movies Music Kids Sports Others (6)
Channel Genre share
Channel Genre share
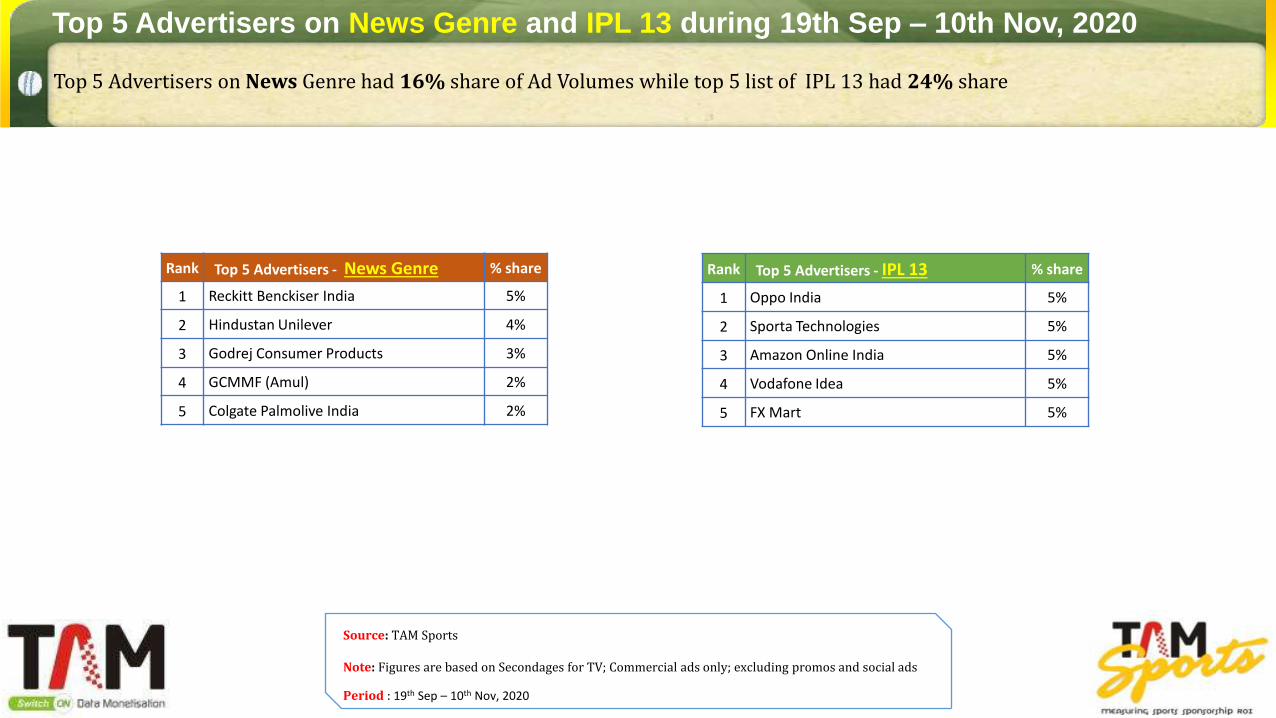
Top 5 Advertisers on News Genre and IPL 13 during 19th Sep – 10th Nov, 2020
Top 5 Advertisers on News Genre had 16% share of Ad Volumes while top 5 list of IPL 13 had 24% share
Source: TAM Sports Note: Figures are based on Secondages for TV; Commercial ads only; excluding promos and social ads
Period : 19th Sep – 10th Nov, 2020
Rank Top 5 Advertisers - IPL 13 % share
1 Oppo India 5%
2 Sporta Technologies 5%
3 Amazon Online India 5%
4 Vodafone Idea 5%
5 FX Mart 5%
Rank Top 5 Advertisers - News Genre % share
1 Reckitt Benckiser India 5%
2 Hindustan Unilever 4%
3 Godrej Consumer Products 3%
4 GCMMF (Amul) 2%
5 Colgate Palmolive India 2%
For any queries write to: Website Link: www.tamindia.com Vinita Shah [email protected]
TAM Sports, a division of TAM Media Research which integrates technology and domain knowledge to Measure and Manage brand activation performance and effectiveness in sports.