A MCDM Approach for Evaluating Bowlers Performance in IPL
11
VOL. 2, NO. 11, November 2011 ISSN 2079-8407 Journal of Emerging Trends in Computing and Information Sciences ©2009-2011 CIS Journal. All rights reserved. http://www.cisjournal.org 563 A MCDM Approach for Evaluating Bowlers Performance in IPL Pabitra Kumar Dey 1 , Dipendra Nath Ghosh 2 , Abhoy Chand Mondal 3 1 Department of Computer Application Dr. B.C Roy Engineering College, Fuljhore, Durgapur-713206, West Bengal, India. 2 Department of Computer Science and Engineering Dr. B.C Roy Engineering College, Fuljhore, Durgapur-713206, West Bengal, India 3 Department of Computer Science The University of Burdwan, Burdwan-713104, West Bengal, India {[email protected], [email protected], [email protected]} ABSTRACT Cricket is one of the most popular sports among every class of people. The contribution of individual team members to the overall team performance is more easily quantifiable in cricket and the performance evaluation of a player is a very critical issue. Indian Premier League T20 cricket tournament dataset has been considered to measure the performance evaluation of bowlers (Fast Bowler and Spinner). The study measures the performance of Fast-bowlers and Spinners of IPL (I, II and III) based on their economy rate, bowling average, bowling strike rate and other different criterion and evaluate their rankings according to their performances with the help of AHP and TOPSIS. Finally, evaluate performance of all players who played in all three IPL (I, II and III) by using AHP-TOPSIS and AHP-COPRAS and provide their rankings. Keywords: IPL, Performance Measurement, MCDM, AHP, TOPSIS, COPRAS, Ranking. 1. INTRODUCTION Relative to other team games cricket is one of the most popular games in the world. The use of analytical methods is very useful in cricket. Cricket is bat and ball game played between two teams having eleven players each. The game of cricket got a new dimension when the Indian Premier League (IPL), a competition of twenty over-a- side featuring eight teams named after various Indian cities/states started in 2008. The teams were franchisee driven and the players were selected through competitive bidding from a pool of available players. Due to its tremendous popularity media gives more preferences to this game in India. It is a sport in which statistics feature heavily [1] and these statistics give clear picture of each and every facet and players of cricket. The Board of Control of Cricket in India (BCCI) organizes the IPL Twenty-Twenty cricket tournament in each year. Elderton [5] used the first statistical analysis of cricket data to demonstrate some of the fundamental aspects of Statistics. The performance of consistency in cricket and applied the geometrical distribution to model cricket scores based on results from test cricket by Wood [6]. Optimal batting strategies using dynamic programming model developed by Clarke [2]. Alternative batting averages when batsman remains not-out in one-day cricket are proposed by Kimber and Hansford & Damodaran [3, 4]. Norman and Clark & Ovens and Bukeit applied mathematical modeling approach to optimize the batting order of a team [7, 8]. Another area where several analytic works has been done is the rescheduling of the target for a rain truncated match, for the team batting second by Duckworth-Lewis [11] ,Jayadevan [10], Gurram and Narayanan [9] etc. Lemmer [14] discussed the performance of cricketers in the first T−20 world cup, Vig [15] studied the implications of having two cricket leagues in India viz. Indian Cricket League (ICL) and Indian Premier League (IPL), Ramani [16] reported IPL as a “…distorted form of commodity and consumer excess”. Staden [17] developed a performance measure for cricketers in Twenty-20 cricket considering data from IPL-I. Several other research activities relate to players performance in IPL and their valuation in auction, some of such works are Parker, Burns and Natarajan [18] Rastogi and Deodhar [12] and Depken and Rajasekhar [13]. Hemant Saikia and et.al.[32] used Bayesian classification model to measure the performance of all rounders in IPL. IPL T-20 cricket tournament dataset of session I, II and III has been considered to evaluate the bowlers’ (fast- bowlers and spinners) performances separately for three sessions. We here select such players who played at least 3 matches, bowled for at least 8 overs and got minimum of 1 wicket in a particular IPL session. Different criterion such as Bowling Economy Rate (Econ), Average (Avg), Strike Rate (SR), total Wickets (Wkts), Over bowled (Overs) and no. of Matches played (Mts) have been considered for evaluating the bowlers’ performances with the help of AHP-TOPSIS and to know their rank. Finally, the overall performances and rankings are produced for the bowlers who played all three versions of IPL with the help of AHP-TOPSIS and AHP-COPRAS separately in this study.
-
Upload
independent -
Category
Documents
-
view
2 -
download
0
Transcript of A MCDM Approach for Evaluating Bowlers Performance in IPL

VOL. 2, NO. 11, November 2011 ISSN 2079-8407
Journal of Emerging Trends in Computing and Information Sciences ©2009-2011 CIS Journal. All rights reserved.
http://www.cisjournal.org
563
A MCDM Approach for Evaluating Bowlers Performance in IPL
Pabitra Kumar Dey 1, Dipendra Nath Ghosh 2 , Abhoy Chand Mondal 3 1Department of Computer Application
Dr. B.C Roy Engineering College, Fuljhore, Durgapur-713206, West Bengal, India. 2Department of Computer Science and Engineering
Dr. B.C Roy Engineering College, Fuljhore, Durgapur-713206, West Bengal, India 3Department of Computer Science
The University of Burdwan, Burdwan-713104, West Bengal, India
{[email protected], [email protected], [email protected]}
ABSTRACT
Cricket is one of the most popular sports among every class of people. The contribution of individual team members to the overall team performance is more easily quantifiable in cricket and the performance evaluation of a player is a very critical issue. Indian Premier League T20 cricket tournament dataset has been considered to measure the performance evaluation of bowlers (Fast Bowler and Spinner). The study measures the performance of Fast-bowlers and Spinners of IPL (I, II and III) based on their economy rate, bowling average, bowling strike rate and other different criterion and evaluate their rankings according to their performances with the help of AHP and TOPSIS. Finally, evaluate performance of all players who played in all three IPL (I, II and III) by using AHP-TOPSIS and AHP-COPRAS and provide their rankings.
Keywords: IPL, Performance Measurement, MCDM, AHP, TOPSIS, COPRAS, Ranking.
1. INTRODUCTION
Relative to other team games cricket is one of the most popular games in the world. The use of analytical methods is very useful in cricket. Cricket is bat and ball game played between two teams having eleven players each. The game of cricket got a new dimension when the Indian Premier League (IPL), a competition of twenty over-a-side featuring eight teams named after various Indian cities/states started in 2008. The teams were franchisee driven and the players were selected through competitive bidding from a pool of available players. Due to its tremendous popularity media gives more preferences to this game in India. It is a sport in which statistics feature heavily [1] and these statistics give clear picture of each and every facet and players of cricket. The Board of Control of Cricket in India (BCCI) organizes the IPL Twenty-Twenty cricket tournament in each year.
Elderton [5] used the first statistical analysis of cricket data to demonstrate some of the fundamental aspects of Statistics. The performance of consistency in cricket and applied the geometrical distribution to model cricket scores based on results from test cricket by Wood [6]. Optimal batting strategies using dynamic programming model developed by Clarke [2]. Alternative batting averages when batsman remains not-out in one-day cricket are proposed by Kimber and Hansford & Damodaran [3, 4]. Norman and Clark & Ovens and Bukeit applied mathematical modeling approach to optimize the batting order of a team [7, 8]. Another area where several analytic works has been done is the rescheduling of the target for a rain truncated match, for
the team batting second by Duckworth-Lewis [11] ,Jayadevan [10], Gurram and Narayanan [9] etc. Lemmer [14] discussed the performance of cricketers in the first T−20 world cup, Vig [15] studied the implications of having two cricket leagues in India viz. Indian Cricket League (ICL) and Indian Premier League (IPL), Ramani [16] reported IPL as a “…distorted form of commodity and consumer excess”. Staden [17] developed a performance measure for cricketers in Twenty-20 cricket considering data from IPL-I. Several other research activities relate to players performance in IPL and their valuation in auction, some of such works are Parker, Burns and Natarajan [18] Rastogi and Deodhar [12] and Depken and Rajasekhar [13]. Hemant Saikia and et.al.[32] used Bayesian classification model to measure the performance of all rounders in IPL.
IPL T-20 cricket tournament dataset of session I, II and III has been considered to evaluate the bowlers’ (fast-bowlers and spinners) performances separately for three sessions. We here select such players who played at least 3 matches, bowled for at least 8 overs and got minimum of 1 wicket in a particular IPL session. Different criterion such as Bowling Economy Rate (Econ), Average (Avg), Strike Rate (SR), total Wickets (Wkts), Over bowled (Overs) and no. of Matches played (Mts) have been considered for evaluating the bowlers’ performances with the help of AHP-TOPSIS and to know their rank. Finally, the overall performances and rankings are produced for the bowlers who played all three versions of IPL with the help of AHP-TOPSIS and AHP-COPRAS separately in this study.

VOL. 2, NO. 11, November 2011 ISSN 2079-8407
Journal of Emerging Trends in Computing and Information Sciences ©2009-2011 CIS Journal. All rights reserved.
http://www.cisjournal.org
564
The paper is organized as follows: Indian Premier League and Bowlers’ criterions for performance evaluation have been discussed in Section 2. Section 3 focuses on the basic concepts of MCDA and different techniques with IPL bowling analysis. Finally, section 4 concludes the paper.
2. INDIAN PREMIER LEAGUE AND BOWLERS’ CRITERIONS
In cricket basically two types of bowlers are there. One is Fast bowler who bowled at high speed and to induce it to bounce off the pitch in an erratic fashion or move sideways through the air factors which make it difficult for the batsman to hit the ball cleanly and another is spin bowler who bowled with rapid rotation so that when it bounces on the pitch it will deviate and thus making it difficult for the batsman to hit the ball easily. The IPL is a game under the so-called Twenty20 (or T20) format of cricket. In April 2008, BCCI initiated the Indian Premier League, a Twenty-20 cricket tournament to be played among eight domestic teams, named after eight Indian states or cities but owned by franchise. The franchise formed their teams by competitive bidding from a collection of Indian and international players and the best of Indian up-and-coming talents. Team owners bid for the services of cricketers for a total of US $42 million. Each team can purchase a maximum of eight overseas players; though, only four can be considered in first eleven. The franchisees bid for the salaries that they are ready to offer to the players. Each player has a base price fixed by the IPL authorities and there is no upper limit. However, the salary offer is valid for three years only. As three seasons of IPL are already completed and from the next version of IPL two other teams join the league so the salary offer to the available cricketers are supposed to undergo substantial change. Such change should be related to the performance of cricketers in the yester seasons of IPL in domestic and international tournaments.
Previously evaluation of bowling performance has been done by taking two or three major attributes such as bowling average, economy rate and strike rate by some statistical method. In this study for performance measure of bowlers six different attributes are taken to be considered such as bowling economy rate, bowler’s average, bowler’s strike rate, no. of wickets has been taken, total no. of over bowled and total no. of matched played during one particular session of IPL.
The definitions of different attributes are as follows: Economy Rate (Econ) = (Number of Runs/ Number of
Over) (1) Average (Avg) = (Number of Runs/ Number of
Wickets) (2) Strike Rate (SR) = (Number of Balls/ Number of
Wickets) (3) These three attributes are negative attributes since
lower value of these attributes gives more preference to bowler performance. Other attributes are no. of Wickets (Wkts) taken, no. of Over (Overs) bowled during one IPL
session and no. of Matches (Mts) played by a bowler in a series. These three attributes of bowlers are positive attribute since higher value of these gives more preference to bowler performance.
In twenty-twenty cricket the economy rate of bowler is the most powerful criteria followed by bowlers’ average and bowlers’ strike rate. No. of wickets is also a very important criteria for measuring the performance of bowler. Total no. of overs and no. of matches played is also important for judging the bowlers performance. If a bowler played only one match and bowled one or two overs and also got one or more wickets then he was best in his performance for that particular match but he may not be performed good enough for the whole series. So, players who satisfied all the following three conditions were selected in the training dataset:
1) The bowler who played at least 3 matches in an IPL session. 2) The bowler who bowled at least 5 overs in an IPL session. 3) The bowler who took at least 1 wicket during an IPL session.
3. MULTIPLE CRITERIA DECISION ANALYSIS (MCDA)
MCDA provides an approach that is able to handle a large amount of variables and alternatives assessed in various ways and consequently offer valuable assistance to the decision maker in mapping out the problem. A typical MCDA problem consists of a decision matrix with i number of alternatives and j number of criterions. Additionally, a set of weighting factors pj are introduced to represent the relative significance of criteria in a particular application. The final goal of MCDA is to classify and/or rank the alternatives. The steps of MCDA are as follows:
1) Establish the decision objectives (goals) and identify the decision maker(s).
2) Identify the alternatives. 3) Identify the criteria (attributes) that are relevant to
the decision problem. 4) For each of the criteria assign scores to measure the
performance of the alternatives against each of these and construct an evaluation (decision) matrix.
5) Standardize the raw scores of decision matrix. 6) Determine a weight for each criterion to reflect how
important it is to the overall decision. 7) Compute an overall assessment measure for each
decision alternative. 8) Perform a sensitivity analysis to assess the
robustness of the preference ranking.
3.1 Calculation of weights between criterions by AHP:
The pair-wise comparison method and the hierarchical model were developed in 1980 by T.L.Saaty in the context of the Analytical Hierarchy Process (AHP) [19, 20]. AHP is an approach for decision making that involves
VOL. 2, NO. 11, November 2011 ISSN 2079-8407
Journal of Emerging Trends in Computing and Information Sciences ©2009-2011 CIS Journal. All rights reserved.
http://www.cisjournal.org
565
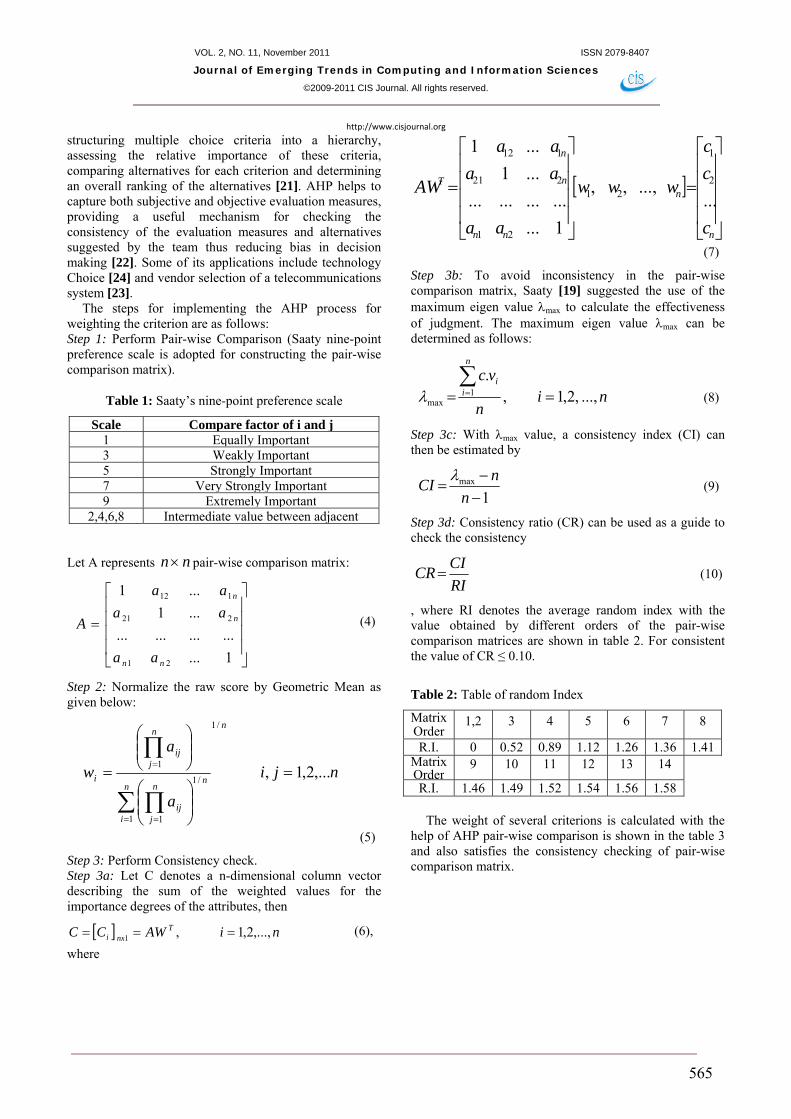
structuring multiple choice criteria into a hierarchy, assessing the relative importance of these criteria, comparing alternatives for each criterion and determining an overall ranking of the alternatives [21]. AHP helps to capture both subjective and objective evaluation measures, providing a useful mechanism for checking the consistency of the evaluation measures and alternatives suggested by the team thus reducing bias in decision making [22]. Some of its applications include technology Choice [24] and vendor selection of a telecommunications system [23].
The steps for implementing the AHP process for weighting the criterion are as follows: Step 1: Perform Pair-wise Comparison (Saaty nine-point preference scale is adopted for constructing the pair-wise comparison matrix).
Table 1: Saaty’s nine-point preference scale
Scale Compare factor of i and j1 Equally Important 3 Weakly Important 5 Strongly Important 7 Very Strongly Important 9 Extremely Important
2,4,6,8 Intermediate value between adjacent Let A represents nn pair-wise comparison matrix:
1...
............
...1
...1
21
221
112
nn
n
n
aa
aa
aa
A (4)
Step 2: Normalize the raw score by Geometric Mean as given below:
nji
a
a
w
n
n
i
nn
jij
n
jij
i ,...2,1,
/1
1
/1
1
1
(5)
Step 3: Perform Consistency check. Step 3a: Let C denotes a n-dimensional column vector describing the sum of the weighted values for the importance degrees of the attributes, then
niAWCC Tnxi ,...,2,1,1 (6),
where
n
n
nn
n
n
T
c
c
c
www
aa
aa
aa
AW...
...,,,
1...
............
...1
...1
2
1
21
21
221
112
(7)
Step 3b: To avoid inconsistency in the pair-wise comparison matrix, Saaty [19] suggested the use of the maximum eigen value max to calculate the effectiveness of judgment. The maximum eigen value max can be determined as follows:
nin
vcn
ii
...,,2,1,.
1max
(8)
Step 3c: With max value, a consistency index (CI) can then be estimated by
1max
n
nCI
(9)
Step 3d: Consistency ratio (CR) can be used as a guide to check the consistency
RI
CICR (10)
, where RI denotes the average random index with the value obtained by different orders of the pair-wise comparison matrices are shown in table 2. For consistent the value of CR ≤ 0.10.
Table 2: Table of random Index
Matrix Order
1,2 3 4 5 6 7 8
R.I. 0 0.52 0.89 1.12 1.26 1.36 1.41 MatrixOrder
9 10 11 12 13 14
R.I. 1.46 1.49 1.52 1.54 1.56 1.58
The weight of several criterions is calculated with the help of AHP pair-wise comparison is shown in the table 3 and also satisfies the consistency checking of pair-wise comparison matrix.

VOL. 2, NO. 11, November 2011 ISSN 2079-8407
Journal of Emerging Trends in Computing and Information Sciences ©2009-2011 CIS Journal. All rights reserved.
http://www.cisjournal.org
566
Table3: Pair-wise comparison table between criterions
1.00094.0..,0118.0..,0591.6max RCICFrom AHP the weights of different criterions are as follows:
Weight of MTS = WMTS = 0.0522, Weight of OVERS = WOVERS = 0.0651, Weight of AVG = WAVG = 0.2575, Weight of WKTS = WWKTS = 0.1490, Weight of SR = WSR = 0.2107, Weight of ECON = WECON = 0.2655.
3.2. Performance evaluation of Fast-Bowlers & Spinners by TOPSIS:
TOPSIS (Technique for Order Preference by Similarity to Ideal Solution), known as one of the most classical MCDM methods, was first developed by Hwang and Yoon [26], is based on the idea that the chosen alternative should have the shortest distance from the positive ideal solution and on the other side the farthest distance of the negative ideal solution. In the process of TOPSIS, the performance ratings and the weights of the criteria are given as exact values. Abo-sinna and Amer [25] extend TOPSIS approach to solve multi-objective nonlinear programming problems. Jahanshahloo et al. [27] extend the concept of TOPSIS to develop a methodology for solving multi-criteria decision-making problems with interval data.
The steps of TOPSIS method are as follows:
Step 1: TOPSIS begins with a decision matrix having n criteria/attributes and m alternatives. The decision matrix is represented as
mnmm
n
n
xxx
xxx
xxx
D
...
............
...
...
21
22221
11211
(11)
Step 2: Obtain the normalized decision matrix by
nj
x
xr
m
iij
ijij ...,,2,1,
1
2
(12)
Step 3: Construct the weighted normalized matrix vij. This is calculated by multiplying each column of the matrix rij by the weight wj, which is calculated by AHP.
So, ijjij rwv . (13)
Step 4: Obtain the ‘ideal’ (best) and ‘negative-ideal’ (worst) solutions. The ‘ideal’ (best) and ‘negative-ideal’ (worst) solutions can be expressed as
)14(...
...,,2,1||,|
21
min'
max
n
iij
iijj
vvv
miJjvJjvv
)15(...
...,,2,1||,|
21
max'
min
n
iij
iijj
vvv
miJjvJjvv
,where J= ( j =1, 2, ..., n)/j is associated with the beneficial attributes and J’ =( j =1, 2, ..., n)/j is associated with the non-beneficial attributes.
Step 5: Determine the separation distance between the alternatives. The separation of each alternative from the ‘ideal’ solution is given by
)16(...,,2,1,1
2mivvS
n
jjiji
The separation from the ‘negative-ideal’ solution is denoted by
)17(...,,2,1,1
2mivvS
n
jjiji
Step 6: Calculate the relative closeness to the ideal solution, which can be expressed as
miSS
SC
ii
ii ...,,2,1,
(18)
Step 7: Rank the alternatives according to Ci values in descending order.
MTS OVERS WKTS AVG SR ECON
MTS 1.0000 1.0000 0.3333 0.2000 0.2500 0.1667
OVERS 1.0000 1.0000 0.5000 0.2500 0.3333 0.2500
WKTS 3.0000 2.0000 1.0000 0.5000 1.0000 0.5000
AVG 5.0000 4.0000 2.0000 1.0000 1.0000 1.0000
SR 4.0000 3.0000 1.0000 1.0000 1.0000 1.0000
ECON 6.0000 4.0000 2.0000 1.0000 1.0000 1.0000
G.M. W Vector Lamda
MTS 0.3749 0.0522 0.3154 6.0405
OVERS 0.4673 0.0651 0.3928 6.0354
WKTS 1.0699 0.1490 0.9080 6.0942
AVG 1.8493 0.2575 1.5531 6.0307
SR 1.5131 0.2107 1.2868 6.1070
ECON 1.9064 0.2655 1.6053 6.0468
Sum-> 7.1809 1.0000 6.0613 36.3545

VOL. 2, NO. 11, November 2011 ISSN 2079-8407
Journal of Emerging Trends in Computing and Information Sciences ©2009-2011 CIS Journal. All rights reserved.
http://www.cisjournal.org
567
Table 4: Ranking of Fast-bowlers according their performance in IPL-III (2010)
Name Mts Overs Runs Wkts Avg SR Econ Result Rank KA Pollard 14 37 274 15 18.3 14.8 7.41 0.9427 1 SL Malinga 13 49 344 15 22.9 19.6 7.02 0.9313 2 RJ Harris 8 30.4 233 14 16.6 13.1 7.6 0.9207 3 Zaheer Khan 14 48.2 376 15 25.1 19.3 7.78 0.9174 4 R Vinay Kumar 14 46.1 396 16 24.8 17.3 8.58 0.9121 5 DE Bollinger 8 31 207 12 17.3 15.5 6.68 0.9106 6 DW Steyn 15 59 406 15 27.1 23.6 6.88 0.9034 7 SK Trivedi 11 35.3 260 11 23.6 19.4 7.32 0.8883 8 IK Pathan 14 46.2 426 15 28.4 18.5 9.19 0.8858 9 RP Singh 12 42 370 13 28.5 19.4 8.81 0.8789 10 AB Dinda 7 23.1 152 9 16.9 15.4 6.56 0.8739 11 WPUJC Vaas 6 22 139 9 15.4 14.7 6.32 0.8734 12 A Symonds 16 53 372 12 31 26.5 7.02 0.8614 13 SW Tait 8 31.1 264 10 26.4 18.7 8.47 0.8590 14 SE Bond 8 31 224 9 24.9 20.7 7.23 0.8581 15 Harmeet Singh 8 24 174 8 21.8 18 7.25 0.8547 16 P Sangwan 8 31 258 9 28.7 20.7 8.32 0.8421 17 JH Kallis 16 57 476 13 36.6 26.3 8.35 0.8383 18 MF Maharoof 7 24 206 8 25.8 18 8.58 0.8379 19 A Nehra 4 14 96 6 16 14 6.86 0.8356 20 JA Morkel 14 47.4 405 11 36.8 26 8.5 0.8250 21 T Thushara 4 14.3 101 5 20.2 17.4 6.97 0.8187 22 CK Langeveldt 3 11 88 5 17.6 13.2 8 0.8184 23 L Balaji 7 23.2 207 7 29.6 20 8.87 0.8146 24 Jaskaran Singh 6 14 139 6 23.2 14 9.93 0.8105 25 P Kumar 12 45 380 10 38 27 8.44 0.8103 26 UT Yadav 7 24 184 6 30.7 24 7.67 0.8026 27 JD Unadkat 3 10.2 85 4 21.3 15.5 8.23 0.8020 28 DP Nannes 9 34.1 224 7 32 29.3 6.56 0.8020 29 SR Watson 6 22 184 6 30.7 22 8.36 0.8015 30 JM Kemp 5 7.2 54 3 18 14.7 7.36 0.8011 31 RS Bopara 10 13 127 5 25.4 15.6 9.77 0.8009 32 J Theron 7 24 187 6 31.2 24 7.79 0.8008 33 I Sharma 7 25 236 7 33.7 21.4 9.44 0.7973 34 AB McDonald 4 14 138 5 27.6 16.8 9.86 0.7908 35 AD Mathews 14 37.3 314 8 39.3 28.1 8.37 0.7875 36 B Sharma 5 10 94 3 31.3 20 9.4 0.7648 37 SJ Srivastava 8 27 255 6 42.5 27 9.44 0.7519 38 LR Shukla 4 12 106 3 35.3 24 8.83 0.7518 39 MM Patel 4 13 118 3 39.3 26 9.08 0.7361 40 R Sathish 12 8 81 2 40.5 24 10.1 0.7252 41 R Bhatia 5 16 132 3 44 32 8.25 0.7131 42 MR Marsh 3 10 88 2 44 30 8.8 0.7055 43 J Sharma 3 8 89 2 44.5 24 11.1 0.7027 44 AB Agarkar 7 22 203 4 50.8 33 9.23 0.6932 45 DJ Bravo 10 26.1 228 4 57 39.3 8.71 0.6563 46 S Sreesanth 6 19 191 3 63.7 38 10.1 0.6201 47 Iqbal Abdulla 3 8.3 61 1 61 51 7.18 0.5851 48 R McLaren 10 34 270 4 67.5 51 7.94 0.5799 49 MS Gony 3 8 92 1 92 48 11.5 0.4606 50 S Tyagi 6 15.5 159 1 159 95 10 0.0449 51
Table 5: Ranking of Spinners according their performance in IPL-III (2010)
Name Mts Overs Runs Wkts Avg SR Econ Result RankPP Ojha 16 58.5 429 21 20.43 16.81 7.29 0.8080 1 A Mishra 14 53 363 17 21.35 18.71 6.85 0.7844 2 Harbhajan Singh 15 53.3 377 17 22.18 18.88 7.05 0.7745 3 A Kumble 16 63.2 407 17 23.94 22.35 6.43 0.7618 4 M Muralitharan 12 48 329 15 21.93 19.2 6.85 0.7588 5 R Ashwin 12 48 293 13 22.54 22.15 6.1 0.7350 6 SB Jakati 11 38 291 13 22.38 17.54 7.66 0.7216 7 V Sehwag 14 5.4 23 3 7.67 11.33 4.06 0.6956 8 CRD Fernando 5 19 138 7 19.71 16.29 7.26 0.6686 9 PD Collingwood 8 14.5 101 5 20.2 17.8 6.81 0.6472 10 PP Chawla 14 49 367 12 30.58 24.5 7.49 0.6434 11 M Kartik 10 39 253 9 28.11 26 6.49 0.6332 12 BJ Hodge 4 5 41 2 20.5 15 8.2 0.6033 13 AP Dole 3 11 112 5 22.4 13.2 10.18 0.6007 14

VOL. 2, NO. 11, November 2011 ISSN 2079-8407
Journal of Emerging Trends in Computing and Information Sciences ©2009-2011 CIS Journal. All rights reserved.
http://www.cisjournal.org
568
TM Dilshan 6 8.1 70 3 23.33 16.33 8.57 0.5943 15 SK Warne 14 50 381 11 34.64 27.27 7.62 0.5932 16 SK Raina 16 23.5 178 6 29.67 23.83 7.47 0.5879 17 KP Pietersen 7 10 77 3 25.67 20 7.7 0.5844 18 Yuvraj Singh 14 23 152 5 30.4 27.6 6.61 0.5697 19 AG Murtaza 3 12 91 3 30.33 24 7.58 0.5470 20 R Sharma 6 20.4 167 5 33.4 24.8 8.08 0.5403 21 ST Jayasuriya 4 9 68 2 34 27 7.56 0.5076 22 S Ladda 5 15 143 4 35.75 22.5 9.53 0.5074 23 S Narwal 5 15.4 185 5 37 18.8 11.81 0.4944 24 CH Gayle 9 16 152 4 38 24 9.5 0.4904 25 YK Pathan 14 34 246 5 49.2 40.8 7.24 0.3857 26 DL Vettori 3 11.4 97 2 48.5 35 8.31 0.3733 27 RR Powar 7 23 160 3 53.33 46 6.96 0.3235 28 RG Sharma 16 19 153 2 76.5 57 8.05 0.1654 29
In 2010 (IPL - III), it is clear that top three fast-bowlers are foreigners whereas India’s best fast bowler Zaheer Khan is in rank 4 followed by India’s another bowler R.Vinay Kumar. In the case of spinners top 4 bowlers are Indian and PP.Ojha is in 1st rank followed by A.Mishra followed by Harbhajan Singh and followed by A.Kumble.
In 5th position one of the best spinners M.Murlitharan is placed. From this analysis it is very much clear that Indian spinners do better than Indian Fast Bowlers. The performance and rank of fast bowlers and spinners of IPL-III are shown in the table 4 and 5 respectively.
Table 6: Ranking of Fast-Bowlers according their performance in IPL-II (2009)
Player Mts Overs Runs Wkts Avg SR Econ Result Rank
Singh, RP 16 59.4 417 23 18.13 15.57 6.99 0.9399 1
Nehra, A 13 51 346 19 18.21 16.11 6.78 0.9124 2
Malinga, SL 13 49.3 312 18 17.33 16.5 6.3 0.9066 3 Patel, MM 11 34.5 241 16 15.06 13.06 6.92 0.8741 4
Pathan, IK 14 50.2 389 17 22.88 17.76 7.73 0.8619 5
Sangwan, P 13 46.4 360 15 24 18.67 7.71 0.8354 6
Nannes, DP 13 49.3 372 15 24.8 19.8 7.52 0.8334 7
Abdulla, YA 9 28 241 14 17.21 12 8.61 0.8250 8
Balaji, L 13 37.2 316 13 24.31 17.23 8.46 0.8045 9
Morkel, JA 12 40 328 13 25.23 18.46 8.2 0.8036 10
Bhatia, R 8 21.4 146 10 14.6 13 6.74 0.8002 11
Bravo, DJ 11 33.1 259 11 23.55 18.09 7.81 0.7893 12 Kumar, P 13 49.4 394 13 30.31 22.92 7.93 0.7828 13
Sharma, I 11 43 297 11 27 23.45 6.91 0.7780 14
Symonds, A 8 24 160 7 22.86 20.57 6.67 0.7472 15
Vinay Kumar, R 11 32.2 271 9 30.11 21.56 8.38 0.7394 16
Mascarenhas, AD 5 19.2 132 6 22 19.33 6.83 0.7370 17
Zaheer Khan 6 21 142 6 23.67 21 6.76 0.7321 18
Maharoof, MF 3 10 65 4 16.25 15 6.5 0.7304 19
Trivedi, SK 7 20 152 6 25.33 20 7.6 0.7264 20
Akhil, B 6 11 80 4 20 16.5 7.27 0.7222 21
Lee, B 5 20 111 5 22.2 24 5.55 0.7218 22
Oram, JDP 11 15.3 133 5 26.6 18.6 8.58 0.7106 23
Tyagi, S 8 19 136 5 27.2 22.8 7.16 0.7096 24
Sreesanth, S 7 23 192 6 32 23 8.35 0.6986 25
Harwood, SM 3 10 73 3 24.33 20 7.3 0.6971 26
Edwards, FH 6 23.2 154 5 30.8 28 6.6 0.6899 27
Gony, MS 7 17 172 5 34.4 20.4 10.12 0.6730 28
Nanda, C 3 8 57 2 28.5 24 7.13 0.6715 29
Salvi, AM 5 17 134 4 33.5 25.5 7.88 0.6713 30
Harris, RJ 8 31 230 6 38.33 31 7.42 0.6649 31
Shukla, LR 9 14 100 3 33.33 28 7.14 0.6621 32
Steyn, DW 3 9 62 2 31 27 6.89 0.6595 33
Kulkarni, DS 8 26 206 5 41.2 31.2 7.92 0.6419 34
Ryder, JD 5 17 115 3 38.33 34 6.76 0.6300 35
Agarkar, AB 11 31 284 6 47.33 31 9.16 0.6207 36
Appanna, KP 5 12 87 2 43.5 36 7.25 0.5954 37
Dinda, AB 9 24 193 4 48.25 36 8.04 0.5915 38

VOL. 2, NO. 11, November 2011 ISSN 2079-8407
Journal of Emerging Trends in Computing and Information Sciences ©2009-2011 CIS Journal. All rights reserved.
http://www.cisjournal.org
569
Ganguly, SC 13 12 97 2 48.5 36 8.08 0.5757 39
Flintoff, A 3 11 105 2 52.5 33 9.55 0.5576 40
Henriques, MC 4 12.1 107 2 53.5 36.5 8.79 0.5473 41
Kallis, JH 15 46 353 6 58.83 46 7.67 0.5311 42
Singh, VR 5 9 82 1 82 54 9.11 0.3487 43
Smith, DR 8 14 124 1 124 84 8.86 0.0515 44
Table 7: Ranking of Spinners according their performance in IPL-II (2009)
Player Mts Overs Runs Wkts Avg SR Econ Result Rank Kumble, A 16 59.1 347 21 16.52 16.9 5.86 0.9510 1 Ojha, PP 15 53.3 348 18 19.33 17.83 6.5 0.9169 2 Muralidaran, M 13 50 261 14 18.64 21.43 5.22 0.8833 3 Mishra, A 11 42 294 14 21 18 7 0.8704 4 Jakati, SB 9 29 217 13 16.69 13.38 7.48 0.8642 5 Sharma, RG 16 23 161 11 14.64 12.55 7 0.8540 6 Harbhajan Singh 13 44 256 12 21.33 22 5.82 0.8539 7 Warne, SK 13 50 365 14 26.07 21.43 7.3 0.8480 8 Amit Singh 5 17.3 95 9 10.56 11.67 5.43 0.8403 9 Chawla, PP 14 44.5 308 12 25.67 22.42 6.87 0.8350 10 van der Merwe, RE 10 34 248 9 27.56 22.67 7.29 0.7977 11 Raina, SK 14 27.4 164 7 23.43 23.71 5.93 0.7952 12 Hodge, BJ 12 20 161 7 23 17.14 8.05 0.7905 13
Kamran Khan 5 17.4 124 6 20.67 17.67 7.02 0.7902 14 Jayasuriya, ST 12 19 163 7 23.29 16.29 8.58 0.7857 15 Yuvraj Singh 14 20 142 6 23.67 20 7.1 0.7844 16 Vettori, DL 7 23.1 181 7 25.86 19.86 7.81 0.7822 17 Suman, TL 12 15 108 5 21.6 18 7.2 0.7801 18 Jadeja, RA 13 23.2 151 6 25.17 23.33 6.47 0.7799 19 Nayar, AM 13 12 84 4 21 18 7 0.7731 20 Pietersen, KP 6 13 85 4 21.25 19.5 6.54 0.7713 21 Mota, WA 8 9 61 3 20.33 18 6.78 0.7649 22 Powar, RR 9 21 132 5 26.4 25.2 6.29 0.7645 23 Duminy, J-P 13 17.3 93 4 23.25 26.25 5.31 0.7632 24 Botha, J 3 12 74 3 24.67 24 6.17 0.7497 25 Pathan, YK 13 35 243 7 34.71 30 6.94 0.7485 26 Shoaib Ahmed 8 17 152 5 30.4 20.4 8.94 0.7446 27 Venugopal Rao, Y 16 15 122 4 30.5 22.5 8.13 0.7409 28 Mendis, BAW 4 16 117 3 39 32 7.31 0.6943 29 Kartik, M 10 34 201 4 50.25 51 5.91 0.6217 30 Bansal, HS 7 22.5 192 3 64 45.67 8.41 0.5685 31 Gayle, CH 7 18.5 144 1 144 113 7.65 0.0445 32
In 2009 (IPL - II), two Indian players are in top positions for both (Fast-bowling & Spin) category. RP.Singh and A.Nehra of India took place 1st and 2nd position whereas Sl.Malinga was placed in the 3rd position in fast bowling category. A.Kumble and PP.Ojha are in 1st and 2nd places respectively from Indians and M.Murlitharan in 3rd position.
Although this IPL session-II played in South Africa, the Indian bowlers did better than South African bowlers in both the bowling categories. The performance and rank of fast bowlers and spinners of IPL-II are shown in the table 6 and 7 respectively.
Table 8: Ranking of Fast-Bowlers according their performance in IPL-I (2008)
Player Mts Overs Runs Wkts Avg SR Econ Result Rank Sohail Tanvir 11 41.1 266 22 12.09 11.23 6.46 0.9396 1 Maharoof, MF 10 36 249 15 16.6 14.4 6.92 0.8283 2 Sreesanth, S 15 51.1 442 19 23.26 16.16 8.64 0.8213 3 Watson, SR 15 54.1 383 17 22.53 19.12 7.07 0.8188 4 Morkel, JA 13 48 399 17 23.47 16.94 8.31 0.8028 5 Mahesh, VY 11 42.1 370 16 23.13 15.81 8.77 0.7846 6 Gony, MS 16 60 443 17 26.06 21.18 7.38 0.7810 7 Pathan, IK 14 53 350 15 23.33 21.2 6.6 0.7792 8 Umar Gul 6 22.3 184 12 15.33 11.25 8.18 0.7666 9 Kulkarni, DS 10 29.3 236 11 21.45 16.09 8 0.7323 10 Bravo, DJ 9 28.2 232 11 21.09 15.45 8.19 0.7321 11 Singh, RP 14 51.2 442 15 29.47 20.53 8.61 0.7217 12 Zaheer Khan 11 42 357 13 27.46 19.38 8.5 0.7142 13 Patel, MM 15 55 420 14 30 23.57 7.64 0.7044 14 Balaji, L 9 33 286 11 26 18 8.67 0.6962 15 Nehra, A 14 44.5 348 12 29 22.42 7.76 0.6895 16 Steyn, DW 10 38 252 10 25.2 22.8 6.63 0.6881 17 Trivedi, SK 15 48 399 13 30.69 22.15 8.31 0.6871 18 Pollock, SM 13 46 301 11 27.36 25.09 6.54 0.6820 19

VOL. 2, NO. 11, November 2011 ISSN 2079-8407
Journal of Emerging Trends in Computing and Information Sciences ©2009-2011 CIS Journal. All rights reserved.
http://www.cisjournal.org
570
Smith, DR 4 11 83 5 16.6 13.2 7.55 0.6707 20 McGrath, GD 14 54 357 12 29.75 27 6.61 0.6707 21 Ganguly, SC 13 20 128 6 21.33 20 6.4 0.6630 22 Agarkar, AB 9 26 207 8 25.88 19.5 7.96 0.6589 23 Shukla, LR 13 11.6 124 6 20.67 12 10.33 0.6510 24 Dinda, AB 13 39 260 9 28.89 26 6.67 0.6418 25 Kumar, P 13 44.4 366 11 33.27 24.36 8.19 0.6355 26 Sharma, J 8 24.4 239 8 29.88 18.5 9.69 0.6217 27 Bhatia, R 9 22 183 6 30.5 22 8.32 0.5966 28 Vaas, WPUJC 5 17 145 5 29 20.4 8.53 0.5942 29 Singh, VR 13 48 420 11 38.18 26.18 8.75 0.5874 30 Lee, B 4 16 112 4 28 24 7 0.5848 31 Amarnath, P 6 22 236 7 33.71 18.86 10.73 0.5747 32 Mohammad Asif 8 32 296 8 37 24 9.25 0.5623 33 Ntini, M 9 35 242 7 34.57 30 6.91 0.5598 34 Hopes, JR 11 28 276 7 39.43 24 9.86 0.5313 35 Vinay Kumar, R 8 23 182 5 36.4 27.6 7.91 0.5285 36 Sangwan, P 7 24 215 5 43 28.8 8.96 0.4693 37 Kalyankrishna, D 3 8 87 2 43.5 24 10.88 0.4479 38 Sharma, I 13 42.1 329 7 47 36.14 7.8 0.4393 39 Oram, JDP 4 16 149 3 49.67 32 9.31 0.3839 40 Vijaykumar, DP 9 25.2 199 4 49.75 38 7.86 0.3763 41 Zoysa, DNT 3 11 99 2 49.5 33 9 0.3744 42 Bangar, SB 11 25 219 4 54.75 37.5 8.76 0.3341 43 Styris, SB 8 27 199 3 66.33 54 7.37 0.2042 44 Akhil, B 7 17.2 134 2 67 52 7.73 0.1842 45 Kallis, JH 11 34.2 311 4 77.75 51.5 9.06 0.1358 46Salunkhe, D 6 8 78 1 78 48 9.75 0.0880 47
In 2008 (IPL – I), the best bowlers are foreigner in both the bowling categories. Two foreigners Sohail Tanvir and MF. Maharoof placed at 1st and 2nd position respectively and S.Sreesanth placed at 3rd position in fast-bowling category is shown in the table 8.
Two Indian bowlers PP.Chawla and A.Mishra followed Shane Warne in spin category is shown in the table 9. The performance of Indian bowlers was not so good in this IPL but the performance of Indian bowlers was very much accurate in IPL-II and IPL-III.
Table 9: Ranking of Spinners according their performance in IPL-I (2008)
Player Mts Overs Runs Wkts Avg SR Econ Result Rank Warne, SK 15 52 404 19 21.26 16.42 7.77 0.8883 1 Chawla, PP 15 46.5 389 17 22.88 16.53 8.31 0.8506 2 Mishra, A 6 20 138 11 12.55 10.91 6.9 0.7715 3 Fernando, CRD 5 20 160 10 16 12 8 0.7401 4 Ojha, PP 13 37 284 11 25.82 20.18 7.68 0.7247 5 Shahid Afridi 10 30 225 9 25 20 7.5 0.6890 6 Harbhajan Singh 3 10 82 5 16.4 12 8.2 0.6521 7 Pathan, YK 16 28.1 230 8 28.75 21.13 8.17 0.6484 8 Muralidaran M 15 58 404 11 36.73 31.64 6.97 0.6225 9 Raje, RR 6 16.2 137 5 27.4 19.6 8.39 0.6004 10 Yuvraj Singh 15 9 83 3 27.67 18 9.22 0.5727 11 Powar, RR 5 12 91 3 30.33 24 7.58 0.5491 12 Kumble, A 10 38.2 304 7 43.43 32.86 7.93 0.5044 13 Mohammad Hafeez 8 10 68 2 34 30 6.8 0.5041 14 Jayasuriya, ST 14 21 159 4 39.75 31.5 7.57 0.4922 15 Kartik, M 6 14.4 127 3 42.33 29.33 8.66 0.4600 16 Sehwag, V 14 11 133 3 44.33 22 12.09 0.4591 17 Shoaib Malik 7 8.3 85 2 42.5 25.5 10 0.4538 18 Gagandeep Singh 4 14 141 3 47 28 10.07 0.4267 19 Hussey, DJ 13 13 130 2 65 39 10 0.2585 20 Venugopal Rao, Y 11 14 137 2 68.5 42 9.79 0.2213 21 Joshi, SB 4 9.1 82 1 82 55 8.95 0.1274 22
3.3. Overall Performance Evaluation of Bowlers by COPRAS:
In 1996, Zavadskas, Kaklauskas created a method named COmplex PRoportional ASsessment (COPRAS) in [28]. It is used for multi-criteria evaluation of both maximizing and minimizing criteria values. This is the advantage of the method COPRAS over AHP method. This method assumes direct and proportional dependence of the significance and utility degree of investigated versions on a system of criteria adequately describing the alternatives and on values and weights of the criteria. Determination of significance, the priority order and utility degree of the alternatives is carried out in [29]. Selection
of contractor by using COPRAS and COPRAS-G was proposed by Zavadskas and et.al. [30].
The procedure of the COPRAS method consists of the following steps:
Step 1: Selection of the available set most important attributes which describe alternatives.
Step 2: Preparing of the decision-making matrix X:

VOL. 2, NO. 11, November 2011 ISSN 2079-8407
Journal of Emerging Trends in Computing and Information Sciences ©2009-2011 CIS Journal. All rights reserved.
http://www.cisjournal.org
571
nmnn
m
m
xxx
xxx
xxx
X
...
............
...
...
21
22221
11211
(19)
, where n = number of alternatives and m= number of attributes.
Step 3: Determining weights of the attributes qj by AHP.
Step 4: Normalization of the decision-making
matrix X by
mjandnix
xx n
iij
ijij ,1,1;
1
(20)
Step 5: Calculation of the weighted normalized
decision matrix X̂ . The weighted normalized values x̂ ij
are calculated as:
mjandniqxx jijij ,1,1;. (21)
Step 6: Sums Pj of attributes values which larger values are more preferable (optimization direction is
maximization) calculation for each alternative (line of the
decision-making matrix): Pj =
k
i
ijx1
ˆ (22)
Step 7: Sums Rj of attributes values which larger values are more preferable (optimization direction is maximization) calculation for each alternative (line of the decision-making matrix):
Rj =
n
ki
ijx1
ˆ (23)
Step 8: Calculation of the relative weight of each alternative Qj:
n
j jj
n
jj
jj
RR
R
PQ
1
1
1 (24)
Step 9: Calculation of the utility degree of each alternative:
%100maxQ
QN j
j (25)
Table 10: Ranking of Bowler according their performance in IPL-I, II, III by AHP-TOPSIS & AHP-COPRAS
Player Overall Actual Dataset TOPSIS Copras Name Mts Overs Runs Wkts Avg SR Econ Value Rank Value Rank
PP Ojha 44 148.8 1061 50 21.22 17.86 7.13 0.9008 1 1.0003 1 A Mishra 31 115 795 42 18.93 16.43 6.91 0.8648 2 0.9864 2 A Kumble 42 160.5 1058 45 23.51 21.40 6.59 0.8167 4 0.9452 3 RP Singh 42 152.6 1229 51 24.10 17.95 8.05 0.8180 3 0.9444 4 IK Pathan 42 149.4 1165 47 24.79 19.07 7.80 0.8019 5 0.9194 5 A Nehra 31 109.5 790 37 21.35 17.76 7.21 0.7966 6 0.9104 6 Harbhajan Singh 31 107.3 715 34 21.03 18.94 6.66 0.7757 7 0.9089 7 M Muralitharan 40 156 994 40 24.85 23.40 6.37 0.7456 10 0.8979 8 SK Warne 42 152 1150 44 26.14 20.73 7.57 0.7619 8 0.8910 9 PP Chawla 43 140 1064 41 25.95 20.49 7.60 0.7498 9 0.8770 10 MF Maharoof 20 70 520 27 19.26 15.56 7.43 0.7187 12 0.8766 11 MM Patel 30 102.5 779 33 23.61 18.64 7.60 0.7285 11 0.8467 12 JA Morkel 39 135.4 1132 41 27.61 19.81 8.36 0.7061 13 0.8418 13 Zaheer Khan 31 111.2 875 34 25.74 19.62 7.87 0.6997 14 0.8215 14 SK Trivedi 33 103.3 811 30 27.03 20.66 7.85 0.6482 16 0.7867 15 L Balaji 29 93.4 809 31 26.10 18.08 8.66 0.6603 15 0.7858 16 DW Steyn 28 106 720 27 26.67 23.56 6.79 0.6227 17 0.7791 17 R Vinay Kumar 33 101.3 849 30 28.30 20.26 8.38 0.6223 18 0.7658 18 P Sangwan 28 101.4 833 29 28.72 20.98 8.21 0.6065 21 0.7517 19 P Kumar 38 138.8 1140 34 33.53 24.49 8.21 0.5411 25 0.7498 20 R Bhatia 22 59.4 461 19 24.26 18.76 7.76 0.6108 19 0.7488 21 DJ Bravo 30 87.4 719 26 27.65 20.17 8.23 0.6066 20 0.7487 22 AB Dinda 29 86.1 605 22 27.50 23.48 7.03 0.5754 23 0.7389 23 S Sreesanth 28 93.1 825 28 29.46 19.95 8.86 0.5835 22 0.7302 24Yuvraj Singh 43 52 377 14 26.93 22.29 7.25 0.5426 24 0.7158 25 MS Gony 26 85 707 23 30.74 22.17 8.32 0.5278 26 0.6939 26 I Sharma 31 110.1 862 25 34.48 26.42 7.83 0.4549 29 0.6831 27 LR Shukla 26 37.6 330 12 27.50 18.80 8.78 0.5254 27 0.6613 28 YK Pathan 43 97.1 719 20 35.95 29.13 7.40 0.3890 30 0.6576 29 ST Jayasuriya 30 49 390 13 30.00 22.62 7.96 0.4850 28 0.6521 30 M Kartik 26 87.4 581 16 36.31 32.78 6.65 0.3452 32 0.6088 31 AB Agarkar 27 79 694 18 38.56 26.33 8.78 0.3376 33 0.5981 32 JH Kallis 42 137.2 1140 23 49.57 35.79 8.31 0.1979 34 0.5909 33 RR Powar 21 56 383 11 34.82 30.55 6.84 0.3575 31 0.5836 34
VOL. 2, NO. 11, November 2011 ISSN 2079-8407
Journal of Emerging Trends in Computing and Information Sciences ©2009-2011 CIS Journal. All rights reserved.
http://www.cisjournal.org
572
Finally, the overall performance of bowlers who played all three version of IPL and satisfied the conditions for selecting the players’ i.e; the players who played at least 3 matches with minimum of 5 over bowled and took at least 1 wicket. At first the performances of bowlers are calculated according the procedure describe in the section 3.2. Then according the procedure of COPRAS the bowling performance of bowlers are calculated and their ranked is shown in the table 10. The result of AHP-TOPSIS and AHP-COPRAS of the bowlers are very similar which suggest that this study is very accurate to evaluate the bowlers’ performance in IPL.
4. CONCLUSION
The salary of IPL cricket players are decided through auction. Thus, it is a matter of decision making from the part of the franchise to decide about which player to be bided for and at what cost by the performance of the players in IPL. Therefore, such a model can help a franchisee to take a decision. The paper seeks to highlight the tremendous scope that exists to improve and develop on the measures currently used to describe the performances of cricket players in general especially for bowlers. In 2010 session the Indian spinners have done better than the Indian fast-bowlers whereas in 2009 session Indian bowlers have done well in both the categories but in 2008 the top bowlers are foreigners in both categories. But in overall performance the Indian bowlers are very good and top 7 bowlers are Indians and in top 10 only two foreigners are there. The performance of ‘Zaheer Khan’, Indian one of the best bowler was not good enough during IPL. SK Warne & M. Muralitharan, the best spinners of the world did not get the rank in top 5 bowlers. AHP-TOPSIS and AHP-COPRAS give similar type result in overall performance of bowlers proof the accuracy of proposed technique. Similar approaches can be adopted to represent the performances of batsmen, all-rounder and wicket keepers too.
REFERENCES
[1] Alan C. Kimbert and Alan R. Hansford, “A Statistical Analysis of Batting in Cricket”, J. R. Statist. Soc. A (1993) 156, Part 3, pp. 443-455.
[2] Clarke, S R (1988). “Dynamic programming in one-day cricket- optimal scoring rates,” Journal of the Operational Research Society, 50, 536 – 545.
[3] Kimber, A C and Hansford, A R (1993). “A Statistical Analysis of Batting in Cricket,” Journal of Royal Statistical Society, 156, 443 – 455.
[4] Damodaran, U (2006). “Stochastic Dominance and Analysis of ODI Batting Performance: The Indian Cricket Team, 1989-2005,” Journal of Sports Science and Medicine, 5, 503 – 508.
[5] Elderton, W P (1945). “Cricket scores and some skew correlation distribution,” Journal of Royal Statistical Society (Series A), 108, 1 – 11.
[6] Wood, G H (1945). “Cricket scores and geometric progression,” Journal of Royal Statistical Society, Series A (Statistics in Society) 108, 12 – 22.
[7] Norman, J and Clarke, S R (2004). “Dynamic programming in cricket: Batting on sticky wicket,” Proceedings of the 7th Australasian Conference on Mathematics and Computers in Sport, 226 – 232.
[8] Ovens, M and Bukeit, B (2006). “A mathematical modeling approach to one day cricket batting orders,” Journal of Sports Science and Medicine, 5, 495-502.
[9] Gurram, M and Narayanan, S (2004). “Comparison of the methods to reset targets for interrupted One-Day Cricket Matches,” Proceedings of 7th Australasian Conference on Mathematics and Computers in Sport, 165 – 171.
[10] Jayadevan, V (2002). “A new method for the computation of targets scores in interrupted, limited over cricket matches,” Current Science, 83, 577 – 586.
[11] Duckworth, F C and Lewis, A J (1998). “A fair method of resetting the target in interrupted one-day cricket matches,” Journal of Operational Research Society, 49, 220 – 227.
[12] Rastogi, S K and Deodhar, S Y (2009). “Player pricing and valuation of cricketing attributes: Exploring the IPL Twenty-20 vision,” Vikalpa, 34 (2), 15 – 23.
[13] Depken, C. A. and Rajasekhar, R., (2010) Open Market Valuation of Player Performance in Cricket: Evidence from the Indian Premier League (April 1, 2010). Available at SSRN: http://ssrn.com/abstract= 1593196
[14] Lemmer, H (2008). “An analysis of players’ performances in the first cricket Twenty20 world cup series,” South African Journal for Research in Sport, 30, 71 -77.
[15] Vig, A (2008). “Efficiency of sports league – The economic implications of having two in the Indian cricket market,” Masters Project: The University of Nottingham.
[16] Ramani, S.(2008)“Cricket, Excesses and Market Mania,”Economic & Political Weekly,March 8,13-15.
[17] Staden, P J (2009). “Comparison of cricketers’ bowling and batting performances using graphical displays,” Current Science, 96, 764-766.
[18] Parker, D., Burns, P and Natarajan, H., (2008) “Player valuations in the Indian Premier League,” Frontier Economics, October 2008, 1-17.
[19] Saaty, T. L., The Analytic Hierarchy Process, McGraw-Hill, New York, 1980.
[20] Saaty, T. L., "Priority Setting in Complex Problems," IEEE Transactions on Engineering Management, Vol.30, No.3, pp.140-155, 1983.
[21] Christos Douligeris and Ian J. Pereira, “A Telecommunications Quality Study Using the Analytic Hierarchy Process,” IEEE Journal on Selected Areas in Communications, Vol. 12, No. 2, 1994.

VOL. 2, NO. 11, November 2011 ISSN 2079-8407
Journal of Emerging Trends in Computing and Information Sciences ©2009-2011 CIS Journal. All rights reserved.
http://www.cisjournal.org
573
[22] Lai, V.S., Trueblood, R.P. and Wong, B.K., “Software selection: a case study of the application of the analytical hierarchical process to the selection of a multimedia authoring system,” Information & Management, Vol. 25, No. 2, 1992.
[23] Maggie, C.Y.Tam, and V.M. Rao Tummala, “An application of the AHP in vendor selection of a telecommunications system,” Omega, Vol. 29, pp.171-182, 2001.
[24] Akkineni, V.S. and Nanjundasastry, S., “The Analytic Hierarchy Process for Choice of Technologies,” Technological Forecasting and Social Change, Vol. 38, pp.151-158, 1990.
[25] M.A. Abo-Sinna, A.H. Amer, Extensions of TOPSIS for multi-objective large-scale nonlinear programming problems, Applied Mathematics and Computation 162 (2005) 243–256.
[26] C.L. Hwang, K. Yoon, Multiple Attribute Decision Making Methods and Applications, Springer, Berlin Heidelberg, 1981.
[27] G.R. Jahanshahloo, F. Hosseinzadeh Lotfi, M. Izadikhah, An algorithmic method to extend TOPSIS for decision-making problems with interval data, Applied Mathematics and Computation (2005).
[28] A.Kaklauskas, E.K. Zavadskas. (1996). Multicriteria Evaluation of Building (Pastatų sistemotechninis įvertinimas). Vilnius: Technika.
[29] Kaklauskas, E.K. Zavadskas, S. Raslanas, Multivariant design and multiple criteria analysis of building refurbishments, Energy and Buildings 37 (2005) 361–372.
[30] E.K. Zavadskas, A. Kaklauskas, Z. Turskis and J. Tamosaitiene, “Contractor Selection Multi-Attribute Model Applying COPRAS Method with Grey Interval Numbers, 20th EURO Mini Conference “Continuous Optimization and Knowledge-Based Technologies” (EurOPT-2008), pp. 241–247.
[31] IPL T-20 tournament statistics available in http://www.iplt20.com.
[32] Saikia, Hemanta and Bhattacharjee Dibojyoti, “A Bayesian Classification Model for Predicting the Performance of All-Rounders in the Indian Premier
League, http://papers.ssrn.com/sol3/papers.cfm?abstract_id=1622060.
Author’s Bibliography
Mr. Pabitra Kumar Dey is currently Assistant Professor in the department of Computer Application, Dr. B.C.Roy Engineering College, Durgapur-713206, W.B., India. He obtained B.Sc.(Mathematics Hons.) from The University of Burdwan in 2000 and M.C.A. degree from National Institute of Technology, Durgapur, W.B. in 2004 and M.Tech.(CST) from W.B.U.T. in 2011. He has about more than of 7 years of Teaching Experience and 3 years of Research Experience. He published 9 research papers in reputed journal and in the proceedings of IEEE conference. The broad area of his research interest is in “Soft Computing (Fuzzy logic, Rough Set,…), Multi Criteria Analysis, Decision Theory, etc.”
Dr. Dipendra Nath Ghosh is currently Associate Professor in the department of Computer Science & Engineering, Dr. B.C.Roy Engineering College, Durgapur-713206, W.B., India. He obtained M.Sc. in Mathematics & M.C.A. from University of Burdwan and Ph.D. in Computer Science from that University in 2008. He has over 09 years of teaching experience and 06 years of research experience. He is guiding M.Tech. & Ph.D. students and has 15 research papers to his credit.
Dr. Abhoy Chand Mondal is currently Associate Professor of Department of Computer Science, Burdwan University, W.B., India. He received his B.Sc.(Mathematics Hons.) from The University of Burdwan in 1987, M.Sc. (Math) and M.C.A. from Jadavpur University, in 1989, 1992 respectively. He received his Ph.D. from Burdwan University in 2004. He has 1 year industry experience and 18 years of teaching and research experience. No. of journal paper more than 15.