Evaluating Criticism of Smart Growth
81
Telephone: 250-360-1560 | email: [email protected] Todd Alexander Litman © 2003-2009 You are welcome and encouraged to copy, distribute, share and excerpt this document and its ideas, provided the author is given attribution. Please send your corrections, comments and suggestions for improving it. Evaluating Criticism of Smart Growth By Todd Litman Victoria Transport Policy Institute 2 September 2009 Victoria, British Columbia is an example of a city that benefits from Smart Growth land use patterns. Abstract This paper evaluates various criticisms of Smart Growth. It defines the concept of Smart Growth, contrasts it with sprawl, and describes common Smart Growth strategies. It examines various criticisms of Smart Growth, including the claim that it does not reflect consumer preferences, infringes on freedom, increases traffic congestion and air pollution, reduces housing affordability, results in socially undesirable levels of density, increases public service costs, requires wasteful transit subsidies and is unjustified. Some specific critics’ papers are examined. This analysis indicates that many claims by critics reflect an incomplete understanding of Smart Growth, and inaccurate analysis. Critics identify some legitimate problems that must be addressed to optimize Smart Growth, but present no convincing evidence to diminish the overall justification of Smart Growth.
-
Upload
independent -
Category
Documents
-
view
1 -
download
0
Transcript of Evaluating Criticism of Smart Growth

Telephone: 250-360-1560 | email: [email protected]
Todd Alexander Litman © 2003-2009 You are welcome and encouraged to copy, distribute, share and excerpt this document and its ideas, provided the
author is given attribution. Please send your corrections, comments and suggestions for improving it.
Evaluating Criticism of Smart Growth
By Todd Litman Victoria Transport Policy Institute
2 September 2009
Victoria, British Columbia is an example of a city that benefits from Smart Growth land use patterns.
Abstract This paper evaluates various criticisms of Smart Growth. It defines the concept of Smart Growth, contrasts it with sprawl, and describes common Smart Growth strategies. It examines various criticisms of Smart Growth, including the claim that it does not reflect consumer preferences, infringes on freedom, increases traffic congestion and air pollution, reduces housing affordability, results in socially undesirable levels of density, increases public service costs, requires wasteful transit subsidies and is unjustified. Some specific critics’ papers are examined. This analysis indicates that many claims by critics reflect an incomplete understanding of Smart Growth, and inaccurate analysis. Critics identify some legitimate problems that must be addressed to optimize Smart Growth, but present no convincing evidence to diminish the overall justification of Smart Growth.

Evaluating Criticism of Smart Growth
1
Contents Summary ........................................................................................................................... 2 Introduction ....................................................................................................................... 4 Defining Smart Growth ...................................................................................................... 5 Benefits and Costs ............................................................................................................ 9 Positive Or Negative Incentives ...................................................................................... 10 Differing Paradigms ......................................................................................................... 11 Measurement and Evaluation Issues .............................................................................. 12 What Is Optimal? ............................................................................................................. 16 Smart Growth Criticism ................................................................................................... 21
Consumer Preferences ............................................................................................................. 21 Infringement on Freedom .......................................................................................................... 27 Equity Impacts ........................................................................................................................... 28 Failed Policies ........................................................................................................................... 29 Traffic Congestion and Air Pollution Impacts ............................................................................ 30 Public Security ........................................................................................................................... 32 Density And Social Problems .................................................................................................... 33 Economic Development ............................................................................................................ 34 Housing Affordability ................................................................................................................. 35 Cost of Living ............................................................................................................................. 38 Smart Growth Forces People To Give Up Single-Family Homes and Driving .......................... 39 Public Service Costs ................................................................................................................. 40 Health Impacts .......................................................................................................................... 41 Greenspace Preservation Benefits ........................................................................................... 43 Transit Cost Efficiency............................................................................................................... 44 Induced Traffic Impacts ............................................................................................................. 48 Jobs/Housing Balance .............................................................................................................. 48 Slow ........................................................................................................................................... 48
Considering Alternatives ................................................................................................. 49 Responding To Specific Critics ....................................................................................... 51
Wendell Cox .............................................................................................................................. 51 Edward Glaeser and Matthew Kahn ......................................................................................... 55 Peter Gordon and Harry Richardson ......................................................................................... 56 Joel Kotkin ................................................................................................................................. 57 Edwin S. Mills ............................................................................................................................ 62 Randal O’Toole ......................................................................................................................... 63
Critics Perspectives ......................................................................................................... 64 Self Interest ............................................................................................................................... 64 Ideological ................................................................................................................................. 64
Legitimate Criticisms ....................................................................................................... 66 Conclusions..................................................................................................................... 67 Acknowledgements ......................................................................................................... 68 References and Resources ............................................................................................. 68

Evaluating Criticism of Smart Growth
2
Summary Smart Growth refers to development principles and planning practices that create more efficient land use and transport patterns. It includes numerous strategies that result in more accessible land use patterns and multi-modal transport systems. It is an alternative to sprawl. Smart Growth is supported by diverse interest groups and professional organizations. Smart Growth has been criticized by various individuals and organizations. This paper evaluates such criticism. Critics tend to assume that consumers prefer large single-family homes in automobile-dependent communities, and that current transport and land use policies are overall efficient and fair. As a result, they criticize Smart Growth as being harmful to consumers and the economy. This ignores evidence that many people will choose other housing and transport options if given suitable options and incentives, and that current markets are distorted in ways that increase sprawl and automobile dependency. Many Smart Growth strategies are market reforms that correct existing market distortions, increasing consumer options, economic efficiency and equity. Critics endorse some Smart Growth strategies in recognition that they increase market efficiency. Critics sometimes misrepresent Smart Growth and make various analytical errors which can lead to false conclusions. They often evaluate Smart Growth based simply on gross regional population density. They ignore interrelationships between city size, density, congestion, travel patterns, income and cost-of-living, and the tendency of Smart Growth to be implemented in areas with rapid population and economic growth. As a result, some evidence presented by critics misrepresents key issues. Specific Smart Growth criticisms are summarized below and evaluated in detail in the body of this report.
Consumers Prefer Sprawl and Automobile Dependency Critics claim that consumers prefer sprawl and automobile dependency. But there is considerable evidence that many consumers prefer Smarter Growth communities and alternative transport modes, particularly if supported with suitable policies. Critics ignore many direct benefits that Smart Growth can provide to consumers, including financial savings, increased physical exercise, community cohesion, improved transport options for non-drivers, and greenspace preservation.
Smart Growth Increases Regulation and Reduces Freedom Critics claim that Smart Growth significantly increases regulation and reduces freedoms. But many Smart Growth strategies reduce existing regulations and increase various freedoms. Overall, Smart Growth tends to increase more freedoms than it reduces, for example, by allowing more flexible development designs and providing more consumer travel options.
Smart Growth Reduces Affordability Critics claim that Smart Growth increases housing costs by reducing land supply, but ignore various ways it reduces household costs by reducing unit land requirements, increasing housing options, reducing parking and infrastructure costs, and reducing consumer transport costs. The evidence critics use to evaluate housing affordability fails to account for confounding factors, such as higher housing costs in larger cities, and the tendency of Smart Growth to be implemented in areas experiencing rapid population and economic growth, which tends to raise housing costs.

Evaluating Criticism of Smart Growth
3
Smart Growth Increases Congestion Critics claim that Smart Growth increases traffic congestion and therefore reduces transport system quality, based on simple models of the relationship between density and trip generation. However, Smart Growth does more than just increase density, it also increases accessibility and travel options, and provides incentives to reduce urban-peak vehicle trips, which tend to reduce congestion. Traffic congestion alone is an ineffective indication of transport system quality since increased congestion can be offset if travel distances decline and travel options improve, so less driving is needed to reach destinations. Empirical data indicate that Smart Growth does not increase per-capita congestion delay or average commute times.
Public Service Costs Although many studies indicate Smart Growth can reduce development and public service costs, critics dismiss these studies, claiming that sprawl provides overall savings. But critics incorrectly measure Smart Growth only in terms of density, consider a limited set of total infrastructure and public costs, and ignore higher wages and public service quality in larger cities.
Transit Benefits Critics claim that public transit investments are not cost effective because the costs of attracting additional riders are high and overall ridership is too small to reduce traffic congestion. This overlooks the fact that transit ridership tends to be greatest on major urban corridors where congestion is greatest, that transit improvements are often more cost effective than highway capacity expansion, that Smart Growth strategies can increase transit operating efficiency and ridership, and that public transit service provides many other benefits to society. When all costs and benefits are considered, Smart Growth programs that improve transit service and encourage transit ridership are often the most cost effective way to improve transportation systems.
Economic Development Critics claim that Smart Growth is harmful to the economy. But Smart Growth can increase economic efficiency and productivity, and is associated with higher incomes and economic growth.
Critics tend to assume that consumers are inflexible, helpless and lazy, and so would be unable to accept living in more smart growth communities and reducing their automobile travel. However, experience indicates that people are actually quite adaptable and creative, enjoy walking and cycling, and can flourish in a wide range of land use conditions and transportation patterns. Some objections raised by critics are actually justifications for more Smart Growth. For example, critics argue that density increases traffic congestion, which justifies implementing additional Smart Growth strategies to improve accessibility and encourage use of non-automobile modes in urban and suburban areas experiencing growth. Critics raise some legitimate concerns, such as that Smart Growth can have unintended consequences and can increase some costs. But these can be addressed with good planning. They are not fatal flaws.

Evaluating Criticism of Smart Growth
4
Introduction Home is where the heart is, and community is where the home is. As a result, there are few issues that affect people more deeply than community design factors, since it touches our hearts. It should therefore be no surprise that there are considerable debates over public policies that affect community design. There are many possible ways to organize a community. Around the world you will find people leading happy, productive lives in a wide variety of settlement patterns, ranging from dispersed rural homes, to small towns to large city skyscrapers. Similarly, there are many ways to connect the various parts of a community, that is, to structure transportation systems, ranging from walkable villages to transit-oriented neighborhoods to automobile-dependent suburbs. Different land use patterns and transport systems have various advantages and disadvantages, both to individuals and to society overall. Over the last several decades many communities have experienced sprawl development patterns, with dispersed, low-density, automobile-dependent urban fringe expansion. These trends have been supported by various public policies and investments, ranging from generous parking requirements to major suburban highway investments. This development pattern exacerbates many problems, ranging from the economic costs to consumers and governments of an automobile-dependent transportation system, to the environmental and aesthetic costs of development that displaces greenspace. In recent years many individuals and groups have decided that they want to change their community’s development pattern based on a set of principles and strategies called Smart Growth. These principles increase land use accessibility, reduce per capita land consumption and vehicle travel, and create more complete, mixed use communities. There is considerable debate over the merits of Smart Growth, with critics raising various arguments to suggest that Smart Growth provides fewer benefits and imposes greater costs than proponents claim. Some criticism concerns the goals of Smart Growth, others with the methods used to achieve these goals. Much of this debate concerns what policies can be considered neutral. Critics assume that existing policies are overall neutral, and so current land use and transport patterns reflect consumer preferences, and Smart Growth policy changes are therefore harmful to consumers and the economy. But there are many existing market distortions that tend to increase land use consumption and motor vehicle travel. Many Smart Growth strategies are market reforms that correct these distortions, and so tend to increase efficiency and equity, making consumers and the economy better off overall. Other strategies, such as regulations and favorable tax policies and public investments to support Smart Growth, may be justified on second-best grounds until all market-based reforms are fully implemented and their full effects have had time to occur. This paper evaluates Smart Growth criticism. It attempts to provide a fair and objective examination of the arguments made by Smart Growth critics, and the evidence they present to support their arguments.

Evaluating Criticism of Smart Growth
5
Defining Smart Growth Smart Growth (also called New Urbanism) refers to development principles and planning practices that result in more efficient land use and transport patterns. It is an alternative to sprawl, which refers to low-density, dispersed, automobile-dependent land use patterns. Major differences between these two land use patterns are compared in Table 1. Table 1 Smart Growth and Sprawl (“Smart Growth,” VTPI 2005; SGN 2001)
Smart Growth Sprawl Density Higher-density, clustered activities. Lower-density, dispersed activities. Growth pattern Infill (brownfield) development. Urban periphery (greenfield) development. Land use mix Mixed. Single use, segregated Scale
Human scale. Smaller blocks and roads. Attention to detail, since people experience the landscape up close, as pedestrians.
Large scale. Larger blocks and wide roads. Less detail, since people experience the landscape at a distance, as motorists.
Public services (shops, schools, parks)
Local, distributed, smaller. Accommodates walking access.
Regional, consolidated, larger. Requires automobile access.
Transport
Multi-modal transportation and land use patterns that support walking, cycling and public transit.
Automobile-oriented transportation and land use patterns, poorly suited for walking, cycling and transit.
Connectivity
Highly connected roads, sidewalks and paths, allowing more direct travel by motorized and nonmotorized modes.
Hierarchical road network with many unconnected roads and walkways, and barriers to nonmotorized travel.
Street design Streets designed to accommodate a variety of activities. Traffic calming.
Streets designed to maximize motor vehicle traffic volume and speed.
Planning process Planned and coordinated between jurisdictions and stakeholders.
Unplanned, with little coordination between jurisdictions and stakeholders.
Public space
Emphasis on the public realm (streetscapes, pedestrian areas, public parks, public facilities).
Emphasis on the private realm (yards, shopping malls, gated communities, private clubs).
This table compares various features of Smart Growth and Sprawl. Smart Growth emphasizes accessibility, that is, people’s ability to reach desired goods, services and activities (“Accessibility,” VTPI, 2005), while sprawl emphasizes mobility (physical movement) and automobility (movement by automobile). It reduces distances between common activities (home, work, schools, services) and supports alternative modes (walking, cycling and transit), while sprawl disperses destinations and is automobile dependent. Sprawl results in longer but faster automobile trips, while Smart Growth results in shorter, slower trips, some by alternative modes. Smart Growth includes various implementation strategies, such as those listed on the next page. Which strategies are appropriate for implementation varies depending on conditions and objectives. Because its impacts tend to be synergistic (total impacts are greater than the sum of their individual impacts) Smart Growth is best implemented as an integrated program. For example, increased density, improved walkability or increased transit service by themselves cannot be considered Smart Growth; rather, a Smart Growth program might involve all of these plus other supporting strategies.

Evaluating Criticism of Smart Growth
6
Smart Growth Strategies (“Smart Growth,” VTPI, 2005)
• Strategic planning. Establish a comprehensive community vision that individual land use and transportation decisions should support.
• Create more self-contained communities. Locate compatible land uses within proximity of each other. For example, develop schools, shops and recreation facilities in or adjacent to residential areas. Mix land uses at the finest grain feasible.
• Foster distinctive, attractive communities with a strong sense of place. Encourage urban development that creates a sense of civic pride and community cohesion, including attractive public spaces, high-quality design and maintenance standards, preservation of special cultural and environmental resources, and activities that highlight a community’s unique features.
• Encourage “village” development. Establish well-defined “urban villages,” walkable centers that contain an appropriate mixture of land uses (residential, commercial, institutional, recreational) with distinct names and characters. Reduce minimum lot sizes, building setbacks, minimum parking requirements, and minimum street size particularly around transit and commercial centers.
• Concentrate activities. Concentrate commercial activities in these areas. Retain strong downtowns and central business districts. Use access management to discourage arterial strip commercial development.
• Encourage infill development. Locate new development within already developed areas. Encourage redevelopment of older facilities and brownfields.
• Reform tax and utility rates. Structure property taxes, development fees and utility rates to reflect the lower public service costs of clustered, infill development, and focus economic development incentives to encourage businesses to locate in more accessible locations.
• Manage parking for efficiency. Encourage shared parking, parking maximums, and other parking management strategies. Reserve the most convenient parking for rideshare vehicles.
• Avoid overly-restrictive zoning. Reduce excessive and inflexible parking and road capacity requirements. Limit undesirable impacts (noise, smells and traffic) rather than broad categories of activities.
• Create a network of interconnected streets. Keep streets as narrow as possible, particularly in residential areas and commercial centers. Use traffic management and traffic calming to control vehicle impacts rather than dead ends and cul de sacs.
• Site design and building orientation. Encourage buildings to be oriented toward city streets, rather than set back behind large parking lots. Avoid large areas of parking or other unattractive land uses in commercial areas.
• Improve nonmotorized travel conditions. Encourage walking and cycling by improving sidewalks, paths, crosswalks, protection from fast vehicular traffic, and providing street amenities (trees, awnings, benches, pedestrian-oriented lighting, etc.).
• Implement mobility management. Use mobility management to reduce total vehicle traffic and encourage the use of efficient modes.
• Encourage mixed housing types and prices. Develop affordable housing near employment, commercial and transport centers. Encourage secondary suites, apartments over shops, lofts, location-efficient mortgages and other affordable housing innovations.

Evaluating Criticism of Smart Growth
7
Figure 1 Smart Growth and Sprawl Illustrated
Smart Growth Sprawl
Smart Growth involves clustered land use, with mixed, medium-density development; and transportation systems that balance walking, cycling, driving and public transit. Sprawl typically involves dispersed land use, with commercial strip development along arterials and lower-density single-family housing; and automobile-oriented transport systems. Smart Growth places a high value on redeveloping and infilling existing urbanized areas in order to improve accessibility, make use of existing infrastructure, support existing communities (particularly disadvantaged communities) and preserve greenspace. Smart Growth strives to provide a balance of mobility and land use accessibility, as opposed to automobile dependency which relies almost entirely on automobile transportation at the expense of other forms of access, and car-free areas where automobile use is prohibited. Smart Growth is sometimes incorrectly portrayed as a conflict between urban and suburban communities. Smart Growth can be implemented under urban, suburban and rural conditions, as described below. • Urban: In urban areas it emphasizes redevelopment and infill of existing neighborhoods,
improving design features (such as traffic calming of urban streets), and enhancing multi-modal transport systems, particularly walking and public transit.
• Suburban: In suburban areas it creates medium-density, mixed-use, multi-modal centers and
corridors, either by incrementally developing existing suburban communities or by master-plan developments that reflect Smart Growth principles. It encourages more complete suburban communities (more services and employment in suburban jurisdictions), and improved regional travel options such as cycling, rideshare and transit improvements.
• Rural: In rural areas Smart Growth involves policies that help channel development and
public services into accessible, mixed-use villages (for example, having schools, stores and affordable housing located close together and well connected by good walking facilities), and rural mobility management strategies such as cycling and rideshare improvements.
Evaluating Criticism of Smart Growth
8
Suburban Smart Growth Example
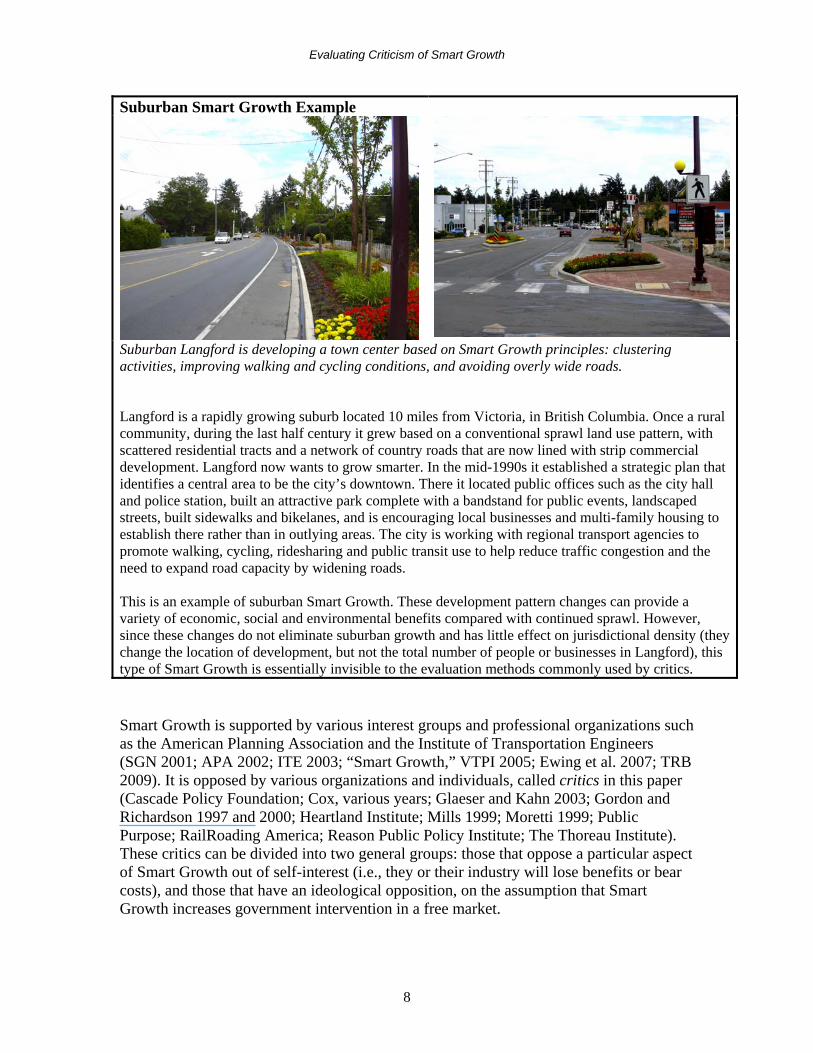
Suburban Langford is developing a town center based on Smart Growth principles: clustering activities, improving walking and cycling conditions, and avoiding overly wide roads. Langford is a rapidly growing suburb located 10 miles from Victoria, in British Columbia. Once a rural community, during the last half century it grew based on a conventional sprawl land use pattern, with scattered residential tracts and a network of country roads that are now lined with strip commercial development. Langford now wants to grow smarter. In the mid-1990s it established a strategic plan that identifies a central area to be the city’s downtown. There it located public offices such as the city hall and police station, built an attractive park complete with a bandstand for public events, landscaped streets, built sidewalks and bikelanes, and is encouraging local businesses and multi-family housing to establish there rather than in outlying areas. The city is working with regional transport agencies to promote walking, cycling, ridesharing and public transit use to help reduce traffic congestion and the need to expand road capacity by widening roads. This is an example of suburban Smart Growth. These development pattern changes can provide a variety of economic, social and environmental benefits compared with continued sprawl. However, since these changes do not eliminate suburban growth and has little effect on jurisdictional density (they change the location of development, but not the total number of people or businesses in Langford), this type of Smart Growth is essentially invisible to the evaluation methods commonly used by critics. Smart Growth is supported by various interest groups and professional organizations such as the American Planning Association and the Institute of Transportation Engineers (SGN 2001; APA 2002; ITE 2003; “Smart Growth,” VTPI 2005; Ewing et al. 2007; TRB 2009). It is opposed by various organizations and individuals, called critics in this paper (Cascade Policy Foundation; Cox, various years; Glaeser and Kahn 2003; Gordon and Richardson 1997 and 2000; Heartland Institute; Mills 1999; Moretti 1999; Public Purpose; RailRoading America; Reason Public Policy Institute; The Thoreau Institute). These critics can be divided into two general groups: those that oppose a particular aspect of Smart Growth out of self-interest (i.e., they or their industry will lose benefits or bear costs), and those that have an ideological opposition, on the assumption that Smart Growth increases government intervention in a free market.

Evaluating Criticism of Smart Growth
9
Benefits and Costs By increasing accessibility and reducing vehicle mileage, Smart Growth provides various benefits, as listed in Table 2. Of course, a particular Smart Growth program’s benefits depend on its specific design and conditions. Smart Growth can involve a number of costs, including reduced private land consumption, reduced driving and additional design requirements. Critics claim that actual benefits are smaller and costs are greater than predicted by Smart Growth proponents. These issues are discussed later in this paper. Table 2 Smart Growth Benefits (ICCMA 1998; USEPA, 2003; VTPI 2005)
Economic Social Environmental
Reduced development costs.
Reduced public service costs.
Reduced transportation costs.
Economies of agglomeration.
More efficient transportation.
Supports industries that depend on high quality environments (tourism, farming, etc.).
Improved transport options and mobility, particularly for non-drivers.
Improved housing options.
Community cohesion.
Preserves unique cultural resources (historic sites, traditional neighborhoods, etc.)
Increased physical fitness and health.
Greenspace & habitat preservation.
Reduced air pollution.
Increased energy efficiency.
Reduced water pollution.
Reduced “heat island” effect.
Smart Growth can provide a variety of benefits. Although individual Smart Growth strategies have modest impacts, typically reducing per capita vehicle travel and land consumption by just a few percentage points, their impacts are cumulative and synergetic (TRB 2009). For example, increasing density, improving walkability and encouraging alternative commute modes may each only reduce per-capita vehicle travel by 2-4%, but if implemented together their total impacts are much larger. Comprehensive Smart Growth programs often reduce per capita land use and vehicle travel by 20% or more compared with conventional planning practices (“Land Use Impacts On Travel,” VTPI 2005). Table 3 summarizes some Smart Growth projects, indicating that these reduce per capita vehicle travel by 14-52% compared with conventional development, and since these projects only include a portion of Smart Growth strategies (for example, none include substantial changes in regional transportation investments, development fees, utility pricing and vehicle user charges that require regional and state policy reforms), even greater travel reductions are possible. Table 3 Infill Vehicle Travel Reductions (CCAP 2003)
Location Description VMT ReductionAtlanta 138-acre brownfield, mixed-use project. 15-52%Baltimore 400 housing units and 800 jobs on waterfront infill project. 55%Dallas 400 housing units and 1,500 jobs located 0.1 miles from Dallas
Area Rapid Transit (DART) station. 38%Montgomery County Infill site near major transit center 42%San Diego Infill development project 52%West Palm Beach Auto-dependent infill project 39%Smart Growth can significantly reduce vehicle travel compared with conventional development.

Evaluating Criticism of Smart Growth
10
Positive Or Negative Incentives Critics argue that Smart Growth relies primarily on negative incentives that harm consumers and the economy by reducing housing options and restricting automobile travel. Table 4 evaluates the impacts of various smart growth strategies. Most of these strategies directly benefit the people affected by improving their housing and transport options and increasing efficiency. Many strategies correct existing market distortions that reduce housing and transportation options. Table 4 Smart Growth Consumer Impacts (Litman 2007)
Strategy Examples Consumer Impacts Economic Impacts
More integrated transport and land use planning
Better sidewalks and bikelanes around schools. Commercial development concentrated along transit routes.
Most consumers benefit from improved accessibility and transport options.
Tends to reflect good planning and increase overall efficiency.
Location-efficient development
More affordable housing located in accessible areas.
Benefits lower-income residents who choose such housing.
Responds to consumer demand and increases efficiency.
More flexible zoning codes
Allow more compact and mixed development.
Benefits consumers who prefer more compact, affordable housing options.
Responds to consumer demands and increases efficiency.
Reduced and more flexible parking requirements.
Reduced parking requirements in response to geographic, demographic and management factors (more sharing and pricing of parking)
Benefits consumers who prefer more compact, affordable housing options, particularly those who own fewer than average cars.
Responds to consumer demands and increases efficiency. Can provide significant savings and benefits.
Growth control Urban growth boundaries that limit urban fringe development.
Harms consumers who demand large-lot housing where supply is inadequate.
Increases automobile-dependency and associated costs.
Transportation funding shifts
Reduced funding for roadway expansion and increased funding for walking and cycling facilities and public transit service improvements.
People who prefer alternative modes benefit directly. Motorists may have less capacity, but can benefit from reduced chauffeuring requirements, and reduced congestion if better alternatives cause mode shifts.
Can increase efficiency if there is demand for alternative modes and if mode shifting reduces problems such as congestion and accidents.
Most smart growth strategies directly benefit consumers and increase economic efficiency. Two strategies may harm some consumers. Growth controls can prevent some consumers who want large-lot homes from obtaining the housing option they prefer, if there is a significant shorting of supply. However, there is currently an oversupply of such housing across North America and no indication that shortages will develop in the future (Leinberger 2008; ULI 2009). Similarly, shifting funding from highways to other modes can harm motorists who care nothing about other travel options, if the investments are inefficient and so do nothing to reduce congestion or accident risk, but if such investments are efficient even people who continue driving may benefit overall.

Evaluating Criticism of Smart Growth
11
Differing Paradigms The debate of Smart Growth reflects a paradigm shift (a change in how problems are defined and solutions evaluated), as summarized in Table 5. Table 5 Old Versus New Transport/Land Use Planning Paradigm
Issue Old New Progress Growth: expanding, getting bigger. Development: improving, getting more efficient. Goal of transport.
Mobility/Traffic: considers movement an end in itself.
Accessibility: the ability to reach desired goods, services and destinations.
Analysis approach Reductionist. Considers problems, impacts and solutions individually.
Integrated. Considers problems, impacts and solutions together.
“The” transport problem.
Urban traffic congestion. There are many significant transport problems.
Roadway function
Traffic flow: values the cheapest way to move the maximum amount of traffic.
Multifunctional: values diverse activities on roads, including walking and socializing.
Roadway users Streets are for vehicular traffic. Streets are for people. Resident perspective
Residents are mobile consumers who are quick to leave troubled areas and move to a “better” community.
Residents are community members who want to improve existing neighborhood and make their community a better place to live.
Transportation perspective
Motorists perspective. Motorists, transit users, cyclists, pedestrians, residents and businesses.
Role of non-motorized modes.
Usually of little importance. Mainly recreational. Can generally be ignored.
Is critical for system connections, mobility for non-drivers and personal health.
This table compares the old and new transportation paradigm. Smart Growth reflects the new paradigm, which focuses on accessibility, multi-modalism and comprehensive analysis, while Smart Growth criticism tends to reflect the older paradigm that focuses on vehicle traffic conditions. For example, the new paradigm tends to support land use clustering, transit priority and traffic calming, since they improve accessibility, while the old paradigm tends to oppose these strategies because they reduce automobile traffic speeds, and many of the benefits are outside the traditional range of transport planning evaluation. Path Dependence – Implications for Planning Path dependence refers to patterns that become “locked in.” For example, traditional measuring units (feet, miles, pounds) are well established, and so it has been difficult for many people and industries to convert to metric, despite potential benefits. Land use and transport patterns tend to exhibit path dependence. For example, once an area becomes automobile-dependent it is difficult to create a more balanced transport system. Because of path dependence, decisions can “leverage” much larger long-term effects. As a result, it may be worthwhile to make land use and transport planning decisions that may seem economically inefficient in the short term, in order to influence long-term patterns. Debates over Smart Growth often reflect differences in perceptions about path dependence. Critics argue that projects such as rail transit systems and urban redevelopment have excessive unit costs and little consumer demand. From a short-term perspective highway capacity expansion may appear more cost effective, but not from a longer-term perspective.

Evaluating Criticism of Smart Growth
12
Measurement and Evaluation Issues Many differences between Smart Growth supporters and Critics reflect differences in how impacts are measured and evaluated, as discussed below. In some cases these violate proper research and analysis practices (Litman 2004c).
Misrepresenting Smart Growth Critics often misrepresent Smart Growth. For example, they claim incorrectly that Smart Growth requires:
• That all development occurs within existing urban areas, and any development or population growth in other areas represents sprawl. Smart Growth principles can be applied in urban, suburban and rural areas.
• Extremely high regional population densities, such as 50,000 residents per square mile. Smart Growth involves clustering and infill development, not high area-wide densities.
• Eliminating automobile travel. Smart Growth creates a more balanced and efficient transport system, but still accommodates automobile travel for many trips.
Extrapolating Trends Critics often extrapolate trends inappropriately. For example, critics argue that since home size and vehicle ownership rates generally increase with income, sprawl is inevitable. But such trends do not diminish the value of Smart Growth. There are many exceptions and counter-trends, such as many wealthy people’s preference for more urban homes and alternatives to driving. For example, critics are wrong to claim that because Europe is suburbanizing, Smart Growth is futile, since most European suburbs have far more efficient land use and transport patterns than in the US due to Smart Growth features. Smart Growth can significantly reduce per capita land consumption and vehicle travel compared with what would otherwise occur, and so could still be considered successful even if total land use and vehicle travel increase.
Measurement Units Critics often select measurement units to support their arguments. For example, there are more than a dozen ways to measure congestion, including roadway Level of Service (LOS) ratings, per-capita congestion delay and average commute travel time, some of which reflect a mobility paradigm and others an accessibility paradigm (TRB 1997; Litman 2009). Denser areas tend to have higher roadway LOS ratings (more intense congestion on a particular roadway) but relatively low per-capita congestion delay because shorter trip distances and improved travel options reduce per-capita vehicle mileage, while sprawled areas tend to have less intense congestion but more per capita delay because residents drive more miles (STPP 1999). Critics claim that density increases traffic congestion may be correct if measured per square mile, but not if measured per capita. Similarly, there are many possible ways to measure and compare impacts such as housing affordability, pollution emissions and health risks. Inevitably, critics choose the units that make Smart Growth look bad and sprawl look good.

Evaluating Criticism of Smart Growth
13
Confounding Factors Many land use and transportation factors are interrelated, so simplistic analysis can lead to inappropriate conclusions. For example, density, congestion, commute distance, income and wages, transit mode split, parking prices and rates of home renting (rather than ownership) all tend to increase with city size, but critics are wrong to suggest that Smart Growth causes increased congestion delays, longer commute times, higher transit operating costs or increased housing costs. On the contrary, these costs would probably increase further with more sprawl and per capita vehicle travel. Similarly, Smart Growth tends to be most common in urban regions experiencing rapid population and economic growth, and so are likely to experience rising congestion and housing costs, but that does not mean that Smart Growth causes these problems. It can help reduce many of these impacts, as discussed later in this paper. Yet, critics often ignore these factors and assume that statistical correlation proves causation.
Density Researchers have developed Smart Growth indices that reflect factors such as clustering, land use mix, street connectivity and transport diversity (Galster, et al. 2001; Ewing, Pendall and Chen 2002), but critics often evaluate Smart Growth based simply on jurisdictional density (e.g., city, county or state population per square mile), giving inaccurate results. As mentioned above, since population density tends to increase with city size, it is easy to find spurious relationships and reach incorrect conclusions. Finer-scale density data and more comprehensive statistical analysis are needed to give meaningful information about Smart Growth impacts. Figure 2 Density Versus Sprawl (Ewing, Pendall and Chen, 2002)
0
1,000
2,000
3,000
4,000
5,000
6,000
50 100 150 200
Sprawl/Smart Growth Index
Den
sity
(Res
iden
ts P
er S
quar
e M
ile)
NY
Atlanta
LA
Boston
SFMiami
Denver
Portland
Pittsburgh
Dallas
Detroit
This figure shows regional population density and sprawl index ratings for 25 major U.S. cities. Critics often evaluate Smart Growth based only on regional population density (shifts along the vertical axis), ignoring true Smart Growth factors (shifts along the horizontal axis). For example, Detroit is denser than Boston regions, but ranks lower in the Smart Growth Index.

Evaluating Criticism of Smart Growth
14
Figure 2 shows the regional population density and sprawl index for 25 major U.S. cities. Critics assume that Smart Growth consists of shifts along the vertical access, that is, an increase in regional population density. They are wrong. Smart Growth consists of shifts along the vertical access. Smart Growth does not require that a smaller city become a larger city, rather, it requires that for a given population, a town or city develop in ways that increase clustering, connectivity, land use mix and transportation diversity. Two areas can have the same regional density but one reflects Smart Growth and the other does not, as illustrated in Figure 3. For example, as described earlier, the city of Langford is shifting from sprawl to Smarter Growth development by creating a clustered, multi-modal downtown. Yet, this change is invisible to the quantification methods used by critics, since it occurs in a suburban community and will not significantly increase the city’s population or its population density. Figure 3 Sprawl Versus Smart Growth Land Use Patterns
Sprawl Smart Growth
h h h h h s e h h h h h s h h e s h h e h s
h h h h ses h h h h s h h h h h ese h h
Both boxes contain the same overall density of housing (h), employment (e) and services (s), but on the left they are more dispersed and on the right they are more clustered, creating “villages.”
Role of Automobile Travel Critics argue that alternative modes (walking, cycling and public transit) are of little importance in wealthy countries because more than 90% of households own a motor vehicle and more than 95% of personal travel is by automobile. But these statistics are incomplete and biased. For example, according to the National Personal Transportation Survey data, although only about 2% of total US trips are made by public transit, about 5% of adults report that they rely primarily on public transit, about 12% used public transit at least once during the previous two months, and many households contain at least one member who uses public transit. Similarly, although most travel surveys indicate that only about 5% of trips are made completely by walking, 16-33% of urban trips involve at least one walking link. Most people can expect to rely on alternative modes at some periods during their life, for example when they are too young to drive, if they become economically or physically disabled, or when they live or travel to transit-oriented areas. Improving transportation system diversity provides many benefits ignored by critics (“Evaluating Transportation Diversity,” VTPI, 2005).

Evaluating Criticism of Smart Growth
15
Ignoring Accessibility Benefits Smart Growth tends to increase accessibility, by increasing land use density and mix and improving transportation options, particularly affordable modes such as walking, cycling and public transit (Litman 2007). This can provide substantial savings and benefits, including reductions in the number of vehicles households must own and their annual mileage needed to achieve a given level of accessibility. However, mobility is much easier to measure than accessibility and so is the focus of most transportation system performance indicators, such as average travel speeds, roadway level-of-service, fuel prices and parking supply. The savings and benefits of improved land use accessibility are virtually invisible using these indicators.
Ignoring Diversity Critics claim that Americans (or Canadians, Britons, etc.) want to live in suburbs and drive automobiles, without acknowledging the diversity of preferences. Although some people prefer large-lot homes and driving, others prefer smaller homes and more balanced travel patterns. Many people may be change if given modest incentives, such as improved urban neighborhoods, improved transit service, better walking and cycling conditions, and financial benefits to people who use alternative modes.
Problems Versus Solutions Many objections raised by critics are actually justifications for more comprehensive Smart Growth. For example, critics argue that increased development density increases traffic congestion, which is a justification for implementing additional Smart Growth strategies to improve accessibility and encourage use of non-automobile modes in urban and suburban areas experiencing growth, so this problem can be avoided. Critics often assume that obstacles are unsolvable, rather than challenges to address. For example, critics see poor transit service quality (slow, infrequent, uncomfortable, etc.) as evidence of the inferiority of transit, while Smart Growth advocates see this as justification for transit improvements and incentives to increase ridership and operating efficiency. Similarly, critics see infrastructure and social problems in urban neighborhoods as evidence that development should shift to suburbs, while Smart Growth advocates see this as justification for investing more resources in urban redevelopment. It is not surprising that individuals perceive such problems to be unsolvable, since most consumers can do little to improve transit service or address urban degradation, but Smart Growth public policies can address these problems, and so are justified as solutions.
Outdated References Critics often use selective, biased and outdated evidence. For example, Mills cites a 1985 study to conclude that motor vehicle user fees cover all roadway costs (other studies find that they do not) and Cox claims that there is no evidence that transit reduces traffic congestion, although many studies find such effects (“Transit Evaluation,” VTPI, 2005).
Evaluating Criticism of Smart Growth
16
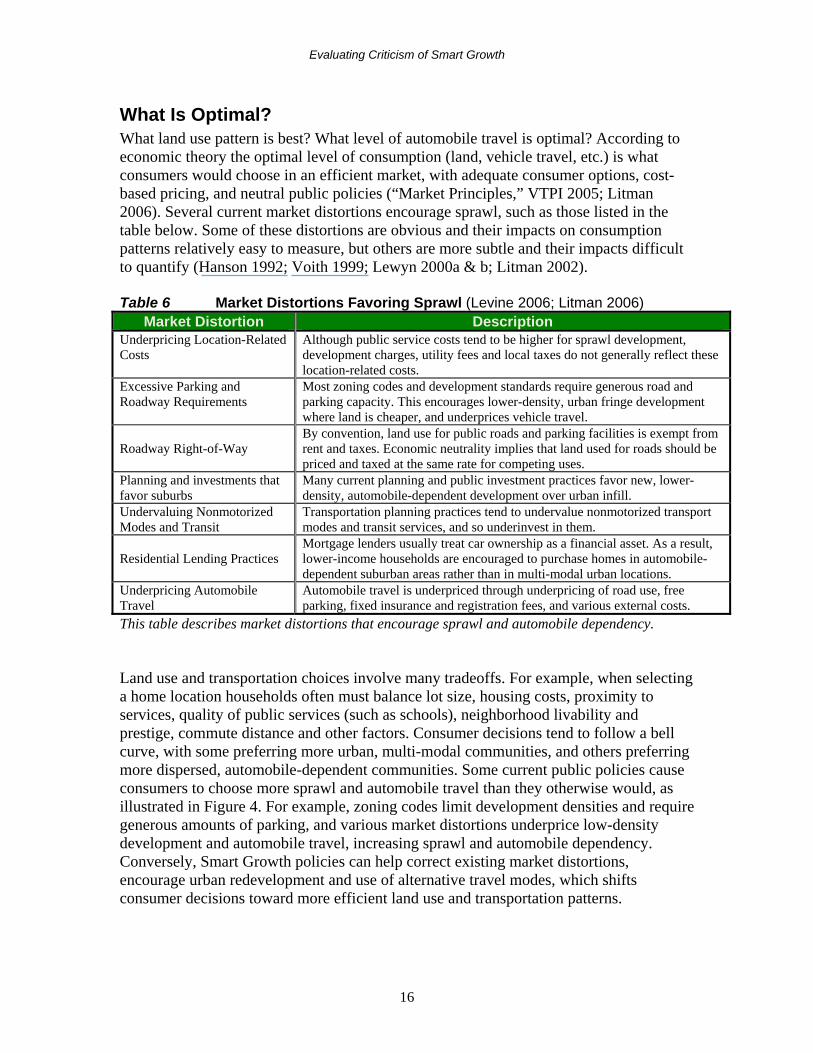
What Is Optimal? What land use pattern is best? What level of automobile travel is optimal? According to economic theory the optimal level of consumption (land, vehicle travel, etc.) is what consumers would choose in an efficient market, with adequate consumer options, cost-based pricing, and neutral public policies (“Market Principles,” VTPI 2005; Litman 2006). Several current market distortions encourage sprawl, such as those listed in the table below. Some of these distortions are obvious and their impacts on consumption patterns relatively easy to measure, but others are more subtle and their impacts difficult to quantify (Hanson 1992; Voith 1999; Lewyn 2000a & b; Litman 2002). Table 6 Market Distortions Favoring Sprawl (Levine 2006; Litman 2006)
Market Distortion Description Underpricing Location-Related Costs
Although public service costs tend to be higher for sprawl development, development charges, utility fees and local taxes do not generally reflect these location-related costs.
Excessive Parking and Roadway Requirements
Most zoning codes and development standards require generous road and parking capacity. This encourages lower-density, urban fringe development where land is cheaper, and underprices vehicle travel.
Roadway Right-of-Way
By convention, land use for public roads and parking facilities is exempt from rent and taxes. Economic neutrality implies that land used for roads should be priced and taxed at the same rate for competing uses.
Planning and investments that favor suburbs
Many current planning and public investment practices favor new, lower-density, automobile-dependent development over urban infill.
Undervaluing Nonmotorized Modes and Transit
Transportation planning practices tend to undervalue nonmotorized transport modes and transit services, and so underinvest in them.
Residential Lending Practices
Mortgage lenders usually treat car ownership as a financial asset. As a result, lower-income households are encouraged to purchase homes in automobile-dependent suburban areas rather than in multi-modal urban locations.
Underpricing Automobile Travel
Automobile travel is underpriced through underpricing of road use, free parking, fixed insurance and registration fees, and various external costs.
This table describes market distortions that encourage sprawl and automobile dependency. Land use and transportation choices involve many tradeoffs. For example, when selecting a home location households often must balance lot size, housing costs, proximity to services, quality of public services (such as schools), neighborhood livability and prestige, commute distance and other factors. Consumer decisions tend to follow a bell curve, with some preferring more urban, multi-modal communities, and others preferring more dispersed, automobile-dependent communities. Some current public policies cause consumers to choose more sprawl and automobile travel than they otherwise would, as illustrated in Figure 4. For example, zoning codes limit development densities and require generous amounts of parking, and various market distortions underprice low-density development and automobile travel, increasing sprawl and automobile dependency. Conversely, Smart Growth policies can help correct existing market distortions, encourage urban redevelopment and use of alternative travel modes, which shifts consumer decisions toward more efficient land use and transportation patterns.

Evaluating Criticism of Smart Growth
17
Figure 4 Current Policies Shift Consumer Decisions
High Rise
Low Rise
Town-house
Duplex Small Lot
MediumLot
LargeLot
Semi-rural
Rural
More Dispersed Land Use ===>
Hou
seho
lds
Neutral PoliciesCurrent Practices
Current land use and transport market distortions encourage consumers to choose more dispersed, automobile-dependent communities than they would in a more neutral market. Smart Growth helps correct these distortions, resulting in more efficient decisions that increase overall consumer benefits. Current land use and transport patterns reflect various economic “traps,” in which individuals have incentives to act in ways that make society worse off overall. For example, many jurisdictions have exclusionary development policies, such as restrictions on secondary suites and multi-family housing, intended to minimize local costs associated with lower-income residents. But such policies simply shift such costs elsewhere, reducing housing affordability, increasing segregation and associated social problems, and increasing transportation costs. Similarly, although total congestion delays would decline if more peak-period travelers shifted from driving to ridesharing and public transit, individuals have little incentive to shift unless there are HOV facilities or congestion pricing. Where such traps exist it is wrong to assume that the resulting land use and transport patterns are economically optimal: they increase sprawl and automobile travel while making society worse off overall. Smart Growth critics argue that sprawl provides benefits (more private space and high levels of mobility) which offset costs. Certainly such benefits exist, but the existence of such benefits does not prove that at the margin (i.e., compared with current conditions) increased sprawl provides greater benefits than Smart Growth. The benefits of sprawl must be evaluated in detail, for example, disaggregating the value of suburban living into those benefits that actually depend on large lots (such as larger gardens and workshops) and social attributes (such as perceived increased neighborhood security and prestige) that can be achieved with less land consumption. Many homebuyers might choose a smaller lot home if it is well designed, and located in a safe and attractive neighborhood. Similarly, many motorists may prefer to drive somewhat less and rely more on alternatives, provided that they are convenient, safe and affordable.

Evaluating Criticism of Smart Growth
18
Smart Growth – Consumer’s Perspective Smart Growth changes public policies to encourage more efficient land use and transportation patterns. Critics often present these in a negative way, focusing on increased regulations and consumer prices, but such changes also provide direct consumer benefits (in addition to direct benefits from improved economic efficiency and environmental quality). For example, critics describe location-based development and utility fees as increased costs to residents (those who choose sprawled locations), but these can also be described as a new opportunity for residents to save money (by choosing more accessible locations). Similarly, critics describe priced parking, higher vehicle fees and Pay-As-You-Drive insurance as costs to consumers, although they allow consumers a new opportunity to save money when they reduce their vehicle ownership and use. Critics assume that current practices are neutral and fair, and so Smart Growth policy changes are harmful and inequitable. But many current practices are distortions that favor sprawl and automobile dependency. Correcting these distortions increases efficiency and equity. Smart Growth reforms reward consumers and businesses that choose more efficient land use and transport patterns, making them better off overall as a result. For example, consider how the following policy changes would affect consumer decisions: Parking Cash Out. Whenever a business offers free or subsidized parking space, consumers can choose to receive the cash equivalent if they use another travel mode. Users pay for parking directly rather than indirectly. Housing and tax costs are lower, and each time a motorist uses a parking space they pay an hourly fee. Vehicle user fees increase by 50-100% to cover all roadway costs and pay for property taxes on land used for roads and parking facilities, while property taxes decline by a third. Vehicle insurance is priced by the mile, so motorists save 5¢ on average each mile they drive less. Residents who choose infill housing save an average of 20% on utility fees and property taxes compared with sprawl locations. Federal and state funds that are now dedicated to highway construction become available for urban redevelopment projects that reduce automobile dependency, and mobility management programs that reduce vehicle traffic problems. Zoning codes are reformed to eliminate minimum parking requirements, building setbacks, density limits and restrictions on multi-family housing, and development policies change to favor high-quality urban infill. Transport planning and management changes improve walking conditions, in recognition that 10% or more of trips involve at least some walking on public facilities. Note that these reforms are revenue neutral. An average consumer who continues with current housing and transport choices pays no more overall, but those who choose less sprawl and reduce their automobile travel would save money – allowing individual consumers to capture the savings that result when they choose more efficient transportation and land use options. As a result, consumers are better off overall. Experience with such incentives indicates these reforms would reduce automobile mileage by a third or more, and over the long run would shift a portion of development from sprawl to Smart Growth (Litman, 2002). Consumers can still choose sprawl and automobile travel, but they would have more and better alternatives and must pay the incremental costs directly. There are many indications that in a more efficient market consumers would choose more accessible locations and drive less, and be better off overall as a result (Lewyn 2000a and 2000b; Litman 2002). For example, the city of Lancaster, California has development impact fees that reflect the infrastructure costs of a particular location, calculated by a

Evaluating Criticism of Smart Growth
19
civil engineering firm. A typical new house located near the city core is charged $5,500, while the same house located one mile beyond the core would be charged $10,800, reflecting the additional costs of providing more dispersed city infrastructure. Since this fee structure was implemented in 1993, no new development has occurred outside the central core. These fees only represent a portion of the total public costs that increase with more dispersed development (costs of school busing and utility maintenance are not included), so even greater land use changes would likely occur if residents could capture even greater savings from Smart Growth. This indicates that given efficient pricing, consumers actually prefer Smart Growth over sprawl. Similarly, when commuters either pay for parking or have a Cash Out option (they can choose cash instead of a parking subsidy), 15-25% typically shift modes, indicating that many motorists prefer travel alternatives if existing market distortions are removed (“Commuter Financial Incentives,” VTPI 2005). Many Smart Growth strategies reflect market principles that increase overall efficiency and fairness (Table 7). Smart Growth critics actually support many of these reforms (Mills 1999; Cox 2000; O’Toole 2001). Some critics claim that an equal set of distortions favor urban development and alternative modes, although the only examples they identify are urban renewal projects, subsidized urban sports facilities and rail transit projects (Gordon and Richardson 2000). Such policies do little to reduce sprawl and automobile dependency (for example, many urban renewal projects ultimately harmed cities, many subsidized sports facilities are located in suburban areas, and Park & Ride rail transit may increase lower density urban fringe development), and their total value is small compared with various policies and subsidies that favor sprawl and automobile travel (Lewyn, 2000b). Although it is difficult to predict exactly how much sprawl and automobile travel would decline if all market-justified reforms were implemented, their total effects are likely to be large, resulting in 30% or greater reductions in per capita vehicle travel (Litman, 2002)

Evaluating Criticism of Smart Growth
20
Table 7 Market Principles Evaluation (“Smart Growth Reforms,” VTPI 2005) Strategy Reflects Market Principles?
Establish comprehensive development plans Yes, if it results in more predictable decision-making and more efficient use of public resources.
Reform zoning codes (remove restrictions on denser development, more flexible parking requirements, etc.)
Yes. Tends to improve consumer choice and remove market distortions.
Support planning and development that reflects Smart Growth principles
Depends on conditions. May be justified to correct past distortions that favor sprawl and automobile dependency.
Tax and utility pricing reforms (lower rates for locations that are cheaper to service)
Yes, to the degree that they improve consumer choice, result in more cost-based pricing, and remove market distortions.
Favor public expenditures that support Smart Growth (fund infrastructure that supports clustered, multi-modal development).
Yes, if it results in more predictable decision-making and more efficient use of public resources.
Growth control and development caps (restrictions on greenfield development)
No, tends to violate market principles, but may be justified as second-best until existing market distortions are corrected.
Encourage urban redevelopment and brownfield rehabilitation (support urban redevelopment and brownfield cleanup projects)
Mixed. May be justified to leverage more efficient use of resources such as urban land and infrastructure.
Encourage greenspace preservation (regulations and tax incentives to preserve farms and wildlife habitat).
Mixed. May be justified to protect valuable resources and correct existing distortions that favor greenfield development.
More neutral transportation planning and funding practices (least-cost transportation planning, more comprehensive evaluation and planning)
Yes. Improves consumer choice and removes existing distortions that favor sprawl and automobile dependency.
Travel reduction programs (employers and local agencies support alternative commute modes)
Mixed. Tends to improve consumer choice and correct existing distortions that favor automobile commuting.
Increased funding for alternative modes (walking, cycling, public transit)
Usually. Tends to improve consumer choice and correct existing distortions that favor automobile travel.
Transport pricing reforms (use-based road and parking pricing, pay-as-you-drive fees, etc.).
Yes, improves consumer choice and creates more efficient pricing.
Property tax reform (split-rate property taxes) Mixed. Depends on assumptions and how it is implemented. Educate professionals and develop better tools to evaluate land use impacts
Yes. Tends to improve decision-making and remove distortions.
Many Smart Growth reforms tend to reflect market principles. Existing market distortions are well established and often difficult to correct. For example, in most communities it will take considerable effort and time to remove restrictions on higher-density development, and implement cost-based development and utility pricing. As a result, blunter reforms may sometimes be appropriate. For example, until pricing reforms are implemented and existing policies that favor sprawl corrected, greenfield development restrictions may be justified on “second best” grounds (they are not ideal but better than doing nothing).

Evaluating Criticism of Smart Growth
21
Smart Growth Criticism Specific issues of Smart Growth criticism are discussed below.
Consumer Preferences (Litman 2009) Critics claim that sprawl reflects consumer preferences, so Smart Growth harms consumers and contradicts market demand. But consumer preferences are diverse and include attributes of both sprawl and Smart Growth. For example, although market surveys indicate that most households want single-family housing, they also indicate that many households value features such as accessibility and transportation diversity (Molinaro 2003). Consumers are therefore best off with the combination of community design features that best meets their individual needs. Table 8 Market Forces and Trends Affecting Development Patterns
Supports Sprawl Supports Smart Growth
• Increased wealth increases demand for mobility, residential space and privacy.
• Increased automobile ownership.
• Major highway investments from 1950-70’s.
• Large portion of households with children during Baby Boom period.
• Population growth concentrated in major metropolitan areas.
• Safer and more livable cities.
• Growing consumer preference for more urban lifestyles.
• Declining portion of households with children.
• Increasing traffic congestion and rising costs to expand road and parking capacity.
• Suburban communities becoming urbanized.
• Increased preference for walking and cycling.
• Growing concern over economic and environmental costs of sprawl.
• Preference for more diverse transportation system. Some market forces and trends support sprawl. Others support Smart Growth. Either intentionally or not, suburbs exclude “undesirable” people, such as those with significant mental and economic problems, since there are often few public services, limited public space, and high housing and transportation costs. This creates a self-fulfilling prophesy: if urban areas become undesirable, people with resources leave, concentrating problems such as drug addiction, crime, poverty, homelessness and begging in urban neighborhoods. Urban public service providers (police, schools, social agencies, etc.) tend to be overwhelmed, so the quality of services declines, continuing this cycle. Critics sometimes cite the various problems concentrated in urban communities as evidence that urban living is harmful, but these problems really reflect the failure of suburban communities to meet the needs of disadvantaged people. In other words, many of the “costs” of urban location are actually economic transfers, social and economic burdens that suburbs impose on cities.
Evaluating Criticism of Smart Growth
22
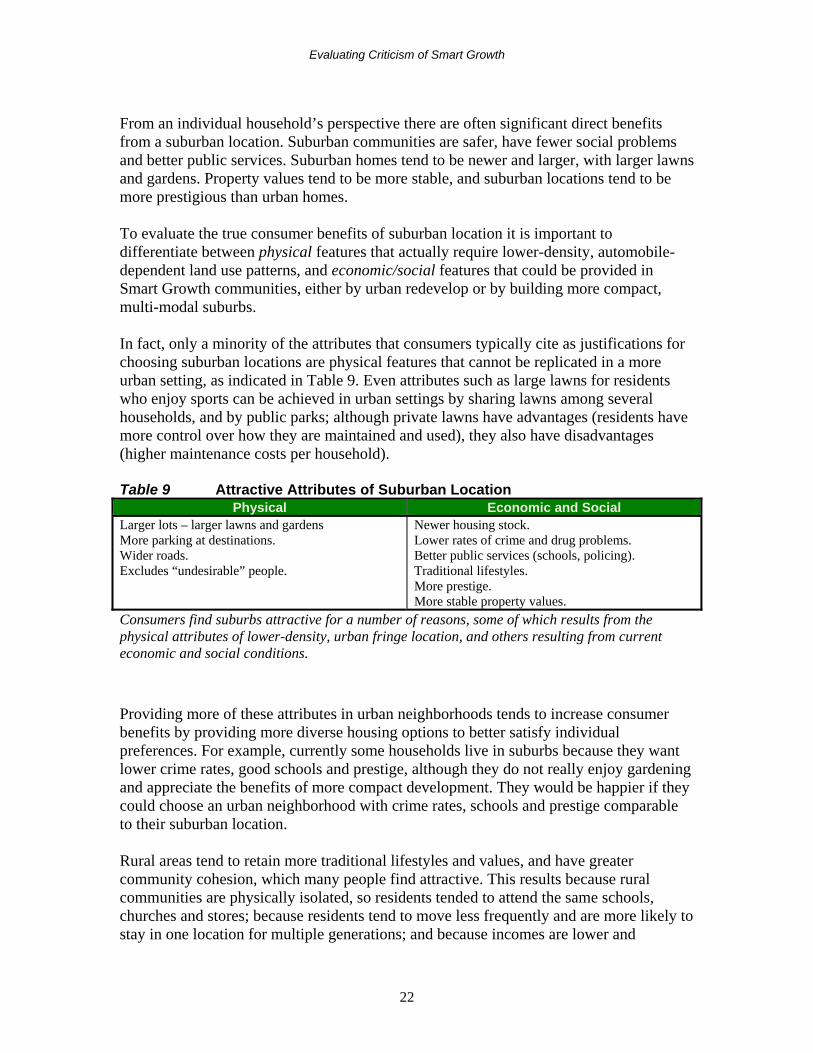
From an individual household’s perspective there are often significant direct benefits from a suburban location. Suburban communities are safer, have fewer social problems and better public services. Suburban homes tend to be newer and larger, with larger lawns and gardens. Property values tend to be more stable, and suburban locations tend to be more prestigious than urban homes. To evaluate the true consumer benefits of suburban location it is important to differentiate between physical features that actually require lower-density, automobile-dependent land use patterns, and economic/social features that could be provided in Smart Growth communities, either by urban redevelop or by building more compact, multi-modal suburbs. In fact, only a minority of the attributes that consumers typically cite as justifications for choosing suburban locations are physical features that cannot be replicated in a more urban setting, as indicated in Table 9. Even attributes such as large lawns for residents who enjoy sports can be achieved in urban settings by sharing lawns among several households, and by public parks; although private lawns have advantages (residents have more control over how they are maintained and used), they also have disadvantages (higher maintenance costs per household). Table 9 Attractive Attributes of Suburban Location
Physical Economic and Social Larger lots – larger lawns and gardens More parking at destinations. Wider roads. Excludes “undesirable” people.
Newer housing stock. Lower rates of crime and drug problems. Better public services (schools, policing). Traditional lifestyles. More prestige. More stable property values.
Consumers find suburbs attractive for a number of reasons, some of which results from the physical attributes of lower-density, urban fringe location, and others resulting from current economic and social conditions.
Providing more of these attributes in urban neighborhoods tends to increase consumer benefits by providing more diverse housing options to better satisfy individual preferences. For example, currently some households live in suburbs because they want lower crime rates, good schools and prestige, although they do not really enjoy gardening and appreciate the benefits of more compact development. They would be happier if they could choose an urban neighborhood with crime rates, schools and prestige comparable to their suburban location. Rural areas tend to retain more traditional lifestyles and values, and have greater community cohesion, which many people find attractive. This results because rural communities are physically isolated, so residents tended to attend the same schools, churches and stores; because residents tend to move less frequently and are more likely to stay in one location for multiple generations; and because incomes are lower and

Evaluating Criticism of Smart Growth
23
households produce more of their own goods (such as gardening) and trade among themselves. However, suburban residents generally lack these habits even when they are located within a traditional rural area; they generally lead modern, mobile, consumerist lifestyles. By increasing community cohesion (opportunities for neighbors to interact in positive ways), Smart Growth can help provide community attributes in urban communities. Of course, some households do want the physical attributes of larger-lot homes, perhaps because they enjoy gardening or have large pets. These households can also benefit from Smart Growth to the degree that it makes more compact development more attractive, shifting some of the potential competition away from the limited supply of larger parcels. There are many indications that with more efficient markets many consumers would choose Smarter Growth communities (Litman 2009). For example, there is considerable demand for housing in older urban neighborhoods that are considered safe and prestigious. New Urbanist communities command a price premium (Eppli and Tu 2000; Smith and Gihring 2005; Song and Knaap 2003; Reconnecting America 2004). Myers and Gearin (2001) conclude that demand for such housing is likely to increase in the future. A market survey found that Calgary households are willing to shift from single-family suburban homes to urban townhouses if they save an average of CA$130 (US$90) per month (Hunt, 2001). This premium is comparable in magnitude to the higher public costs of dispersed development, indicating that many households would choose smarter growth residences if development fees and utility charges reflect location-related costs. As previously described, when the city of Lancaster implemented cost-based development fees, lower-density urban expansion stopped because consumers preferred a Smart Growth location if they can save a few hundred dollars a year in housing costs. Figure 5 50 Largest U.S. Cities Growth Trends (U.S. Census Bureau)
6.30%
9.80%
-1.60%
-4%
-2%
0%
2%
4%
6%
8%
10%
12%
1970s
1980s
1990s
Popu
latio
n C
hang
e
City populations declined during the 1950s through the 1970s, but since then have grown significantly. This indicates that many consumers prefer urban living. City population growth is likely to continue as the portion of households without children increases.

Evaluating Criticism of Smart Growth
24
Consumer preferences appear to be shifting toward more urban living (Hughes and Seneca 2004). Many economic and demographic factors that contributed to sprawl, such as increasing per capita vehicle ownership and the portion of households with children (and therefore preferring housing with large lots) began to decline in the 1990s, increasing the value of Smart Growth features such as accessibility. Although most U.S. cities lost population from the 1950s through the 1970s, this trend has since reversed, as illustrated in Figure 5. During the 1990s, downtown population grew by 10 percent, a resurgence following 20 years of overall decline (Birch, 2005). Downtowns have relatively high rates of young adults, and are home to some of the most and least affluent households of their cities and regions. Popular television and cinema characters such as Sienfield, Friends and Fraser live in urban communities. Many younger adults and retirees consider New Urbanist locations attractive. The potential demand for Smart Growth housing is probably greater than indicated by current consumer surveys because many North Americans have little experience with successful, urban, multi-modal communities, and so under-appreciate the benefits they can provide. Many of the reasons consumers cite for preferring suburban housing reflect social attributes, such as personal security, higher-quality public services (particularly schools) and greater property value security, rather than the physical attributes of sprawl. Smart Growth policies allow consumers to choose urban neighborhoods that have attributes currently only available in suburbs, making consumers better off overall. Similarly, many consumers want alternatives to driving, provided that they are convenient and safe. For the last five years, U.S. transit ridership has grown faster than automobile mileage, as described later in this paper. Many consumers indicate that they would like to walk or bicycle more for transportation. The most popular tourist destination in Texas is the Riverwalk in downtown San Antonio, where visitors stroll and enjoy urban activities. All of this suggests that consumers value having greater transportation diversity, and will use alternative modes more if they are available.

Evaluating Criticism of Smart Growth
25
Consumer Preferences Most people would probably say that they prefer dining at a gourmet restaurant over eating a sandwich, but that does not mean that sandwich shops are harmful to consumers. Consumer benefits are maximized when individuals can make tradeoffs between costs and benefits: although consumers may prefer gourmet food if somebody else pays, they are often better off overall when they can save money by choosing a cheaper option. Similarly, many consumers say they prefer single-family, suburban homes over higher-density homes, and driving over walking and public transit, but this does not prove that consumers benefit overall from policies that favor sprawl and automobile travel. At least some consumers would choose more accessible housing and alternative travel options given better housing and travel options, and more efficient pricing. Many Smart Growth strategies improve consumer options, result in more efficient pricing and remove market distortions that favor sprawl and automobile use. Although these practices may reduce consumption of more “desirable” goods, such as single-family homes and automobile travel, they actually make consumers better off overall, because they allow individuals to make tradeoffs between costs and benefits. Smart Growth critics claim that land development and transportation trends in other countries demonstrate that sprawl is unavoidable without “draconian” restrictions on consumer choice. But trends during periods of rapid economic growth cannot simply be extrapolated, since vehicle ownership and land use dispersion eventually saturate. More detailed analysis shows that although vehicle ownership, vehicle travel and suburbanization tend to increase with wealth, this ultimately stabilizes at a level that depends on various public policy decisions. Residents of some cities own significantly fewer motor vehicles, drive less, rely more on alternative modes and consume less land than what occurs in other communities with comparable wealth and resources. Figure 6 US Household Types
0
1
Wealth --->
Vehi
cle
Ow
ners
hip
Per A
dult
Sprawl Policies
Smart Growth Policies
Difference
Public policies affect the ultimate level of per capita vehicle ownership and vehicle use that occurs in a community as it becomes wealthier.

Evaluating Criticism of Smart Growth
26
Critics sometimes claim that Smart Growth cannot respond to the needs of busy, modern families that must rely on automobile travel to accommodate their busy schedules. This objection is misplaced since many Smart Growth strategies provide time savings. For example, Smart Growth increases accessibility so travel distances are shorter, improves travel options so parents spend less time chauffeuring children, and improves walking and cycling conditions so residents can exercise while commuting or running errands. While it may be true that most households with young children prefer single-family, suburban homes, these only represent about a third of total households (Figure 7), and this portion is declining. A significant portion of most peoples’ lives are conducive to higher-density housing, including as young adults, single adults and during older periods. Smart Growth does not require a major shift from single-family to multi-family housing, rather, it requires clustering the multi-family housing that will be developed, along with small-lot single-family housing and appropriate commercial facilities, into mixed-use urban villages (Moudon and Hess, 2000). Figure 7 US Household Types (2000 Census, www.census.gov)
Shared Home, Not Related
6%
Living Alone26%
Family Without Children Under
18 Years35%
Family With Children Under
18 Years33%
Only about a third of all households at any one time have children under 18 years of age.

Evaluating Criticism of Smart Growth
27
Infringement on Freedom Critics argue that Smart Growth reduces personal freedom, imposes excessive regulation, and constitutes “social engineering.” They portray Smart Growth as oppressive government bureaucrats restricting property owners’ rights. But community life is full of conflicts between different types of freedoms: your freedom to make noise infringes on my freedom to enjoy quiet. Your ability to park for free conflicts with my housing affordability. Such conflicts are particularly intense in growing urban-fringe areas were less-restrictive rural land use policies are replaced by more restrictive urban policies. Not surprisingly, many property owners resent new restrictions and wish for the best of all worlds: minimal regulation of their activities but strong restrictions on their neighbors’. Smart Growth critics often see only one side of this issue. Smart Growth policies may reduce some freedoms but increase others, as summarized in Table 10. For example, Smart Growth can reduce excessive restrictions on housing activity and type (home offices, secondary suites, multi-family housing) and land use mix (commercial activities within residential neighborhoods), and costly parking requirements. Smart Growth increases consumer freedom by improving overall accessibility and affordability. It also increases the range of solutions available to address common conflicts. For example, parking management expands the range of responses to parking conflicts, so property owners are not required to subsidize motorists through excessive parking requirements. Table 10 Smart Growth Impacts on Personal Freedom
Reduces Freedoms Increases Freedoms Restricts urban expansion Reduces traffic speeds Increases parking fees Requires design standards and review
Allows higher density, more infill development. Allows more mixed land use. Increases housing options (small-lots, multi-family). Preserves existing neighborhoods and communities. Allows more flexible parking requirements Reduced parking subsidies. Improved travel options, particularly for non-drivers (walking, cycling, public transit, taxi services).
Smart Growth reduces some types of freedom but increases others. How much regulation is optimal? Regulations tend to reduce some freedom but protect other freedoms and provide other benefits. Private, masterplan developments and neighborhood association covenants often have extremely strict regulations: many specify the types of buildings that can be constructed, the materials and colors that may be used, and how frequently garage sales may be held. Some even prohibit clotheslines. Although some residents may consider them intrusive, regulations that control undesirable activities in existing neighborhoods allow older communities to gain benefits otherwise available only in newer, masterplanned communities.

Evaluating Criticism of Smart Growth
28
Equity Impacts Critics argue that Smart Growth is regressive and unfair to poor and minority people because they claim it prices them out of desirable housing and travel options (single-family homes and automobile transport). They justify subsidies for sprawl and automobile travel on equity grounds. These arguments tend to be incorrect for the following reasons.
• Smart Growth includes many features that directly benefit lower income people, including improved housing and transport options, and financial rewards. For example, location efficient development allows households to save money and choose more accessible locations, parking cash out provides financial benefits to non-drivers, and Carsharing and Pay-As-You-Drive insurance make automobile use more affordable.
• Transportation costs tend to be most regressive in more sprawled communities. While the highest income quintile spends just 13% of income on transportation, the lowest quintile spends 40% (STPP, 2003). McCann (2000) found that households in sprawl regions spend 54% more on transportation than households located in smart growth communities.
• Disadvantaged people tend to benefit significantly from improved land use accessibility, improved walking conditions and improved travel alternatives.
• Many disadvantaged people cannot drive or drive with difficulty due to disability or age and so benefit less from automobile-oriented subsidies than from subsidies that can be used for other modes or to choose more accessible housing locations.
• Subsidizing automobile ownership is a mixed blessing to lower-income people since there are substantial additional costs and risks, including maintenance and repairs, insurance, crash costs, fines and parking fees.
• Land use and transportation alternatives tend to experience economies of scale, so incentives to redevelop urban neighborhoods and increase walking, cycling, ridesharing and public transit can improve the quality of these options.
• Smart Growth that encourages urban redevelopment and improves urban transportation tends to benefit residents of disadvantaged communities.
• Equity impacts of pricing reforms depend on how prices are set and how revenues are used. For example, road pricing can be overall progressive if revenues are used to reduce regressive taxes or support programs that benefit lower-income people.
• Smart Growth programs can be designed with features that address equity concerns. For example, land use development policies can encourage development of more affordable housing and mixed neighborhoods, and road or parking pricing can include special exemptions, discounts or subsidies for disadvantaged populations.
• Many lower-income people value indirect benefits of Smart Growth, such as reduced crash risk, community cohesion and environmental quality.
This is not to say every Smart Growth strategy benefits every lower-income person, but when all impacts are considered, Smart Growth can provide benefits that are overall progressive, and Smart Growth programs can be designed to support equity objectives (Arigoni 2003).

Evaluating Criticism of Smart Growth
29
Failed Policies Critics sometimes cite a particular underachieving project or program as evidence that Smart Growth has been tried and failed. But there are many Smart Growth successes, both when strategies are evaluated individually and when Smart Growth and sprawl communities are compared (Ewing, Pendall and Chen 2002; “Success Stories,” VTPI 2005; CNU; Smart Growth Network; NAHB, various years). As with any innovation, Smart Growth has had its share of problems, but for every project considered a failure there are others that meet or exceed expectations. As planners become more familiar with Smart Growth, success rates should increase and unintended consequences decline. Some people conclude that Smart Growth is justified but futile because of social traps that motivate residents to oppose change, even if society benefits overall (Downs 2003). Rather than being a criticism, this is a challenge to develop innovative policies that provide suitable options and incentives to address such obstacles and gain acceptance among residents (“Smart Growth Reforms,” VTPI 2005). New Urbanist Residents “Walk the Walk” (www.lclark.edu/~podobnik/orenco02.pdf) Portland’s Orenco Station shows evidence of high suburban transit use, other “smart growth” goals; gets high marks from residents for livability. HILLSBORO, OR - Will Americans be happy in walkable, transit-oriented communities as an alternative to suburban sprawl? A new study by Dr. Bruce Podobnik, a sociology professor at Lewis and Clark College in Portland, Ore., suggests the answer is yes. Dr. Podobnik studied the residents of Orenco Station, a New Urbanist community on Portland’s Westside MAX light rail line. Residents were asked a variety of questions about life in the community, some five years after its founding. Ninety-four percent said that they now find the Orenco Station superior to typical suburban communities, even though its homes cost up to 30% more than comparable homes. 90% reported being very pleased with the design of the community. Residents were asked to name up to three things they liked and didn’t like about the community. Residents said they liked the overall design (13%), greenspaces and parks (12%), Town Center (10%), garages on alleys (9%), pedestrian-friendly streets (6%), and access to light rail (5%). Features residents didn’t like included none (20%), dog problems (11%), and traffic problems outside Orenco (8%). As for transit use, 22% of the residents reported using light rail or the bus to commute to work or school far higher than the 5% average for the region. Sixty-nine percent of Orenco Station residents reported that they use public transit more often than they did in their previous community. G.B. Arrington, a public transit expert with Parsons Brinckerhoff, is quick to point out that these numbers are totally off the charts for conventional suburban development. Orenco Stations tree-lined streets and public spaces also seem to facilitate social interaction among neighbors. Seventy-eight percent of residents state that there is a higher sense of community than in their previous neighborhood, and 40% reported participating in neighborhood activities. Concludes Podobnik, this study clearly demonstrates that New Urbanist designs can play an important role in improving the quality of life and sustainability of neighborhoods in Portland and elsewhere It stands as a promising beacon for advocates of dense rather than sprawling urban landscapes.

Evaluating Criticism of Smart Growth
30
Traffic Congestion and Air Pollution Impacts Critics cite a positive relationship between density, congestion and average commute time (www.demographia.com/db-intljtwdens.htm), but as discussed earlier, city size, population density, congestion, commute distance and commute travel time all tend to increase together, so this relationship is unsurprising and is not proof that Smart Growth increases travel times compared with what would occur with sprawl (Litman 2006b). Critics claim that by increasing density, Smart Growth increases traffic congestion and air pollution (Cox 2003a). This might be a legitimate criticism if Smart Growth consisted only of increased density, and if automobile travel speed was the only factor affecting accessibility. But Smart Growth includes a variety of strategies that reduce vehicle mileage and improve overall accessibility that can offset traffic density impacts, including improved walkability and transit services, cash out free parking, provide school and employee transport management programs, implement congestion pricing, and in other ways encourage people to reduce peak-period motor vehicle trips (USEPA 2004). Figure 8 Traffic Volume By Density (Cox, 2003a)
This figure illustrates Cox’s estimate of the relationship between density and vehicle miles per square mile. This ignores other Smart Growth features that reduce per capita trip generation and improve accessibility by clustering activities and improving the quality of other transport modes. As a result, residents of Smart Growth communities experience less per capita congestion delay.
Although density may increase congestion intensity (greater reductions in peak period speeds), sprawl tends to increase per capita delay because residents drive more miles and have fewer travel alternatives (“Congestion Costs,” Litman 2008). For example, it is generally faster to perform several errands in a downtown than to perform the same errands along several miles of a commercial strip where a car trip is required between each activity. Clustered development may reduce peak-period vehicle speeds but allows more activities to be accomplished with less travel. As a result, clustering and density increase overall accessibility, people’s ability to reach goods, services and activities. How congestion is measured has a major effect on how land use is considered to affect congestion (“Congestion Costs,” Litman 2009). When measured by roadway level-of-service, portion of peak-period roadways congested or delay per peak-period motorist, Smart Growth may seem to increase congestion, but when measured based on annual per capita delay, it tends to reduce congestion because this accounts for the reduction in per capita peak-period automobile travel. Cities with large, well-established rail transit systems tend to have far less per capita congestion costs for their size (Litman 2004a).

Evaluating Criticism of Smart Growth
31
For example, critics claim that Portland, Oregon’s Smart Growth policies increase traffic congestion. Table 11 shows Portland’s rating by various congestion indicators, some of which rank Portland relatively high (i.e., a low value), while others rank it average for its class (since it is the 25th largest city in the U.S. Portland would be expected to rank about 25th in congestion impacts, all else being equal). Critics only cite the high-ranking indicators, which reflect the intensity of congestion, but ignore lower-ranking indicators, which reflect per capita impacts and therefore accessibility (i.e., people’s overall ability to reach destinations), which show Portland an average in its class. Table 11 Portland Congestion Rating (TTI 2002)
Indicator Portland Ranking Atlanta Ranking City Size 25th 11th Travel time index 11th 17th Percent peak-period travel in congestion 8th 4th Percent lane-miles in congestion 15th 3rd Annual hours of delay 25th 9th Annual delay per capita 21st 8th Excess fuel consumption 25th 8th Annual congestion costs per road user 23rd 9th Congestion cost per capita 22nd 8th This table shows how Portland and Atlanta rank by various congestion indicators. Portland ranks relatively high (bad) according to indicators that reflect congestion intensity, but relatively low according to per-capita impacts because of less per capita vehicle travel. On the other hand, the more sprawled city of Atlanta rates relatively well by traffic intensity indicators but poorly by per capita congestion delays and costs (it ranks 8th in both), indicating unusually bad congestion for its size. This indicates that congestion is more intense in Portland than in Atlanta but Portland residents spend less time delayed by congestion and bear lower congestion costs because they drive fewer peak-period miles and use alternative modes more frequently. U.S. Census data (McGuckin and Srinivasan, 2003) show similar patterns. Automobile commute travel times are lowest in communities with moderate to high densities (11-16 residents per acre), while transit commute times decrease with density (Levinson and Kumar 1997). Residents of sprawled areas such as San Bernardino County tend to experience more per capita congestion delay than residents of cities such as New York and Chicago (STPP 1999). Ewing, Pendall and Chen (2002) find that average commute times are the same for the most sprawled and least sprawled cities. Critics are wrong to claim that Smart Growth increases air pollution or that highway widening reduces emissions. Such claims confuse per-acre, per-mile, per-trip and total emission rates. Although density may increase emissions per acre, most vehicle air pollutants are harmful regardless of where within a region they are released, and so total regional emissions must be reduced to improve air quality. To the degree that Smart Growth reduces per capita vehicle trips and mileage it reduces total emissions (Ewing et al. 2007; TRB 2009). Critics claim incorrectly that highway widening reduces vehicle

Evaluating Criticism of Smart Growth
32
emissions by reducing congestion. Although extreme congestion increases per-mile emissions, a moderate degree of congestion (i.e., from LOS B or C) can reduce per-mile emissions by reducing traffic to a more efficient speed. Highway widening induces additional vehicle travel which increases emissions. Roadway capacity expansion may reduce emissions in the short term, but these tend to be offset over the long-run due to induced travel (TRB, 1995; Stathopoulos and Noland 2003). The evidence presented by critics is actually a justification for implementing more Smart Growth features in growing urban and suburban areas to reduce traffic congestion and air pollution problems that would otherwise occur by improving land use accessibility and travel options, increasing roadway connectivity, and in other ways increasing transportation system efficiency. Public Security Some critics (O’Toole in particular) claim that Smart Growth increases crime by expanding the public realm and increasing roadway connectivity, which they claim violates the principle of “Crime Prevention Through Environmental Design,” (CPTED), that controlled spaces are safer. But CPTED also emphasizes natural surveillance (“eyes on the street”), minimizing isolation, and maximizing community interactions and therefore community cohesion (positive interactions among people in a community), all of which Smart Growth supports (“Address Security Concerns,” VTPI 2005). Critics exaggerate the negative features and never mention these positive features of smart growth. Researchers Hillier and Sahbaz (2006) find that smart growth design features such as compact development and connected streets tend to increase natural surveillance and community interactions, and so reduce crime. By increasing community cohesion and social mixing (as opposed to concentrating low income and minority populations in certain neighborhoods separated from employment opportunities), smart growth can reduce total crime, rather than just shifting criminal activity from one location to another. It would be more accurate to say that Smart Growth should incorporate CPTED design features to maximize its public security benefits. Geographic analysis of crime patterns indicates that areas with more integrated street system and more pedestrian traffic tend to have lower crime risk provided that there is adequate surveillance and visibility. When all types of violence are considered, urban residents tend to be much safer than suburban residents, because any increase in crime risk in cities is more than offset by increased risks from traffic accidents in suburban areas (Lucy 2002). O’Toole also claims that traffic calming is dangerous because reduced traffic risk is offset by slower emergency response. But there is plenty of evidence that traffic calming significantly increases safety, and any emergency response delays are minimal since traffic calming is not applied on emergency routes (“Traffic Calming,” VTPI 2005). Overall, urban locations have far faster emergency response times than suburban and exurban locations (Sorensen and Esseks 1998).

Evaluating Criticism of Smart Growth
33
Density And Social Problems Urban density is associated with social problems such as poverty, crime and conflict, but to evaluate this impact it is important to distinguish between density (people per acre) and crowding (people per room). For example, expensive high-rise condominiums have density but not crowding, while homes in impoverished rural communities have crowding but not density. Poverty and social problems are associated with poverty and crowding, but not with density (Newman and Kenworthy 1999, p. 133). The U.S. Census (www.census.gov/hhes/www/housing/census/historic/crowding.html) measures rates of crowding (housing units with more than one person per room) and severe crowding (housing units with more than 1.5 persons per room). Crowing rates tend to increase with poverty and housing inaffordability, but not population density. States with high crowing rates include Alaska, Arizona, California, Hawaii and Texas. There is no evidence that increasing development density itself increases social problems (1000 Friends 1999a). As mentioned earlier, many urban problems reflect economic traps, that is, situations in which individuals have incentives to act in ways that are overall harmful to society. For example, suburbs tend to exclude disadvantaged people, by prohibiting multi-family housing, and by creating automobile-dependent transportation systems, which concentrates poverty and social problems in urban neighborhoods. According to Glaeser and Sacerdote (1999), about half of all urban crime is explained by the concentration of poverty in cities. Smart Growth that brings wealthier residents to urban neighborhoods and increases accessibility and economic opportunity for lower-income residents, should reduce urban murder rates, providing overall benefits to society. There is no physical reason that urban neighborhoods cannot be as safe and prosperous as suburbs. Smart Growth includes strategies that address such problems directly (such as programs to improve security and public service quality in urban neighborhoods), and it can reduce social problems overall by increasing social interactions and economic opportunities for disadvantaged urban residents. Increased density and clustering, and the increased accessibility that results, can provide a variety of economic and social benefits, called agglomeration benefits. Activities that involve interaction among numerous people, such as education, finance and creative industries, are particularly affected by agglomeration. Although these benefits are difficult to measure, they appear to be large (Anas, Arnott and Small 1997). One published study found that doubling a county-level density index is associated with a 6% increase in state-level productivity (Haughwout 2000). Overall, sprawl tends to increase traffic deaths and health problems associated with sedentary lifestyles. All told, residents of denser city neighborhoods are safer, even taking into account other risks that increase with urban living, such as pedestrian traffic injuries and homicide (Durning 1996; Lucy 2002; Lucy and Phillips 2006). Smart Growth can create development patterns that offer the best of all worlds: improved accessibility, cost savings, security, quality public services, durable property values and increased economic productivity.

Evaluating Criticism of Smart Growth
34
Economic Development Critics sometimes assume that since motor vehicle travel tends to increase with income, sprawl contributes to economic growth and Smart Growth must be economically harmful, but this confuses cause and effect (“Economic Development,” VTPI, 2005). Many countries experience their greatest economic growth when per capita automobile use is relatively low, and economic growth rates decline as households become wealthy enough to afford more consumer goods such as private cars. Regions with balanced transport systems appear to be most economically productive. Cities that are considered “most drivable” have relatively low incomes, as indicated in Figure 9. Figure 9 Annual Per Capita Income
$0
$10,000
$20,000
$30,000
$40,000
$50,000
$60,000
$70,000
Corpus
Chri
sti, T
X
Browns
ville-
Harling
en, T
X
Beaum
ont-P
ort A
rthur,
TX
Pensa
cola,
FL
Fort M
yers-
Cape C
oral, F
L
Oklaho
ma City
, OK
Birming
ham, A
L
El Pas
o, TX
Memph
is, TN
Tulsa,
OK
Most D
rivab
le Ave
rage
Los A
ngele
s-Lon
g Bea
ch, C
A
San Fran
cisco
, CA
Denve
r, CO
Boston
, MA
Oaklan
d, CA
Detroit
, MI
New Y
ork, N
Y
Seattle
-Bell
evue
-Eve
rett, W
A
Was
hingto
n, DC
Leas
e Driv
able
Averag
eAve
rage
Ann
ual P
er C
apita
Inco
me
AveragesLease DrivableMost Drivable
This shows US cities rated most and least drivable based on road surface quality, traffic flow, gas prices and climate, by “Sperling’s BestPlaces” (www.bestplaces.net/drive/drive_study1.asp). The most drivable cities have average incomes far lower than the least drivable cities. (Average Annual Per Capita Income, from www.bea.gov.) Under some circumstances, highway investments can reduce transportation costs and increase productivity, but only if other conditions are ripe and vehicle transport costs are a significant economic constraint. Building the first highway to a region can significantly increase economic activity, but once a region has a basic paved road system, additional roadway capacity provides declining benefits (SACTRA 1999). Smart Growth can provide cost savings and economic development benefits, including road and parking facility cost savings, vehicle and fuel cost savings, and support for various industries including tourism and agriculture (Muro and Puentes 2004). By reducing transportation and infrastructure costs, increases productivity, shifts expenditures to more locally-produced goods and redeveloping activity centers it tends to increase local employment, productivity, property values and tax revenues, providing a high return on public investments (IEDC, 2006).

Evaluating Criticism of Smart Growth
35
Housing Affordability (Litman 2008b) Critics claim that Smart Growth reduces housing affordability by reducing urban land supply (QuantEcon 2002; Cox 2003b). However, land supply is just one of many factors affecting affordability. Smart Growth can increase affordability by allowing smaller lots, making underutilized urban buildings and land available for redevelopment, allowing subdivision of existing parcels, allowing more diverse housing types (smaller lots, secondary suites, lofts, etc.), reducing parking requirements, reducing development costs, and providing financial discounts for infill development (Jia and Wachs 1998; Litman 1998; Arigoni 2001; Goldberg 2003; 1000 Friends 2005b). It also provides transportation cost savings that offset housing costs (McCann 2000; CTOD and CNT 2006; Leinberger 2008). More Smart Growth strategies reduce rather than increase household costs, as illustrated in Table 12. This suggests that Smart Growth can increase overall affordability, or at least cannot be blamed for reduced housing affordability. Table 12 Smart Growth Household Affordability Impacts
Reduces Affordability Increases Affordability
• Urban growth boundaries (reduces developable land supply).
• Increases building design requirements (curbs, sidewalks, sound barriers, etc.).
• Higher density development (reduces land requirements, increases land supply for housing.)
• Reduces parking and setback requirements (reduces land requirements per housing unit).
• More diverse, affordable housing options (secondary suites, apartments over shops, loft apartments).
• Reduces fees and taxes for clustered and infill housing (if Smart Growth includes pricing reforms).
• More accessible housing reduces transport costs. Many Smart Growth strategies can increase housing affordability. To illustrate Smart Growth impacts on land requirements, compare the five types of housing summarized in Table 13. All have the same interior space and deck size, but the City Lot uses just 23% of the land used by the Large Lot house due to its smaller footprint, shorter driveway, less parking and smaller lawn. Table 13 Comparing Land Requirements for Five Housing Types
Type Large Lot (1 acre)
Medium Lot (1/2 acre)
City Lot (100’ x 100’)
Small Lot (50’ x 100’)
Multi-Family
Type Single-story Single-story Two-story Two-story Four-storyInterior space (sq. ft.) 2,000 2,000 2,000 2,000 2,000Porch/Deck footprint (sq. ft.) 400 400 400 200 100House footprint (sq. ft.) 2,200 2,200 1,200 1,000 500Driveway footprint (sq. ft.) 500 400 160 120 50Parking footprint (sq. ft.) 900 600 600 300 150Total Footprint (sq. ft.) 4,000 3,600 2,360 1,620 700Lawn/Openspace 39,560 18,180 7,640 3,380 122Total Land Per Unit 43,560 21,780 10,000 5,000 822Land requirements vary significantly for different housing types.

Evaluating Criticism of Smart Growth
36
Smart Growth tends to be implemented when communities experience rapid population and economic growth, and so they also tend to experience rising housing prices. But this does not mean that Smart Growth causes such price increases. Many homebuyers prefer Smart Growth communities, which may raise prices in such areas, but the best response is to build more Smart Growth communities to meet this demand and reduce prices. Several studies have investigated Smart Growth impacts on housing affordability. Results depend on which areas are studied and the analysis methods used, and indicate that when all factors are considered, Smart Growth does not reduce housing affordability (Nelson 2000; Nelson et al. 2002; Fregonese and Peterson 2003; Wassmer and Baass 2005). Critics cite housing cost trends in Portland, Oregon during the 1990s as evidence that Smart Growth reduces housing affordability. But Portland began this time period with relatively low housing prices and experienced a major economic boom and population growth. Not surprisingly, housing prices increased significantly. In 1992 Portland ranked 112th in housing inaffordability, in 1997 it ranked 2nd, and in 2001 it ranked 23rd, with housing costs currently average among Western U.S. cities, and lower prices than San Francisco, San Diego, Seattle or Salt Lake City. A detailed study comparing housing and transportation costs in a typical Midwest urban area (CTOD and CNT 2006), found that although average household expenditures on housing are similar in different geographic locations, transportation expenditures are much higher in outer suburbs and exurban areas than in inner suburbs and cities, as illustrated in Figure 10. According to this study, transportation costs average 19% of household expenditures overall, but range from about 10% in multi-modal communities up to about 25% in automobile dependent communities. To the degree that Smart Growth reduces household transportation costs it can increase overall affordability and offsets any increased housing costs. Figure 10 Affordability Index (CTOD and CNT 2006)
$0
$200
$400
$600
$800
$1,000
$1,200
$1,400
$1,600
$1,800
$2,000
Exurban Outer Suburb Inner Suburb Urban RegionalAverage
Ann
ual E
xpen
ditu
res
HousingTransport
Transportation expenditures are much higher in outer suburbs and exurban areas than in inner suburbs and cities, reducing overall affordability.

Evaluating Criticism of Smart Growth
37
Miller, et al. (2004) compared housing and transportation costs for residents of various locations in the Toronto region. They found that suburban location tends to cost more overall than city locations. The study estimates that a family with one car living 50 kilometres outside Toronto spent $1,600 more a year on travel. For households with two vehicles — the norm for most suburban families — spends about $5,800 more, than city residents. A suburban house also costs about $1,100 a year more in mortgage, property taxes, utilities and maintenance to run than a similarly valued home downtown. Some specific strategies can help ensure that Smart Growth increases housing affordability and provides other consumer cost savings (SPUR, 1998; Arigoni, 2001; Russo 2001). These include reforms to allow higher density, more diverse housing types, more flexible parking requirements, price reforms that provide savings for infill development, location efficient development, and improvements to affordable transport options. True Housing Affordability – by Jim Lazar It is the sum of mortgage payments, maintenance costs, transportation costs, health care costs and child care costs that determines affordability, not just purchase price. An affordable home is one that:
1. Is located close to transit, shopping, schools and employment, so households can reduce their transport costs. This can save $2,000 - $5,000 per year.
2. Is energy efficient. This may cost more up front, but can save $500 - $1000 per year.
3. Is built with quality materials. This reduces maintenance and replacement costs.
4. Is built with non-toxic materials. This may cost a bit extra up front, but will prevent respiratory illnesses and associated costs.
5. Is surrounded by neighbors who you know and share. For example, trading child-care can save $500 - $1,000 per year during early childhood years.

Evaluating Criticism of Smart Growth
38
Cost of Living As mentioned earlier, Smart Growth tends to reduce consumer transportation costs (McCann 2000; STPP 2003; Dunphy, 2003; Litman 2008b). Critics claim that such savings are small and offset by higher housing and food costs. To demonstrate this, Cox groups U.S. cities into four categories based on population density and finds that total transport, housing and food costs are higher in the denser cities, as indicated in Table 14. Table 14 Household Expenditures by Density (www.demographia.com/db-ce2000.htm)
Number Density Transport Housing Food Total Relative to Sprawl Least Sprawl 2 4,500 & Over $8,714 $13,886 $6,466 $29,066 30% Less Sprawl 5 3,500-4,499 $7,816 $12,042 $5,718 $25,576 15% More Sprawl 12 2,500-3,499 $8,036 $11,217 $5,673 $24,926 12% Most Sprawl 7 1,500-2,499 $7,433 $9,711 $5,190 $22,334 0% According to this analysis, Smart Growth increases household costs. The least sprawled cities have 30% higher combined transport, housing and food costs than the most sprawled cities. This analysis contains two major errors. First, incomes tend to increase with city size and density, so much of the increase in household expenditures in higher density cities is explained by increased wealth. The results of Cox’s analysis change significantly if the analysis is based on portion of income rather than total dollars. Second, as discussed earlier, gross population density is an inaccurate indicator of sprawl and Smart Growth. Using the Sprawl Index developed by Ewing, Pendall and Chen (2003), residents of the Smart Growth cities are actually shown to devote 6% less to combined transport, housing and food than residents of the most sprawled cities, as indicated in Table 15. Table 15 Percent Income Devoted to Transport, Housing and Food (Analysis Spreadsheet Available From The Author On Request)
By Density By Sprawl Index Percent Income Relative to Sprawl Percent Income Relative to Sprawl
Least Sprawl 78% +16% 68% -6% Less Sprawl 76% +13% 73% +1% More Sprawl 73% +9% 73% +1% Most Sprawl 67% 0% 72% 0% Residents of Smart Growth cities actually spend a smaller portion of income on combined transport, housing and food than residents of sprawled cities. O’Toole (2003) argues that Smart Growth reduces consumer affordability by eliminating the economies of scale from bulk retailing along commercial strip development. Although Smart Growth may reduce strip development it need not eliminate these consumer benefits. Many bulk retailers are successful in urban locations, and as discussed earlier, Smart Growth does not eliminate automobile travel. To the degree that bulk retailers provide sufficient efficiency gains (lower prices and increased convenience), they can attract customers and provide consumer benefits in Smart Growth communities.

Evaluating Criticism of Smart Growth
39
Smart Growth Forces People To Give Up Single-Family Homes and Driving Critics claim that Smart Growth forces people to give up single-family homes and private vehicle travel, and therefore makes consumers worse off (Orski 2003). This is untrue (Litman 2009). Smart Growth mostly applies positive incentives that directly benefit consumers, as discussed in a previous section on consumer preferences. Relatively small changes can provide large benefits. In the example illustrated in Table 16, residential land consumption is reduced by half if the majority of households shift from large and medium size lots to city and small lots. In this example, only 15% of households shift from single-family to multi-family housing, resulting in three quarters of households in the Smart Growth option living in single-family homes. Multi-family consists primarily of duplexes, townhouses and low-rise condominiums and apartments, it does not require large numbers of high-rise units. Table 16 Housing Mix Impacts On Land Consumption
Large Lot (1 acre)
Medium Lot (1/2 acre)
City Lot (100’ x 100’)
Small Lot(50’ x 100’)
Multi-Family
Totals Single Family
Homes Per Acre 1 2 4.4 8.7 20 Sprawl Percent 30% 25% 25% 10% 10% 100% 90%Number 300,000 250,000 250,000 150,000 100,000 1,000,000Total Land Use (acres) 300,000 125,000 57,392 11,494 5,000 451,497Standard Percent 20% 20% 20% 20% 20% 100% 80%Number 200,000 200,000 200,000 200,000 200,000 1,000,000Total Land Use (acres) 200,000 100,000 45,914 22,989 10,000 378,902 Smart Growth Percent 10% 10% 20% 35% 25% 100% 75%Number 100,000 100,000 200,000 350,000 250,000 1,000,000 Total Land Use (acres) 100,000 50,000 45,914 40,230 12,500 248,644 Even modest shifts from larger to smaller lots can significantly reduce land consumption. With the Smart Growth option, 3/4 of households continue to have single-family homes, yet land requirements are reduced by half compared with sprawl. To the degree that Smart Growth uses positive incentives to shift households with marginal preferences to choose more urban locations, it reduces demand for lower-density, suburban housing, reducing their costs for people who truly prefer such locations. For example, if you enjoy gardening, you benefit if compact housing options become attractive, so there is less competition for large-lot housing by people who would otherwise choose it simply for social attributes such as status and neighborhood security. Similarly, most TDM programs involve strategies that provide direct positive benefits to users, and relatively small shifts from driving to alternative modes under urban-peak conditions can provide significant benefits. Those travelers who truly need or prefer to drive are better off if other peak-period travelers shift mode, therefore leaving more road and parking space.

Evaluating Criticism of Smart Growth
40
Public Service Costs Smart Growth can reduce development and public service costs by reducing the length of roads and utility lines, parking requirements, and travel costs to provide public services such as garbage, policing and school access (“Land Use Evaluation,” VTPI, 2005). More than a dozen studies, many by leading research organizations, indicate that Smart Growth can provide such savings (Frank 1989; Burchell, et al. 1998; Blais 1995; Muro and Puentes 2004; Litman 2004b; Burchell, et al. 2005). Critics claim that Smart Growth increases public service costs (Gordon and Richardson 1999; Cox 2003). They cite research by Ladd (1992) showing that per capita public service expenditures increase in higher-density counties. Similarly, Cox and Utt (2004) found that per capita local government expenditures do not always decline with population density, that density explains only 30% of observed differences in such expenditures, and that any savings are insignificant. But these studies fail to prove what critics claim because (see more detailed discussion in Litman 2004b):
• These studies ignore other indicators of sprawl besides density.
• Smart Growth affects density and design at a finer geographic scale than Ladd or Cox & Utt analyzed. City, county- and state-level analysis indicates little about Smart Growth impacts. Neighborhood- and site-level analyses are needed.
• These studies only consider government expenditures. Total per capita expenditures are higher in lower-density areas because residents provide more of their own water, sewage and garbage services privately (SC 1999).
• Higher government expenditures in denser, more urbanized areas are partly explained by higher wages (so urban-rural differences are smaller when measured as a portion of income) and higher quality services (more public parks, libraries, etc. in urbanized areas).
• Cities incur additional costs because they contain a disproportionate share of residents with special needs that impose additional public service costs. In 1990, large U.S. cities comprised 12% of the nation’s population but 17% of its poor, and as a result spent an average of $364 per capita on health, hospitals, and public welfare, or 30% of local tax revenues, while smaller cities and suburbs spent only $40 per capita on those poverty-related categories, or 9% of local taxes (Gyourko and Summers 1997).
Smart Growth sometimes increases short-term costs but reduces long-term costs. For example, it may add costs for cleaning up brownfields and installing new infrastructure within urban areas, but provides transportation cost savings and reduces future public service and utility maintenance costs because activities are less dispersed. Smart Growth can impose some additional development costs, including special design requirements (such as additional pedestrian and structured parking facilities, and aesthetic features), higher costs for retrofitting infrastructure in high-density developed areas, and additional costs that may be needed to improve public services in urban neighborhoods in order to attract middle-class residents (Ewing 1997). As a result, actual cost savings will vary depending on the particular situation.

Evaluating Criticism of Smart Growth
41
Health Impacts Transportation and land use patterns impact human safety, health and fitness ( “Health and Fitness,” VTPI 2005; Litman 2003b; AJPH 2003, AJHP 2003; Frank, Kavage and Litman 2006). Ewing, Schieber and Zegeer (2003) find higher per capita traffic deaths in sprawled communities (Figure 11). They estimate that each one percent increase in their sprawl/Smart Growth index reduces the area’s traffic fatality rate by 1.5%. Ewing, Pendall and Chen (2003) find that sprawl communities have about 50% higher maximum ozone levels. Durning (1996) and Lucy (2002) found that the higher crash rates of sprawled communities overwhelm other personal risks, making urban locations safer that sprawled suburbs. Frumkin, Frank and Jackson (2004) identify several health problems that sprawl tends to exacerbate. Figure 11 Annual Traffic Death Rate (Ewing, Schieber and Zegeer 2003)
0
5
10
15
20
25
30
35
40
New York
Cou
nty, N
Y
Kings C
ounty
, NY
Bronx C
ounty
, NY
Queen
s Cou
nty, N
Y
San Fran
cisco
Cou
nty, C
A
Hudso
n Cou
nty, N
J
Philad
elphia
Cou
nty, P
A
Suffolk
Cou
nty, M
A
Richmon
d Cou
nty, N
Y
Baltim
ore ci
ty, M
D
Stokes
Cou
nty, N
C
Miami C
ounty
, KS
Davie
County
, NC
Isanti
Cou
nty, M
N
Walton
Cou
nty, G
A
Yadkin
Cou
nty, N
C
Gooch
land C
ounty
, VA
Fulton
Cou
nty, O
H
Clinton
Cou
nty, M
I
Geaug
a Cou
nty, O
H
Ann
ual T
raffi
c D
eath
s Pe
r 100
,000
Pop
ulat
ion
Most SprawledSmartest Growth
The ten U.S. communities ranked least sprawled have much lower annual traffic fatality rates than the ten communities that are ranked most sprawled. Critics claim that smart growth provides no health benefits (Schwartz 2002; Utt 2003). However, numerous studies also show higher rates of active transportation (walking and cycling) and improved health outcomes in Smart Growth communities (APA 2003; AJPH 2003; AJHP 2003; Killingsworth, De Nazelle and Bell 2003; Ewing, et al. 2003; Bell and Cohen 2009). Cox (2003c) and Utt (2003) dismiss research by Ewing, et al. (2003) showing that sprawl is associated with obesity by arguing that the association between sprawl and excessive weight is insignificant and spurious. Their arguments miss several important points:
• Weight differences are only one indicator of health risk. A much more important factor is the effects of sedentary lifestyle, that is, a lack of regular physical activity.

Evaluating Criticism of Smart Growth
42
• Other studies show that residents of Smart Growth communities (i.e., areas with more clustered land use, multi-modal transportation systems and walkable neighborhoods) tend to walk and cycle more than residents of sprawled areas, even when demographic and income are taken into account. For example, the 1995 National Personal Transportation Survey indicates that urban residents average 0.59 walking/cycling trips per day as opposed to 0.21 made by suburban residents. Figure 12 also indicates the much higher levels of walking that occur in traditional neighborhoods. For more studies of the relationships between community design and public health see AJPH, 2003 and AJHP, 2003, and the Active Living By Design (www.activelivingbydesign.com) website.
Figure 12 Household Travel by Neighborhood Type (Friedman, Gordon and Peers, 1995, citied in “Land Use Impacts on Transportation,” VTPI 2005)
0
2
4
6
8
10
12
Suburban Traditional
Ave
rage
Dai
ly T
rips
Per
Hou
seho
ld
WalkBicycleTransitAuto PassengerAuto Driver
Residents of traditional-style neighborhoods walk about twice as much as residents of suburban neighborhoods.
• Ewing, et al. analysis was performed at a county level. Much greater differences in health factors are likely to occur at a more disaggregate level, such as when Smart Growth and sprawled neighborhoods (rather than counties) are compared, or when communities which have made concerted efforts to improve walking and cycling conditions are compared with automobile-dependent communities.
• Critics claim that Smart Growth health impacts can be explained by income: residents of sprawled communities tend to be poorer, and poverty is associated with health risks such as obesity and inadequate physical activity. If this is true, then it further demonstrates economic benefits of Smart Growth: either Smart Growth raises residents’ incomes or it attracts wealthier people, indicating that consumers prefer Smart Growth over sprawl.

Evaluating Criticism of Smart Growth
43
Greenspace Preservation Benefits Smart Growth helps preserve greenspace (farmland, wildlife habitat, wetlands, parks and other forms of environmentally beneficial land uses), which provides a variety of economic, social and environmental benefits. Critics claim that efforts to preserve greenspace are unjustified, since they claim that only a tiny portion (3-5%) of America’s total land area is developed. This reflects a misunderstanding of greenspace and its value to society (“Land Use Evaluation,” VTPI 2005). Although only 3-5% of America’s total land area is officially designated as “urban,” a much larger portion is affected by development. For example, agricultural areas such as California’s Central Valley and unique habitat such as the Florida Everglades are threatened by low-density development but are classified as “non-urban.” The impacts of development often extend beyond the site borders, an impact called the “urban shadow.” For example, residents of new suburban developments often complain about common farming practices such as noise, dust, pesticide use and driving farm equipment on roadways, leading to constraints on farming activities. As a result, sprawl threatens local and regional agricultural economies. Similarly, human activity, including noise, roadway corridors and various pollution emissions can disturb wildlife habitat over a wide area. Urban development tends to occur in particularly valuable agricultural and environmental areas because many growing cities are located in fertile valleys or along coastlines. As a result, urban fringe development threatens prime farmlands, wetlands and unique wildlife habitat, each of which can provide unique economic, social and environmental values. An acre of Iowa farmland or Vermont forest does not substitute for an acre of land in California’s Central Valley or Florida Everglades lost to development. Greenspace provides a variety of economic, social, cultural, environmental and aesthetic values. Greenspace preservation helps improve water quality and groundwater recharge, reduce stormwater management costs, and reduce heat island effects. Many people value having traditional farm activities in their communities, and value being able to purchase locally produced food. Many people value the preservation of historic sites, unique natural features and attractive views, and these are important to the economy of many communities (for example, as tourist attractions). Many geographic areas have unique ecological features and habitats that are threatened by sprawl. Urban sprawl and excessive vehicle traffic can threaten the attributes that make a place special and attractive, and therefore increase land values and economic activity. These are all additional values from greenspace that Smart Growth can help preserve, which are not recognized by critics. For more discussion of these values and methods for quantifying them see European Union’s Environmental Economics Website (europa.eu.int/comm/environment/enveco), the International Society for Ecological Economics (www.ecoeco.org), and “Quantification Techniques,” Chapter 4 of Litman, 2009.

Evaluating Criticism of Smart Growth
44
Transit Cost Efficiency Critics argue that transit projects, particularly new urban rail, are ineffective and wasteful. They cite examples of transit projects that exceed projected costs or failed to meet ridership goals, but ignore other examples of projects that exceeded goals and are considered successful (Ridlington and Kellet 2003; O’Toole 2004). However, analysis by Litman (2004) and others indicates that transit projects are often the most cost effective way to improve transportation on a corridor, when all benefits and costs are considered. Critics tend to focus on just one or two transit objectives such as congestion or emissions reductions, and ignore other benefits, and so undervalue transit. The table below lists the full range of benefits that should be considered when evaluating transit.
Table 17 Transit Benefits (“Transit Evaluation,” VTPI 2005)
Description Mobility Benefits
Benefits from increased travel that would not otherwise occur.
Direct User Benefits Direct benefits to users from increased mobility. Government Benefits Direct benefits to government agencies from increased mobility. Productivity Increased productivity from improved access to education and jobs. Equity Improved mobility that makes people who are also economically, socially or
physically disadvantaged relatively better off. Option Value Benefits of having mobility options available, in case they are ever needed. Efficiency Benefits
Benefits from reduced motor vehicle traffic.
Vehicle Costs Changes in vehicle ownership, operating and residential parking costs. Chauffeuring Reduced chauffeuring responsibilities by drivers for non-drivers. Vehicle Congestion Reduced motor vehicle traffic congestion. Barrier Effect Reduced traffic delay to pedestrians. Parking Costs Reduced parking problems and non-residential parking facility costs. Safety, Security and Health Changes in crash costs, personal security and improved health and fitness. Roadway Costs Changes in roadway construction, maintenance and traffic service costs. Energy and Emissions Changes in energy consumption, air, noise and water pollution. Travel Time Impacts Changes in transit users’ travel time costs. Land Use
Benefits from changes in land use patterns.
Transportation Land Changes in the amount of land needed for roads and parking facilities. Land Use Objectives Supports infill, efficient public services, clustering, accessibility, land use mix,
and preservation of ecological and social resources. Economic Development
Benefits from increased economic productivity and employment.
Direct Jobs and business activity created by transit expenditures or attracted to a particular area.
Shifted Expenditures Increased regional economic activity due to shifts in consumer expenditures to goods with greater regional employment multipliers.
Agglomeration Economies Productivity gains due to more clustered, accessible land use patterns that increase efficiency.
Transportation Efficiencies More efficient transport system due to economies of scale in transit service, more accessible land use patterns, and reduced automobile dependency.
Land Value Impacts Higher property values in areas served by public transit. This table summarizes potential transit benefits. All of these should be considered when evaluating a particular transit policy or project.

Evaluating Criticism of Smart Growth
45
Critics argue that transit improvements are a luxury which cannot be justified if resources are limited for essential roadway maintenance, such as fixing potholes and replacing deteriorating bridges. But transit projects are a substitute for roadway capacity expansion, not for basic road maintenance, and transit is a necessity for some people. If society wants to improve economic opportunity for people who for any reason cannot drive, basic transit service is essential. Once transit service is provided, additional riders can usually be accommodated with a relatively low marginal cost. Figure 13 Urbanization Impacts on Transit Use
0%
20%
40%
60%
Rural Suburban Urban Central BusinessDistrict
Tran
sit M
ode
Split
As an area becomes more urban a greater portion of trips are made by public transit. As an area becomes more urbanized (denser, more mixed land use, higher land prices, and less unpriced parking), transportation diversity tends to increase, with a greater portion of trips by walking, cycling and public transit. Where service quality is good, transit carries 10-20% of peak-period commuters on major urban corridors and 20-60% to central business districts (Figure 13). Critics argue that transit is declining in importance, citing long-term travel trends, but in recent years transit has become more important for several reasons:
• During the 1990s many cities experienced redevelopment and population growth, and some trends (smaller households, more elderly people, increased popularity of urban loft apartments, increased value placed on walkability, etc.) support increased urbanization.
• Many cities that previously relied on automobile transport have reached a size and a level of travel demand that makes transit the most cost-efficient way to improve mobility.
• Many areas previously classified as suburban are becoming more urbanized due to population growth and infill, and so experience increased congestion, commercial clustering, land values and parking problems that make transit cost effective.
• Many suburban areas have commercial centers, malls, campuses and industrial parks with sufficient trip generation to justify public transit service.
• Various combinations of aging populations, traffic and parking problems, and environmental concerns are motivating suburban, semi-rural and resort communities to use transit services.

Evaluating Criticism of Smart Growth
46
Transit tends to be most efficient on corridors with the worst traffic problems, because demand is concentrated, and expanding road and parking capacity is costly. Transit improvements are often the most cost effective way to improve mobility on these corridors, providing benefits to transit users and motorists, who gain from reduced traffic and parking problems, chauffeuring demands and pollution (Weyrich and Lind, 2001). Incremental Costs of Urban-Peak Automobile Travel Adding urban highway capacity typically costs $2-4 million per lane-mile, and more if land costs are high or intersection reconstruction is needed. This represents an annualized cost of $100,000-250,000 or more per lane-mile. Divided by 2,000 to 4,000 additional peak-period vehicles per lane for 250 annual commute days indicates costs of 10-50¢ or per additional peak-period vehicle-mile of travel, plus 5-10¢ per vehicle-mile for maintenance and traffic services, indicating roadway costs of $3-10 for a 10-mile highway trip. Urban parking typically costs $2-10 per day, so total facility costs to government and businesses average $5-20 per day for an urban-peak automobile commute. Critics argue that individual transit improvements do little to reduce regional congestion (Charles and Barton, 2003), but the same could be said of individual roadway projects: impacts are small compared with total regional traffic problems. Transit does help reduce roadway congestion (Litman, 2004a). When transit is faster than driving a portion of motorists shift to transit. On a congested highway, even a small reduction in traffic volumes can provide a large reduction in congestion delays. As a result, the faster the transit service, the faster the traffic speeds on parallel highways (Mogridge, 1990; Lewis and Williams, 1999). Comparisons between cities, and experiences when urban transit service is disrupted, indicate that good transit service reduces traffic congestion (STPP, 2001). The Texas Transportation Institute estimates that U.S. urban traffic congestion delays would increase about 30% if public transit service were not available (TTI, 2003).
Critics claim that transit has excessive costs and public subsidies. They often cite figures indicating that 40-50% of transport expenditures are devoted to transit, but this is inevitably a single funding category (such as regional capital investments), not total expenditures. Total transit costs and subsidies are small compared with those of automobile travel. For example, U.S. transit expenditures total about $30 billion annually, of which two-thirds are subsidies, compared with $120 billion spent on roads of which $50 billion are subsidies (from general taxes), plus $30 billion in general taxes spent on traffic services, $270 billion in parking subsidies and $600 billion spent on private motor vehicles (Litman 2008). Transit expenditures represent about 3% of total motor vehicle expenditures, and transit subsidies represent about 10% of automobile financial subsidies (money spent on roads, traffic services and parking not charged directly to users), not counting other external costs such as uncompensated crash damages and environmental impacts.
Even this does not tell the whole story because about half of transit service is equity justified (intended to provide basic mobility for non-drivers) rather than efficiency justified (intended to reduce traffic congestion or pollution). Thus, efficiency-justified transit subsidies total about $10 billion annually, or about 5% of automobile subsidies, approximately equal transit’s share of urban trips. Transit users travel less on average than motorists, so their per capita annual subsidy is lower than what motorists receive.

Evaluating Criticism of Smart Growth
47
Critics often use average values when calculating cost per passenger-mile, but if some transit service is provided to insure basic mobility for non-drivers, the incremental costs of accommodating additional riders is often quite low (“Transit Evaluation,” VTPI 2005). Critics often use a relatively short time period for evaluation, which exaggerates highway benefits and understates transit benefits. Highway congestion and air emission reductions tend to be greatest right after capacity is added, but decline in a few years due to increased vehicle traffic and induced travel, while transit projects tend to provide relatively small benefits during their first few years, but these increase over time as ridership grows and land use patterns change. Critics claim that extreme population densities (e.g., 50,000 residents per square mile or 78 per acre) are needed for public transit to be cost effective. But Smart Growth includes many features that increase transit efficiency and ridership, such as clustered commercial centers, increased rider comfort, affordable fares, improved user information and marketing, improved walkability, parking cash out, road tolls, and Park & Ride facilities. A particular land use density may be inadequate to support transit service by itself, but becomes adequate if implemented with suitable Smart Growth programs, increasing cost efficiency and total benefits. Cox claims that density increases transit costs (www.demographia.com/db-ptcitysub.htm), measured as operating costs per transit-vehicle hour. This is not surprising since larger cities have more congestion delays and higher wages. However, larger cities also have higher transit load factors, reducing per passenger-mile costs and subsidies, so transit system efficiency tends to increase with density. There is evidence that many consumers would prefer to use transit more and drive less. U.S. transit use has increased faster than automobile travel in recent years (Figure 14), although this period coincided with a growing economy and declining real fuel costs, both of which should favor driving over transit travel. This suggests that public transit ridership could increase more with suitable Smart Growth strategies. Figure 14 Annual Growth in Automobile and Transit (APTA & FHWA Data)
-2%
0%
2%
4%
6%
1994 1995 1996 1997 1998 1999 2000
Ann
ual C
hang
e
Automobile Mileage
Transit Boardings
Between 1997 and 2000, transit use grew faster than automobile use.

Evaluating Criticism of Smart Growth
48
Induced Traffic Impacts Because Smart Growth critics support roadway projects to address traffic problems, they have challenged claims that increased roadway capacity causes generated and induced vehicle travel which reduces congestion reduction benefits. Many specific claims made by critics concerning induced travel misrepresent the issue. For example, they claim that the existence of induced travel is unproven or too small to be significant (Cox, 2003b). But induced travel impacts are well documented (Cervero and Hanson 2000; Litman 2001). A significant portion (40-60%) of added roadway capacity tends to be filled by induced travel over the long-run, and even more under highly congested condition. Induced travel does not mean that road capacity projects provide no benefits, but current planning practices that ignore these impacts tend to overstate highway capacity expansion benefits and understate the benefits of alternative congestion reduction strategies. Road projects considered cost effective by conventional models may actually make society worse off overall, while other strategies would provide greater net benefits when generated travel impacts are considered. Jobs/Housing Balance Jobs/Housing Balance refers to the ratio between employment and residents in a community. Smart Growth proponents support efforts to balance jobs and housing, referred to as creating “more complete communities,” in order to reduce transportation problems and improve employment opportunities. Smart Growth critics argue that this is unnecessary and harmful, since housing and employment are now so dispersed through an urban area, workers frequently change jobs and home locations, most households contain multiple workers, and many jobs are highly specialized so workers cannot simply accept a nearby job (Giuliano, 1991). Critics point to surveys indicating that “only” 20% of homebuyers rank proximity to employment as their most important factor in choosing home location (Cox, 2003b). But there are a number of justifications for Jobs/Housing Balance not recognized by critics. A number of studies indicate that average commute distance and time is lower for residents of communities with a more balanced jobs/housing ratio, and this may be particularly important for lower-income workers (Levinson, 1998). In addition, Job/Housing Balance tends to increase local services, improving access to services and reducing non-work travel. Even if “only” 20% of house buyers consider proximity to work as a primary priority, this is a significant portion of the market and implies that a far larger portion of homebuyers consider employment proximity a moderate priority.
Slow Smart Growth is sometimes criticized because land use change is slow, and so impacts and benefits take many years to be achieved. In most communities only 1-4% of land is developed or redeveloped during a typical year, so it often takes decades before significant regional travel impacts are achieved. But these changes can provide many benefits and are extremely durable once implemented. Smart Growth therefore provides a long-term legacy of increased accessibility and community livability for the future.

Evaluating Criticism of Smart Growth
49
Considering Alternatives Critics sometimes attack Smart Growth programs without providing specific alternatives for comparison. For example, critics argue that public transit projects have excessive costs per additional rider, although highway projects would have even higher costs per additional trip when road construction, parking and vehicle expenses are all considered. Similarly, critics sometimes oppose infill development on the grounds that this is unpopular with residents, without acknowledging that the alternatives (prohibiting development or increasing low-density sprawl development on existing greenspace) are also unpopular, and so Smart Growth may be the most popular of available options. Cox (2000) proposed a transportation plan for the Atlanta, Georgia area consisting of a grid of high-volume arterials spaced every mile through the urban region, converting existing arterials to “surface expressways,” limited access commercial bypasses, automobile tunnels, double-decking freeways, truck-only freeways, more extensive use of reversible lanes, and high occupancy toll lanes. But the proposal includes no cost estimates, nor modeling to quantify impacts on congestion, pollution emissions or safety. Table 18 provides an estimate of such a program’s costs, assuming that 1,000 miles of state highways and 1,600 miles of arterials in the fifteen-county Atlanta area are expanded by one lane in each direction. Additional operating and maintenance costs for these lanes are calculated based on 5% of capital costs. This probably underestimates the proposed program’s actual costs because many highways would need more than one additional lane over the next 20 years to significantly reduce traffic congestion, and because the proposed roadway projects (tunnels, double-decking highways with new intersections and urban arterial widening) tend to be particularly costly. Table 18 Atlanta Roadway Capacity Expansion Estimated Costs
Miles Cost Per Lane-Mile Costs State Highways 1,000 $4,000,000 $8,000,000,000
Arterials 1,600 $2,000,000 $6,400,000,000 Totals 2,600 $14,400,000,000
Annualized (7% Interest over 20 years) $1,359,258,131 Operations and Maintenance (5% of capital costs) $720,000,000
Total Annualized Cost $2,079,258,131 Annual Per Capita $590
This table shows the estimated costs of Wendell Cox’s proposed highway capacity expansion projects if implemented over 20 years. Actual costs would probably be higher. This estimate further understates the total potential costs for Cox’s program because it includes just 1,600 miles of additional arterial capacity, enough to approximately cover currently urbanized Atlanta but not the larger area of potential suburban expansion. If the arterial network is expanded to an 80-mile grid, reflecting Cox’s idea that sprawl is good, the program’s total costs more than double. If Cox recommends limiting the grid, on the grounds that public subsidy of low-density urban expansion is wasteful and suburban growth should be constrained, he is endorsing Smart Growth.

Evaluating Criticism of Smart Growth
50
Cox ignores the negative impacts that wider roads, double-decked highways, increased traffic volumes and higher traffic speeds have on the city environment, including reduced walkability, aesthetic and noise impacts, and the loss of greenspace as the urban fringe expands with low-density development.
Cox’s proposal would cost the average Atlanta area household $1,475 annually. A fuel tax increase of approximately $1.00 per gallon or a vehicle fee of about 5¢ per mile would be needed to provide this revenue. However, such charges may reduce vehicle traffic sufficiently that the need for this proposed highway project would be eliminated. In other words, the need for Cox’s proposed highway capacity expansion only exists if the roadway projects are subsidized and driving is underpriced. This is evidence that such projects are economically inefficient, and that mobility management and Smart Growth strategies are justified based on free market principles. Recognizing that roadway capacity expansion cannot really solve transportation problems, Cox’s plan actually contains many Smart Growth strategies, including electronic road pricing, high occupancy toll (HOT) roads, improved transit services, financial incentives to encourage ridesharing and public transit ridership, telecommuting and acceptance that traffic congestion is inevitable. However, many of these are presented as afterthoughts, with little detail as to how they will be implemented, and little appreciation that they can be part of an integrated mobility management program which, because it tends to be more cost effective than highway capacity expansion, should be implemented first.

Evaluating Criticism of Smart Growth
51
Responding To Specific Critics This section examines specific claims by various Smart Growth critics.
Wendell Cox Wendell Cox is a leading critic of Smart Growth (www.demographia.com and www.publicpurpose.com). He makes many of the errors examined in this paper:
• He misrepresents Smart Growth, assuming that it relies primarily on new regulations, ignoring other Smart Growth strategies. For example, he claims that Smart Growth reduces consumer freedom, without acknowledging that many Smart Growth strategies increase consumer freedom to choose housing options such as secondary suites and lofts, to avoid excessive parking requirements, or to use alternative forms of transport.
• He evaluates Smart Growth based simply on regional density. He either does not understand or intentionally ignores more accurate indices of sprawl and Smart Growth. Much of his criticism of Smart Growth disappears when these more accurate indices are applied to his analysis. For example, his claims that Smart Growth increases congestion and pollution, public service costs and household costs do not apply if other Smart Growth strategies besides increased regional density are considered.
• He ignores confounding factors between city size, density, congestion, income, etc., and so reaches spurious and inaccurate conclusions. For example, he claims that Smart Growth increases housing and food costs, although this actually reflects the higher incomes in larger cities. Much of his criticism of Smart Growth disappears when these factors are incorporated into his analysis. For example, his claims that Smart Growth increases congestion and pollution, public service costs and household costs do not apply if confounding factors are considered.
• He criticizes transit investments on the grounds that they are not the most cost effective way to reduce traffic congestion, ignoring other benefits of public transit. For example, his criticism ignores parking cost savings, consumer cost savings, safety benefits, improved mobility for non-drivers, and support for strategic land use objectives.
Below is one of Coxes’ articles criticizing Smart Growth. Responses to his claims are in italics. Debunking Friday the 13th: 13 Myths of Urban Sprawl by Wendell Cox, The Heartland Institute (www.heartland.org) 06/12/2003 Simply described as the geographical spreading out of urban areas, “urban sprawl” has become the stuff of public policy hysteria. A well-financed movement blames sprawl for everything from a lack of community spirit to obesity. The movement has labeled itself “smart growth,” but more descriptive--and more accurate--would be “anti-opportunity.” It would force housing prices up, depriving millions of households, disproportionately minority, of home ownership. It would increase commuter travel times and reduce the number of jobs accessible, to the disproportionate harm of lower-income households, especially minorities. The “smart growth” movement is a serious threat to the American Dream of home ownership, employment, and prosperity. Far more dangerous than black cats, ladders, and Friday the 13th, it jeopardizes the lives of millions of Americans. The 13 myths debunked below explain why.

Evaluating Criticism of Smart Growth
52
Myth #1: Smart Growth Does Not Reduce Housing Affordability. Rationing raises prices. Smart growth measures ration land by forcing higher densities through urban growth boundaries, excessive impact fees, down-zoning and other restrictions on development. This drives prices higher, making housing less affordable. While Smart Growth may reduce the supply of urban-fringe land it has many features that can increase consumer affordability, including reduced land requirements per housing unit, reduced parking costs, more diverse housing types (secondary suits, multi-family, loft apartments), more cost effective utility and public services, and reduced household transportation costs. Much of the cost premium for New Urbanist neighborhoods reflects consumer preferences and scarcity, and so is best addressed by expanding Smart Growth to increase the supply of such housing. Myth #2: Higher Densities Mean Less Traffic Congestion. National and international evidence clearly shows higher densities increase traffic congestion. Per-capita travel by automobile may decline a bit as densities rise, but not enough to keep traffic from getting a lot worse. Adding more of anything to a constricted space--putting more people into smaller urban areas--increases crowding. As described above, Smart Growth includes many features that can help reduce per-capita vehicle trip generation besides just increased density. Smart Growth emphasizes accessibility rather than mobility, so trip distances are shorter, and Smart Growth gives people more travel options, so they are able to avoid congestion, for example by walking for local errands and taking grade-separated transit. As a result, people spend less time in congestion delay, even if the degree of local congestion (measured as roadway level of service) increases. It is untrue that increased density (population per acre) increases crowding (population per room) if Smart Growth results in more efficient use of land through smaller lots, multi-story buildings, less land devoted to parking and other design strategies. Myth #3. Lower Densities Mean Higher Costs of Government. The smart-growth folks say we can no longer afford our low-density life style, claiming higher taxes and fees are caused by lower densities. But the data show lower-density cities have lower expenditure levels than higher- density cities. Moreover, cities with newer housing stock (second- and third-ring suburbs) have lower public expenditures than central cities and first-ring suburbs. More than a dozen studies by leading researchers show higher public service costs for dispersed development. The study Cox cites is not relevant, because it measures county-level density and ignores additional private costs for services such as water, sewage, garbage, and differences in wages and service quality between urban and rural areas. Myth #4: Higher Densities Mean Less Air Pollution. EPA research concludes air pollution emissions are higher where traffic speeds are slower, and emissions are higher where there is more stop-and-go traffic. Higher densities mean more traffic congestion, which in turn means slower traffic speeds and more stop-and-go travel. More tail pipes do not emit less pollution. Air emission impacts vary depending on circumstances. Although increased development density may increase per-mile vehicle emissions, this is offset by reduced per-capita mileage. Myth #5: Central Cities Are the Victims of Suburban Growth. America’s central cities have lost population, while suburbs have gained. It does not, however, follow that city losses occurred because of suburban growth. Over the past half-century, America has become increasingly urban, as rural residents have moved to urban areas, where they have accounted for much of suburban growth. And cities have driven away many who would have stayed. Cities are hardly the victims here. City residents are: residents who felt they had no choice but to leave, and even more so those who have no choice but to stay, captive to governments qualifying as third world by their performance. Many studies by urban economists indicate that a variety of public policies favor suburbanization (such as redlining, housing policies that favored new construction over redevelopment, and transportation and infrastructure investments that favor suburban residents) and contribute to urban degradation.

Evaluating Criticism of Smart Growth
53
Myth #6: Rail Transit Reduces Traffic Congestion. There is no evidence--none--that new rail transit has materially reduced traffic congestion in any urban area. Building rail is justified principally by an irresistible urge to spend taxpayers’ money. The higher the cost, railvangelists claim, the greater the benefit. Of course, the historic rail systems serving the pre-automobile cores of New York, Chicago, Paris, London, Tokyo, or Hong Kong are essential. But Sioux City, Iowa is not Hong Kong. Neither, for that matter, is Portland. There is considerable evidence that high-quality grade-separated transit services reduce traffic congestion. Corridors with grade separated transit tend to have higher traffic speeds than corridors that lack such service, and cities with large, well-established rail transit systems have 20-50% lower per capita traffic congestion costs than comparable size cities that lack such systems (Litman, 2004a). Myth #7: Rail Transit Is Needed for Transportation Choice. From Cincinnati to Austin, transit spending advocates quickly abandon their baseless traffic congestion claims when challenged. They shift to what they call “transportation choice”-the idea that building rail transit provides choices for people. But choices for whom? At most, rail transit serves the small percentage of people who work downtown--the only destination to which transit provides what can be considered automobile-competitive service. To provide genuine transit choice for all would require annual expenditures that rival the gross income of any urban area. Rail transit is not appropriate everywhere, but in some areas it can provide benefits to consumers by improving travel options and providing a catalyst for accessible transit villages, which provide a number of benefits to people who live and work there, and to other regional residents who experience less traffic congestion and pollution emissions (Litman, 2004a). Voters tend to be more willing to support rail transit funding and middle-class travelers tend to be more willing to ride rail than bus transit, suggesting that rail reflects consumer preferences. Myth #8: We Can’t Built Our Way Out of Congestion. This proceeds from the belief that new roadway capacity creates new traffic (the “induced traffic” effect)--suggesting a corollary that building more maternity wards would increase the birth rate. This leads to a further conclusion that, given enough road capacity, Americans will eventually spend 36 to 72 hours per day behind the wheel. More rational minds at the Federal Highway Administration found little induced traffic effect, and even that withers away when travel time (rather than distance) is considered. Mr. Cox misunderstands the concept of generated and induced vehicle travel. It does not mean that increased roadway capacity increases the amount of time people spend traveling; on the contrary it reflects the tendency of constant travel time budgets, that is, people tend to devote a constant portion of their day to travel and so drive more miles when travel speeds increase. A variety of studies by leading researchers show that a significant portion (40-60%) of added roadway capacity tends to be filled by induced travel over the long-run. This does not mean that roadway capacity expansion provides no congestion reduction benefits, but such benefits decline while the increased vehicle mileage may impose additional costs on society, such as downstream congestion, increased accidents and pollution. Myth #9: The Jobs-Housing Balance. Planners, the smart growth movement claim, should design transportation and land use so as to minimize the distance between work and home. This may be the most bankrupt, and surely the most arrogant, of the smart growth myths. Herding cats would have at least as high a probability of success. According to Census data, barely 20 percent of households consider proximity to work as the principal reason for selecting their home neighborhood. A jobs-housing balance requires other balances as well--jobs-housing-education, jobs-housing-leisure, etc. Are planners really in the best position to decide? Jobs-housing balance is a general indicator of increased accessibility and land use mix, which can provide a variety of consumer, economic, social and environmental benefits. Current land use policies discourage land use mix – Smart Growth removes restrictions, allowing development of more complete
Evaluating Criticism of Smart Growth
54
communities. Whether households rank proximity to work first, second or third when choosing a home, there are still many benefits from reducing travel distances to work and services. People shouldn’t be prevented from living and working closer together if they choose, since this provides benefits to both individuals and society, yet is currently prohibited by public policies in many communities. Myth #10: Higher Densities Mean A Lower Cost of Living. Periodically, smart-growth studies emerge claiming household transportation expenditures are higher where densities are lower. But there is more to life than transportation. Housing and food expenditures are so much lower where densities are lower, that any transportation cost advantage for higher density areas is more than erased. Smart Growth increases housing, transportation and commercial options, letting individual households choose the combination that best meets their needs. Current land use and transportation policies tend to restrict consumer choice and affordability. Myth #11: Europe Doesn’t Sprawl. American urban planners by the thousands have made overseas pilgrimages, frequenting sidewalk cafes across the street from the Louvre in Paris, wondering why Phoenix or Boston looks so different. What they fail to realize is that not even Paris is like Paris. The few square miles of central Paris in which the myopic rail-bound pilgrims sit is in the middle of 1,000 square miles of urban sprawl. The situation is similar throughout Western Europe, where virtually all growth in urban areas has been suburban growth, and where virtually all major cities have experienced population losses. Urban population densities have fallen faster in Europe and Canada than in the United States. None of Cox’s claim indicate that there is anything wrong with Smart Growth. Experience in Europe, and other parts of the world, is highly diverse, with many different patterns. Many regions are applying Smart Growth principles to both urban and suburban development, many are experiencing downtown redevelopment, population growth and reduced automobile dependency, and those that succeed are enjoying significant economic, social and environmental benefits as a result. Myth #12: Urbanization is Consuming Agricultural Land. Until the Clinton Agriculture Department set them straight, this was one of the principal tenets of the smart-growth movement. In fact, some 400 years after Jamestown, as The Heritage Foundation’s Ron Utt always reminds us, only 3 percent of the nation is urbanized: 97 percent of it is rural. There is less agricultural land in the United States than there used to be, but not because it has been consumed by urbanization. Agriculture has become more productive. Since 1950, agricultural production has doubled, and more farmland than the area of Texas and Oklahoma combined has been returned to emptiness: open space. Many growing cities are located near prime agricultural land, shorelines and other unique greenspace. These areas are threatened by urban development. Even if this is not considered a national threat, many people value having local greenspace and the economic, social and ecological services provided. Myth #13: Things are Going Our Way. Anti-sprawl types often project their personal experiences into universal truths. Transit ridership increases on a minuscule base are reported as if they represented a major switch in travel behavior; going from 10 riders to 20 represents a touted 100 percent increase. Friends move into chic new urban developments, leading some to claim people are forsaking suburbs for the city. There are indications that many people prefer Smart Growth communities and society benefits overall from Smart Growth. Many professional organizations, such as the Institute of Transportation Engineers, the National Governor’s Association, and the American Planning Association support Smart Growth. Only time will tell how much Smart Growth is implemented. Cox’s Summary Someone should teach these people to use simple reference books, like The World Almanac, which can be easily obtained at the nearest big box store.

Evaluating Criticism of Smart Growth
55
Edward Glaeser and Matthew Kahn Glaeser and Kahn (2003) use neoclassic urban economic analysis to argue that sprawl is economically efficient and beneficial, resulting from increased private wealth and associated increases in automobile travel. To support this argument they provide statistical evidence that sprawl is ubiquitous, that it reflects the technical superiority (increased travel speed) of automobile transport, and that the external costs of sprawl are minor compared with its social welfare benefits. They conclude that sprawl should be increased to allow more lower-income people to enjoy the benefits of dispersed land use and automobile dependency. Although Glaeser and Kahn acknowledge that market distortions increase sprawl and automobile use, they assume that these impacts are minor overall, and so current land use and transport patterns are overall optimal. For example, they acknowledge that about a third of highway expenditures are subsidies (i.e., not user fees), but counter that this is small compared with the total automobile costs (they do not mention the much greater subsidy of driving from unpriced parking), and offset by transit subsidies. They ignore more general social traps, such as the economic and social problems that result when individual communities attempt to exclude “undesirable” residents. Like other critics they use highly aggregate data to claim that there is plenty of land available for development (“Ninety-five percent of the land in this country remains undeveloped”) and so conclude urban expansion imposes no significant social or environmental costs. They acknowledge that sprawl may impose some externalities, including increased traffic congestion, excessive pollution and inefficient land use patterns (due to exclusionary zoning imposed by individual jurisdictions), and in response advocate various Smart Growth strategies such as road pricing and development policy reforms. Glaeser and Kahn accept travel time benefits of automobile travel at face value and fail to consider the associated economic traps, that is, that the benefits of increased travel speeds may be offset by more dispersed destinations, higher travel times for non-drivers, and increases in other social costs such as pollution and accidents. Although Glaeser and Kahn provide convincing evidence that some amount of automobile transport and urban expansion may be economically justified, they fail to prove that current land use and transport patterns are optimal or that Smart Growth is harmful. In fact, they support many Smart Growth strategies, such as road pricing (and assumedly parking pricing), more efficient pricing of public services, and reductions in exclusionary zoning. They do not examine the degree to which sprawl and automobile use would decline if these strategies were implemented, but as discussed earlier in this paper, available experience indicates that such strategies significantly change consumer behaviour (Litman, 2002). Thus, their research suggests that Smart Growth is justified on economic efficiency grounds, and that the resulting land use patterns would be significantly less sprawled and less automobile dependent than what currently exists.

Evaluating Criticism of Smart Growth
56
Peter Gordon and Harry Richardson Gordon and Richardson (1997 and 2000) raise a number of objections to Smart Growth, including that it reflects a socialist/collectivist ideology which contradicts private property rights, reduces consumer benefits and increases inequity, is harmful to the economy, is unjustified, and is based on failed regulatory techniques. Gordon and Richardson argue that current land use and transportation markets are efficient because “developers already offer a wide range of community and housing choices,” and because there are a large number of independent contractors in the residential market. They ignore most categories of market distortions and claim that the impacts of any distortions and subsidies are exaggerated, citing one paper published in 1985 (“The Economics of Zoning Laws: A Property Rights Approach to American Land Use Controls” by William Fischel) to prove that “Urban economists have found that the alleged subsidies – to the extent that they exist – are minor and have little effect at the margin.” Similarly, they interpret a 1999 GAO study on the impacts of federal policies on land use development as proof that “not all government interventions that influence land development have had a suburban bias,” certainly not proof that land use markets are efficient. They assume that Smart Growth consists primarily of urban growth boundaries to increase density and rail transit projects, and that this significantly raises housing costs and reduces consumer housing and transportation options. They do not consider other Smart Growth strategies, and dismiss the idea that a significant portion of consumers may valuing having alternative housing or transportation options.

Evaluating Criticism of Smart Growth
57
Joel Kotkin Social commentator Joel Kotkin (www.joelkotkin.com) published an article in a Portland paper criticizing the city’s Smart Growth policy on grounds that they are exclusive and elitist. Below are responses to some of his claims by law professor Michael Lewyn (2005b). Kotkin: Few cities in North America are as widely feted as Portland. For many, Portland represents the epitome of “smart” urbanism, a paragon that puts other, less-brainy places to shame. Pilgrims travel once or twice a month from as far as California and Canada to study Portland’s transit system, economic development and land-use strategies. Lots of educated people, trees, clean air and good buzz help Portland get on all the right lists – from “most livable,” “most fit,” “healthiest,” “most competitive,” “most literate” and “best for walking.” It’s enough to make even a modest city booster blush. But before you all turn red, is all this praise deserved? Much like its bigger soul mate, San Francisco, Portland isn’t an old-style “city of big shoulders” but a lifestyle choice for the enlightened elite. They’re the people who read more than average, walk or bicycle regularly and drink lots of good coffee. Lewyn: Note the naked class warfare appeal. How dare they drink good coffee? And what the heck is a “City of Big Shoulders” anyhow? Kotkin: Portland is becoming what I call an Ephemeral City. What do ephemeral cities do? Not much by traditional standards. They don’t create a lot of jobs for working or middle-class people. Instead they mostly exist to celebrate themselves and provide an attractive setting for visitors and would-be migrants. Lewyn: Only 10.3% of Portland households earned over $100,000, according to the 2000 Census. Only 9.9% of them had income under $10,000 per year. That leaves about 80% of Portland households in the “working and middle classes.” That seems like a lot of working- and middle-income households to me. By contrast, in Houston (a city Kotkin praises a few paragraphs down) 11.8% of households earn more than $100,000 (MORE than Portland’s 10.3%) and 11.6% earn under $10,000 per year (again, slightly MORE than Portland’s 9.9%). In other words, Portland has MORE working- and middle-class people than Houston. Presumably most of them have jobs. So Portland may actually have more middle- and working-class jobs than Houston. Maybe Kotkin doesn’t think that Portland jobs are “real” jobs. If so, he should educate readers on what his “traditional standards” are and why Portland meets them less than Houston does. Kotkin: But can a city survive – and thrive – primarily as a marketer of an urban experience? Lewyn: And the evidence that Portland in fact survives “primarily as a marketer of an urban experience” is, um, um.... well, I don’t know because Kotkin doesn’t tell the reader. Kotkin: An ephemeral city doesn’t compete with lesser places – you know, those ugly cities with functional warehouses and factories, Wal-Marts and strip malls – for jobs, companies or investors. An ephemeral city’s economy relies largely on a high level of self-esteem among its residents.

Evaluating Criticism of Smart Growth
58
Lewyn: No “functional warehouses and factories?” Then how come 12.5% of Portlanders work in manufacturing (again, MORE than Houston’s 10%). And according to the Wal-Mart website, there are actually two Wal-Marts in Portland zip codes, and a few more in neighboring cities. And where there are Wal-Marts, I think there are probably strip malls. But I’ll have to concede one point to Kotkin: evidently he has somehow learned that those Wal-Marts and factories rely on their customers’ and employees’ “high level of self-esteem.” I know how to dig up information on Census websites, but they don’t give me any information on cities’ self-esteem levels. Kotkin: Four decades ago, author Neil Morgan used the term “narcissus of the West” to describe an already self-indulgent San Francisco. Now it’s time for the City by the Bay to move over -- the City of Roses wants to take its place in front of the mirror. To some extent, this high regard, like that of any well-chiseled middle-age narcissist, reflects something of a Portland reality. Portland, as its boosters are forever telling everyone, is a physically attractive place. Parts of the city – like the much ballyhooed Pearl District – look very much like famed urbanist Jane Jacobs’ idealized urban district. Rhapsodizers often miss the differences between Portland today and Jacobs’ gritty Manhattan neighborhoods of more than 40 years ago. Those New York areas were home to large numbers of families and immigrants; they boasted both real bohemians (those without money) as well as people who worked with their hands. Most residents were there for employment and family; many hoped they’d move up into a nicer neighborhood someday. Upward mobility was the common theme of the time. Urbanites wanted to get ahead – not “soak” in the ambience – and saw the city as a means to get there. “A metropolitan economy, if it is working well, is constantly transforming many poor people into middle class people…greenhorns into competent citizens,” Jacobs suggests. “…Cities don’t lure the middle class, they create it.” Contrast that with genteel Portland, which increasingly places its bet largely on luring the hip, cool, iPod-toting creative class – “the young and the restless,” as one story recently put it. These hipsters are supposedly the engine of the city’s future. Lewyn: Who is the “Portland” Kotkin refers to? The mayor? The city council? His friends who live in Portland? And whoever Kotkin defines as “Portland”, how can it “place its bet” on anything? ? Has Kotkin visited Portland’s bookie population to find out what the city’s residents are betting on? Has the city council passed some sort of law stating that “we only want the hip, cool, iPod-toting creative class” but excluding “real bohemians . . . as well as people who worked with their hands.” ? I don’t know. And Kotkin doesn’t tell us. Kotkin: But who isn’t high on this agenda? Certainly it can’t be families. Portland already has one of the lowest percentages of little tykes among American cities. The city schools are emptying out, down 14 percent in 10 years. Lewyn: According to the 2000 Census, there are about 112,000 people under 18 in Portland. (And according to the 2004 Census estimate, there are now 113,000 under-18 Portlanders). By contrast, in 1990 there were just over 95,000. So the number of

Evaluating Criticism of Smart Growth
59
Portlanders under 18 has increased by about 17 or 18% since 1990. Kotkin’s statement that Portland has one “of the lowest percentages of little tykes among American cities” is both meaningless and contradicted by Census data. Meaningless because Portland is growing, which means that its population is increasing among all age groups even if the percentage of its population in the under 18 age group is small. By contrast, many cities are losing population hand over fist (as Kotkin himself has pointed out in numerous articles). And wrong because Portland is not significantly less child-oriented than many other cities. As of 2000, 6.6% of Portland residents were under 5- only slightly fewer than the 7% national average. 21.7% of Portlanders were under 18, compared to the 25.5% national average. Less than the national average? Sure. But more than a lot of other cities- for example, both hip Boston (5.4% under 5, 19.8% under 18) and anything-but-hip Knoxville (5.9% under 5, 19.7% under 18). According to the 2000 Census, 16% of Portland households were married couples with children. That’s almost as high as the national central city average (18%), and higher than such brawny, un-hip cities as Buffalo (12), Knoxville (13), Louisville (12), Richmond (10), Baton Rougte (15) and Birmingham (13). The lowest, Washington, clocks in at 8 percent. In other words, Kotkin is just dead wrong. Kotkin: Nor, despite the obligatory liberal genuflection, it can’t be ethnic minorities, either. Portland has one of the lowest percentages of minorities and immigrants of any major city on the Pacific Coast. Hardworking Latin laborers or opportunistic Asian traders -- the canaries in the economic coal mine -- seem to be opting instead for less-lovely but more commercially vital places such as Los Angeles, Phoenix or Houston. Lewyn: It is true that Portland is less Hispanic than the cities Kotkin mentions (perhaps because they are closer to Mexico). But on the other hand, Portland is becoming more like those cities over time. Between 1990 and 2000, Portland’s Latino population more than doubled (from just under 14,000 to about 36,000). Portland’s Asian population increased from about 23,000 to about 33,000 (a 40% increase). And Kotkin’s “opportunistic Asian traders” (to use his sterotype-clogged language) actually seem to prefer Portland to Houston and Phoenix. Portland’s population is 6.4% Asian, while Houston’s is 5.3% Asian and Phoenix’s is 2% Asian. Kotkin: If they’re the leading drivers of Portland’s future, what is the local “creative class” creating? So far, nothing exceptional in the way of jobs or new companies. Now clearly on the rebound, Oregon’s economy started lagging the country’s five years ago. But so far the data suggests that the rebound is stronger in places like Medford and Eugene, as well as the burgeoning suburbs which, compared to their high-priced counterparts in California, are attractive not so much to hipsters but to families. Lewyn: See data above (noting that Portland continues to attract families). And Kotkin’s point would be more persuasive if he actually cited some data instead of referring ominously to unspecified “data.”

Evaluating Criticism of Smart Growth
60
Kotkin: “People like the downtown, but the growth is elsewhere,” notes local economist John Mitchell. But the economy isn’t the only place suburbia is doing better than the sophistos suggest. Lewyn: Note the pointlessly insulting reference to “sophistos.” This sort of writing belongs in a high school newspaper. Kotkin: Like the “creative class,” the city’s much ballyhooed “green” planning policy has been less than wildly successful. Even before Al Gore, looking out from one of his estates, discovered sprawl, Portland’s planners declared war on single-family homes, backyards and insufficiently dense development. To stomp out such deviant behavior, the city – to the hosannas of the planning profession – proudly imposed tough restrictions, notably the urban growth boundary, on new development. COMMENT: According to the Census Bureau, over 60 percent of Portland’s housing units are single-family homes. This hardly constitutes “war on single-family homes.” The urban growth boundary affects where single-family homes and other development is built, not whether it is built. In fact, the number of single-unit detached structures (i.e. single-family houses) in Portland increased during the 1990s, from 124,000 to 143,000. Kotkin: Unfortunately, Portland’s green urbanism has produced some unexpected results. As regulation helped boost the housing prices in the close-in areas, the middle class has moved farther and farther out. It turns out that most families – yes, they still exist – usually opt not to raise their kids inside sardine cans if they can at all help it. Lewyn: On the one hand, Kotkin says Portland isn’t attracting immigrants. On the other, it isn’t attracting the “middle class” either. So who are those 17,000 children who moved to Portland between 1990 and 2000? And as noted above, Portland has plenty of people with middle-class incomes. Kotkin: So Portland’s sprawl has continued to spiral about as much, or even more, than most American regions, notes demographer Wendell Cox. Lewyn: I think this argument is not completely nuts. But it seems to contradict Kotkin’s attacks on the evils of Portland’s planning system. Either Portland is not like everyplace else (in which case we can argue about the merits of the policies that led to that situation) or it is like everyplace else. If the latter is correct, there’s no point attacking Portland’s policies because obviously they are not radical enough to have a significant impact on anything. Kotkin: Over the past few years Portland’s population growth has slowed considerably, with the overwhelming majority of the Portland area’s increases coming outside the city limits, and that percentage appears to be growing. Some of this may be traced to the little-acknowledged fact about the creative class – at some point many grow up and move out. One prime destination appears to be fast-growing Washington County, which beat the pants off Portland in a recent ranking of most-tech-savvy places in USA Today.

Evaluating Criticism of Smart Growth
61
Lewyn: Kotkin does have a point here. The 2004 Census estimates were less kind to Portland than the 2000 Census data. But three caveats: First, many other cities actually lost population - as Kotkin himself has pointed out (e.g. www.joelkotkin.com/Urban_Affairs/WP%20City%20Of%20the%20Future.htm) compared to those cities, Portland is still a success. Second, the Census estimates are only estimates based on statistical projections, and may be less accurate than decennial Censuses. Third, Portland grew hand over fast for the past two decades, growing as fast as its suburbs. During both the 1980s and 1990s, Portland grew by over 20%, while America’s 100 largest central cities grew by only 6% in the 1980s and 9% in the 1990s. Kotkin: Mass transit, the other linchpin of the Portland legend, also may be less a triumph than reported. According to the most recent Texas Transportation Study, drivers in greater Portland are stuck in traffic 39 hours a year, not far behind notoriously gridlocked Seattle, with 47 hours. Lewyn: If Kotkin thinks Seattle is “notoriously gridlocked” he needs to travel more. According to TTI, the average metro area experienced 47 hours of congestion delay per traveler- as many as Seattle, and more than Portland. Los Angeles has more than twice as much congestion as Portland (93 hours), Houston over 50% more (63 hours). See http://mobility.tamu.edu/ums/congestion_data/tables/national/table_4.pdf. Kotkin: So if Portland’s present accomplishments are less than stellar, what does the future hold ? Actually, it won’t be too bad for those who like the way things are. Given current trends, Portland’s inner city will continue to be attractive to its core demographic niches. As an attractive Ephemeral City, it will remain a lifestyle pit stop for wayward twentysomethings and a lure for the financially secure’s quest for quality of life. It also might remain a blessed place for aging hipsters who can “create” for each other without enduring the hard competitive scene of Los Angeles, New York or even Seattle. Population pressures may help. As the country grows to 400 million by 2050 – due largely to the children of immigrants and babies raised out in the burbs – there’ll be enough young people, childless couples and nomadic rich to keep the Pearl District hopping. Suburbanites may still wander into town on weekends to take in a play, a game or some high-quality cuisine. There even may still be a buzz about the place. Burdened by the complexities of managing mid-21st century super-sprawl, planners might still come to marvel at a preserved, archaic urban environment, much like today’s visitors to Florence or Venice. It will likely be an aggressively pleasant place, kind of a nice post-graduate college town – a museum for 1960s values, a testament to good intentions and the enduring power of self-regard. Lewyn: This two makes Portland seem pretty good compared to most older American cities. So why is Kotkin wasting its time attacking its “less than stellar” record?

Evaluating Criticism of Smart Growth
62
Edwin S. Mills Edwin S. Mills (1999) evaluates sprawl and Smart Growth using a conventional urban economics perspective. He concludes that sprawl is a rational response to increased wealth and improved travel options, which optimizes social welfare and equity, and any attempt to reduce sprawl is harmful to individuals and society. His analysis includes a number of errors and omissions described earlier in this paper:
• He assumes that suburbanization equals sprawl, and that Smart Growth consists simply of regulatory controls on suburban expansion which force people to live in central cities.
• He makes no attempt to understand the full costs of sprawl or potential benefits of Smart Growth. He is either unfamiliar with, or intentionally ignores the extensive academic literature on these subjects (e.g., Ewing, 1997; Burchell, et al, 1998).
• He does not recognize any Smart Growth strategies besides suburban growth controls.
• He accepts without question that Smart Growth reduces housing affordability, ignoring ways that Smart Growth reduces housing and transportation costs.
• His analysis includes some clearly incorrect “facts,” such as a claim that the city of Vancouver is “surrounded by unlimited amounts of cheap land,” that all mobility management programs have failed, and that growth controls lead governments to jailing property owners for land use speculation.
Mills acknowledges that lower-density, suburban development may be economically excessive due to market distortions such as underpriced driving, externalities and failed government policies, but considers only a few distortions and evaluates them based on a biased review of evidence. For example, he cites a 1985 study to conclude that motorists fees cover roadway costs, and claims that new cars produce no significant pollution. He supports higher fuel taxes to internalize vehicle costs, which he estimates would reduce vehicle mileage a significant 15-25%, but makes no other effort to quantify other market distortions. Mills main conclusion is that urban growth controls are harmful because they increase housing costs, based on evidence from cities such as Delhi and Bombay, although these examples have little to do with North American Smart Growth policies. His analysis overlooks the full potential benefits of Smart Growth (improved housing and transportation options, economic savings to governments and consumers, increased housing affordability, increased land use accessibility and related productivity gains, and environmental benefits from greenspace preservation). As an urban economist concerned with social welfare it is disappointing that Mills makes so little effort to investigate the economic costs of sprawl (for example, he could evaluate research indicating that sprawl increases public service costs, transport costs, crash risk, or environmental impacts) or the impacts that market-justified land use and transport policy reforms would have on development and travel patterns, whether some consumers might prefer Smart Growth development patterns, and whether Smart Growth strategies might achieve housing affordability and equity objectives.

Evaluating Criticism of Smart Growth
63
Randal O’Toole Randal O’Toole’s has written various reports which claim that Smart Growth is wasteful and harmful. His criticism is based on the assumption that “everybody” wants to live in automobile-dependent suburbs, so Smart Growth strategies fail, and if successful they harm residents. He extrapolates past trends that increased per capita vehicle use, and ignores changing demographic, economic and market factors that are likely to increase demand for Smart Growth communities (Litman, 2005b). He highlights any negative trends in Smart Growth communities while ignoring all positive effects. O’Toole claims that Smart Growth increases traffic congestion, accidents, pollution, crime and poverty based on selected data and analysis. In each case his claims are overall wrong. For example, although increased density tends to increase congestion intensity, it reduces per capita congestion delays due to shorter travel distances and improved travel options. Similarly, density increases traffic crash frequency but reduces severity, resulting in lower traffic fatality rates in Smart Growth locations. Smart Growth includes many other features besides density increases that improve land use accessibility and travel options, which can minimize the potential problems he identifies. O’Toole claims that smart growth reduces housing affordability, citing higher housing costs in Portland and other smart growth cities. But, as discussed earlier, many other factors affect housing affordability, particularly a community’s overall attractiveness. Smart growth policies tend to be implemented in rapidly-growing, attractive urban regions where housing prices tend to rise anyway. High housing prices simply reflect the value that consumers place on these attributes. Smart growth can help increase housing affordability in many ways, by reducing the amount of land required per housing unit, by reducing parking facility costs, and by reducing household transportation costs. O’Toole (2001 and 2007) criticizes Portland area planning, particularly transit oriented development and urban growth boundaries, and supports incentive based neighborhood level planning. He actually supports market-based Smart Growth strategies such as development fees, road pricing and tax reforms, but does not consider whether other Smart Growth strategies may be justified on second-best grounds if market-based reforms are not implemented, or to achieve other planning objectives such as improved accessibility for non-drivers. He assumes that neighborhood-level planning would be more efficient and equitable, ignoring problems such local competition for tax revenue or to exclude disadvantaged groups. Analysis by Lewyn (2007) indicates that many of O’Tooles specific claims are incomplete, biased and inaccurate, such as that rail transit investments failed to affect Portland travel and land use development patterns, and that Smart Growth policies significantly increased congestion and housing inaffordability. O’Toole’s analysis of rail transit impacts (2004 and 2005) contains a variety of distortions and errors (Litman, 2004c; Litman, 2005a). For example, his studies fail to consider factors such as city size, rail transit system size and population growth rates when comparing cities, and the full cost of accommodating increased automobile traffic when comparing transit and automobile cost effectiveness.

Evaluating Criticism of Smart Growth
64
Critics Perspectives Critics tend to fall into different categories representing different motivations and perspectives.
Self Interest Some critics object to Smart Growth because they (or an organization they represent) benefits from existing development practices that are threatened by Smart Growth. For example, residents of lower-density suburban communities may believe that they benefit from policies that exclude low-income people. Automobile-related industries (vehicle manufacturing and maintenance, petroleum and road building), suburban developers, and big-box retailers may favor automobile dependency and sprawl out of self interest. Such critics may overlook indirect impacts, broader social issues, and opportunities to benefit from Smart Growth. An appropriate response is to find creative ways to address specific concerns and make Smart Growth programs attractive to these groups. For example, positive incentives to reward communities that implement Smart Growth policies, and governments can work with industries to insure that Smart Growth can be as profitable as sprawl. Some concerns are misplaced (for example, the economic and security risks of increasing the amount of affordable housing in a community are often exaggerated), and so can be addressed by providing accurate information.
Ideological Some critics object to Smart Growth on ideological grounds. They assume Smart Growth consists of government interventions in the free market (O’Toole 2000). They tend to accept the following neoclassic economics assumptions with little questions:
• People are self-interested consumers whose only goal is to maximize consumption of goods. • Consumers always consider more, bigger and newer to be better. • Goods and services are only of value when traded in a commercial market. • Existing markets are essentially efficient and fair, so current consumption patterns reflect
consumer preferences. In fact, most economists realize that these assumptions are unrealistic. Economic Man (i.e., the model of human behavior assumed in neoclassic economics) does not really exist. For example, most people place a high value on things other than consumption of goods and services, including community, generosity, beauty and dignity. There is an optimal level of consumption of most goods (e.g., house size, annual vehicle mileage, tourist travel) beyond which additional consumption is harmful to consumers. Many non-market goods have great value. And existing markets have many distortions, so current consumption patterns do not necessarily reflect consumer preferences. As described earlier, even most market corrections that rely on positive incentives, such as Parking Cash Out, can result in significant changes in behavior. Ideologically-based critics often support some Smart Growth strategies. For example, Cox (2000) advocates road pricing, commute trip reduction programs and transit fare reductions. Mills (1999) advocates road pricing or a significant fuel tax increase to internalize costs. These critics might be persuaded to support additional market-based Smart Growth strategies, as described in the box below. A key issue of debate with critics

Evaluating Criticism of Smart Growth
65
with this perspective is the degree to which blunter Smart Growth strategies may be justified on second-best grounds until market-reforms are implemented. For example, both Smart Growth supporters and critics agree that road and parking pricing are justified to improve transport system efficiency, but supporters may advocate transit subsidies, land use regulations and other mobility management strategies until market reforms are implemented, while critics may oppose such strategies. Market-Based Smart Growth Strategies The following strategies reflect market principles and deserve support by free-market advocates.
• More flexible parking requirements.
• Fewer restrictions on building type, minimum lot size, setback, density, etc.
• Road and parking pricing, and other pricing reforms (Pay-As-You-Drive insurance, mileage-based lease fees and weight-distance fees) provided they more accurately reflect costs.
• Cost-based pricing of public services (development, utility and tax rates that reflect the relative cost of providing services for different development patterns and locations).
• Least-cost transportation planning (allowing transport funds to be spent on the most cost effective option).
• Limit public subsidy of new infrastructure (utility services, roads, new schools) in greenfield areas if excess capacity exists within urban areas.
• Commute trip reduction programs (provided that participation is mainly voluntary and relies mainly on positive incentives).
• Vehicle travel reduction strategies such as Parking Cash Out, which give consumers a positive incentive to use more efficient transport options.
• Support for telecommuting, flextime and compressed workweeks.
• Busways, HOV priority systems and rideshare programs.
• Improved transit services, reduced transit fares and more convenient payment systems.
• Institutional reforms that encourage transportation market diversity and innovation (such as more flexible motor carrier regulations).
• Context sensitive roadway design, so facilities reflect local needs (as opposed to rigid federal and state standards).
• More neutral tax policies that provide equal benefits to non-drivers as well as drivers, and renters compared with home owners.
• Better tools for evaluating the full impacts of land use and transportation decisions.
• Improved training of land use and transportation professionals concerning comprehensive analysis of impacts and application of innovative solutions to transportation problems.

Evaluating Criticism of Smart Growth
66
Legitimate Criticisms Some concerns raised by critics are legitimate, at least to some degree, and may justify adjustments to Smart Growth programs. Table 19 summarizes these criticisms and their appropriate responses. Most of these concerns are already recognized by Smart Growth proponents and are being addressed. None appear to be fatal flaws that justify a significant reduction in Smart Growth efforts, and many justify more integrated Smart Growth programs to ensure that potential problems are offset. Table 19 Legitimate Criticisms And Appropriate Responses
Legitimate Criticism Appropriate Response Proponents sometimes exaggerate the benefits of Smart Growth and the costs of sprawl.
Support research to identify true benefits and costs, and policies that reflect legitimate arguments.
There is uncertainty about the full costs of sprawl. Continue research, and implement strategies that reflect market principles or help achieve strategic community goals.
Smart Growth can have unintended consequences. Support research to better understand impacts, and develop responsive Smart Growth policies and plans.
By itself, increased development density can increase traffic congestion and local air pollution emissions.
Smart Growth programs should include additional strategies besides increased development density to improve accessibility, encourage modal shifts and reduce urban automobile travel.
Regulation-based strategies reduce consumer options and can have unintended consequences.
As much as possible, apply Smart Growth strategies that reduce regulations and rely on market-based incentives and positive rewards to increase density, preserve greenspace, reduce vehicle travel, etc.
Many consumers value lower-density suburban homes and automobile-dependent lifestyles.
Allow consumers to choose by providing better land use and transport options and reducing subsidies that favor sprawl.
Transit investments are not a cost effective way to reduce traffic congestion and air pollution.
Transit becomes more cost effective if supported by other Smart Growth strategies that increase ridership and operating efficiency, and if evaluated using a comprehensive framework that considers total benefits.
Automobiles are the most efficient modes for many trips.
Develop accessible communities and balanced transport systems that allow consumers to choose the best travel option for each type of trip. Recognize that real efficiency accounts for all social impacts, not just from a single traveler’s perspective.
Strategies that reduce land supply available for development can increase housing costs.
Implement Smart Growth strategies that increase housing and transportation affordability.
The economic costs of farmland preservation are not a justification for restricting urban expansion.
Farmland and other greenspace preservation may be important for a variety of economic, social and environmental reasons.
This table identifies legitimate criticisms with Smart Growth and their possible responses.

Evaluating Criticism of Smart Growth
67
Conclusions Smart Growth is a set of planning principles intended to increase land use and transportation system efficiency. An effective Smart Growth program includes various integrated strategies, many of which reflect market principles and offer positive rewards for choosing more efficient land use and transportation patterns. Such programs can help address many problems and provide many benefits. Critics argue that Smart Growth is unfair, ineffective and unjustified, but they only recognize a few Smart Growth benefits, misrepresent issues and use selected examples and information. They claim to have evidence that Smart Growth increases traffic congestion, air pollution, accidents, public service costs, housing inaffordability, crime and poverty. In each case the critics select data and measurement units that support their arguments, while ignoring alternative perspectives and information. In many cases their data is wrong or out of context. Critics assume that current markets are fair and efficient, ignoring existing distortions that encourage sprawl, and ways that many Smart Growth strategies correct these distortions, increasing consumer options, economic efficiency and equity. They argue that consumers want large single-family homes in automobile-dependent communities, although there is abundant evidence that many people will choose other housing and transport options if given suitable options and incentives. Critics do not seem to understand the concept of accessibility, and so evaluate transport system quality simply in terms of vehicle traffic congestion, ignoring other factors such as the geographic distribution of destinations, roadway connectivity and transportation system diversity. Although it is currently difficult to quantify many social benefits of Smart Growth, such as the value to communities of greenspace preservation and improved transportation options for non-drivers, there is little doubt that such benefits exist. Put another way, there is little doubt that society benefits overall if public policies do a better job of accommodating people who want to live in more clustered, mixed-use, multi-modal neighborhoods and reduce their automobile travel, but who currently face barriers due to inadequate consumer options or market distortions that favor sprawl. Many objections raised by critics are actually justifications for more comprehensive Smart Growth. For example, critics argue that increased development density increases traffic congestion, which is a justification for implementing additional Smart Growth strategies to improve accessibility and encourage use of non-automobile modes in urban and suburban areas experiencing growth in order to reduce the traffic congestion problems that will otherwise occur. Although critics deride Smart Growth in general, they often endorse individual Smart Growth strategies in recognition that they address problems and increase market efficiency. Legitimate skepticism is helpful. Critics identify concerns that should be addressed to optimize Smart Growth. However, the criticisms evaluated in this paper do not diminish the overall justification for Smart Growth.

Evaluating Criticism of Smart Growth
68
Acknowledgements A sincere thanks to the people who helped produce this paper, particularly Jon Cecil, Reid Ewing, Jay Hoekstra, Peter Jacobsen, Mason Gaffney, Nathan Landau, JoAnn Woodhall and Jeffery Smith. Any errors are my own.
References and Resources A spreadsheet containing the calculations used in this report is available on request from the author ([email protected]). 1000 Friends (1999), “The Debate Over Density: Do Four-Plexes Cause Cannibalism” Landmark, 1000 Friends of Oregon (www.friends.org); at www.onethousandfriendsoforegon.org/issues/density.html. 1000 Friends (1999b), Myths & Facts About Oregon’s Urban Growth Boundaries, 1000 Friends of Oregon (www.friends.org/resources/myths.html). AJHP (2003), “Special Issue: Health Promoting Community Design,” American Journal of Health Promotion (www.healthpromotionjournal.com), Vol. 18, No. 1, Sept./Oct. 2003, AJPH (2003), “Built Environment and Health,” American Journal of Public Health (www.ajph.org), Vol. 93, No. 9, Sept. 2003. Many of these articles are available at the Active Living By Design (www.activelivingbydesign.com) website. Alex Anas, Richard Arnott and Kenneth Small (1997), Urban Spatial Structure, University of California Transportation Center (www.uctc.net), No. 357. APA (2002), Policy Guide on Smart Growth, American Planning Association (www.planning.org/policyguides/smartgrowth.htm). APA (2003), Planning and Designing the Physically Active Community: A Resource List, American Planning Association (www.planning.org/physicallyactive/pdf/ReferenceList.pdf). ARC (2005), A Community Choices Quality Growth Toolkit, Atlanta Regional Commission (www.atlantaregional.com/qualitygrowth/planning/Toolkits/TOD_TOOL.pdf). Danielle Arigoni (2001), Affordable Housing and Smart Growth: Making the Connections, Subgroup on Affordable Housing, Smart Growth Network (www.smartgrowth.org) and National Neighborhood Coalition (www.neighborhoodcoalition.org). G.B. Arrington (2000), Responding to Wendell Cox: A Report by G.B. Arrington, Center for Transportation Excellence (www.cfte.org). Crysttal Atkins and Michael Coleman (1997), “Influence of Traffic Calming on Emergency Response Times,” ITE Journal, August 1997, pp. 42-47; www.trans.ci.portland.or.us/Traffic_Management/trafficcalming Laurence Aurbach (2003), “Debate between Wendell Cox and Andrés Duany (at the Preserving the American Dream Conference)” The Town Paper, (www.tndtownpaper.com/CoxDuany.htm).

Evaluating Criticism of Smart Growth
69
Constance Beaumont and Elizabeth Pianca (2000), Historic Neighborhood Schools in the Age of Sprawl- Why Johnny Can’t Walk to School, National Trust for Historic Preservation (www.nationaltrust.org). Judith Bell and Larry Cohen (2009), The Transportation Prescription: Bold New Ideas for Healthy, Equitable Transportation Reform in America, PolicyLink and the Prevention Institute Convergence Partnership (www.convergencepartnership.org/transportationhealthandequity). F. Kaid Benfield, Matthew D. Raimi, & Donald Chen (1999), Once There Were Greenfields: How Urban Sprawl is Undermining America’s Environment, Economy and Social Fabric, Natural Resources Defense Council & Surface Transportation Policy Project (www.transact.org). Eugenie L. Birch (2005), Who Lives Downtown?, Brookings Institute (www.brookings.edu). Pamela Blais (1995), The Economics of Urban Form, in Appendix E of Greater Toronto, Greater Toronto Area Task Force (Toronto). Brian S. Bochner (2000), “Smart Growth Tools for Transportation,” ITE Journal, Vol. 70, No. 11, November 2000, pp. 26-29. Robert D. Bullard, Glenn S. Johnson and Angel O. Torres (2000), Race, Equity, and Smart Growth: Why People of Color Must Speak for Themselves, Environmental Justice Resource Center at Clark Atlanta University (www.ejrc.cau.edu). Robert Burchell, et al. (1998), The Costs of Sprawl – Revisited, TCRP Report 39, Transportation Research Board (www.trb.org). Robert Burchell, Anthony Downs, Barbara McCann and Sahan Mukherji (2005), Sprawl Costs: Economic Impacts of Unchecked Development, Island Press (www.islandpress.org). Cambridge Systematics (1992), The LUTRAQ Alternative /Analysis of Alternatives, 1000 Friends of Oregon (www.friends.org). Cambridge Systematics (1994), The Effects of Land Use and Travel Demand Management Strategies on Commuting Behavior, Travel Model Improvement Program, USDOT (www.bts.gov/tmip). Julie Campoli and Alex MacLean (2002), Visualizing Density: A Catalog Illustrating the Density of Residential Neighborhoods, Lincoln Institute of Land Policy (www.lincolninst.edu). Cascade Policy Foundation (www.cascadepolicy.org) is an independent advocacy organization that opposes Smart Growth. CCAP (2003), State and Local Leadership On Transportation And Climate Change, Center for Clean Air Policy (www.ccap.org). CDC (2003), “Deaths: Preliminary Data for 2001.” National Vital Statistics Reports, Vol. 51, No 5, Center of Disease Control and Prevention, National Center of Health Statistics (www.cdc.gov/nchs).

Evaluating Criticism of Smart Growth
70
Central Ontario Smart Growth Panel (2003), Shape The Future: Central Ontario Smart Growth Panel Final Report, Central Ontario Smart Growth, Ontario Ministry of Municipal Affairs and Housing (www.smartgrowth.gov.on.ca). CFTE (2003), Responding To Critics, Center For Transportation Excellence (www.cfte.org). Robert Cervero and Mark Hansen (2000), Road Supply-Demand Relationships: Sorting Out Casual Linkages, Institute of Transportation Studies, University of California (www.uctc.net). John A. Charles and Michael Barton (2003), The Mythical World of Transit-Oriented Development, Cascade Policy Foundation (www.cascadepolicy.org). Congress of New Urbanism (www.cnu.org), is an organization of architects, developers, planners, and others involved in the creation of cities and towns to promote the application of New Urbanist principles. Wendell Cox (2000), A Common Sense Approach to Transportation In the Atlanta Region, Georgia Public Policy Foundation (www.gppf.org). Wendell Cox (2001), “Smart Growth Pros & Cons,” Demographia (www.demographia.com/db-smgprocon.htm). Wendell Cox (2001), Smart Growth: Delusion, Not Vision: Wendell Cox Closing Statement at Railvolution Conference, Demographia (www.demographia.com/db-sfrailvolu.htm). Wendell Cox (2003a), How Higher Density Makes Traffic Worse, Public Purpose (www.publicpurpose.com/pp57-density.htm). Wendell Cox (2003b), Debunking Friday the 13th: 13 Myths of Urban Sprawl, Heartland Institute (www.heartland.org). Wendell Cox (2003c), Sprawl and Obesity in Chicago: Why All the Fuss?, Heartland Institute (www.heartland.org). Wendell Cox (no date), The Costs of Smart Growth Revisited: Consumer Expenditures Lower Where Sprawl is Greater, Demographia (www.demographia.com/db-ce2000.htm). Wendell Cox and Joshua Utt (2004), The Costs of Sprawl Reconsidered: What the Data Really Show, Backgrounder #1770, Heritage Foundation (www.heritage.org). CTOD and CNT (2006), The Affordability Index: A New Tool for Measuring the True Affordability of a Housing Choice, Center for Transit-Oriented Development and the Center for Neighborhood Technology, Brookings Institute (www.brookings.edu/metro/umi/20060127_affindex.pdf). Deborah Dagang (1995), Transportation Impact Factors – Qualified Relationships Found in the Literature, JHK & Associates for Oregon DOT. Anthony Downs (2003), The Impacts of Smart Growth Upon the Economy, Land Use Institute (www.anthonydowns.com/smartgrowtheconomy.htm).

Evaluating Criticism of Smart Growth
71
Robert Dunphy (2003), We Knew It: Smart Growth Helps Lower Consumer “Location” Costs for Housing, Transportation, Urban Land Institute and Smart Growth Network (www.smartgrowth.net/Home/sg_Home_fst.html). Alan Durning (1996), The Car and the City, Northwest Environment Watch, now called the Sightline Institute (www.sightline.org). Ecotec Research and Transportation Planning Associates (1993), Reducing Transport Emissions Through Planning, Dept. of the Environment, HMSO (London). Mark Eppli and Charles C. Tu (2000), Valuing the New Urbanism; The Impact of New Urbanism on Prices of Single-Family Homes, Urban Land Institute (www.uli.org). Reid Ewing (1997), “Is Los Angeles-Style Sprawl Desirable?” in Journal of the American Planning Association, Vol. 63, No. 1, Winter 1997, pp. 95-126. Reid Ewing, Rolf Pendall and Don Chen (2002), Measuring Sprawl and Its Impacts, Smart Growth America (www.smartgrowthamerica.org). Reid Ewing, Richard A. Schieber, Charles V. Zegeer (2003), “Urban Sprawl As A Risk Factor In Motor Vehicle Occupant And Pedestrian Fatalities,” American Journal of Public Health (www.ajph.org). R. Ewing, T. Schmid, R. Killingsworth, A. Zlot, and S. Raudenbush (2003), “Effects of Urban Sprawl on Physical Activity, Obesity, and Morbidity: Analysis of BRFSS Data for 1998-2000,” American Journal of Health Promotion (www.healthpromotionjournal.com), September/October, available at www.smartgrowth.umd.edu/pdf/JournalArticle.pdf. James Frank (1989), The Costs of Alternative Development Patterns, Urban Land Institute (www.udi.org). John Fregonese and Lynn Peterson (2002), Correcting the Record: Comparing Development Policy in Portland, Oregon and Atlanta, Georgia, Congress for the New Urbanism (www.cnu.org). Howard Frumkin, Lawrence Frank and Richard Jackson (2004), Urban Sprawl and Public Health: Designing, Planning, and Building For Healthier Communities, Island Press (www.islandpress.org). Lawrence Frank, Sarah Kavage and Todd Litman (2006), Promoting Public Health Through Smart Growth: Building Healthier Communities Through Transportation And Land Use Policies, Smart Growth BC (www.smartgrowth.bc.ca); available at www.smartgrowth.bc.ca/downloads/SGBC_Health%20Report%20Final.pdf. George Galster, et al. (2001), “Wrestling Sprawl to the Ground: Defining and Measuring an Elusive Concept,” Housing Policy Debate, Vol. 12, Issue 4, Fannie Mae Foundation (www.fanniemaefoundation.org/programs/hpd/pdf/HPD_1204_galster.pdf), pp. 681-717. GAO (2001), Environmental Protection: Federal Incentives Could Help Promote Land Use That Protects Air and Water Quality, General Accounting Office, GAO-O2-12 (www.gao.gov/cgi-bin/getrpt?GAO-02-12).

Evaluating Criticism of Smart Growth
72
Edward Glaeser and Matthew Kahn (2003), Sprawl and Smart Growth, Chapter in the Handbook of Urban and Regional Economics, Center for Operations Research and Econometrics (www.core.ucl.ac.be:16080/staff/thisseHandbook/Sprawl%20and%20Urban%20Growth_PPR.pdf). David Goldberg (2003), “Affordable Housing: Smart Growth Techniques Pave the Way,” Realtor Mag Online (www.realtor.org), Summer. Peter Gordon and Harry Richardson (1997), “Are Compact Cities a Desirable Planning Goal?,” Journal of the American Planning Association, Vol. 63, No. 1, Winter 1997, pp. 94-126. Peter Gordon and Harry W. Richardson (1998), A Critique of New Urbanism, Presented at the Meeting of the American Collegiate Schools of Planning (www-rcf.usc.edu/~pgordon/urbanism.html). Peter Gordon and Harry Richardson (2000), Critiquing Sprawl’s Critics, Cato Foundation (www.cato.org). Genevieve Giuliano (1991), “Is Jobs-Housing Balance a Transportation Issue?,” Transportation Research Record 1305, TRB (www.trb.org). Edward Glaeser and Bruce Sacerdote (1999), “Why is There More Crime in Cities?” Journal of Political Economy, Vol. 107, pp. 225-258. Joseph Gyourko and Anita A. Summers (1997), A New Strategy for Helping Cities Pay for the Poor, Policy Brief 18, Brookings Institute (www.brookingsinstitution.org). Don Halligan (2000), “Maryland’s Smart Growth and Neighborhood Conservation Initiative,” ITE Journal, Vol. 70, No. 11, November 2000, pp. 36-38. Mark E. Hanson (1992), “Automobile Subsidies and Land Use: Estimates and Policy Responses,” Journal of the American Planning Association (www.planning.org), Vol. 58, Issue 1, Winter 1992. Andrew F. Haughwout (2000), “The Paradox of Infrastructure Investment,” Brookings Review (www.brookings.edu/dybdocroot/press/REVIEW/summer2000/haughwout.htm), Summer 2000, pp. 40-43. Patrick Hare (1995), Clunker Mortgages and Transportation Redlining; How the Mortgage Banking Industry Unknowingly Drains Cities and Spreads Sprawl, Hare Planning, (available at www.vtpi.org). Heartland Institute (www.heartland.org) is an independent advocacy organization that opposes Smart Growth. Bill Hillier and Ozlem Sahbaz (2006), High Resolution Analysis of Crime Patterns in Urban Street Networks: An Initial Statistical Sketch From An Ongoing Study Of A London Borough, University College London (www.spacesyntax.tudelft.nl/media/Long%20papers%20I/hilliersahbaz.pdf).

Evaluating Criticism of Smart Growth
73
Joel S. Hirschhorn (2000), Growing Pains; Quality of Life in the New Economy, National Governor’s Association (www.nga.org). Joel S. Hirschhorn (2001), New Community Design to the Rescue, National Governor’s Association (www.nga.org). John Holtzclaw (1004), Using Residential Patterns and Transit to Decrease Auto Dependence and Costs, National Resources Defense Council www.nrdc.org, funded by the California Home Energy Efficiency Rating Systems. James W. Hughes and Joseph J. Seneca (2004), The Beginning of the End of Sprawl?, Edward J. Bloustein School of Planning and Public Policy, Rutgers University (www.policy.rutgers.edu/sprawl.pdf). John D. Hunt (2001), A Stated Preference Analysis of Sensitivities to Elements of Transportation and Urban Form, Transportation Research Board Annual Meeting (www.trb.org), 2001. ICCMA (1998), Why Smart Growth: A Primer, International City/County Management Association, Smart Growth Network and USEPA (www.epa.gov/smartgrowth). IEDC (2006), Economic Development and Smart Growth: Case Studies on the Connections Between Smart Growth Development and Jobs, Wealth, and Quality of Life in Communities, International Economic Development Council (www.iedconline.org); available at www.iedconline.org/Downloads/Smart_Growth.pdf. ITE (2003), Smart Growth Transportation Guidelines, Smart Growth Task Force, Institute of Transportation Engineers (www.ite.org). R. J. Jackson and C. Kochtitzky (2001), Creating A Healthy Environment: The Impact of the Built Environment on Public Health, Sprawl Watch Clearinghouse (www.sprawlwatch.org/health.pdf). JHK & Associates (1995), Transportation-Related Land Use Strategies to Minimize Motor Vehicle Emissions, California Air Resources Board (www.arb.ca.gov) available at www.sustainable.doe.gov/pdf/arb-report/arb-overview.htm. Wenya Jia and Martin Wachs (1998), “Parking and Affordable Housing,” Access, Vol. 13, Fall 1998 (www.uctc.net), pp. 22-25. Maureen Kennedy and Paul Leonard (2001), Dealing with Neighborhood Change: A Primer on Gentrification and Policy Choices, The Brookings Institution Center on Urban and Metropolitan Policy and PolicyLink (www.policylink.org). Richard Killingsworth, A. De Nazelle and R Bell (2003), “Building A New Paradigm: Improving Public Health Through Transportation,” ITE Journal, Vol. 73, No. 6 (www.ite.org), June 2003, pp. 28-32. Joel Kotkin (2005), “Portland Lost In Its Own Reflection,” The Oregonian, December 11, 2005; available at www.joelkotkin.com. City of Lancaster (2002), Development Fees (Chapter 15.64), City of Lancaster (www.cityoflancasterca.org) New Rules (www.newrules.org/environment/lancaster.html).

Evaluating Criticism of Smart Growth
74
Christopher B. Leinberger (2008), “The Next Slum? The Subprime Crisis Is Just The Tip Of The Iceberg. Fudamental Changes In American Life May Turn Today’s McMansion Into Tomorrow’s Tenements,” The Atlantic, March 2008; at www.theatlantic.com/doc/print/200803/subprime. Jonathan Levine (2006), Zoned Out: Regulation, Markets, and Choices in Transportation and Metropolitan Land-Use, Resources for the Future (www.rff.org). David Levinson (1998), “Accessibility and the Journey to Work,” Journal of Transport Geography, Vol. 6, No. 1, March 1998, pp. 11-21. David Levinson and Ajay Kumar (1997), “Density and the Journey to Work,” Growth and Change, Vol. 28, No. 2, pp. 147-72 (www.ce.umn.edu/~levinson/papers-pdf/doc-density.pdf). Michael Lewyn (2000a), “Why Sprawl Is A Conservative Issue,” Bulletin of Science, Technology & Society, Vol. 20, No. 4 (www.sagepub.co.uk). Michael Lewyn (2000b), “Suburban Sprawl: Not Just An Environmental Issue,” Marquette Law Review, Vol. 84, No. 2 (http://ssrn.com/abstract=851165), Winter 2000. Michael Lewyn (2005a), “How Overregulation Creates Sprawl (Even in a City without Zoning),” Wayne Law Review, Vol. 50, p. 1171, 2005; at http://ssrn.com/abstract=837244. Michael Lewyn (2005b), I Beat Up On Joel Kotkin Beating Up On Portland, Tripod Blog (http://lewyn.tripod.com/blog). Mike Lewyn (2007), Debunking Cato: Why Planning in Portland Works Better Than the Analysis of Its Chief Neo-Libertarian Critic, Congress for New Urbanism (www.cnu.org); at http://cnu.org/sites/files/DebunkingCato.pdf. Todd Litman (1998), Parking Requirement Impacts on Housing Affordability, VTPI (www.vtpi.org); at www.vtpi.org/park-hou.pdf. Todd Litman (2001), “Generated Traffic: Implications for Transport Planning,” ITE Journal, Vol. 71, No. 4, Institute of Transportation Engineers (www.ite.org), April 2001, pp. 38-47; at www.vtpi.org/gentraf.pdf. Todd Litman (2002), An Economic Evaluation of Smart Growth and TDM: Social Welfare and Equity Impacts of Efforts to Reduce Sprawl and Automobile Dependency, VTPI (www.vtpi.org). Todd Litman (2003b), If Health Matters: Integrating Public Health Objectives in Transportation Planning, VTPI (www.vtpi.org). Todd Litman (2004a), Comprehensive Evaluation of Rail Transit Benefits, VTPI (www.vtpi.org); www.vtpi.org/railben.pdf. Todd Litman (2004b), Understanding Smart Growth Savings, Victoria Transport Policy Institute (www.vtpi.org); at www.vtpi.org/sg_save.pdf. Todd Litman (2004c), Evaluating Research Quality, Victoria Transport Policy Institute (www.vtpi.org); at www.vtpi.org/resqual.pdf.

Evaluating Criticism of Smart Growth
75
Todd Litman (2005a), Evaluating Rail Transit Criticism, Victoria Transport Policy Institute (www.vtpi.org); at www.vtpi.org/railcrit.pdf. Todd Litman (2005b), The Future Isn’t What It Used To Be, Victoria Transport Policy Institute (www.vtpi.org); at www.vtpi.org/future.pdf. Todd Litman (2005c), Land Use Impacts On Transportation, Victoria Transport Policy Institute (www.vtpi.org); www.vtpi.org/landtravel.pdf. Todd Litman (2006), Socially Optimal Transport Prices and Markets, VTPI (www.vtpi.org); www.vtpi.org/sotpm.pdf. Todd Litman (2006b), Smart Congestion Reductions: Reevaluating The Role Of Highway Expansion For Improving Urban Transportation, VTPI (www.vtpi.org); at www.vtpi.org/cong_relief.pdf. Todd Litman (2007), Evaluating Accessibility for Transportation Planning, Victoria Transport Policy Institute (www.vtpi.org); at www.vtpi.org/access.pdf . Todd Litman (2008), Transportation Cost And Benefit Analysis Guidebook, VTPI (www.vtpi.org); at www.vtpi.org/tca . Todd Litman (2008b), Transportation Affordability: Evaluation and Improvement Strategies, VTPI (www.vtpi.org); at www.vtpi.org/affordability.pdf. Todd Litman (2009), Where We Want To Be: Household Location Preferences And Their Implications For Smart Growth, Victoria Transport Policy Institute (www.vtpi.org); at www.vtpi.org/sgcp.pdf. William Lucy (2002), Danger in Exurbia: Outer Suburbs More Dangerous Than Cities, University of Virginia (www.virginia.edu); at http://arch.virginia.edu/exurbia/death-in-exurbia.pdf. Lucy and Phillips (2006), Tomorrow's Cities: Tomorrow's Suburbs, Planners Press (www.planning.org). James M. McElfish (2007), Ten Things Wrong With Sprawl, Environmental Law Institute (www.elistore.org/Data/products/d17__02.pdf). Daniel R. Mandelker (2000), Managing Space to Manage Growth, Land Use Law, Washington University School of Law (http://law.wustl.edu/landuselaw/growth.html). Barbara McCann (2000), Driven to Spend; The Impact of Sprawl on Household Transportation Expenses, STPP (www.transact.org). James M. McElfish (2007), Ten Things Wrong With Sprawl, Environmental Law Institute (www.elistore.org/Data/products/d17__02.pdf).

Evaluating Criticism of Smart Growth
76
Nancy McGuckin and Nanda Srinivasan (2003), Journey-to-Work Trends in the United States and its Major Metropolitan Areas: 1960-2000, FHWA-EP-03-058, Census Data for Transportation Planning, TRB (www.trbcensus.com). Eric Miller, et al (2004), Travel and Housing Costs in the Greater Toronto Area: 1986-1996, Neptis Foundation (www.neptis.org). Edwin S. Mills (1999), “Truly Smart Growth,” Illinois Real Estate Letter, Vol. 13, No. 3, Summer. Joseph Molinaro (2003), Higher Density, Mixed-Use, Walkable Neighborhoods - Do Interested Customers Exist?, National Association Of Realtors (www.realtor.org). Terry Moore and Paul Thorsnes (2004), The Transportation/Land Use Connection, Planning Advisory Service Report 448/449, American Planning Association (www.planning.org). Frank R. Moretti (1999), Smart Growth; A Wolf in Sheep’s Clothing?, The Road Information Program (www.tripnet.org/smartgrowth.htm). Anne Vernez Moudon and Paul Mitchell Hess (2000), “Suburban Clusters: The Nucleation of Multifamily Housing in Suburban Areas of the Central Puget Sound,” Journal of American Planning Association, Vol. 66, No. 3 (www.planning.org), Summer 2000, pp. 243-264. MSN (2003), “America’s Most Drivable Cities,” Microsoft News: House and Home (www.houseandhome.msn.com) 8 July 2003. Mark Muro and Robert Puentes (2004), Investing In A Better Future: A Review Of The Fiscal And Competitive Advantages Of Smarter Growth Development Patterns, Brookings Institute (www.brookings.edu). Dowell Myers and Elizabeth Gearin (2001), Current Preferences and Future Demand for Denser Residential Environments, Housing Policy Debate, Vol. 12, Issue 4, Fannie Mae Foundation (www.fanniemaefoundation.org/programs/hpd/v12i4-myers.shtml). NAHB (various years), Smart Growth Case Studies, National Association of Home Builders (www.nahb.org). Peter Newman and Jeff Kenworthy (1999), Sustainability and Cities; Overcoming Automobile Dependency, Island Press (www.islandpress.org). Arthur C. Nelson (2002), “Effects of Urban Containment on Housing Prices and Landowner Behavior,” Land Lines, Vol. 12, No. 3, Lincoln Institute for Land Policy (www.lincolninst.edu) May 2000. Arthur C. Nelson, Rolf Pendall, Casy Dawkins and Gerrit Knaap (2002), The Link Between Growth Management and Housing Affordability: The Academic Evidence, Brookings Institution Center on Urban and Metropolitan Policy (www.brook.edu). Randal O’Toole (2000), Is Urban Planning “Creeping Socialism”?, The Independent Review, Vo. IV, No. 4 (www.independent.org).

Evaluating Criticism of Smart Growth
77
Randal O’Toole(2001), The Vanishing Automobile and Other Urban Myths: How Smart Growth Will Harm American Cities, Thoreau Institute (www.ti.org). Randal O’Toole (2003), In Defense of Strip Development, Vanishing Automobile Update #42, Thoreau Institute (www.ti.org). Randal O’Toole (2003), Transportation Costs And The American Dream, Reason Foundation (www.rppi.org). Randal O’Toole (2003), San Jose Demonstrates the Limits of Urban Growth Boundaries and Urban Rail, Policy Study No. 309, Reason Public Policy Institute (www.reason.org). Randal O’Toole (2004), Great Rail Disasters; The Impact Of Rail Transit On Urban Livability, Reason Public Policy Institute (www.rppi.org), 2004. Randal O’Toole (2005), Rail Disasters 2005; The Impact of Rail Transit on Transit Ridership, Independence Institute (www.independenceinstitute.org/articles/IP_7_2005.pdf). Cato Institute (2007), “Debunking Portland: The City That Doesn’t Work” (http://www.cato.org/pub_display.php?pub_id=8463 ). Ken Orski (2003), “The ‘Smart Growth’ Debate Continues,” Innovation Briefs, Vol. 14, No. 3, (www.innobriefs.com/editor/20030423smartgrowth.html), May/June 2003. Rod Park (2003), Letter To Stuart Foster, METRO, 15 July 2003. The Public Purpose (www.publicpurpose.com) and Demographia (www.demographia.com), are two websites by Wendell Cox that contain a variety of explicit and implied Smart Growth criticisms. QuantEcon, Smart Growth and Its Effects on Housing Markets: The New Segregation, National Center for Public Policy Research (www.nationalcenter.org), 2002. RailRoading America (www.railroadingamerica.com) is a website dedicated to criticizing urban rail systems. Reason Public Policy Institute (www.reason.org) is an independent advocacy organization that opposes Smart Growth. Reconnecting America (2004), Hidden In Plain Sight: Capturing The Demand For Housing Near Transit, Center for Transit-Oriented Development; Reconnecting America; Federal Transit Administration (www.fta.dot.gov); at www.reconnectingamerica.org/html/TOD/newReport.htm. Elizabeth Ridlington and Gigi Kellet (2003), Rail Transit Works: Light Rail Success Stories from Across the Country, MaryPIRG Foundation (www.marypirg.org), 9 June 2003. Ryan Russo (2001), Planning for Residential Parking: A Guide For Housing Developers and Planners, Non-Profit Housing Association of Northern California (www.nonprofithousing.org) and the Berkeley Program on Housing and Urban Policy (http://urbanpolicy.berkeley.edu).

Evaluating Criticism of Smart Growth
78
SACTRA (1999), Transport Investment, Transport Intensity and Economic Growth, Standing Advisory Committee on Trunk Road Assessment, Dept. of Environment, Transport and Regions (www.roads.detr.gov.uk/roadnetwork). SC (1999), “Rural and Urban Household Expenditure Patterns for 1996,” Rural and Small Town Canada Analysis Bulletin, Vol. 1, No. 4, Statistics Canada (www.statcan.ca), March 1999. Joel Schwartz (2002), CDC Hates the Suburbs, American Council on Science and Health (www.healthfactsandfears.com). Secret Worldwide Transit Cabal (www.transitcabal.org) provides information on commentary and analysis on urban transportation topics, including critiques of transit criticism. SGN (2001), What is Smart Growth?, Smart Growth Network, US Environmental Protection Agency (www.epa.gov/smartgrowth). SGN (2002), Getting To Smart Growth: 100 Policies for Implementation, Smart Growth Network (www.smartgrowth.org) and International City/County Management Association (www.icma.org). Smart Growth Network (www.smartgrowth.org) works to encourage development that serves the economy, community and the environment. Jeffery J. Smith and Thomas A. Gihring (2005), Financing Transit Systems Through Value Capture: An Annotated Bibliography (Previously titled: Does Public Transit Service Raise Nearby Property Values Enough To Pay For Itself Were The Value Captured?), Geonomy Society (www.progress.org/geonomy); at www.vtpi.org/smith.htm. Yan Song and Gerrit-Jan Knaap (2003), The Effects of New Urbanism on Housing Values: A Quantitative Assessment, National Center for Smart Growth Research and Education, University of Maryland (www.smartgrowth.umd.edu/research/POSTSongKnaap2.htm). A. Ann Sorensen and J. Dixon Esseks (1998), Living on the Edge; The Costs and Risks of Scatter Development, American Farmland Trust (http://farm.fic.niu.edu/cae/catter/index.htm). SPUR (1998), Reducing Housing Costs by Rethinking Parking Requirements, The San Francisco Planning and Urban Research Association (www.spur.org). Fotis Stathopoulos and Robert Noland (2003), “Induced Travel and Emissions from Traffic Flow Improvement Projects,” Transportation Research Record 1842, TRB (www.trb.org), pp. 57-63. STPP (1999), Why Are the Roads So Congested? An Analysis of the Texas Transportation Institute’s Data On Metropolitan Congestion, STPP (www.transact.org). STPP (2003), Transportation Costs and the American Dream: Why a Lack of Transportation Choices Strains the Family Budget and Hinders Home Ownership, Surface Transportation Policy Project (www.transact.org). The Thoreau Institute (www.ti.org), is an independent advocacy organization that opposes Smart Growth.

Evaluating Criticism of Smart Growth
79
TRB (1995), Expanding Metropolitan Highways: Implications for Air Quality and Energy Use, Committee for Study of Impacts of Highway Capacity Improvements on Air Quality and Energy Consumption, Transportation Research Board, Special Report #345, National Academy Press (Washington DC; www.trb.org), 1995. TRB (1997), Quantifying Congestion; Final Report and User’s Guide, NCHRP Project 7-13, Transportation Research Board (www.trb.org). TRB (2009), Driving and the Built Environment: The Effects of Compact Development on Motorized Travel, Energy Use, and CO2 Emissions, Special Report 298, Transportation Research Board (www.trb.org); at http://onlinepubs.trb.org/Onlinepubs/sr/sr298prepub.pdf. Tim Trohimovich (2001), Pricing Growth & Financing Smart Growth, 1000 Friends of Washington (www.1000friends.org). TTI (2000), Urban Mobility Study, Texas Transportation Institute (http://mobility.tamu.edu). ULI (Annual Reports), Emerging Trends in Real Estate, Urban Land Institute (www.uli.org); at www.uli.org/ResearchAndPublications/EmergingTrends/Americas.aspx. Richard Untermann and Anne Vernez Moudon (1989), Street Design: Reassessing the Safety, Sociability, and Economics of Streets, University of Washington (Seattle). US Census (2000), American Factfinder: Census 2000 Data, US Census (www.census.gov). USEPA (various dates), Smart Growth Publications Website, US Environmental Protection Agency, (www.epa.gov/smartgrowth/publications.htm). USEPA (2001), Improving Air Quality Through Land Use Activities, EPA420-R-01-001, Transportation and Air Quality Center, Office of Transportation and Air Quality Programs, USEPA (www.epa.gov/otaq/traq). USEPA (2003), Smart Growth Index (SGI) Model, US Environmental Protection Agency (www.epa.gov/smartgrowth/sgipilot.htm). This computer model predicts the impacts of land use factors such as density, mix, roadway design, transit service and regional accessibility have on personal travel. USEPA (2004), Characteristics and Performance of Regional Transportation Systems, Smart Growth Program, US Environmental Protection Agency (www.epa.gov/smartgrowth/performance2004final.pdf). Ronald Utt (2003), Obesity and Life Styles: Is it the Hamburger or your House?, Heritage Foundation (www.heritage.org/Research/SmartGrowth/wm343.cfm). Richard Voith (1999), Does the Tax Treatment of Housing Create An Incentive for Exclusionary Zoning and Increased Decentralization?, Federal Reserve Bank of Philadelphia (www.phil.frb.org/files/wps/1999/wp99-22.pdf). VTPI (2005), Online TDM Encyclopedia, Victoria Transport Policy Institute (www.vtpi.org).
Evaluating Criticism of Smart Growth
80
Robert W. Wassmer and Michelle C. Baass (2005), Does a More Centralized Urban Form Raise Housing Prices, APPAM “Suburbanization and its Discontents” conference; Journal of Policy Analysis and Management (forthcoming); California State University Sacramento (www.csus.edu/indiv/w/wassmerr/WassmerBaassSprawlHousing.pdf). Paul Weyrich and William Lind (2001), Twelve Anti-Transit Myths: A Conservative Critique, Free Congress Research and Education Center, Smart Growth America (www.smartgrowthamerica.org/weyrich3.pdf). www.vtpi.org/sgcritics.pdf