Are You suprised ?
108
Page | 1 Government of Tamil Nadu Department of Economics and Statistics Tiruvannamalai Sathanur Dam 2020-21 Deputy Director of Statistics, Tiruvannamalai DISTRICT STATISTICAL HAND BOOK
-
Upload
khangminh22 -
Category
Documents
-
view
0 -
download
0
Transcript of Are You suprised ?

P a g e | 1
Government of Tamil Nadu Department of Economics and Statistics
Tiruvannamalai
Arunachaleshwarar Temple
Sathanur Dam
2020-21
Deputy Director of Statistics,
Tiruvannamalai
DISTRICT STATISTICAL HAND BOOK
P a g e | 2

P a g e | 3

P a g e | 4
CONTENT
S.No Title Page No
I SALIENT FEATURES OF TIRUVANNAMALAI DISTRICT 5 - 6
II SALIENT FEATURES OF CENSUS STATISTICAL TABLES 7 – 12
III
DISTRICT PROFILE
13 – 20
IV INDEX OF TABLES 21-26
V STATISTICAL TABLES 27 – 105
VI
HISTORICAL PLACES
106-108

P a g e | 5
SALIENT FEATURES OF TIRUVANNAMALAI DISTRICT
LOCATION: Thiruvannamalai District came into existence on 30th September 1989 after the
bifurcation of the erstwhile North Arcot District.The District lies between 11.55 and 13.15 North
latitude and 78.20 to 79.50 East longitude.
TOTAL AREA: The total geographical area of the district is 6188 Sq K.M comprising the Three
Revenue Divisions of Thiruvannamalai, Cheyyar and Arni The district has 12 taluks viz.
Thiruvannamalai, Kilpennathur, Chengam, Thandrampat, Polur, Kalasapakkam, Jawadhu Hills,
Chetpet, Arni, Cheyyar, Vandavasi, and Vembakkam. There are 18 Blocks including one tribal
Block Jawadhu Hills constituting the district under Rural sector and four Municipalities viz.
Thiruvannamalai, Arni, Cheyyar(Thiruvathipuram) Vandavasi representing urban sectors along
with 10 Town Panchayats viz. Kilpennathur, Vettavalam, Chengam, Pudupalayam, Polur,
Kalambur, Chetpat, Kannamangalam, Peranamallur, and Desur.
BOUNDARIES: The district is bounded on the North and West by Vellore district and on the South
West by Dharmapuri district on the South Villupuram district and on the east by Kancheepuram
district.
FOREST AND HILLS: One sixth of the area of this district is covered by reserve forest and hills
which is part and parcel of Eastern Ghats under JawadhuHills. The important hills in this district
areThiruvannamalai (2668 ft MSL) Jawadhu Hills (2500 ft MSL) and Kailasagiri (2743 ft MSL).
SOIL: The red loamy soil is predominantly found here. However Polur taluk has concentration of
red series loam. The district has also different types of soils such as ferruginous loamy and sandy
loamy however black series loam is found in tanks and river beds of Cheyyar and Vandavasi Taluks.
CLIMATE AND FALL: The general climate is tropical. The district receives rainfall from North
East and South West monsoons. The total rainfall during 2020-21 districts is 1173.80 mm.
POPULATION: The total population of this district 2464875 comprising 1235889 Men and
1228986 women as per 2011 census. The urban population is 494945 constituting 20 % of the
total Population, the remaining 80% ie.1969930 is rural population. The density of the population is
398 per sq.km. The total literate among male are 909803 and that of female are 717010.
RIVER: There is no perennial river in the district. Cheyyar.Thenpennai, Kamandala, Naganathi are
only in seasonal. Sathanur Dam is constructed across Thenpennai River in Thandrampet taluk
among Chennakesava Hills.

P a g e | 6
CROPPING PATTERN: Paddy, Groundnut, Sugarcane, Millets and pulses are the major crops,
during the current fasli-1430(2020-21) 170608/Hects of paddy, 11819/Hects of sugarcane, 92990
/Hects of groundnut, 43609 /Hects of pulses are cultivated.
TRANSPORT AND COMMUNICATION: 93 Km of Broad gauge rail transport in the Katpadi
and Villupuram segment utilized for both passenger and goods transportation as far as road
transports nearly, 1600 km of various kinds of roads are used. The district has two head post offices,
81 sub offices, 455 branch post offices, 6 Telephone Exchange Center and nearly 18325 / phone
connections in use.
ANIMAL HUSBANDRY: The district is the leader in white and brown revolution among the
district in Tamil nadu. One Dairy and Two (Co-op) milk-chilling plants are in operation at
Tiruvannamalai and Anakkavoor, providing approximately 331642/Lit per day, in flush and
294737/Lit per day lean season. And six private milk-chilling plants and one private dairy are also
operating in this district.
INDUSTRIES: This district is industrially backward, the Arni (Sevoor) SLS cotton spinning mill,
Sri Balasubramaniar spinning mill at Ayyampalayam , Tiruvannamalai TK, is the only major
industry and co-operative sugar in Annakkavoor. Dharani Sugars, Polur and Bannari Amman
Sugars, Gozhhuthampattu. Sugar mills are functioning. However medium and small scale industries
as well as cottage industries, such as modern rice mills, weaving factories, cotton, silk and mat
weaving, coir manufacturing and beedi manufacturing are flourishing here. The district is enriched
in mineral deposits such as black granites, multi-colored granites, Soap and magnetite deposits.
BANKING: To create the financial needs a network of 27 State bank groups 121 Nationalised
Banks, 50 Private sector Banks,12 Regional Rural Banks, and one District central co-op bank with
34 branches, Co-op Urban banks 4, 157 primary Agri Co-operative banks are operated.
PLACE OF WORSHIP AND TOURIST: Tiruvannamalai is one of the most venerated places in
Tamil Nadu. The main Deepam festival, Maha shivarathri and Pournami girivalam attracts
Tiruvannamalai and Parvathamalai devotees from far and wide throughout India and abroad.
Furthere main features of the District attract historic places besides Tiruvannamalai, Arni, and
Vandavasi, Devigapuram connected to East India and French companies. It is also noticed that well-
maintained tourist places such as Sathanur dam, Jawathumalai, Amirthy Game Park. In the late
Chola period the Cholan of Sambuvarayar having Padavedu nearArni as HQ ruled this district. We
can now find the fort and note along with a Shiva temple namely Kailasanathar in Arni town. On the
whole Tiruvannamalai is traditionaly rich in Historic and spiritual values but lacks in industrial
growth.
P a g e | 7
Salient Features of Census-2011 Statistical Tables
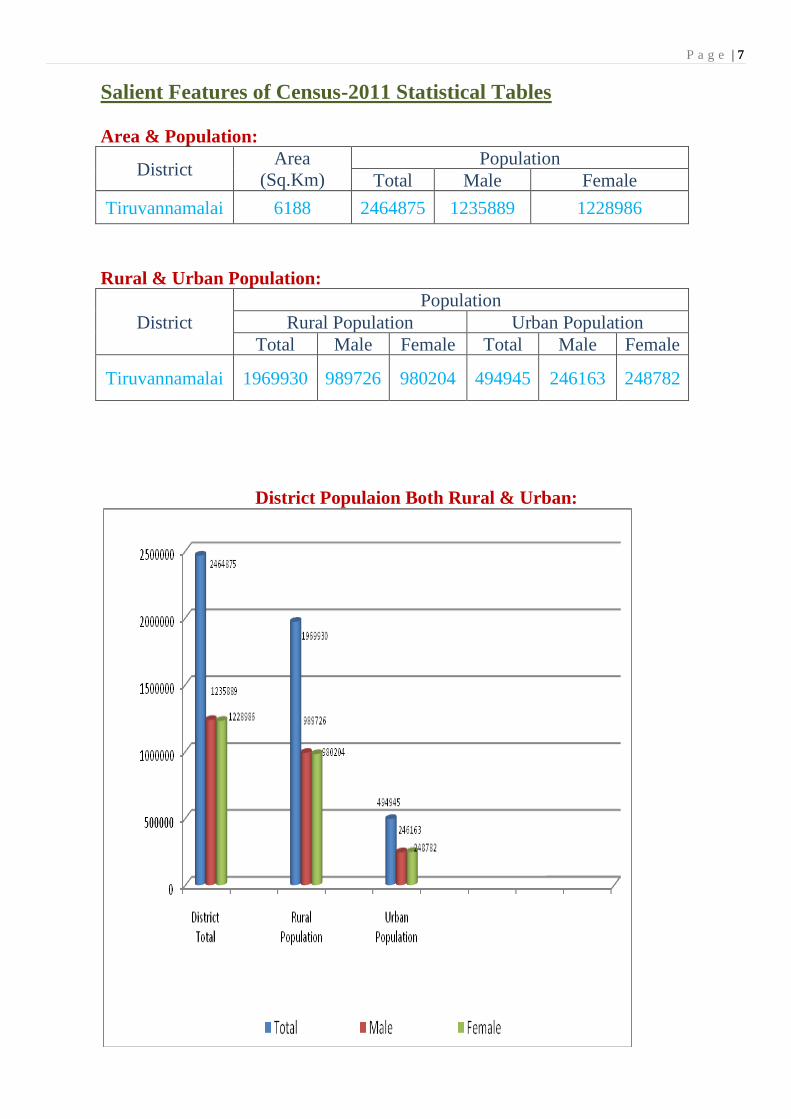
Area & Population:
District Area
(Sq.Km)
Population
Total Male Female
Tiruvannamalai 6188 2464875 1235889 1228986
Rural & Urban Population:
District
Population
Rural Population Urban Population
Total Male Female Total Male Female
Tiruvannamalai 1969930 989726 980204 494945 246163 248782
District Populaion Both Rural & Urban:

P a g e | 8
Literacy Rate
District Rank Literacy rate
Total Male Female
Tiruvannamalai 26 74.21 83.11 65.32
Rural & Urban Literacy rate:
District
Literacy rate
Rural Urban
Total Male Female Total Male Female
Tiruvannamalai 81.18 62.05 84.41 90.8 78.13 81.18
Disrict Lieracy Rate both Rural & Urban:
Density & Increase in Population
0
10
20
30
40
50
60
70
80
90
100
District Rural Urban
74.2171.62
84.4183.1181.18
90.8
65.3262.05
78.13
Total Male Female
District
Density
per
Sq.Km
Female
s per
1000
Males
Increase in
Population
Urban
Population
%
Rural
Population
%
Tiruvannamalai 398 994 12.8 20.08 69.92
P a g e | 9
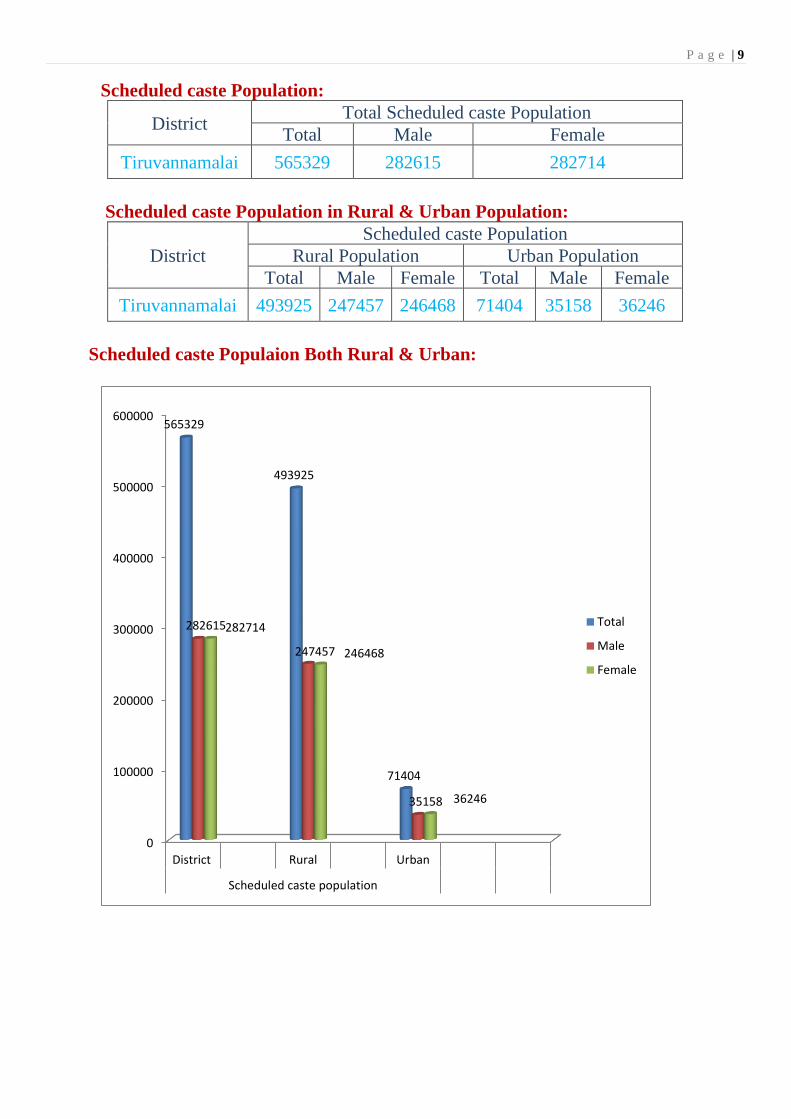
Scheduled caste Population:
District Total Scheduled caste Population
Total Male Female
Tiruvannamalai 565329 282615 282714
Scheduled caste Population in Rural & Urban Population:
District
Scheduled caste Population
Rural Population Urban Population
Total Male Female Total Male Female
Tiruvannamalai 493925 247457 246468 71404 35158 36246
Scheduled caste Populaion Both Rural & Urban:
0
100000
200000
300000
400000
500000
600000
District Rural Urban
Scheduled caste population
565329
493925
71404
282615
247457
35158
282714
246468
36246
Total
Male
Female

P a g e | 10
Scheduled caste Literacy Rate
District Rank Scheduled caste Literacy rate
Total Male Female
Tiruvannamalai 20 71.41 79.84 63.03
Scheduled caste Rural & Urban Literacy rate:
District
Scheduled caste Literacy rate
Rural Urban
Total Male Female Total Male Female
Tiruvannamalai 70.09 78.71 61.49 80.44 87.76 73.4
Scheduled caste Lieracy Rate both Rural & Urban:
0
10
20
30
40
50
60
70
80
90
District Rural Urban
Scheduled caste Literacy Rate
71.41 70.09
80.4479.84 78.71
87.76
63.03 61.49
73.4
Total
Male
Female
P a g e | 11
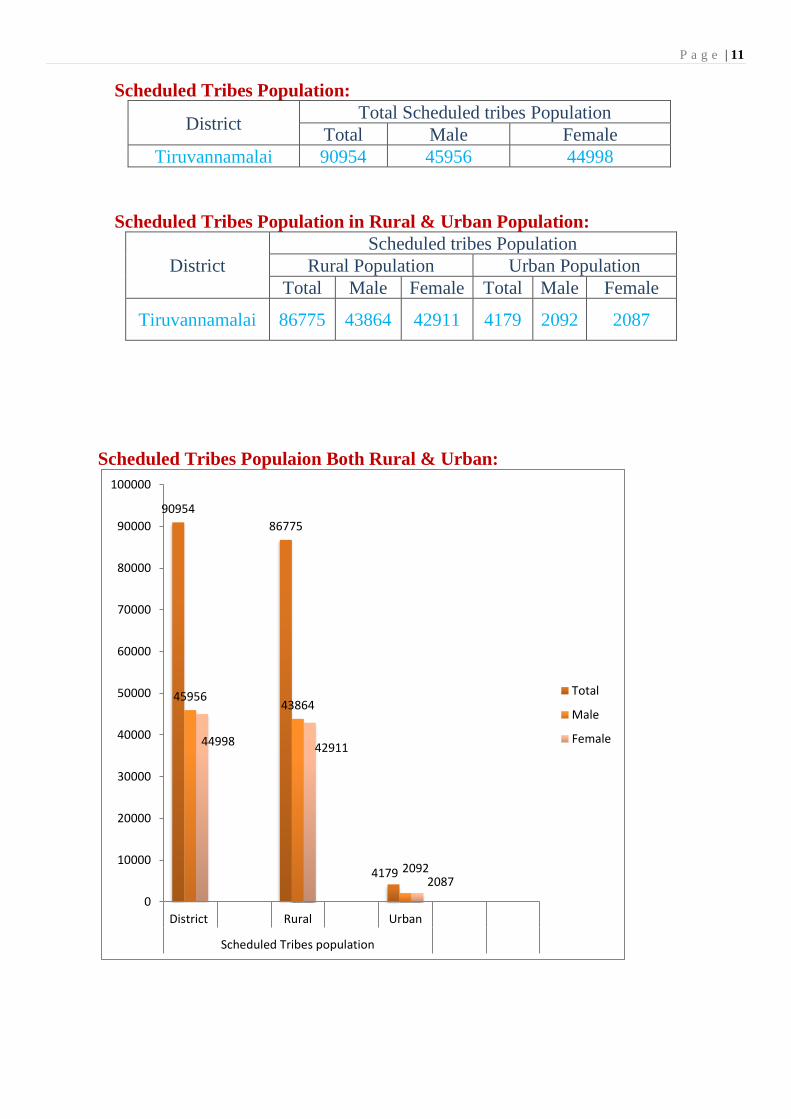
Scheduled Tribes Population:
District Total Scheduled tribes Population
Total Male Female
Tiruvannamalai 90954 45956 44998
Scheduled Tribes Population in Rural & Urban Population:
District
Scheduled tribes Population
Rural Population Urban Population
Total Male Female Total Male Female
Tiruvannamalai 86775 43864 42911 4179 2092 2087
Scheduled Tribes Populaion Both Rural & Urban:
90954
86775
4179
4595643864
2092
44998 42911
2087
0
10000
20000
30000
40000
50000
60000
70000
80000
90000
100000
District Rural Urban
Scheduled Tribes population
Total
Male
Female

P a g e | 12
Scheduled Tribes Literacy Rate
District Rank Scheduled tribes Literacy rate
Total Male Female
Tiruvannamalai 30 46.81 56.02 37.53
Scheduled Tribes Rural & Urban Literacy rate:
District
Scheduled tribes Literacy rate
Rural Urban
Total Male Female Total Male Female
Tiruvannamalai 46.33 55.64 36.92 56.94 63.82 50.08
Scheduled Tribes Lieracy Rate both Rural & Urban:
46.81 46.33
56.9456.02 55.64
63.82
37.53 36.92
50.08
0
10
20
30
40
50
60
70
District Rural Urban
Scheduled caste Literacy Rate
Total
Male
Female
P a g e | 13
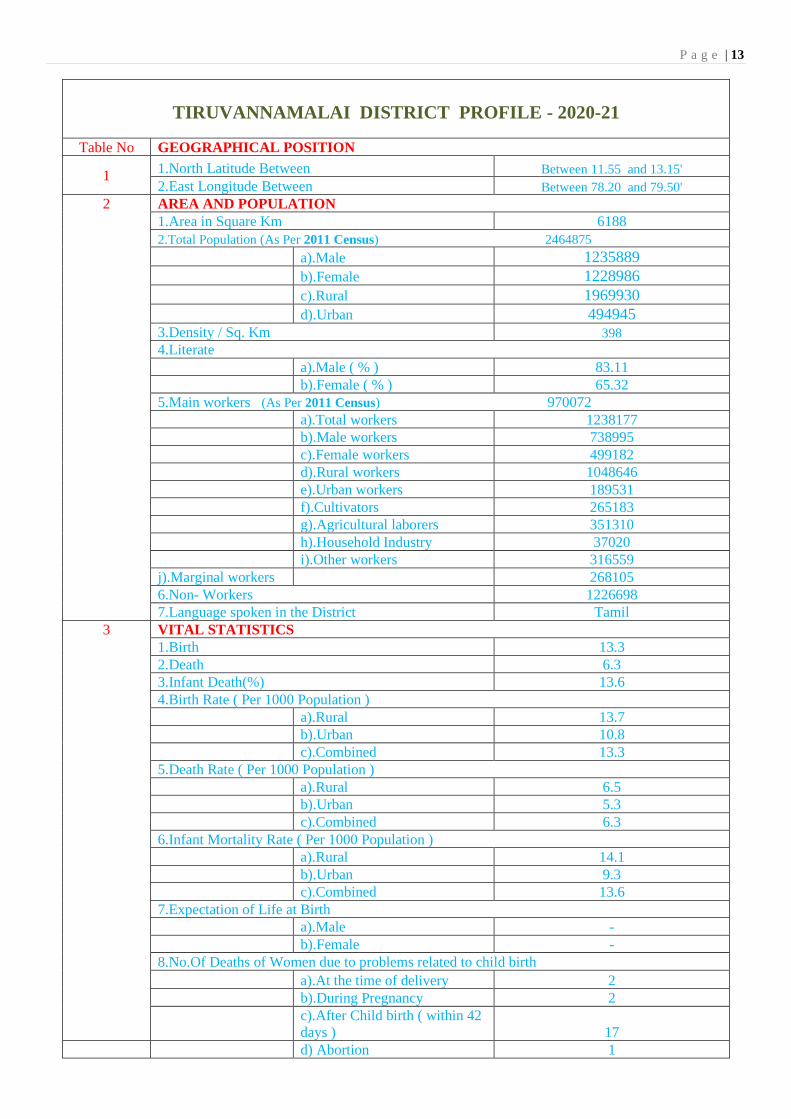
TIRUVANNAMALAI DISTRICT PROFILE - 2020-21
Table No GEOGRAPHICAL POSITION
1 1.North Latitude Between Between 11.55 and 13.15'
2.East Longitude Between Between 78.20 and 79.50'
2 AREA AND POPULATION
1.Area in Square Km 6188
2.Total Population (As Per 2011 Census) 2464875
a).Male 1235889
b).Female 1228986
c).Rural 1969930
d).Urban 494945 3.Density / Sq. Km 398
4.Literate
a).Male ( % ) 83.11
b).Female ( % ) 65.32
5.Main workers (As Per 2011 Census) 970072
a).Total workers 1238177
b).Male workers 738995
c).Female workers 499182
d).Rural workers 1048646
e).Urban workers 189531
f).Cultivators 265183
g).Agricultural laborers 351310
h).Household Industry 37020
i).Other workers 316559
j).Marginal workers 268105
6.Non- Workers 1226698
7.Language spoken in the District Tamil
3 VITAL STATISTICS
1.Birth 13.3
2.Death 6.3
3.Infant Death(%) 13.6
4.Birth Rate ( Per 1000 Population )
a).Rural 13.7
b).Urban 10.8
c).Combined 13.3
5.Death Rate ( Per 1000 Population )
a).Rural 6.5
b).Urban 5.3
c).Combined 6.3
6.Infant Mortality Rate ( Per 1000 Population )
a).Rural 14.1
b).Urban 9.3
c).Combined 13.6
7.Expectation of Life at Birth
a).Male -
b).Female -
8.No.Of Deaths of Women due to problems related to child birth
a).At the time of delivery 2
b).During Pregnancy 2
c).After Child birth ( within 42
days ) 17
d) Abortion 1

P a g e | 14
4 TEMPERATURE ( IN CELSISUS)
1.Plains
a).Maximum 36.50
b).Minimum 20.50
2.Hill Station
a).Maximum N.A
b).Minimum N.A
5 RAINFALL ( in mm )2020-21
1.Normal
a).North East Monsoon 460.00
b).South West Monsoon 449.40
c). Winter Season 22.20
d). Hot Season 103.70
2.Actual
a).North East Monsoon 627.60
b).South West Monsoon 394.1
c). Winter Season 74.3
d). Hot Season 77.8 6
AGRICULTURE (in Hectares) Fasli1430(2020-21)
a).Total Cultivated Area 379611
b).Net Area Sown 237071
c).Area Sown more than once 142540
d).Area and Production of Principal Crops
Principal Crops. Area in ( Hect) 2020-21 Produ."000"
(Tonne)
1.Paddy 170608 687
2.Millets and other cereals 16862 32.896
3.Pulses 43609 26.961
4.Sugarcane ( in terms of can) 11819 305.133
5.Groundnut 92990 252.747
6.Gingelly 2263 1.122 7.Cotton (bales of 170 kg lint each below
000 Hect / Tonnes 635 91 Lint
8Banana 3281 112.210
9.Chillies 2344 1.472 e). Agricultural Land Holdings (As per Census 2015-16)
1.Number of Holdings 449389
2.Area in Hectares 288357
3.Average size of Holdings ( in Hect) 0.64
f). 1.Name of important Food Crops Paddy,Cholam,Kambu,Ragi,
2.Important Non-Food crops Cotton, Groundnut,Sugarcane,Gingelly
7 IRRIGATION
a) Gross Area irrigated by Sources Fasli 1430(2020-21) No Area Irri.
(Hect)
1.Government canals 144 1162
2.Private canals 0 0
3.Tanks 1966 55566
4.Tube wells/Bore wells 186234 262389
5.Other wells 0 0
6.Other sources 0 0
a)Total Net area irrigated( in Hect ) 206940
b) Gross area irrigated ( in Hect ) 319117
c) Name of the river Cheyyar,Thenpennai, Kamandala Naga nathi and
Miruganda nathi
d).Name of the Lake Vazhkudai,Mamandur

P a g e | 15
8 ANIMAL HUSBANDRY
a).Veterinary Institutions No
1.Veterinary Hospitals 5
2.Veterinary Dispensaries 124
3.Clinical Centres 1
4.Sub Centres 21
b).Poultry Development
1.Broiler (No’s) 142320
2.Layer (No’s) 45830
c).Live Stock and Poultry population
1. Cattle 681481
2.Sheep 177712
3.Goat 248410
4.Poultry 247711
9 DAIRY DEVELOPMENT
No's
1.Dairies Nil
2.Milk chilling plants 2
3.No.Of Milk Co-Op. Societies 606
4.Milk production per day ( Liters )
a).Flush Season 331642
b).Lean Season 294737
10 FISHERIES
1.Lenth of Coastal Line ( km ) Nil
2.No.of Costal Blocks Nil
3.No.of Costal Centres Nil
4.Marine Fish Production ( MT) Nil
5.Inland Fish Production ( MT ) 72.194
11
FORESTS-2020-21
a).Forest Area
1.Reserved Forests (in Ha) 142434.03
2.Forests (in Ha) 1461.63
3.Unclassed Forests (in Ha) --
b).Outcurn of Forest Product --
1.Timber ( Cu.m) --
2.Pulpwood ( MT ) --
3.Plywood ( MT ) --
4.Sandalwood ( MT ) --
5.Rubber ( MT ) --
6.Bamboo ( MT ) --
7.Tea-Green Leaves ( Tonne ) --
8.Firewood (MT) 1427.236
9..Wattle Bark ( MT ) --
10.Cashew Nuts ( Tonne) --
11..Others (Specify):- --
Other MFP . (Tonnes.) 1.527
TAMARIND (Tonnes.) 4.449
GALL NUT (Tonnes.) 0.175
Manipungan (Tonnes.) 0.138
Sundaikai (Tonnes.) ---
Curry Leaves (Tonnes.) ---
Nelli (Tonnes.) 0.743
Villan (Wood apple) (Tonnes.) 1.905

P a g e | 16
12 ELECTRICITY-2020-21
a).Generation of Electricity ( in MU )
1.Hydro 0
2.Wind Mill Generation 0
3.Thermal 0
4.Power purchased 0
5.Gas Turbine 0
b).Consumption of Electricity ( in M.Units ) ( 2020-21)
1.Agriculture ( including Huts) 9.14
2.Industry 50.94
3.Commercial 106.5
4.Domestic & Water works 683.33
5.Public lighting 85.38
6.Sales to Licensees 0
7.Educational Institution 0
8.Sales to other services 0
9.Miscellaneous 71.59
c).Rural Electrification
1.No.of Pump sets Energized 2020-21 1435
2.No.of Villages Electrified (Panchayet) 860
3.No.of Hamlets Electrified 2529
13 ENTERPRISES ( Sixth Economic Census 2015-16)
1.Outside Hosehold with fixed Structure 45035
2. Outside Hosehold without fixed Structure 11495
3.Inside Household 152432
Total No. of Establishments 208962 14 INDUSTRIES
1.No.of Working Factories (Registered) 273
2.No.of Man days worked ( Lakhs) 7014521
3.No.of Trade Unions 3
4.No.of Strikes --
5.No.of Lockouts --
6.Large Scale Industries 15
7.Medium Scale Industries 31
8.Small Scale Industries 103
9.Cottage Industries 54
10.No.of New Factories setup 0
11.Name of the Important Industries in the
District
Rice Mills, Sugar Mills, Spinning Mill, Foot ware, Axles India,
Milk Chilling,Lotus footwear,Eastwind Footwear
12.Name of the Industrial park SIPCOT-VEMBAKKAM,SIDCO-TIRUVANAMALAI

P a g e | 17
15 KHADI VILLAGE INDUSTRIES
a).KHADI
Item Production –Length in Meter Value
(.in.Lakhs) ( Rs.in.Lakhs)
1.Cotton Yarn Nil Nil
2.Woolen Nil Nil
3.Silk Nil Nil
4.Polyester Nil Nil
b).VILLAGE INDUSTRIES
1.Soaps Nil Nil
2.Leather Goods Nil Nil
3.Others ( specify)
Hand made Paper 17.30 MT 4.12
4.Polyester Nil Nil
Total 17.30 4.12
16 MEDICAL AND HEALTH ( Numbers in Position )
a)Modern Medicine
1.Hospitals 10
2.Dispensaries 2
3.Primary Health Centres 101
4.Health Sub Centres 427
5.Other Medical Institutions 2
6.Beds in Hospitals and Dispensaries 781
7.Doctors 125
8.Nurses 214
b)Indian Medicine
1.Hospitals 9
2.Dispensaries --
3.Primary Health Centers --
4.Beds in Hospitals and Dispensaries --
5.Doctors 5
6.Nurses --
c)Homeopathy
1.Hospitals --
2.Dispensaries --
3.Primary Health Centers --
4.Beds in Hospitals and Dispensaries --
5.Doctors --
6.Nurses --
d)Ayurvedha
1.Hospitals --
2.Dispensaries --
3.Primary Health Centers --
4.Beds in Hospitals and Dispensaries --
5.Doctors --
6.Nurses
--
P a g e | 18
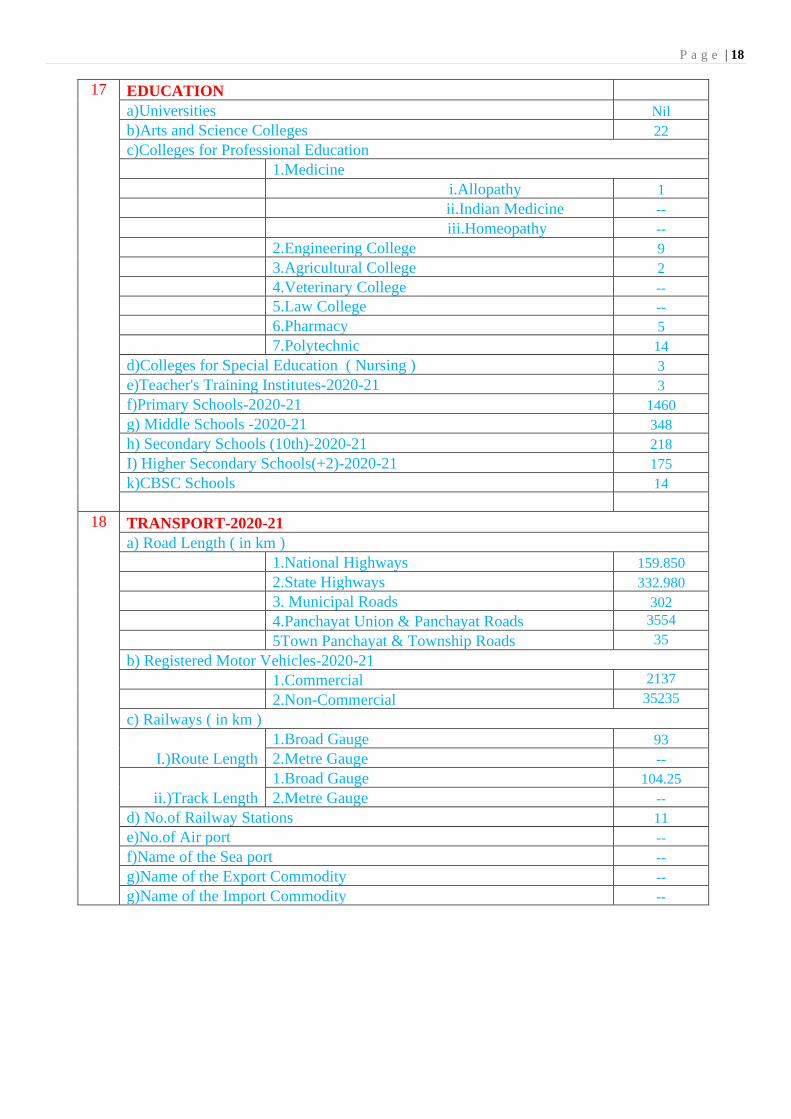
17 EDUCATION
a)Universities Nil
b)Arts and Science Colleges 22
c)Colleges for Professional Education
1.Medicine
i.Allopathy 1
ii.Indian Medicine --
iii.Homeopathy --
2.Engineering College 9
3.Agricultural College 2
4.Veterinary College --
5.Law College --
6.Pharmacy 5
7.Polytechnic 14
d)Colleges for Special Education ( Nursing ) 3
e)Teacher's Training Institutes-2020-21 3
f)Primary Schools-2020-21 1460
g) Middle Schools -2020-21 348
h) Secondary Schools (10th)-2020-21 218
I) Higher Secondary Schools(+2)-2020-21 175
k)CBSC Schools 14
18 TRANSPORT-2020-21
a) Road Length ( in km )
1.National Highways 159.850
2.State Highways 332.980
3. Municipal Roads 302
4.Panchayat Union & Panchayat Roads 3554
5Town Panchayat & Township Roads 35
b) Registered Motor Vehicles-2020-21
1.Commercial 2137
2.Non-Commercial 35235
c) Railways ( in km )
I.)Route Length
1.Broad Gauge 93
2.Metre Gauge --
ii.)Track Length
1.Broad Gauge 104.25
2.Metre Gauge --
d) No.of Railway Stations 11
e)No.of Air port --
f)Name of the Sea port --
g)Name of the Export Commodity --
g)Name of the Import Commodity --

P a g e | 19
19 COMMUNICATION
a) Post & Telegraph ( in Number )
1.Post Offices doing postal business 455
2.Post Offices doing post & Telegraph business --
b) Telephones
1.No.of Telephones in use 18325
2.No.of Junction lines 1426
3.No.of Telephone Exchanges 62
20 CO-OPERATION (2020-21)
1.PACCS 157
2. Co-operative Urban Banks 4
3 .LAMPS 2
4. Co-operative Marketing Societies 7
5. FARMER SERVICE Co-operative Societies 0
6.PCARDBS 8
7. Primary Co-operative store 3
8. DISTRICT CENTRAL CO-OP BANK 1
9.DIST.CO-OP WHOLE SALE STORE 1
10.EMPLOYEES CO-OP STORES 42
11.CO-OP SUGER MILL CANTEEN 1
12.DIST. CO-OP UNION 1
13.DIST. CO-OP PRESS 1
14. Students Co-operative Stores 0
21 REGISTRATION
1.No.of Registration Offices 23
2.Aggregate Value of Property transferred ( Rs ) 21839174533
3.No.of Registration 85996
22 HOUSING
1.No.of tenements constructed by TNHB --
2.Dy.Registrar Housing --
3.No.of tenements constructed by TNSCB --
4.No.of tenements constructed by PHB --
5.Deputy Registrar, Housing – Rural --
6.Deputy Registrar, Housing – Urban --
23 SOCIAL WELFARE 2020-21 Nos
1.No of Old Age Pensioners 6196
2.No of Free House sites distributed-2016-17 12332
3. Nalinthor nala thittam (in RS) 1340000
3.a. Accident Relief fund 2020-21(in Rs) 17615000
3.b. CM’s Relief fund 2020-21( In Rs) 5150000
4.Marriage Assistance --
a.Moovalure Ramamirtham Ammayar Ninaivu Thirumana udhavi thittam 3424
b.Annai Theresa Ammaiyar thirumana thittam 14
c. Dr.Dharmambal Ammayar (Widow Remarriage) Thittam 1
d.EVR Maniammai vithavai magal thirumanathittam 61
e.Dr. Muthulakshmi ninaivu kalappu thirumanathittam 70
SOCIAL WELFARE SCHEME
a. Two girl child protection Scheme 758
b. Sathiyavani muthu ammaiyar free tailoring machine scheme 275
c. Free uniform 180644
5.Bi-Cycles-2020-21 22688
6.Uniform-2020-21 182312

P a g e | 20
24 NUTRITIOUS MEAL PROGRAMME
Name of the Programme No of centres No.of Beneficiaries
1.Puratchi-Thalaivar M.G.R.-2020-21 2010 212283
2.ICDS-2020-21 2127 192789
25 REVENUE ADMINISTRATIVE DIVISIONS
1.Revenue Division 3
2.Revenue Taluks 12
3.Revenue Firkas 54
4.Revenue Villages 1067
26 LOCAL BODIES
1.Corporations --
2.Municipalities 4
3.Panchayat Unions 18
4.Town Panchayats 10
5.Village Panchayats 860
27 COMMUNITY DEVELOPMENT
1.No.of Development Division 2
2.No.of Blocks Covered 18
3.Population covered 2464875
4.Area covered (in Sq.km) 6188 28 POLICE AND PRISONS
I. Police
a) Police Force 1808
1.Local 1310
2.Armed reserve 498
b) Police Stations 46
c) Police Outposts --
II.Prisons
a) Central Prisons --
b) Other Prisons 17
29 LEGISLATURE
I. Member of Legislative Assembly
1.Elected 8
2.Nominated --
2.Member of Parliament
1.Lok Sabha 2
2.Rajya Sabha -- 30 CINEMA THEATRES ( In Nos.)
I. Permanent 25
1.Air conditioned 9
2.Non-Air conditioned 16
3.Air Cooled --
II.Semi Permanent --
III.Open Air Theatre --
IV.Touring Theatre --
31 BANKING AND INSURANCE
I. Bank Branch Offices 245
II.Primary Co-op Banks 157

P a g e | 21
Index of Statistical Tables Table
No Subject Page No
1.AREA AND POPULATION
1.1 Area, Population, Literate, SCs and ST’s- Sex wise by Blocks and Municipalities 29-31
1.2 Population by Broad Industrial categories of Workers 31
1.3 Population by Religion 32-33
1.4 Population by Age Groups 34
1.5 Population of the District-Decennial Growth 35
1.6 Salient features of 2001 Census – Block and Municipality wise. 35
2.CLIMATE AND RAINFALL
2.1 Temperature at Select Stations 36
2.2 Monthly Rainfall – Station wise with maintaining Department particulars. 36-38
2.3 Time Series Date of Rainfall by seasons. 39
3. AGRICULTURE
3.1 Soil Classification (with illustration by map) 39
3.2 Land Utilization 40
3.3 Area and Production of Crops 40-41
3.4 Agricultural Machinery and Implements 42
3.5 Number and Area of Operational Holdings 42
3.6 Consumption of Chemical Fertilizers and Pesticides 43
3.7 Regulated Markets 43
3.8 Crop Insurance Scheme 43
3.9 Sericulture 44
4.IRRIGATION
4.1 Sources of Water Supply with Command Area – Block wise. 44
4.2 Actual Area Irrigated (Net and Gross) by sources. 45
4.3 Area Irrigated by Crops. 45-46
4.4 Details of Dams, Tanks, Wells and Bore wells. 47
5. ANIMAL HUSBANDRY
5.1 Livestock Population 48
5.2 Veterinary Institutions and Animals treated – Block wise. 48
5.3 No. of Veterinary Hospitals 49
5.4 Diary Development 49
5.5 Poultry Development 49
5.6 Fisheries Development and Production 49
6.BANKING AND INSURANCE
6.1 No. of Commercial Banks 50-52
6.2 Insurance Schemes 53
7. CO-OPERATION
7.1 Co-operative Societies 53
8. CIVIL SUPPLIES
8.1 No. of Fair Price Shops 54
8.2 Quantum of Essential Commodities distributed and their retail price 54
8.3 No. of Ration Cards (Rural and Urban) 54
8.4 Quantity supplied 55
8.5 No. of LPG Connections 55
8.6 No. of Persons waiting for LPG connection. 55
P a g e | 22
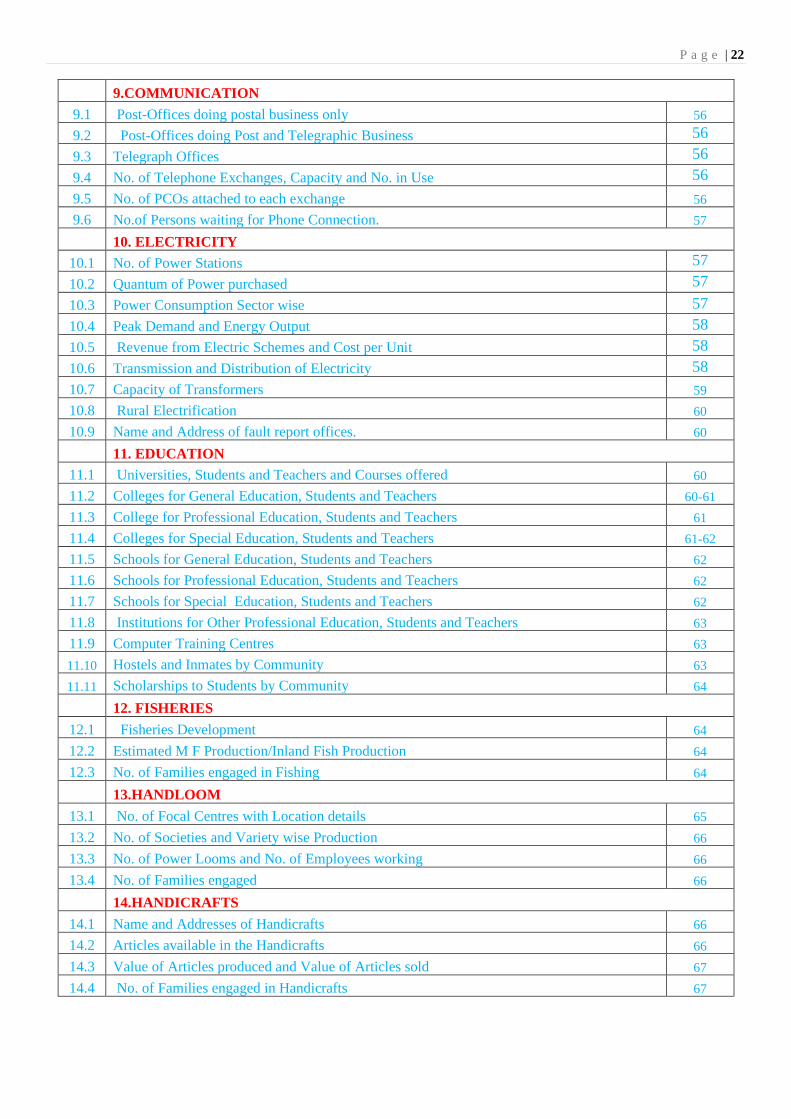
9.COMMUNICATION
9.1 Post-Offices doing postal business only 56
9.2 Post-Offices doing Post and Telegraphic Business 56
9.3 Telegraph Offices 56
9.4 No. of Telephone Exchanges, Capacity and No. in Use 56
9.5 No. of PCOs attached to each exchange 56
9.6 No.of Persons waiting for Phone Connection. 57
10. ELECTRICITY
10.1 No. of Power Stations 57
10.2 Quantum of Power purchased 57
10.3 Power Consumption Sector wise 57
10.4 Peak Demand and Energy Output 58
10.5 Revenue from Electric Schemes and Cost per Unit 58
10.6 Transmission and Distribution of Electricity 58
10.7 Capacity of Transformers 59
10.8 Rural Electrification 60
10.9 Name and Address of fault report offices. 60
11. EDUCATION
11.1 Universities, Students and Teachers and Courses offered 60
11.2 Colleges for General Education, Students and Teachers 60-61
11.3 College for Professional Education, Students and Teachers 61
11.4 Colleges for Special Education, Students and Teachers 61-62
11.5 Schools for General Education, Students and Teachers 62
11.6 Schools for Professional Education, Students and Teachers 62
11.7 Schools for Special Education, Students and Teachers 62
11.8 Institutions for Other Professional Education, Students and Teachers 63
11.9 Computer Training Centres 63
11.10 Hostels and Inmates by Community 63
11.11 Scholarships to Students by Community 64
12. FISHERIES
12.1 Fisheries Development 64
12.2 Estimated M F Production/Inland Fish Production 64
12.3 No. of Families engaged in Fishing 64
13.HANDLOOM
13.1 No. of Focal Centres with Location details 65
13.2 No. of Societies and Variety wise Production 66
13.3 No. of Power Looms and No. of Employees working 66
13.4 No. of Families engaged 66
14.HANDICRAFTS
14.1 Name and Addresses of Handicrafts 66
14.2 Articles available in the Handicrafts 66
14.3 Value of Articles produced and Value of Articles sold 67
14.4 No. of Families engaged in Handicrafts 67

P a g e | 23
15.HEALTH AND FAMILY WELFARE
15.1 Hospitals, Dispensaries, Bed Strength, Doctors and Nurses 67
15.2 No. of Allied Pathological Units available 68
15.3 Disease wise patients treated 68
15.4 Distribution of Medical Personnel 68
15.5 Progress of Family Welfare Programme 69
16. HOUSING
16.1 Plans sanctioned, Building completed under Private Sector 69
16.2 Plans sanctioned, Building completed under Public Sector 70
16.3 Amount invested in Housing and Building activity under Public Sector 70
16.4 Construction activity of Tamil Nadu Housing Board 70
16.5 Construction activity of Tamil Nadu Slum Clearance Board 71
16.6 Index No. of Building Construction cost in Urban centres 71
16.7 Labour charges of Construction Workers. 71
17.INDUSTRIES
17.1 Results of ASI 71
17.2 Estimates of Value of Output and Value Added by Manufacture by Industries Based on ASI 71
17.3 Industrial Production 71
17.4 Production and Value of Major Minerals in the District 71
17.5 Production of Handloom Cloth 71
17.6 Small Scale Industries 72
17.7 Khadi and Village Industries 72
17.8 No. of Printing Presses 72
17.9 No. of Photocopy (Xerox) centres 73
18. FACTORIES
18.1 Registered and Working Factories 73
18.2 Employment in Working Factories 73
18.3 Trade Unions, Industrial Disputes by Strikes, Lockout and Gheraos 73
19. LOCAL BODIES
19.1 Municipal Bodies Area and Population by Grades 74
19.2 Municipal Bodies by Taluks 74
19.3 Panchayat Union, Village/Town Panchayats 74
19.4 Revenue Divisions, Taluks, Firkas and Revenue Villages 74
19.5
Tax Collected by Corporation/Municipality/Panchayat Union/Town Panchayat/Village
Panchayat 75
19.6 Rural Development Programme 76-77
20. LABOUR AND EMPLOYMENT
20.1
No.of Persons registered during the year and Total No.ofPersons waiting upto the end of the
year as per Live Register 77
20.2 No.of Placement during and upto the end of the year. 77
21. LEGAL SERVICE
21.1 Judicial Divisions and Original Jurisdiction 77
21.2
Results of Civil and Criminal cases in the Court of Original Jurisdiction, Civil Suits
Regular. 77
21.3
Nature of free Legals available and no.of beneficiaries roof cases disposed of in Lok Adalat
during the year 78
21.4 No.of Advocates practicing in Courts 78

P a g e | 24
22. LIBRARIES
22.1
List of Head and Branch Libraries in the district withdetails of Members, Books available
and Readers 78
22.2 No.of Libraries houses in Government Building / Rental Building 78
22.3 No.of Reading Rooms 79-80
23. MINING AND QUARRYING
23.1 No.of Mining and Quarrying units in the district 81
23.2 Classification-wise production during the year 81
24. MANUFACTURING SECTOR
24.1 No.of Food and other allied manufacturing units in the district 81
24.2 No.of Non-Food manufacturing units in the district 82
25. MEDICAL SERVICES
25.1 No.of Medical Colleges in the district with Students and Teachers 82
25.2 No.of College of Pharmacy with Students and Teachers 82
25.3 No.of Medical Stores in the district - Category-wise 82
25.4 No.of Veterinary Colleges with Students and Teachers 82
26. MOTOR VEHICLES
26.1
No.of Motor Vehicles (Category-wise) Registered during the year and upto the end of the
year 83
26.2
No.of Motor Vehicles (Category-wise) available for hire purpose during and upto the end of
the year 84
26.3 No.of Persons issued with Driving Licence 84
27. NON-CONVENTIONAL ENERGY GENERATION
27.1 No.of solar energy generating units in the district with production area 84
27.2 No.of Wind Mills Generating units with production data 84
28. POLICE AND PRISONS
28.1 Police Force 84
28.2 Cognisable Offences under Indian Penal Code 85
28.3 Prisons and Convicts 85
28.4 No.of Cases Registered under PCR 85
28.5 No.of Cases Registered against Woman Harrassment and Dowry 85
29. PUBLIC HEALTH
29.1 Public Health and Medical Services rendered by Organisations and Individual 86
29.2 No.of Primary Health Centres with Sub-centres 86
30. PRINTING AND PUBLICATION
30.1 No.of News papers, Weekly Magazines, Monthly Magazines, etc., Published 87
30.2 No.of Publishers in the district other than News papers and Magazines 87
30.3 No.of Printing presses in the district 87

P a g e | 25
31. PRICE INDICES (Index Numbers of Wholesale Prices)
31.1 Consumer Price Index Numbers for Industrial Workers 88
31.2 All India & Tamil Nadu Consumer Price Index Numbers for Industrial Workers 88
31.3 Consumer Price Index Numbers for selected essential items in Urban Tamil Nadu 89
31.4
Consumer Price Index Numbers for selected essential items in Rural Urban and Combined
Tamil Nadu 89
31.5 Time Series Data of Consumer Price index number for Industrial Workers 90
31.6 Time Series Data of Consumer Price index number for Industrial Workers 90
31.7 Annual Average Wholesale Price Index number for Tamil Nadu 91
31.8 Annual Average of Consumer Price Index Numbers for Industrial Workers 91
31.9 Annual Average of Consumer Price Index Numbers for Industrial Workers 91
31.10 Annual Average of Consumer Price Index Numbers for Rural in Tamil nadu 92
31.11 Annual Average of Consumer Price Index Numbers for Urban Tamil nadu 92
31.12
Annual Average of Consumer Price Index Numbers for Rural & Urban Combined Tamil
Nadu 92
32. QUALITY CONTROL
32.1
List of Industrial / Establishment Units having Quality Control Facilities and the products
subjected to Quality Control 92
33. REGISTRATION
33.1 No.of Registration Offices in the district 93
33.2 Registration and AggregateValue of properties transferredduring the year 93
34. REPAIR AND SERVICES
34.1 Authorised Automobiles Repair and Service Stations 93
34.2 Authorised Electrical and Electronic goods Repair and Service Units 94
35. RESTAURANTS AND HOTELS
35.1 Restaurants, Cafes and Other Eating and Drinking Places 94
35.2 Details of Hotels 94
36. RECREATION AND CULTURAL SERVICES
36.1 List of Cinema Theatres and their capacities 94
36.2 List of Clubs and Associations 95
36.3 List of Motion Picture Distributors and Projection Services 95
37.SOCIAL WELFARE
37.1 Puratchi Thalaivar MGR Nutritious Meals Programme Centres 95
37.2 No.of Beneficiaries under Puratchi Thalaivar MGR Nutritious Meals Programme 95
37.3 No.of Beneficiaries under the free supply of Text Books and Uniforms 95
37.4 No.of Beneficiaries under Old Age Pension Scheme 96
37.5 Free Houses and House sites distributed to community 96
37.6 Implementation of Relief Measures and Pension Scheme 96
38.SANITARY SERVICES
38.1
No.of Sanitary Workers engaged in Sanitation, Garbageand Sewage disposal and other
particulars 97
38.2 No.of Vehicles engaged in the sanitary services 97
39. SCIENTIFIC AND RESEARCH SERVICES
39.1 Institutions and Laboratories engaged in Research Work 97
40. STORAGE FACILITIES
40.1 List of Agricultural and Non-Agricultural Storage Godowns 97

P a g e | 26
40.2 List of Cold Storage Godowns 97
41.TEXTILES
41.1 No.of Ginning, Spinning and Weaving Mills in the district 98
41.2 Quantum of Production during the year 98
42. TRADE AND COMMERCE
42.1 No.of Major and Minor Trade and Commercial Estate in the district 98
43. TRANSPORT
43.1 Length of Roads 98
43.2 Road Accidents 98
43.3 Register Motor Vehicles 99
43.4 Transport Corporation 99
43.5 Select indicators of overall performance of State Transport Corporation 99
43.6 Railway Lines and Stations 100
43.7 Port Development 100
43.8 Airports 100
43.9 Private Transport Operations 100
44. TOURISM
44.1 Places of Tourist Attraction 101
44.2 List of Places of Worship 101
44.3 List of Hotels and Restaurants 102
44.4 List of Travel Agents 102
44.5 Train and Air Service Timings 103
45. VITAL STATISTICS
45.1 Births and Deaths registered in the district 104
45.2 Birth , Death and Infant Mortality rates in the district 104
45.3 Death by Causes 104
46. VOLUNTARY SERVICES
46.1
List of Voluntary Services available in the district for the development of Rural and Urban
Population 105
47. WATER WORK AND SUPPLY
47.1 No.of Schemes Operated in the district 105
47.2 No.of Workers engaged in the Water Works and Supply 105
47.3 No.of House connections, fountains 105

P a g e | 27
Tiruvannamalai District-By Taluks

P a g e | 28
Tiruvannamalai District-By Blocks

P a g e | 29
1.POPULATION
1.1.POPULATION BY RURAL AND URBAN -2011Census
Source: Census of India 2011.
Tiruvannamalai District Municipality wise population 2011 census
Sl.No. Name of the
Block
Census Town Municipality
Total Male Female
Total Male Female
1 Tiruvannamalai Vengikkal 18244 9278 8966 Tiruvannamalai 145278 72406 72872
2 Arni
Sevur 10299 5213 5086 Arni 63671 31268 32403
S.V.Nagaram 5894 2946 2948
Paiyur 7555 3723 3832
3 West Arni Mullipattu 4956 2537 2419
Devikapuram 9800 4926 4874
4 Cheyyar Kilpupakkam 6912 3466 3446 Cheyyar 37802 18773 19029
Dusi 5577 2811 2766
5 Vandawasi Vandawasi 31320 15566 15754
District Total Census
Town 69237 34900 34337 Municipality 278071 138013 140058
Sl.No
o Sl.No
Population by
category Total Male Female
1 District Total 2464875
1235889
1228986
2 Rural Population 1969930
989726
980204
3 Urban Population 494945
246163
248782
4 Literate 1626813 909803 717010
5 SC Population 565329 282615 282714
6 ST Population 90954 45956 44998
7. others 970530 581232 389298
Tiruvannamalai District Town Panchayat wise Population 2011 census
Sl.No. Name of the Block
Town Panchayat
Total Male Female
1 Kilpennathur Kilpennathur 13718 6902 6816
Vettavalam 15506 7681 7825
2 Chengam Chegam 26980 13549 13431
3 Pudhupalayam Pudhupalayam 11382 5608 5774
4 Polur Polur 28123 13862 14261
Kalambur 14304 7122 7182
5 Chetpat Chetpet 19827 9772 10055
6 West Arni Kannamangalam 7399 3630 3769
7 Thellar Desur 4597 2246 2351
8 Peranamallur Peranamallur 5801 2878 2923
Dt Total Town Panchayat 147637 73250 74387

P a g e | 30
Tiruvannamalai District Block wise population 2011 census
Sl.No. Name of the
Block
URBAN TOTAL RURAL TOTAL DISTRICT TOTAL
Total Male Female Total Male Female Total Male Female
1 Tiruvannamalai 163522 81684 81838 162204 81694 80510 325726 163378 162348
2 Thurinjapuram 0 0 0 123213 61920 61293 123213 61920 61293
3 Kilpennathur 29224 14583 14641 103673 52305 51368 132897 66888 66009
4 Chengam 26980 13549 13431 142149 71994 70155 169129 85543 83586
5 Pudhupalayam 11382 5608 5774 89491 45453 44038 100873 51061 49812
6 Thandarampet 0 0 0 178731 89702 89029 178731 89702 89029
7 Polur 42427 20984 21443 135345 67609 67736 177772 88593 89179
8 Kalasapakkam 0 0 0 120612 60781 59831 120612 60781 59831
9 Chetpat 19827 9772 10055 94387 47272 47115 114214 57044 57170
10 Jewadhu hills 0 0 0 51999 26483 25516 51999 26483 25516
11 Arni 87419 43150 44269 91174 45611 45563 178593 88761 89832
12 West Arni 22155 11093 11062 94228 46968 47260 116383 58061 58322
13 Cheyyar 50291 25050 25241 80616 40370 40246 130907 65420 65487
14 Anakkavur 0 0 0 79953 40365 39588 79953 40365 39588
15 Vembakkam 0 0 0 127752 64013 63739 127752 64013 63739
16 Vandawasi 31320 15566 15754 117072 58637 58435 148392 74203 74189
17 Thellar 4597 2246 2351 91856 45998 45858 96453 48244 48209
18 Peranamallur 5801 2878 2923 85475 42551 42924 91276 45429 45847
District Total 494945 246163 248782 1969930 989726 980204 2464875 1235889 1228986

P a g e | 31
TIRUVANAMALAI DISTRICT AS PER 2011 CENSUS
Sl.No. Name of the
Block
Total
Population
LITERACY SC,ST & Literacy Percentage
to the Block
SC ST others Literacy SC ST others Literacy
1 Tiruvannamalai 325726 63702 5574 164139 233415 19.56 1.71 59.52 80.79
2 Thurinjapuram 123213 28031 1662 49227 78920 22.75 1.35 48.05 72.15
3 Kilpennathur 132897 33923 3071 52051 89045 25.53 2.31 47.59 75.43
4 Chengam 169129 58670 2552 42341 103563 34.69 1.51 33.59 69.79
5 Pudhupalayam 100873 33087 1147 25834 60068 32.8 1.14 33.79 67.73
6 Thandarampet 178731 41825 17077 45520 104422 23.4 9.55 33.85 66.8
7 Polur 177772 31583 526 87730 119839 17.77 0.3 57.47 75.54
8 Kalasapakkam 120612 32571 440 43313 76324 27 0.36 43.87 71.23
9 Chetpat 114214 13396 530 62976 76902 11.73 0.46 63.27 75.46
10 Jewadhu hills 51999 1071 47081 -27349 20803 2.06 90.54 -46.16 46.44
11 Arni 178593 32111 766 93631 126508 17.98 0.43 60.71 79.12
12 West Arni 116383 20801 392 60177 81370 17.87 0.34 60.06 78.27
13 Cheyyar 130907 31282 1323 58849 91454 23.9 1.01 52.78 77.69
14 Anakkavur 79953 21068 1313 30880 53261 26.35 1.64 46.07 74.06
15 Vembakkam 127752 32673 1349 51424 85446 25.58 1.06 48.34 74.98
16 Vandawasi 148392 40722 2754 57525 101001 27.44 1.86 46.60 75.9
17 Thellar 96453 28876 2198 32049 63123 29.94 2.28 40.13 72.35
18 Peranamallur 91276 19937 1199 40213 61349 21.84 1.31 51.40 74.55
District Total 2464875 565329 90954 970530 1626813 22.94 3.69 47.58 74.21
1.2.POPULATION BY BROAD INDUSTRIAL CATEGORIES
OF WORKERS-2011Census
Sl.
No
Industrial Category District
Persons %toTotal
Workers
1 Total Main Workers 970072 78.35
a) Cultivators 265183 21.42
b) Agricultural Labours 351310 28.37
c)Household Industry Manufacturing, Processing,
Servicing and Repairs 37020 2.99
d) Other Workers 316559 25.57
2 Marginal Workers 268105 21.65
Total Workers 1238177 100.00
Non Workers 1226698 --
Total Population 2464875 --
Source: Census of India 2011

P a g e | 32
1.3 POPULATION BY RELIGION- 2011Census
Sl.No Religion
Persons in District
Persons in Tamil
Nadu
Percentage(%)
In the District Tamil Nadu
1 Hindu 2294369 63188168 93.08 87.58
2 Muslim 91636 4418331 3.72 6.12
3 Christian 66987 4229479 2.72 5.86
4 Sikh 232 188586 0.01 0.27
5 Buddhist 157 89265 0.01 0.12
6 Jain 7898 14601 0.32 0.02
7 Other Religions 110 11186 0.00 0.02
8 Religions not stated 3486 7414 0.14 0.01
Total Population 2464875 72147030 100.0 100.00 Source: Census of India 2011
TIRUVANNAMALAI DISTRICT
Literate Population -2011 CENSUS
Source :2011 CENSU

P a g e | 33
TIRUVANNAMALAI DISTRICT
SC & ST POPULATION -2011 CENSUS
Source :2011 CENSUS

P a g e | 34
1.4. POPULATION BY AGE GROUPS- 2001 Census
Sl.No
Age
Groups
Persons in Districts(in’00’) Persons in Tamil Nadu (in ‘00’)
District
% to TN Total Male Female Total Male Female
1 0-4 184509 94596 89913 5098462 2619883 2478579 3.62
2 5-9 214365 109696 104669 5600086 2875394 2724692 3.83
3 10-14 233390 119167 114223 6012326 3086803 2925523 3.88
4 15-19 229652 116396 113256 6183767 3135595 3048172 3.71
5 20-24 198418 100970 97448 5801384 2872914 2928470 3.42
6 25-29 183160 88933 94227 5719070 2732907 2986163 2.68
7 30-34 142772 69415 73357 4687799 2344412 2343387 3.03
8 35-39 162293 76369 85924 4919080 2396927 2522153 3.30
9 40-44 123258 64097 59161 3786341 1978669 1807672 3.26
10 45-49 124389 62841 61548 3610873 1842970 1767903 3.44
11 50-54 94919 47976 46943 2817473 1452890 1364583 3.37
12 55-59 80478 38425 42053 2232676 1101957 1130719 3.60
13 60-64 75419 36799 38620 2049791 1019088 1030703 3.68
14 65-69 52278 25017 27261 1374926 663631 711295 3.80
15 70-74 38642 19754 18888 1030919 520254 510665 3.75
16 75-79 19021 10381 8640 498560 261694 236866 3.82
17 80+ 19698 10181 9517 553204 271133 282071 3.56
18 Age not
stated 9464 4846 4618 428942 223788 205154 2.18
19 All ages 2186125 1095859 1090266 62405679 31400909 31004770 3.50
Source: Census of India 2001

P a g e | 35
1.5 POPULATION OF THE DISTRICT DECENNIAL
GROWTH RATE FROM 2001 TO 2011
Period
(Subject to the
period of
availability)
2001 to 2011
Region Population 2001 Population
2011
Percentage Variation
Since
previous Census
Total 2186125 2464875
12.75
Rural 1785364 1969930
10.34
Urban 400761 494945
23.50
Source: Census of India 201
1.6 SALIENT FEATURES OF 2011 CENSUS
BLOCK AND MUNICIPALITY WISE
Sl.
No. Name of the
Block/Municipality
Den
sity
per
Sq
.Km
.
Fem
ale
s p
er 1
000
male
s
% o
f In
cre
ase
in
po
pu
lati
on
sin
ce
2001
in
%
%o
f U
rb
an
/Ru
ral
Po
pu
lati
on
in
tota
l p
op
ula
tio
n
Literacy rate
among
Male
(%)
Female
(%)
1 Tiruvannamalai 550 984 28.92 56 55.63 44.37
2 Thurinjapuram 433 990 10.36 100 56.96 43.04
3 Kilpennathur 481 987 20.12 100 55.72 44.28
4 Chengam 283 977 -6.21 100 56.10 43.90
5 Pudhupalayam 284 976 19.93 100 57.24 42.76
6 Thandarampet 337 992 17.23 100 56.46 43.54
7 Polur 637 1006 13.27 100 55.80 44.20
8 Kalasapakkam 544 984 11.74 100 57.30 42.70
9 Chetpat 464 1002 11.20 100 56.25 43.75
10 Jewadhu hills 358 963 20.03 100 62.14 37.86
11 Arni 524 999 16.78 64 55.98 44.02
12 West Arni 579 1004 12.84 100 55.85 44.15
13 Cheyyar 358 996 6.26 71 56.27 43.73
14 Anakkavur 307 981 5.93 100 57.10 42.90
15 Vembakkam 386 996 6.77 100 56.40 43.60
16 Vandawasi 389 997 14.07 79 56.36 43.64
17 Thellar 320 999 3.59 100 56.96 43.04
18 Peranamallur 324 1009 6.08 100 56.82 43.18
MUNICIPALITIES
1 Tiruvannamalai 10630 1006 11.27 44 52.65 47.35
2 Cheyyar 3516 1014 7.39 29 53.05 46.95
3 Arni 5479 1036 4.70 36 52.52 47.48
4 Vandawasi 3183 1012 5.78 21 52.73 47.27
Source: Census of India.2011
P a g e | 36
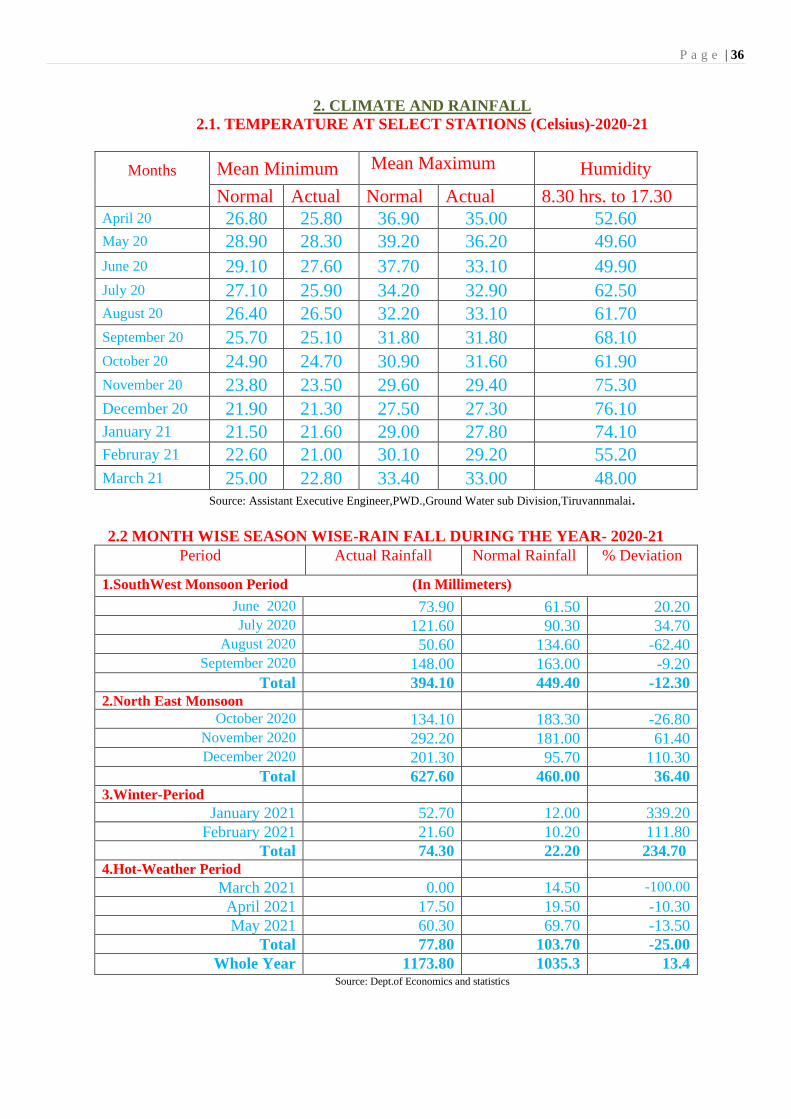
2. CLIMATE AND RAINFALL
2.1. TEMPERATURE AT SELECT STATIONS (Celsius)-2020-21
Months
Mean Minimum Mean Maximum
Humidity
Normal Actual Normal Actual 8.30 hrs. to 17.30
hrs April 20 26.80 25.80 36.90 35.00 52.60
May 20 28.90 28.30 39.20 36.20 49.60
June 20 29.10 27.60 37.70 33.10 49.90
July 20 27.10 25.90 34.20 32.90 62.50
August 20 26.40 26.50 32.20 33.10 61.70
September 20 25.70 25.10 31.80 31.80 68.10
October 20 24.90 24.70 30.90 31.60 61.90
November 20 23.80 23.50 29.60 29.40 75.30
December 20 21.90 21.30 27.50 27.30 76.10
January 21 21.50 21.60 29.00 27.80 74.10
Februray 21 22.60 21.00 30.10 29.20 55.20
March 21 25.00 22.80 33.40 33.00 48.00 Source: Assistant Executive Engineer,PWD.,Ground Water sub Division,Tiruvannmalai.
2.2 MONTH WISE SEASON WISE-RAIN FALL DURING THE YEAR- 2020-21
Period Actual Rainfall Normal Rainfall % Deviation
1.SouthWest Monsoon Period (In Millimeters)
June 2020 73.90 61.50 20.20 July 2020 121.60 90.30 34.70
August 2020 50.60 134.60 -62.40 September 2020 148.00 163.00 -9.20
Total 394.10 449.40 -12.30 2.North East Monsoon
October 2020 134.10 183.30 -26.80 November 2020 292.20 181.00 61.40 December 2020 201.30 95.70 110.30
Total 627.60 460.00 36.40 3.Winter-Period
January 2021 52.70 12.00 339.20
February 2021 21.60 10.20 111.80
Total 74.30 22.20 234.70 4.Hot-Weather Period
March 2021 0.00 14.50 -100.00
April 2021 17.50 19.50 -10.30
May 2021 60.30 69.70 -13.50
Total 77.80 103.70 -25.00
Whole Year 1173.80 1035.3 13.4 Source: Dept.of Economics and statistics
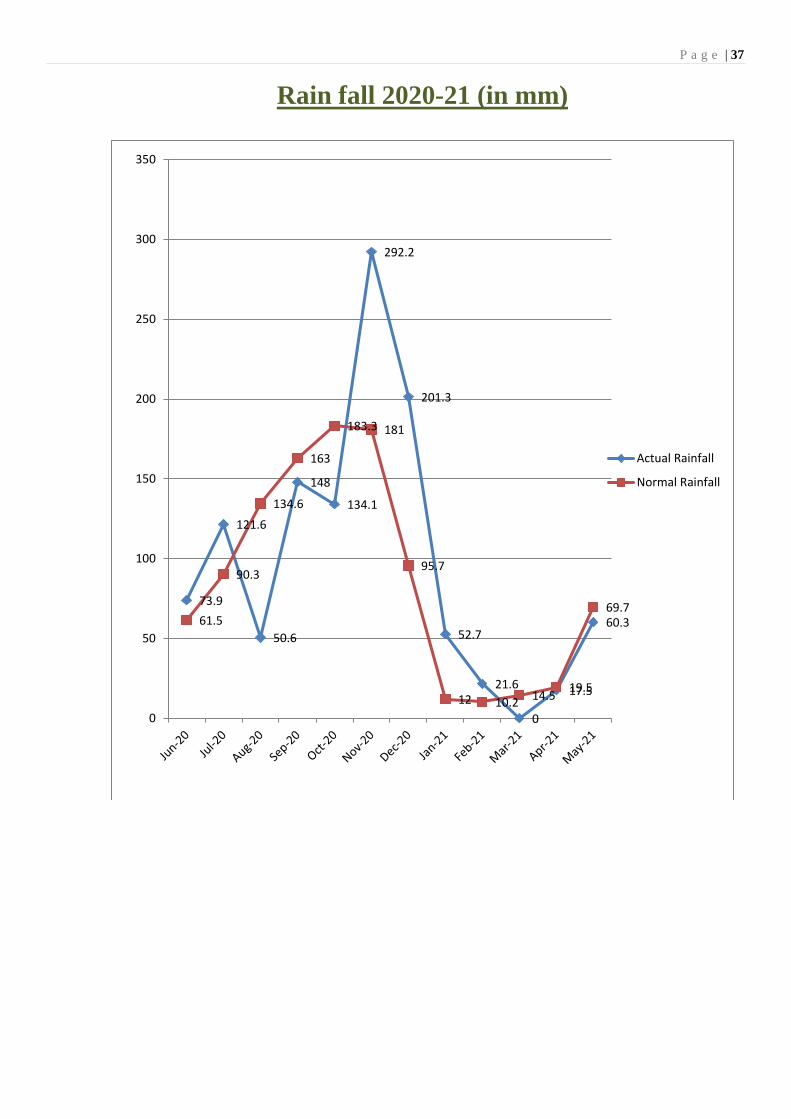
P a g e | 37
Rain fall 2020-21 (in mm)
73.9
121.6
50.6
148
134.1
292.2
201.3
52.7
21.6
0
17.5
60.361.5
90.3
134.6
163
183.3 181
95.7
12 10.214.5
19.5
69.7
0
50
100
150
200
250
300
350
Actual Rainfall
Normal Rainfall

P a g e | 38
Season Wise Rainfall 2020-21 (in mm)
394.1
627.6
74.3 77.8
449.4460
22.2
103.7
0
100
200
300
400
500
600
700
SouthWest Monsoon North East Monsoon Winter-Period Hot-Weather Period

P a g e | 39
2.3 TIME SERIES DATA OF RAINFALL BY SEASONS (LAST 13 YEARS)
Sl.
No
Year
South West
Monsoon
North East
Monsoon Winter Season
Hot Weather
Season Total
3.%
Dev
iati
on
(+
or
–
or
=)
fro
m N
orm
al
No
rmal
Act
ual
No
rmal
Act
ual
No
rmal
Act
ual
No
rmal
Act
ual
No
rmal
Act
ual
1 2007-08 465.8 485.9 439.8 601.8 32.8 23.2 108.2 184.3 1046.6 1295.2 (+)
2 2008-09 465.8 401.0 439.8 542.0 32.8 6.4 108.2 32.1 1046.6 981.5 (-)
3 2009-10 465.8 392.0 439.8 436.4 32.8 5.1 108.2 124.2 1046.6 957.7 (-)
4 2010-11 465.8 511.3 439.8 654.6 26.5 45.2 98.9 106.0 1031.0 1317.1 (+)
5 2011-12 468.1 539.1 446.5 506.6 26.5 0.0 98.9 56.9 1040.0 1102.6 (-)
6 2012-13 468.1 498.6 446.5 505 26.5 4.0 98.9 72.4 1040.0 1080.0 (+)
7 2013-14 468.1 401.5 446.5 331.5 26.5 10.0 98.9 94.9 1040.0 837.9 (-)
2014-15 468.1 445.5 446.5 248.9 26.5 0.0 98.9 177.5 1040.0 871.9 (-)
8 2015-16 468.1 445.5 446.5 248.9 26.5 0.0 98.9 177.5 1040.0 871.9 (-)
9 2016-17 468.1 474.1 452.6 626.4 26.5 9.0 98.7 84.1 1045.9 1193.6 (+)
10 2017-18 468.1 621.9 446.5 524.9 26.5 34.9 98.9 52.4 1040 1234.1 (+)
11 2018-19 468.1 309.7 446.5 393.1 26.5 0.8 98.9 44.3 1040 747.9 (-)
12 2019-20 549.4 683.8 460.0 343.0 22.2 8.7 103.7 4.1 1135.3 1039.6 (-)
13 2020-21 449.4 394.1 460 627.6 22.2 74.3 103.7 77.8 1035.3 1173.8 (+)
Source: Dept. of Economics and Statistics, Chennai.
3. AGRICULTURE.
3.1. Soil Classification
Sl.No.
Type of Soil
Places in District
1. Red Loam Small patches in the Taluks of Tiruvannmalai,
Chengam and Polur
2. Laterite Soil Nil
3. Black Soil Tiruvannamalai, Chengam, Polur, Arni,
Cheyyar and Vandawasi
4. Sandy Coastal Alluvium Nil
5. Red Sandy Soil Nil
Source: Dept. of Economics and Statistics, Chennai.

P a g e | 40
3.2. LAND UTILISATION- (Area in Hectares)
Classification Last Year
2019-20
Current Year
2020-21
1. Forest + Reserve Forest 152810 152810
2. Barren and Uncultivable uses 20585 20585
3. Land put to Non-Agricultural uses 96501 96501
4. Cultivable Waste 8369 8369
5. Permanent Pastures and Other Grazing Land 2931 2931
6. Land Under Miscellaneous Tree Crops and Graces not
included in Net Area Sown 2138 2138
7. Current Fallows 93920 87025
8. Other Fallows Land 23546 23775
9. Net Area Sown 230405 237071
10. Geographical Area According to Village Papers 631205 631205
11. Total Cropped Area 351007 379611
12. Area sown more than once 12062 142540
Source: ‘G’ Return-2020-21
3.3. AREA AND PRODUCTION OF CROPS - Year: 2020-21
Sl.No. Crops
Area in
hec.
Production
‘000’tonnes
Productivity
Kg./hec.
% to the total
area sown
1
A.FOOD GRAINS:
170608 687 4027 45
a)Cereals
Paddy
Cholam 37 0.045 1210 --
Cumbu 6034 2.482 2431 1.6
Maize 965 5.397 5593 0.3
Ragi 4408 14.207 3223 1.2
Samai 5418 10.765 1987 1.4
2
b) Pulses
2136 1.179 552 0.6 Greengram
Redgram 1643 2.083 1268 0.4
Blackgram 39830 23.699 595 10.5
3
c) OIL SEEDS
92990 252.747 2718 24.5 Groundnut
Gingily 2263 1.122 496 0.6
4 Coconut 746 4898 6566 0.2
5 Onion 247 1.786 7232 --
6 Chillies 2344 1.472 628 0.6
7 Sugar cane 11819 305.133 93000 3.1
8 Banana 3281 112.210 34200 0.9
9 Cotton 635 261.620 412
10 Turmaric 294 1.534 5217 0.2
11 Others 33913 -- -- 8.9
Total 379611 Source: G-Return 2020-21, Season Crop Report 2018-19.

P a g e | 41
Tiruvannamalai District
“G”-Return report –Fasli 1431(2020-21)
Land Utilisation-Pie chart
152810
20585
96501
8369
29312138
8702523775
237071
Forest + Reserve Forest
Barren and Uncultivable uses
Land put to Non-Agricultural uses
Cultivable Waste
Permanent Pastures and OtherGrazing Land
Land Under Miscellaneous TreeCrops and Graces not included inNet Area Sown
Current Fallows
Other Fallows Land
Net Area Sown

P a g e | 42
3.4. AGRICULTURAL IMPLEMENTS AND MACHINERY
In Number
Sl.No. Item 1994 2004
1. Ploughs
a) Wooden 26721 54908
b) Iron 76360 34247
c) Total 103081 89155
2. Water Pumps for Irrigation Purpose a) Worked by Oil Engine 20755 15636
b) Worked by Electric Power 86023 64677
c) Total 106778 803131
3. Tractors
a) Government 9 9
b) Private 771 1566
c) Total 780 1575
4. Sugarcane Crushers
a) Worked by Power 772 -
b) Worked by Bullocks 350 -
c) Total 1122 -
5. Oil Ghanis
a) 5 Kg. & above - -
b) Less than 5 Kg. - -
c) Total - - Source: Based on 17TH Quinquennial Livestock Census
3.5. NUMBER AND AREA OF OPERATIONAL LAND HOLDINGS
Size
Class of
holdings (Hectares)
Gro
up
Siz
e
Number Area
S.C.
S.T.
OT
HE
RS
INS
TIT
UT
ION
TOTAL
S.C.
S.T.
OT
HE
RS
INS
TIT
UT
ION
TOTAL
0 – 0.5
Ma
rgin
al
46453 7310 308893 1354 364010 16835 3194 114322 502 134853 0.5 – .99
1.0 –1.99
Sm
all
6558 2133 55608 221 64520 8925 2972 76205 308 88411
2.0 – 3.0
Sem
i-
Med
ium
1222 873 15618 130 17843 3091 2348 40851 350 46640 3.0 – 4.0
4.0 – 5.0
Med
ium
101 209 2462 72 2844 541 1145 13162 451 15300 5.0 – 7.5
7.5 – 10
10 and
above La
rge
9 5 128 30 172 122 74 2378 579 3152
Total 54343 10530 382709 1807 449389 29514 9733 246918 2190 288356
Source: 10th Agricultural Census 2015-16

P a g e | 43
3.6. CONSUMPTION OF CHEMICAL FERTILISERS AND PESTICIDES- 2020-21
Fertilizers (in ‘000’ Tone) Pesticides(in ‘000’ Tone) Urea
(‘000’
Tone) Nitrogenous
(N)
Phosphates
(P2 05)
Pottassic
(K2 0)
Total
(NPK)
Dust
(Kgs.)
Liquid
(Lit.)
Total
36522 5878.6 8908 40038 23800 57679 81479 74397.00
Source: J.D Agriculture.
3.7. REGULATED MARKETS-Year:2020-21
No.of Regulated
Markets
No.of Sub
Regulated
Markets
Quantity arrivals
(‘in M.T.’)
(Product wise)
Receipts
(Rs.in Lakhs)
(Product wise)
18 2
1. Paddy 173008.913 209.685
2. Groundnut 4037.069 17.775
3. Gingili 504.579 1.075
4. Chillies 123.575 0.609
5. Cumbu 235.226 0.234
6. Horse gram 4.750 0.008
7. Ragi 105.270 0.339 Source: District Agriculture Marketing Office.
3.8.CROP INSURANCE SCHEME FOR THE FASLI YEAR1 1430(2020-21)
Sl.No.
Name of the Crop No of
Blocks
notified
No.of
Experiments
(in all season)
Premium
collected
(Rs.in’000’)
No.of
Beneficiarie
s
Amount
Sanctioned
(in Rs.)
1 Paddy(sornavari) 18 1918 15874.00 27039 13.98Cr
2 Paddy(Samba) 18 3424 14009.00 33422 15.66Cr
3 Paddy(Navarai) 18 2822 12648.00 46720 0.00
4 Cumbu(Khariff) 4 110 59.00 393 0.00
5 Cumbu(Rabi) 5 30 5.0 46 0.00
6 Gingili (Khariff) 5 50 1.00 12 0.00
7 Gingili(Rabi) 6 62 11.00 103 0.00
8 Groundnut
(Khariff) 18 2918
14674.00 43968 19.94Cr
9 Groundnut(Rabi) 17 1632 2607.00 10180 0.00
10 Sugarcane 18 480 16879.00 3647 0.00
11 Cholam(Khariff) 2 20 0.00 0 0.00
12 Cholam(Rabi) 2 50 0.00 0 0.00
13 Black gram 12 208 7581.00 52319 0.00
14 Banana(Khariff) 1 4 28.00 9 0.00
15 Banana(Rabi) 3 40 769.00 250 0.00
16 Topiaco(Rabi) 5 80 274.00 365 0.00
17 Maize(Khariff) 9 528 77.00 316 0.00
18 Maize(Rabi) 3 48 68.00 393 0.00
19 Turmeric(Khariff) 2 8 0.00 0 0.00
20 Redgram(Rabi) 3 20 0.00 0 0.00
21 Chillies(Rabi) 2 30 220.00 341 0.00
22 Mango(Khariff) 2 0 0.00 0 0.00
- - - - - Source: Department of Economics & Statistics, Chennai.
P a g e | 44
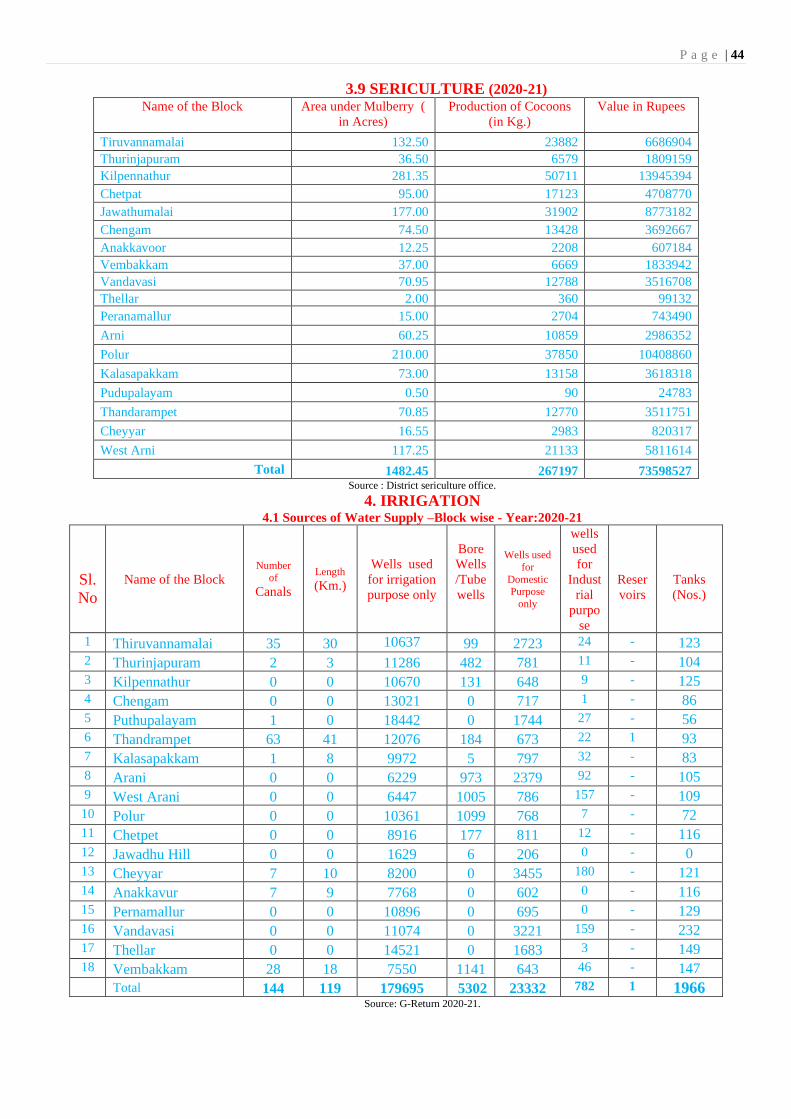
3.9 SERICULTURE (2020-21)
Name of the Block
Area under Mulberry (
in Acres)
Production of Cocoons
(in Kg.)
Value in Rupees
Tiruvannamalai 132.50 23882 6686904
Thurinjapuram 36.50 6579 1809159
Kilpennathur 281.35 50711 13945394
Chetpat 95.00 17123 4708770
Jawathumalai 177.00 31902 8773182
Chengam 74.50 13428 3692667
Anakkavoor 12.25 2208 607184
Vembakkam 37.00 6669 1833942
Vandavasi 70.95 12788 3516708
Thellar 2.00 360 99132
Peranamallur 15.00 2704 743490
Arni 60.25 10859 2986352
Polur 210.00 37850 10408860
Kalasapakkam 73.00 13158 3618318
Pudupalayam 0.50 90 24783
Thandarampet 70.85 12770 3511751
Cheyyar 16.55 2983 820317
West Arni 117.25 21133 5811614
Total 1482.45 267197 73598527 Source : District sericulture office.
4. IRRIGATION 4.1 Sources of Water Supply –Block wise - Year:2020-21
Sl.
No
Name of the Block
Number
of
Canals
Length
(Km.)
Wells used
for irrigation
purpose only
Bore
Wells
/Tube
wells
Wells used
for
Domestic Purpose
only
wells
used
for
Indust
rial
purpo
se
Reser
voirs
Tanks
(Nos.)
1 Thiruvannamalai 35 30 10637
99 2723 24 - 123
2 Thurinjapuram 2 3 11286 482 781 11 - 104
3 Kilpennathur 0 0 10670 131 648 9 - 125
4 Chengam 0 0 13021 0 717 1 - 86
5 Puthupalayam 1 0 18442 0 1744 27 - 56
6 Thandrampet 63 41 12076 184 673 22 1 93
7 Kalasapakkam 1 8 9972 5 797 32 - 83
8 Arani 0 0 6229 973 2379 92 - 105
9 West Arani 0 0 6447 1005 786 157 - 109
10 Polur 0 0 10361 1099 768 7 - 72
11 Chetpet 0 0 8916 177 811 12 - 116
12 Jawadhu Hill 0 0 1629 6 206 0 - 0
13 Cheyyar 7 10 8200 0 3455 180 - 121
14 Anakkavur 7 9 7768 0 602 0 - 116
15 Pernamallur 0 0 10896 0 695 0 - 129
16 Vandavasi 0 0 11074 0 3221 159 - 232
17 Thellar 0 0 14521 0 1683 3 - 149
18 Vembakkam 28 18 7550 1141 643 46 - 147
Total 144 119 179695 5302 23332 782 1 1966 Source: G-Return 2020-21.

P a g e | 45
4.2 Actual area irrigated by source-(Area in Hectares) - Year:2020-21
Source Number
Net Area Irrigated
Gross Area Irrigated
I. Surface Water: Nil
1. Canals
i) Government Canals
ii) Private Canals
144
----
1162
----
1162
---
2. Tanks
3. Large
i) Small
605
1361
34905
16995
37458
18108
3. Flow Irrigation
i) Major & Medium
ii) Minor
Nil
Nil
--
--
--
--
4. Lift Irrigation:
i) Major & Medium
ii) Minor
Nil
Nil
--
--
--
--
5. Ponds
i) Lift Irrigation
iii) Minor Irrigation
6. Other Sources:
i) Lift Irrigation
ii) Flow1 Irrigation
II Ground Water:
1. Public
2. Private Tube/Bore Wells
3. Dug Wells
I) With Pump sets
ii) Without Pump sets
Nil
Nil
Nil
Nil
Nil
5302
180932
--
--
--
--
--
3594
150284
--
--
--
--
--
6345
256044
4.3 Area cultivated by crops- Year:2020-21
Sl.No. Crop Area (in Hect.)
1 PADDY 170608
2 CHOLAM 37
3 MAIZE 965
4 CUMBU 6034
5 RAGI 4408
6 SAMAI 5418
7 ONION 247
8 TURMARIC 294
9 RED GRAM 1643
10 GREEN GRAM 2136
11 BLACK GRAM 39830
12 CHILLIES 2344
13 SUGAR CANE 11819
14 GROUND NUT 92990
15 GINGELLY 2263
16 COCONUT 746
17 COTTON 282
18 BANANA 3281
19 Vegetables 12053
20 Fruits 6486
21 Flowers 4609
22 OTHERS 11118
TOTAL 379611 Source: G-Return 2020-21.

P a g e | 46
Cultivated Area by crops-Year:2020-21
Source: ‘G’ Return 2020-21
161679
35
749
4063
3877
4825
103
341
1351
1962
359441443
12709
81214
2525 591
396
2682
8113
58684937
15600
PADDY
CHOLAM
MAIZE
CUMBU
RAGI
SAMAI
ONION
TURMARIC
RED GRAM
GREEN GRAM
BLACK GRAM
CHILLIES
SUGAR CANE
GROUND NUT
GINGELLY
COCONUT
COTTON
BANANA
Vegetables
Fruits
Flowers
OTHERS

P a g e | 47
4.4 Details of Dams, Tanks, Wells and Bore Wells Year : 2020-21
Sl.
No.
Name of the
Block
Dams Tanks
No
. o
f W
ells
in
use
No
. o
f
Tan
ks
Cat
chm
ents
area
Wat
er s
pre
ad
area
Hei
gh
t
Cap
acit
y
Len
gth
of
can
als
Wat
er
spre
ad a
rea
Cap
acit
y
Hei
gh
t
Len
gth
of
can
als
1 Thiruvannamalai
13483 123
2 Thurinjapuram
12560 104
3 Kilpenathur 11458 125
4 Chengam 13739 86
5 Puthupalayam 20213 56
6. Thandrampet 4480 4500 119 8100 35.00 12955 93
7. Kalasapakkam 10806 83
8. Arani 9673 105
9. West Arani 8395 109
10. Polur 12235 72
11. Chetpet 9916 116
12. Jawadhu Hill 1841 0
13. Cheyyar 11835 121
14. Anakkavur 8370 116
15. Pernamallur 11591 129
16. Vandavasi 14454 232
17. Thellar 16207 149
18. Vembakkam 9380 147
TOTAL 4480 4500 119 8100 35.00 209111 1966
Source: ‘G’ Return 2020-21

P a g e | 48
5. ANIMAL HUSBANDARY 5.1 Livestock Population- 2020-21
Sl.No.
Classification
Numbers
1. Cattle
1. Male
i.Under one year ii.. 1 to
2.5 Years
iii.. Over 2.5 years
Total
2. Female
i.Under one year
ii. 1 to 2.5 years
iii. Over 2.5 years
a. In milk
b. Dry
c. Not calved even once
Total
Cattle Total
3. Sheep
4. Goats
5. Horses and Ponies
6. Pigs
7. Mules
8. Camels
9. Donkeys
10. Domestic Dogs
TOTAL LIVESTOCK
II. Poultry
1. Fowls
2. Ducks
3. Others
Total Poultry
42100
58350
60960
161410
26200
51500
93201
218200
70820
60150
520071
681481
177712
248410
113
5361
0
0
98
4550
1117725
247711
0
0
0
247711
Source: 19th Livestock Census. 2012
5.2 VETERINARY INSTITUTIONS AND ANIMALS TREATED –2020-21
Veterinary Institutions
Su
b-c
entr
es
Up
gra
ded
Sub
-
centr
es
Other Units
Animals
treated
Castrati
on
perform
ed
Poly-
clinic
Hos-
pitals
Dispen-
saries
Clini-cian
Centres
Animal
disease
investiga
tion unit
Mobile
units
Nill 5 124 1 21 -- 1 3 1529050 12750
Source: District Animal Husbandry Office.

P a g e | 49
5.3. NUMBER OF VETERINARY INSTITUTIONS Year: 2020-21
Sl.No. Name of the District Number of
Government Institutions Private Hospitals
1 Tiruvannamalai 155 ----
Source: District Animal Husbandary Office.
5.4 DAIRY DEVELOPMENT
Year: 2020-21
Name of the
Block/Urban Town No of milk societies
Quantity of milk produced
(In Litres Perday)
Value of milk produced
(In Rs.in Lakh)
Tiruvannamalai 72 42197 1265910
Thurinjapuram 68 35570 1067100
Kilpennathur 35 20335 610050
Chengam 41 33700 1011000
Pudhupalayam 26 7300 219000
Thandarampattu 53 16250 487500
Polur
72 43737 1312110
Kalasapakkam 36 14239 427170
Chetpet 28 15915 477450
Jawadhuhills 5 916 27480
Arni
17 22746.5 682395
Arni (W) 21 8778.5 263355
Cheyyar
19 20435 613050
Anakkavur 9 2433 72990
Vembakkam 22 7373 221190
Vandavasi 21 6222.5 186675
Thellar 26 6345.5 190365
Peranmallur 35 8696.5 260895
Total 606 313189.5 9395685 Source: District Register Milk Societies
5.5 POULTRY DEVELOPMENT-2020-21
Sl.No. Name of the District Broiler (No’s) Layer (No’s)
1 Tiruvannamalai 142320 45830
Source: District Poultry Development Offic
5.6 FISHERIES DEVELOPMENT AND PRODUCTION-2020-21
Name and Address of Fishing centres Inland Fish Catch
(Tonne)
Marine Fish
Catch (Tonne)
Number of Fisherman
engaged
TamaraiKulam –TVMalai
Nil
Ayyan kulam- T.V.Malai Nil
Agnithertham-T.V.Malai Nil
Esanya kulam-T.V.Malai Nil
Sathanur Dam 72.194 Nil 43
District Total 72.194 43
Source: Inspector of Fisheries., Tiruvannamalai.

P a g e | 50
6. BANKING AND INSURANCE
6.1 No. of Commercial Banks
Performance of Banks under key Indicators as of March 2021. Tiruvannamalai.
Conts…
S.
No. Name of the Bank U SU R Total Deposits Advances
CD
Ratio Total PSA
% of
PSA
1 State Bank group 6 8 13 27 1863.10 1631.27 88 1631.27 100
Sub Total 6 8 13 27 1863.10 1631.27 88 1631.27 100
Nationalized Banks
2 Andhra Bank - - - - - - - - -
3 Bank of Baroda 2 1 2 5 95.03 197.50 208 184.04 93
4 Bank of India 1 0 3 4 106.68 122.83 115 112.75 65
5 Canara Bank 2 6 6 14 434.64 856.35 197 805.97 94
6 Central Bank of India 1 1 2 4 59.72 192.65 323 187.52 97
7 Corporation Bank - - - - - - - - -
8 Indian Bank 4 10 33 47 2622.28 2947.48 112 2811.71 95
9 Indian Overseas Bank 3 8 10 21 654.19 683.30 104 667.13 98
10 Union Bank of India 3 7 8 18 470.05 479.59 102 207.10 43
11 Syndicate Bank - - - - - - - - -
12 Punjab National Bank 1 4 0 5 11.75 72.60 618 35.59 49
13 UCO Bank 1 0 0 1 14.10 24.04 171 22.90 95
14 IDBI Bank 1 1 0 2 42.96 32.17 75 54.39 169
15 Vijaya Bank - - - - - - - - -
Sub Total 19 38 64 121 4511.4 5608.51 2025 5089.1 898
Private Sector Banks
16 South Indian Bank 0 0 1 1 11.71 36.94 315 28.81 78
17 ICICI Bank 1 5 8 14 204.99 424.90 207 269.09 63
18 Karur Vysya Bank 1 6 6 13 373.06 530.84 142 390.01 73
19 Lakshmi Vilas Bank 1 1 2 4 51.85 20.61 40 13.20 64
20 TN Mercantile Bank 1 3 0 4 166.85 87.21 52 66.31 76
21 HDFC Bank 1 1 2 4 161.01 554.15 344 147.22 27
22 Axis Bank 1 2 1 4 223.71 195.63 87 188.91 97
23 City Union Bank 1 3 1 5 25.48 267.20 1049 162.99 61
24 Kotak 1 1 0 2 46.58 66.48 143 45.23 68
Sub Total 8 22 20 50 1265.24 2183.96 2379 1311.77 607
Regional Rural Banks
25 Pallavan Gramina Bank 1 3 8 12 116.78 273.91 235 265.65 97
Sub Total 1 3 8 12 116.78 273.91 235 265.65 97
Co-operative Banks
26 TDCCB 4 8 22 34 1076.47 1433.47 133 564.45 39
Sub Total 4 8 22 34 1076.47 1433.47 133 564.45 39
Total 38 77 130 245 8832.99 11131.11 126 8862.24 80

P a g e | 51
Conts….
S.N
o
Name of the Bank
Agri
Adv.
Out of
Agri.
LS&MF
% of
Agri
MSME
Out of
MSME
Micro
Export
credit
Education
Housing
1 State Bank of India 655.89 393.53 40 160.59 64.88 0.00 25.22 786.13
Sub Total 655.89 393.53 40 160.59 64.88 0.00 25.22 786.13
Nationalized Banks
2 Andhra Bank
3 Bank of Baroda 134.28 134.28 68 20.35 20.35 0.00 3.62 25.80
4 Bank of India 80.25 0.00 65 13.60 0.00 0.00 9.84 9.05
5 Canara Bank 652.60 581.25 76 103.29 56.19 0.00 27.47 22.60
6 Central Bank of India 141.54 0.00 73 22.80 10.52 0.00 10.72 12.46
7 Corporation Bank - - - 0 0 0 0 0
8 Indian Bank 2438.40 1140.65 83 166.40 18.22 0.00 85.18 63.89
9 Indian Overseas Bank 452.10 390.95 66 140.52 50.86 0.00 52.95 21.56
10 Union Bank of India 31.35 24.34 7 112.91 42.61 0.00 20.50 40.42
11 Syndicate Bank - - - 0 0 0 0 0
12 Punjab National Bank 17.08 10.63 24 13.54 11.75 0.00 2.10 2.85
13 UCO Bank 4.29 4.29 18 2.08 0.00 0.00 0.28 1.69
IDBI Bank 38.76 17.56 120 10.52 10.05 0.00 0.33 4.78
15 Vijaya Bank - - - 0 0 0 0 0
Total Nationalised Bank 3990.65 2303.95 600 606.01 220.55 0.0 212.99 205.1
Private Sector Banks
16 South Indian Bank 20.87 0.00 56 3.62 3.62 0.00 0.12 4.21
17 ICICI Bank 210.98 0.00 50 55.31 0.00 0.00 0.09 2.59
18 Karur Vysya Bank 262.84 0.00 50 80.61 0.00 0.00 1.86 44.69
19 Lakshmi Vilas Bank 4.90 4.90 24 7.31 0.00 0.00 0.21 0.78
20 TN Mercantile Bank 13.86 0.00 16 44.14 0.00 0.00 0.00 8.31
21 HDFC Bank 103.58 27.24 19 3.76 0.00 0.00 0.82 26.17
22 Axis Bank 150.97 84.18 77 23.36 0.00 0.00 0.02 0.00
23 City Union Bank 88.16 66.21 33 63.24 50.32 0.00 0.72 10.86
24 Kotak 29.55 16.57 44 8.19 4.35 0.00 0.00 0.00
Total Private Sector Banks 885.71 199.1 369 289.54 58.29 0.0 3.84 97.61
Regional Rural Banks
25 Pallavan Gramina
Bank 206.83 0.00 76 58.52 0.00 0.00 0.00 0.00
Sub Total 206.83 0.00 76 58.52 0.00 0.00 0.00 0.00
Co-operative Banks
26 TDCCB 33.90 31.15 2 0.42 0.42 0.00 0.00 10.94
Sub Total 33.90 31.15 2
Total 5772.98 2927.74 52 1115.40 344.14 0.00 242.06 1099.79

P a g e | 52
Source: Lead bank Tiruvannamalai Dt.(Indian Bank).
S
.
N
o
.
Name of the Bank
Renewa
ble
Energy
Social
Infra Others WS Adv. DRI SC/ST SHG’s
1 State Bank of India 0.00 1.73 1.71 457.02 0.08 75.24 6.74
Sub Total 0.00 1.73 1.71 457.02 0.08 75.24 6.74
Nationalized Banks
2 Andhra Bank
3 Bank of Baroda 0.00 0.00 0.00 0.94 0.00 3.40 9.01
4 Bank of India 0.00 0.00 0.00 0.00 0.00 0.00 0.00
5 Canara Bank 0.00 0.00 0.01 147.88 0.13 19.89 4.99
6 Central Bank of India 0.00 0.00 0.00 0.00 0.00 0.00 0.00
7 Corporation Bank 0 0 0 0 0 0 0
8 Indian Bank 0.48 4.59 52.77 1294.64 0.00 111.53 21.30
9 Indian Overseas Bank 0.00 0.00 0.00 3.52 2.55 3.01 7.08
10 Union Bank of India 0.00 0.00 1.92 4.50 0.06 1.75 8.02
11 Syndicate Bank 0 0 0 0 0 0 0
12 Punjab National Bank 0.00 0.00 0.01 17.78 0.00 0.00 0.00
13 UCO Bank 0.00 0.00 14.55 0.00 0.00 0.41 0.00
14 IDBI Bank 0.00 0.00 0.00 35.40 0.00 0.00 0.00
15 Vijaya Bank 0 0 0 0 0 0 0
Total Nationalised Bank 0.48 4.59 69.26 1504.66 2.74 139.99 50.4
Private Sector Banks
16 South Indian Bank 0.00 0.00 0.00 0.00 0.00 0.00 0.00
17 ICICI Bank 0.00 0.00 0.13 164.13 0.00 0.93 22.64
18 Karur Vysya Bank 0.00 0.00 000 0.00 0.00 0.00 0.00
19 Lakshmi Vilas Bank 0.00 0.00 0.00 0.00 0.00 0.00 0.00
20 TN Mercantile Bank 0.00 0.00 0.00 0.00 0.00 0.00 0.00
21 HDFC Bank 0.00 0.00 12.88 71.14 0.00 0.65 0.00
22 Axis Bank 0.00 0.00 14.55 87.85 0.00 3.66 0.00
23 City Union Bank 0.00 0.00 0.00 0.00 0.00 0.39 0.00
24 Kotak 0.00 0.00 7.49 28.55 0.00 7.88 0.00
Total Private Sector Banks 0.0 0.0 35.05 351.67 0.0 13.51 22.64
Regional Rural Banks
25 Pallavan Gramina Bank 0.00 0.00 0.00 0.00 0.00 0.00 6.22
Sub Total 0.00 0.00 0.00 0.00 0.00 0.00 6.22
Co-operative Banks
26 TDCCB 0.00 0.00 519.19 7.63 0.00 0.99 162.76
Sub Total 0.00 0.00 519.19 7.63 0.00 0.99 162.76
Total 0.48 6.32 625.20 2320.97 2.82 229.73 250.78
P a g e | 53
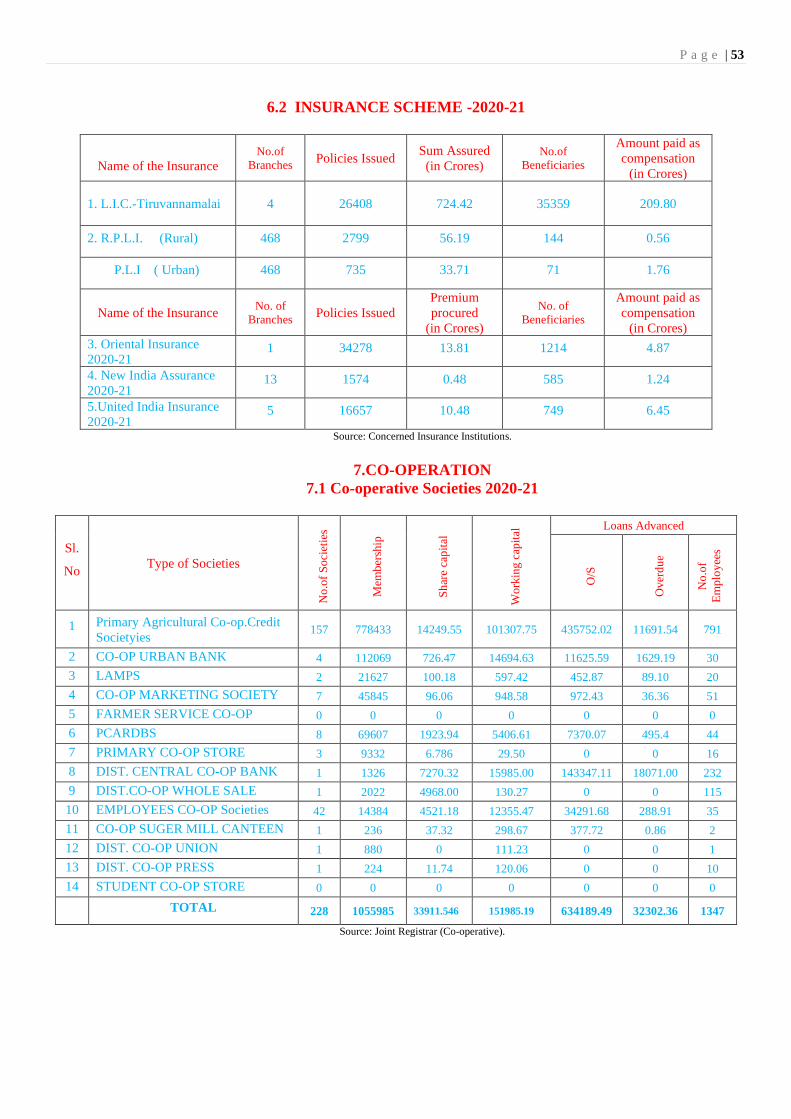
6.2 INSURANCE SCHEME -2020-21
Name of the Insurance No.of
Branches Policies Issued
Sum Assured
(in Crores) No.of
Beneficiaries
Amount paid as
compensation
(in Crores)
1. L.I.C.-Tiruvannamalai 4 26408 724.42 35359 209.80
2. R.P.L.I. (Rural) 468 2799 56.19 144 0.56
P.L.I ( Urban) 468 735 33.71 71 1.76
Name of the Insurance No. of
Branches Policies Issued
Premium
procured
(in Crores)
No. of
Beneficiaries
Amount paid as
compensation
(in Crores)
3. Oriental Insurance
2020-21 1 34278 13.81 1214 4.87
4. New India Assurance
2020-21 13 1574 0.48 585 1.24
5.United India Insurance
2020-21 5 16657 10.48 749 6.45
Source: Concerned Insurance Institutions.
7.CO-OPERATION
7.1 Co-operative Societies 2020-21
Sl.
No Type of Societies
No
.of
So
ciet
ies
Mem
ber
ship
Sh
are
cap
ital
Wo
rkin
g c
apit
al Loans Advanced
O/S
Ov
erd
ue
No
.of
Em
plo
yee
s
1 Primary Agricultural Co-op.Credit
Societyies 157 778433 14249.55 101307.75 435752.02 11691.54 791
2 CO-OP URBAN BANK 4 112069 726.47 14694.63 11625.59 1629.19 30
3 LAMPS 2 21627 100.18 597.42 452.87 89.10 20
4 CO-OP MARKETING SOCIETY 7 45845 96.06 948.58 972.43 36.36 51
5 FARMER SERVICE CO-OP
SOCIETIES
0 0 0 0 0 0 0
6 PCARDBS 8 69607 1923.94 5406.61 7370.07 495.4 44
7 PRIMARY CO-OP STORE 3 9332 6.786 29.50 0 0 16
8 DIST. CENTRAL CO-OP BANK 1 1326 7270.32 15985.00 143347.11 18071.00 232
9 DIST.CO-OP WHOLE SALE
STORE
1 2022 4968.00 130.27 0 0 115
10 EMPLOYEES CO-OP Societies 42 14384 4521.18 12355.47 34291.68 288.91 35
11 CO-OP SUGER MILL CANTEEN 1 236 37.32 298.67 377.72 0.86 2
12 DIST. CO-OP UNION 1 880 0 111.23 0 0 1
13 DIST. CO-OP PRESS 1 224 11.74 120.06 0 0 10
14 STUDENT CO-OP STORE 0 0 0 0 0 0 0
TOTAL 228 1055985 33911.546 151985.19 634189.49 32302.36 1347
Source: Joint Registrar (Co-operative).

P a g e | 54
8. CIVIL SUPPLIES
8.1 No. of Fair Price Shops
Year:2020-21
Sl.No.
Name of the Taluck / Municipalities No.of Shops
TALUK
1 TIRUVANNAMALAI 226 2 CHENGAM 167 3 POLUR 138 4 ARNI 134 5 CHEYYAR 166 6 VANDAVASI 230 7 THANDRAMPAT 113 8 KALASAPPAKKAM 92 9 CHETPET 107
10 VEMBAKKAM 106 11 KILPENNATHUR 118 12 JAWADHUHILLS 35
Total 1633 MUNICIPALITIES
1 TIRUVANNAMALAI 50 2 CHEYYAR 12 3 ARNI 17 4 VANDAVASI 10 Total 89 Grand total 1722
Source: District Supplies Office.
8.2 QUANTUM OF ESSENTIAL COMMODITIES DISTRTIBUTED
AND THEIR RETAIL PRICES-2020-21
Sl.No Name of the Commodity Issue Price
per (Kg.) Scale of Supply (in Tones)
1 Rice-- Super Fine, Fine,
Common
Free 120891.9
2 A.A.Y. Rice Free 30324.86
3. Wheat Free 6961.796
4. Sugar 25.00 11032.85
5. Palmoelin Oil 25.00 7580.757
6. Toor dall 30.00 7168.823
7. Urid dall - -
8. Kerosene 13.70 to
14.20/ Lt 5316kl
9. Atta -- -
Source: District Supplies Office.
8.3 NO.OF RATION CARDS (RURAL AND URBAN)-2020-21
Region
No.of Ration Cards
RURAL & URBAN 685892 Source: District Supplies Office.

P a g e | 55
8.4 QUANTITY SUPPLIED-2020-21
Sl.No. Items Quantity Supplied (In Ton)
1. Rice (Tone) 130413.6
2. Wheat (Tone) 7545.339
3. Sugar (Tone) 11382.24
4. Toor Dhall 8084.612
5. Palmoelin Oil 7812.453
6. Kerosene (Kilo Liter) 5316Kl
7. Others (Specified)A.A.Y Rice M.D) 30789.48
Source: District Supplies Office.
8.5 NO.OF L.P.G. CONNECTIONS-2020-21
Sl.N
o. Name of the Taluk
Government
L.P.G.Connections
Private L.P.G.
Connections Single Double Single Double
1 Tiruvannamalai 57436 45358 - -
2 Chengam 46462 18224 - -
3 Polur 36752 20369 - -
4 Arni 40290 26416 - -
5 Cheyyar 30355 21485 - -
6 Vandavasi 37495 22857 - -
7 Thandrampet 32891 12724 - -
8 Kalasapakkam 19477 9827 - -
9 Chetpet 23219 10317 - -
10 Vembakkam 22788 8040 - -
11 Kilpennathur 29547 12290 - -
12 Jamunamarathur 5089 587
Total 381801 208494 - - Source: DSO-Tiruvannamalai
8.6 NO.OF PERSONS WAITING FOR L.P.G. CONNECTIONS-Year:2020-21
Sl.
No. Name of the Taluk Government L.P.G. Connections Private L.P.G. Connections
1 Tiruvannamalai
- Nil -
2 Chengam
3 Polur
4 Arni
5 Cheyyar
6 Vandavasi
7 Chetpet
8 Vembakkam
9 Thandrampet
10 Kalasapakkam
11 Kilpennathur
12 Jawadhu Hills
Total Source: District Supplies Office.

P a g e | 56
9. COMMUNICATIONS
9.1 Post Offices doing postal business only-Year : 2020-21
Sl.
No
.
Name of the
Blocks/Municipalities
Post Office
doing postal
business only
(Nos.)
Sl.N
o
Name of the
Blocks/Municipalities
Post Office
doing
postal
business
only (Nos.) 1 Tiruvannamalai 30 13 Cheyyar 28
2 Thurinjapuram 20 14 Anakkavoor 12
3 Kilpennathur 27 15 Vembakkam 14
4 Chengam 46 16 Vandavasi 37
5 Pudupalayam 14 17 Thellar 22
6 Thandrampat 32 18 Peranamallur 23
7 Polur 43 Municipalities
8 Kalasapackam 24 1 Tiruvannamalai 8
9 Chetpat 12 2 Cheyyar 4
10 Jawadhu -- 3 Arni 4
11 Arni 24 4 Vandavasi 2
12 Arni (w) 29 District Total 455 Source: District Head Post Office.
9.2 POST OFFICE DOING POSTAL BUSINESS ONLY – Year -2020-21
Sl.No. Name of the District Post Office doing postal business only
(Nos.)
1 Tiruvannamalai 455 Source: District Head Post Office.
9.3 TELEGRAPH OFFICE-2020-21
Sl.No. Name of the
Blocks/Municipalities
No ofTelegraphic office
(Nos.)
1 Tiruvannamalai
All telegraph offices are connected to BSNL
customer service centre .it is working on WTMS
( Web Based Telegraph Message System)
Telegram given through phonogram service (I,e)
no is 1585
Source: District Telecommunication Department. (Vellore)
9.4 NO.OF TELEPHONE EXCHANGES, CAPACITY AND USE-2020-21
Source: District Telecommunication Office.
9.5 NO.OF PUBLIC CALL OFFICES ATTACHED TO EACH EXCHANGE-2020-21
Sl.N
o. Name of the Exchange Centre
No.of Public Call Offices
With STD/ISD Without STD/ISD
1 Tiruvannamalai
(14 exchange )
65 7
2 Arni
( 9 exchange )
7 2
3 Vandavasi
( 6 exchange )
11 2
4 Polur
( 8 exchange )
8 1
5 Thiruvathipuram
(9 exchange )
7 2
6 Chengam
( 10 exchange)
45 6 Source: District Telecommunication Office.
Sl.No. Item Numbers
1. Number of Telephone Exchanges 62
2. Number of Equipped Capacity 44458
3. Number of Direct Exchange Lines 18325
4. Number of Junction Lines 1426
5. Number of Telephones in use 18325

P a g e | 57
9.6 NO.OF PERSONS WAITING FOR PHONE CONNECTION-2020-21
Sl.N
o. Name of the Exchange Centres
No.of persons waiting for phone
connections
1 Tiruvannamalai-(13 exchange )
2 Arni-( 9 exchange )
3 Vandavasi-( 9 exchange )
4 Polur-( 7 exchange ) Nil
5 Thiruvathipuram-( 9 exchange )
6 Chengam-( 8 exchange)
7 Thandrampattu-( 4 exchange)
8 Kalasapakkam-( 3 exchange)
Source: District Telecommunication Office.
10. ELECTRICITY
10.1 No.of Power Stations -2020-21
Sl.No. Name of the
Power Stations
Year of
Operation
Installed
Capacity
(M.W.)
Generation
(M.U.)
Station
Consumption
(M.U.)
Nett Unit sent
out (M.U.)
1. Hydro --- --- --- --- ----
2. Thermal --- --- --- --- ----
3. Gas Turbine --- --- ---- ---- ----
4. Wind Mills Source: District Electricity Board.
10.2 QUANTUM OF POWER PURCHASED-:2020-21
Power purchased sectors name Power purchased in M.U.
Cheyyar C0-0p suger mill 17.291
Dharani sugar mill 0 Bannari Amman Sugars Ltd 49.161 Global power tech Equipment Ltd. 0 M/s. shapooriji pallonji solar pv private limited 0
Total 66.452 Source: District Electricity Board
10.3 Power Consumption Sector wise -2020-21
Source: District Electricity Board
Sl.No. Sectors Consumption in M.U.
% of the Consumption
LT
LT
HT
HT
LT HT
1 Industries 50.94 93.715 5.06 1.34
2 Agriculture & Huts 9.14 0 1 0
3 Domestic 683.33 0 67.86 0
4 Commercial 106.5 1.277 10.57 98.66
5 Public lighting and Public
Works
85.38 0 8.48 0
6 Sales to other Licenses 0 0 0 0
7 Sales to other States 0 0 0 0
8 Miscellaneous 71.59 0 7.11 0
9 Recovery of edcational
institution 0 0 0 0
Total 1006.88 94.992 89.28 100

P a g e | 58
10.4 Peak Demand and Energy Output- 2020-21
Source: District Electricity Board
10.5 Revenue from Electric Schemes and cost per unit-2020-21
Sectors
Cost per unit
Income in Rs.in
lakhs
1. Government 7.09 39.6 280.98
2. Public 6.64 855 5676.95
3. Private 3.02 9187.1 27745.15
Total 16.75 10081.7 33703.08
Source: District Electricity Board
10.6 Transmission and Distribution of Electricity-2020-21
Source: District Electricity Board
Power Demand Details
1. Instantaneous peak demand
382 MW
2. Sustained peak demand 300 MW
Sl.
No.
Item
Unit
Voltage Ratio
Unit/
Power
Trs. Capacity Type
Approved No
& Date Achievement
1 Purisai 230 KV SS 230/110 2X100 New 07/04.02.13 Achieved
2 Athimoor 33/11 1X8 New 381/05.09.13 Achieved
3 Mambattu 33/11 1X8 New 227/07.06.18 Achieved
4 Palli 33/11 1X8 New 248/24.06.13 Achieved
5 Ariyapady 33/11 1X8 New 419/07.08.17 Achieved
6 Perumpallam 33/11 1X8 New 602/10.11.17 Achieved
7 Kadalady 33/11 1X8 New 393/28.07.17 Achieved
8 Adaiyur 33/11 1X8 New 452/31.08.17 Achieved
9 Sathiyavady 33/11 1X8 New 348/07.07.17 Achieved
10 Aratavady 33/11 2X8 New 158/20.04.18 Achieved
11 Kelur 33/11 2X8 New 391/04.11.19 Work Under
Progress
12 Pallavaram 33/11 2X8 New 99/09.04.2020 Work Under
Progress

P a g e | 59
10.7 Capacity of Transformers-:2020-21
Sl.
No
Name of the Stations / Sub
Stations
Voltage
ratio
Capacity
( in MVA) Sl.
No
Name of the
Stations / Sub
Stations
Voltag
e ratio
Capacity
( in MVA)
1 Thiruvannamalai 230/110
KV SS 230/110 2x160+2x100 46 Paiyur 33/11 2x8
2 Arni 230/110 Kv 230/110 4x80 47 Mallavadi 33/11 1x8
3 Echur 230/110 KV 230/110 2x100 48 Ananthapuram 33/11 2x8
4 Thiruvannamalai 110/33-
11 KV SS 110/33/11
2x16 (33KV),2x10
(11 KV) 49 Somasipadi 33/11 1x5+1x8
5 Arni 110/33-11 KV SS 110/33/11 2x25
(33KV),2x16(11Kv) 50 Edapalayam 33/11 2x8
6 Polur 110/33-11 KV SS 110/11 1X25 (33 KV),2X16
(11KV) 51 Mandakolathur 33/11 2x8
7 Samudiram 110/33-11 KV
SS 110/33/11
2x16 (33KV),2x10
(11KV) 52 Palli 33/11 1x8
8 Thandrampet 110/33-11
KV SS 110/33/11
1x25+1x16
(33KV),2x10 (11KV) 53 Athimoor 33/11 2x8
9 Vandavasi 110/33-11 KV
SS 110/33/11
1x25+1x16
(33KV),2x10 (11KV) 54 Mampattu 33/11 1x8
10 Kanji 110/33-11 KV SS 110/33/11 2x10 (33KV),1x16
(11KV) 55 Melma 33/11 2x8
11 Chengam 110/33-11 KV
SS 110/33/11 1x10 (33KV),2x10
(11KV) 56 Ariyalam 33/11 2x8
12 Santhavasal 110/33-11 KV
SS 110/33/11
1x16+1x25
(33KV),2X16
(11KV)
57 Varagur 33/11 1x8
13 Mangalam 110/33-11 KV
SS 110/33/11
1x16+1x10
(33KV),1x16 (11KV)
1x10 (11 KV)
58 Appedu 33/11 1x8
14 Mangal 110/33-11 KV SS 110/33/11 1x16 (33KV),2x10
(11KV) 59 Vandavasi 33/11 2x8
15 Sirungattur 110/33-11 KV
SS 110/22 2x25 (33KV),1x10
(11KV) 60 Onnupuram
33/11 2x8
16 Vembakkam 110/11 KV
SS 110/11 1x16+2x10 61 Ariyapadi
33/11 1x8
17 Chetpet 110/11 KV SS 110/10 1x16+1x10(33KV)+
2x10(11KV) 62 Perumpallam
33/11 1x8
18 Vinnavanoor 110/11 KV
SS 110/22 2x10(110/11) 63 Kannamangalam 33/11 2x8
19 Vettavalam 110/22 KV SS 110/33/11 1x16 64 Perungulathur SS 33/11 2x8
20 Rajanthangal 110/22 KV
SS 110/33/11 2x10 65 Pudupalayam SS 33/11 2x8
21 Mazhaiyur 110/33/11 KV
SS 110/33/11 2x25+2x8 66 Seeyamangalam SS
( Desur) 33/11 2x8
22 Adamangalam 110/11 KV
SS
110/33,33/
11 2x10 67 Kadalady SS 33/11 1x8
23 Kilpennathur 110/33 Kv
SS 110/11
1x25+1x16(110/33)+
2x16(33/11) 68 Adaiyur SS 33/11 1x8
24 Ariyalam 110/33 KV SS 110/33 1x25 69 Sathiyavadi SS 33/11 1x8
25 Karapattu 110/33 1x16 70 Velleri 33/11 2x8
26 Brammadesam 33/11 3x8 71 Melchengam 33/11 1x8
27 Devikapuram 33/11 2x8 72 Mekkalur 33/11 1x8
28 Kilkodungalore 33/11 2x8 73 Thatchampady 33/11 1x8
29 Kottaiyur 33/11 2x8 74 Thiruvannamalai
UM SS 33/11 1x5
5 30 Madurai 33/11 2x8 75 Jamunamarathur
UM SS 33/11 1X8
31 Mansurabath 33/11 2x8 76 Purasai UM SS 33/11 1x5

P a g e | 60
32 Kunnathur 33/11 2x8 77 Anaibogi UM SS 33/11 1x8
33 Naidumangalam 33/11 2x8 78 Melravandavadi
UM SS 33/11 1X8
34 Pernamallur 33/11 2x8 79 Paramanandal UM
SS 33/11 1X8
35 Periyakollpplur 33/11 2x8 80 Nallur UM SS 33/11 1x8
36 Thatchampet 33/11 2x8 81 Malayanur
Chekkadi UM SS 33/11 1x8
37 Thanipadi 33/11 1x8+1x5 82 Sathanur UM SS 33/11 1x8
38
Thellar 33/11 2x8 83 Su.Valavetty UM
SS 33/11 1x8
39 Tiruvarthipuram 33/11 2x16 84 Pick up dam(LT) 33/11 1x3.15
40 Vadamathimangalam 33/11 1x5+1x8 85 Sathanurdam(LT) 33/11 1x1
41 Vettianthozhuvam 33/11 2x8 86 Doosi
(Abdullapuram)
(LT)
33/11 1x3.15
42 Vilvarani 33/11 2x8 87 SE Campus 33/11 1x0.5
43 Thirumani 33/11 2x8 88 Panaiolaipadi 33/11 1x8
44 Sirukalambadi 33/11 2x8 89 Arratavadi 33/11 1x8
45 Kalambur 33/11 2x8 Source: District Electricity Board
10.8 Rural Electrification-2020-21
10.9 Name and address of fault report offices-2020-21
Sl.No.
Name of the
Blocks/Municipalities
Name of the Stations/Sub Stations
No. of fault reported
Stations Sub Stations
1 Thiruvannamalai
Office of the
JE/W/ T.Malai
T.Malai 110/33-
11 KV 58
2 Chengam
Office of the
JE/T/ Chengam
Chengam
110/33-11 KV 42
3 Polur
Office of the
JE/T/ Polur
Polur 110/33-11
KV 51
4 Cheyyar
Office of the
JE/T/ Cheyyar
T.V.Puram 3/11
KV SS 62
5 Arni
Office of the
JE/T/ Arni
Arni 110/33-11
KV 58
6 Vandavasi
Office of the
JE/T/ Vandavasi
Vandavasi110/3
3/11 KV 54
7 Chetpet
Office of the
JE/T/ Chetpet
Chetpet 110/33-
11 KV 41 Source: District Electricity Board
11. Education
11.1 Universities, Students and Teachers and Courses offered-:2020-21
Sl.No
Name of the
University
Students Teachers
Name of the courses
offered
Boys
Girls
Total
-- Nil -- -- -- -- --
Source: Registrar of Respective University.
11.2 COLLEGES FOR GENERAL EDUCATION, STUDENTS AND TEACHERS-2020-21
Sl.No
Name of Institution No.of
Institution Students Teachers
Boys Girls Total
1. Government Arts College, Tiruvannamalai
1 2521 3944 6465 83
Electrified during the year Electrified up to the year
Towns
Village
Hamlet
Agricultural Pump set
Town
Village
Hamlet
Agricultural Pump set
- - - 1435 16 1067 2529 188619

P a g e | 61
2 Arignar Anna Government Arts College, Cheyyar
1 3397 3311 6708 60
3. Kamban College of Arts and Science for
Women, Mathur,Tiruvannamalai
1 -- 3290 3290 130
4 Shanmuga Industries Arts and Science
College, Manalurpet, Tiruvannamalai. 1 3582 1790 5372 196
5 Loyola College, Vettavalam. 1 869 424 1293 49
6 Indo-American College, Cheyyar 1 746 437 1183 91
7 Divya Arts and Science College, Chetpat,
Polur TK. 1 - 617 617 34
8 Sri Akilandeswari College for Women,
Vandavasi 1 -- 2330 2330 103
9 Idaya College of Arts and Science
College for Women, Pudupayayam 1 -- 225 225 39
10 Al-ameen Arts and Science College
Somasipadi,Tiruvannamalai 1 307 201 508 26
11 Sathyam Arts and Science College
Chengam. 1 124 70 194 29
12 Dr.MGR Chokkalingam Arts college
Irumbedu Arni 1 647 357 1004 50
13 King Nandhivarman Arts and Science
College, Thellar. 1 577 362 939 53
14 Indian Arts and Science College
Kariyandhal, Kondam. 1 145 60 205 47
15 Sri Bharathi Arts and Science
College,Kunnathur, Arni. 1 -- 1393 1393 90
16 Sun Arts and Science College,Keeranur,
Vettavalam rd 1 605 527 1132 58
7. Government Arts College, Thennagoor,
Vandavasi(Tk) 1 736 764 1500 39
18 Arivindhar Arts and Science
College,Kalasapakkam. 1 143 83 226 24
19 Sishya Arts &science college. 1 87 101 188 35
20 Karan Arts & Science College. 1 446 334 780 43
21 Arun krishana Arts and Science
College,Kalasapakkam. 1 25 30 55 11
22 Aruna vidhya Arts and Science
College,Kannakurukkai 1 481 217 698 53
11.3 (a) COLLEGE FOR PROFESSIONAL EDUCATION,(ENGINEERING & TECHNOLOGY)
STUDENTS AND TEACHERS-2020-21
Sl.No. Name of the Institutions No.of
Institutions
Students Teachers
Boys Girls Total
1
University College of Engineering,Arni (A
constituent College of Anna University,
Chennai) 1 471 217 688
39
2 Arunai Engineering College Tiruvannamalai 1 1090 539 1629 120
3 SKP Engineering College-Tiruvannamalai 1 355 193 548 39
4 Sri Balji Chokkalingam Engineering College
Arani 1 359 187 546
63
5 Arulmigu Meenachi Engineering College
Vadamavanandal 1 132 63 195
31
6 Thiruvalluvar college of Engineering &
Technology –Vandavasi-604505 1 548 237 785
137
7 Oxford College of Engineering, Venmani,
Polur 1 257 45 302
42
8 Annamalaiar College of Engineering,
Modaiyur, Polur 1 194 48 242
67
9 SRI College of Engineering & Technology,
Vandavasi 1 69 73 142
43
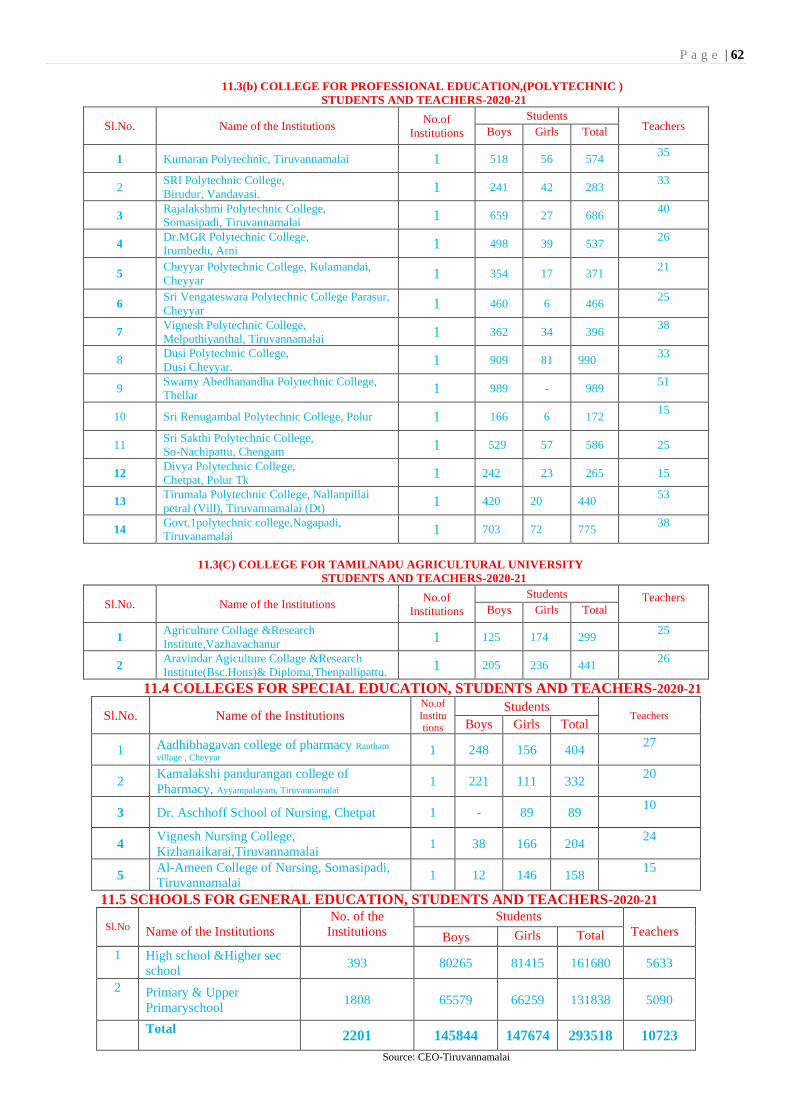
P a g e | 62
11.3(b) COLLEGE FOR PROFESSIONAL EDUCATION,(POLYTECHNIC )
STUDENTS AND TEACHERS-2020-21
Sl.No. Name of the Institutions No.of
Institutions
Students Teachers
Boys Girls Total
1 Kumaran Polytechnic, Tiruvannamalai 1 518 56 574 35
2 SRI Polytechnic College,
Birudur, Vandavasi. 1 241 42 283
33
3 Rajalakshmi Polytechnic College,
Somasipadi, Tiruvannamalai 1 659 27 686
40
4 Dr.MGR Polytechnic College,
Irumbedu, Arni 1 498 39 537
26
5 Cheyyar Polytechnic College, Kulamandai,
Cheyyar 1 354 17 371
21
6 Sri Vengateswara Polytechnic College Parasur,
Cheyyar 1 460 6 466
25
7 Vignesh Polytechnic College,
Melputhiyanthal, Tiruvannamalai 1 362 34 396
38
8 Dusi Polytechnic College,
Dusi Cheyyar. 1 909 81 990
33
9 Swamy Abedhanandha Polytechnic College,
Thellar 1 989 - 989
51
10 Sri Renugambal Polytechnic College, Polur 1 166 6 172 15
11 Sri Sakthi Polytechnic College,
So-Nachipattu, Chengam 1 529 57 586 25
12 Divya Polytechnic College,
Chetpat, Polur Tk 1 242 23 265 15
13 Tirumala Polytechnic College, Nallanpillai
petral (Vill), Tiruvannamalai (Dt) 1 420 20 440
53
14 Govt.1polytechnic college,Nagapadi,
Tiruvanamalai 1 703 72 775
38
11.3(C) COLLEGE FOR TAMILNADU AGRICULTURAL UNIVERSITY
STUDENTS AND TEACHERS-2020-21
Sl.No. Name of the Institutions No.of
Institutions
Students Teachers
Boys Girls Total
1 Agriculture Collage &Research
Institute,Vazhavachanur 1 125 174 299
25
2 Aravindar Agiculture Collage &Research
Institute(Bsc.Hons)& Diploma,Thenpallipattu. 1 205 236 441
26
11.4 COLLEGES FOR SPECIAL EDUCATION, STUDENTS AND TEACHERS-2020-21
Sl.No. Name of the Institutions No.of
Institutions
Students Teachers
Boys Girls Total
1 Aadhibhagavan college of pharmacy Rantham
village , Cheyyar 1 248 156 404
27
2 Kamalakshi pandurangan college of
Pharmacy, Ayyampalayam, Tiruvannamalai 1 221 111 332
20
3 Dr. Aschhoff School of Nursing, Chetpat 1 - 89 89 10
4 Vignesh Nursing College,
Kizhanaikarai,Tiruvannamalai 1 38 166 204
24
5 Al-Ameen College of Nursing, Somasipadi,
Tiruvannamalai 1 12 146 158
15
11.5 SCHOOLS FOR GENERAL EDUCATION, STUDENTS AND TEACHERS-2020-21
Sl.No
Name of the Institutions
No. of the
Institutions
Students
Teachers
Boys Girls
Total
1 High school &Higher sec
school 393 80265 81415 161680 5633
2 Primary & Upper
Primaryschool 1808 65579 66259 131838 5090
Total 2201 145844 147674 293518 10723
Source: CEO-Tiruvannamalai

P a g e | 63
11.6 SCHOOLS FOR PROFESSIONAL EDUCATION, STUDENTS AND TEACHERS-2020-21
Sl.
No
Name of the Institution
No. of the
Institutions
Students Teachers
Boys
Girls
Total
1 Govt.I.T.I, Tiruvannamalai 1 227 61 288 23
2 Govt.I.T.I, Jamunamarathur 1 151 10 161 20
3 I.T.I.-Self finance 19 2137 124 2261 171
Source: Concerned Institutions 11.7 SCHOOLS FOR SPECIAL EDUCATION, STUDENTS AND TEACHERS- 2020-21
Sl.No.
Name of the Institution
No. of the
Institution
Students Teachers
Boys
Girls
Total
1 District .Govt.Music School,
Tiruvannamalai 1 81 11 92
7
2 Rangammal Memorial Hss
for the DEAF TVMalai 1 185 118 303
47
3
Bon Secours higher
secondary School For
Hearing Impaired ,
Mamandur
1 48 37 85 16
Source: Concerned Institution.
11.8 INSTITUTIONS FOR OTHER PROFESSIONAL EDUCATION, STUDENTS AND TEACHERS- 2020-21
Sl.N0.
Teacher Training Institutions
No of
Institutions
Students
Teachers
Government Institution Total
Total
1 DIET, (Govt) Kilpennathur 1 8 12
Private Institutions
2 St.Mary’s TTI, Anmaruthai 1 9 7
3 Aravindar TTI , Thenpallipattu 1 2 7
11.9 Computer Training Centres-:2020-21
Sl
.no
Name of the
Block/Municipalities
No. of Computer
Training Centres Sl .no Name of the
Block/Municipalities
No. of Computer
Training Centers
1 Tiruvannamalai 0 10 Jawadhu 0
2 Thurinjapuram 0 11 Arni 0
3 Kilpennathur 0 12 Arni (w) 0
4 Chengam 0 13 Cheyyar 0
5 Pudupalayam 0 14 Anakkavoor 0
6 Thandrampat 0 15 Vembackam 0
7 Polur 0 16 Vandavasi 0
8 Kalasapackam 0 17 Thellar 0
9 Chetpat 0 18 Peranamallur 0
Source: Concerned Centres

P a g e | 64
11.10 HOSTELS AND INMATES BY COMMUNITY – 2020-21
No. of Hostels-51 (2020-
21)
No. of Hostels - 32
(2020-21) No. of Hostels-35(2020-21) No. of Hostels-14(2020-21)
Scheduled Caste Scheduled Tribe Most Backward Class and
Denitrified Communities Back ward Class
B
1
G
2
T
3
B
4
G
5
T
6
B
7
G
8
T
9
B
10
G
12
T
13
31 20 51 30 2 32 25 10 35 7 7 14
11.10 Contd… No. of Inmates
Scheduled Caste Scheduled Tribe Most Backward Class and
Denitrified Communities Backward Class
B
14
G
15
T
16
B
17
G
18
T
19
B
20
G
21
T
22
B
23
G
24
T
25
1162 757 1919 1281 1049 2330 852 436 1288 400 221 621
B. Boys G. Giorls T. Total (ST data 2016-17)
Source: District of Adi-Dravidar and Tribal Welfare and District of Backward Classes.
11.11 SCHOLARSHIPS TO STUDENTS BY COMMUNITY - 2020-21
Scheduled Caste/Scheduled Tribe
(2010)
Denotified Communities/Most
Backward Classes (2020-21) Backward Classes (2020-21)
No.of Beneficiaries
Amount
(Rs.in ‘000’)
No.of Beneficiaries
Amount
(Rs.in ‘000’)
No.of
Beneficiaries
Amount
(Rs.in ‘000’)
64608 160452215 16886 10442000 9420 21464966
Source: District of Adi-Dravidar and Tribal Welfare & District of Backward Classes 12. FISHERIES
12.1 FISHERIES DEVELOPMENT- 2020-21
1.a Total Coastal Line of the District Nil
b.I Total Inland Fresh Water spread Area 2000 (Hect)
b.II Estuaries and Brackish Water Area Nil
c Marine Fishing Villages Nil
2 Fish Production
Quantity (Ton) 72.194
Value (Rs.in lakhs) 71.02
3 Inland
a Freezing Plants Ice plants, Cold Storages And walk in coolers Sea food
manufacturing-Units in private sector Nil
b Fisheries Training centre
. Marine Nil
. Inland Nil Fishing Vessels Nil c Active Marine Fishermen Nil
4 Export : Fish and Fish Products:
Quantity (Ton) Nil Value (Rs.in lakhs) Nil
Source: District Fisheries Department

P a g e | 65
12.2 ESTIMATED MARINE FISH PRODUCTION / INLAND FISH
PRODUCTION-2020-21 Sl.No.
Block/Municipalities
Quantity(Tonne)
Value(Rs. In lakhs)
1 Thandrampat
//Sathnur
72.194 71.02
2 Tiruvannamalai - -
Total 72.194 71.02 Source: District Fisheries Office
12.3 NO. OF FAMILIES ENGAGED IN FISHING-2020-21
Sl.No.
Name of the Block
No. of Families engaged
1 Thandrampat 43
2 Tiruvannamalai -
Total 43
Source: District Fisheries Department
13 . HANDLOOM 13.1 NO.OF FOCAL CENTRES AND LOCATION DETAILS-:2020-21
Sl.No
No. of the Focal
Centres
Name/Location of the
Focal Centres
Sl.
No
No. of the Focal
Centres
Name/Location of the Focal
Centres
1 Tiruvannamalai ---
10 Jawadhu ---
2 Thurinjapuram --
11 Arni
Arni silk WCS
Arni Annai Anjugam silk WCS
Arni Dayalu Ammaiyar women silk
WCS
Arni saidapet kamarajar silk WCS
Kodikatha Kumaran Cotton cum silk
WCS
Sri Dhanalakshmi cotton cum silk WCS
Periyanayag Amman Cotton cum silk
WCS
Vivekanandha cotton cum silk WCS
3 Kilpennathur Rayampattai Anna WCS
12 Arni (w)
Athimalaipattu Arignar Anna Cotton
Cum silk WCS
Ammapalayam Samundeswari cotton
cum silk WCS
Sir Pity Thiyagarayar Cotton Cum Silk
WCS
4 Chengam ---
13 Cheyyar
Korukkathur Arignar Anna silk WCS
Kovilur Balasubramaniyar WCS
Hasanapettai Sri.Ramanatha Eswarar WCS
Hasanamapettai Annai Indira
Gandhi Women WCs
Vadamanapakkam Sakthivel
Murugan WCS
5 Pudupalayam --- 14 Anakkavoor
--
6 Thandrampat ---
15 Vembakam ----

P a g e | 66
7 Polur
Mambattu Devanger
WCS 16 Vandavasi
Kilkodungalore WCS
Ammayapattu WCS
Ammayapattu Kumaran
WCS,Thirumuruga
Kirubanantha Variyar WCS
Ponnur WCS
Ponnur Sri Murugan WCS
Ponnur Sri Murugan WCS
8 Kalasapackam
Vilvarani Samundeeswari
WCS
Adhamangalampudur
Arignar Anna WCS
17 Thellar
Kunagampoondipudur WCS
Vedal WCS
Chithrakavur pudur WCS
9 Chetpat -- 18 Peranamallur ---
Source: Asst.Director of Handloom Tiruvannamalai
13.2 NO. OF SOCIETIES & VARIETYWISE PRODUCTION-:2020-21
Source: Asst.Director of Handloom Tiruvannamalai
13.3 NO. OF POWERLOOMS & EMPLOYEES WORKING-2020-21 Source:
Asst.Director of Handloom Tiruvannamalai
13.4 NO. OF FAMILIES ENGAGED-2020-21
Sl No
Name of the
Block/Municipalities
No. of the families
engaged in SlNo
Name of the
Block/Municipalities
No. of the families
engaged in
Hand
looms
Power
looms
Hand
looms
Power
looms
1 Tiruvannamalai - -
-
13 Cheyyar 585 -
2 Thurinjapuram - - 14 Anakkavoor 65 -
3 Kilpennathur 65 - 15 Vembackam 244 -
4 Chengam - - 16 Vandavasi 428 -
5 Pudupalayam - -- 17 Thellar 385 -
6 Thandrampat - - 18 Peranamallur - -
7 Polur 68 -
8 Kalasapakam 35 - Municipalities
9 Chetpat - - 1 Tiruvannamalai - -
10 Jawadhu - - 2 Cheyyar - -
11 Arni 415 - 3 Arni 336 -
12 Arni (w) 445 - 4 Vandavasi - -
Source: Asst.Director of Handloom Tiruvannamalai
No.of
Societies
Cotton Silk
Length in
Meter(in lakhs)
Value
(Rs. In Lakhs)
Length in
Meter(in
lakhs)
Value
(Rs. In Lakhs)
29 27.53 1231.40 0.34 383.14
No. of Power looms
No. of Employees working
--- ---

P a g e | 67
14. HANDICRAFTS
14.1 NAME & ADDRESS OF HANDICRAFTS-2020-21
Sl.No.
Name of the
Block/Municipalities Name & Address of the Handicraft Name of the Product
1 Tiruvannamalai Eezha Vidiyal SHG-Tiruvannamalai Embroidery works
2 Tiruvannamalai Shanthi malai Trust Bead Jewellery
3 Tiruvannamalai Shanthi malai Trust Soft dolls
4 Tiruvannamalai Star SHG - Tiruvannamalai Palm Leaf
5 Tiruvannamalai Shanthi malai Trust Leaf Painting
6 Tiruvannamalai Shanthi malai Trust Cane Bamboo
7 Tiruvannamalai Shanthi malai Trust Crochet
8 Tiruvannamalai Shanthi malai Trust Wood Wears
9 Chetpat Sirpakalai SHG-Modaiyur Stone Carving & Sculpture
10 Vandavasi Vandavasi Mat Society Kora Grass Mat
Source : District Handicraft Office.
14.2 ARTICLES AVAILABLE IN HANDICRAFTS-:2020-21 Sl.No.
Name of the Handicrafts
Articles available in their Handicrafts
1 Embroidery works Eezha Vidiyal SHG-Tiruvannamalai
2 Bead Jewellery Shanthi malai Trust
3 Soft dolls Shanthi malai Trust
4 Palm Leaf Star SHG - Tiruvannamalai
5 Leaf Painting Shanthi malai Trust
6 Cane Bamboo Shanthi malai Trust
7
8
9
Crochet Shanthi malai Trust
8 Wood Wears Shanthi malai Trust
9 Stone Carving & Sculpture Sirpakalai SHG-Modaiyur
10 Kora Grass Mat Vandavasi Mat Society
Source: District Handicraft Office.
14.3 VALUE OF ARTICLES PRODUCED
Sl.No.
Name of the Handicraft
Value of the articles Provided
Value of the articles sold
NA Source: District Handicraft Office
14.4 NO.OF FAMILIED ENGAGED IN HANDICRAFTS
Sl.No.
Name of the
Block/Municipalities
Name of the Handicrafts
No. of the families
engaged
1 Tiruvannamalai Embroidery works 59
2 Tiruvannamalai Bead Jewellery 1
3 Tiruvannamalai Soft dolls 13
4 Tiruvannamalai Palm Leaf 3
5 Tiruvannamalai Leaf Painting 10
6 Tiruvannamalai Cane Bamboo 1
7 Tiruvannamalai Crochet 2
8 Tiruvannamalai Wood Wears 1
9 Chetpat Stone Carving & Sculpture 125
10 Vandavasi Kora Grass Mat 184
Source: District Handicraft Office.

P a g e | 68
15. HEALTH & FAMILY WELFARE
15.1 HOSPITALS, DISPENSARIES BED STRENGTH, DOCTORS & NURSES -2020-21
Classification
Modern
Medicine
Indian Medicine
H
om
oeo
pat
hy
Grand
Total
Ay
urv
edic
Sid
dh
a
Un
ani
Ayurvedic
Siddha
Unani
combined
Yo
ga
&
Nat
uro
pat
hy
To
tal
Hospitals 10 0 9 0 0 4 13 0 23
Dispensaries 2 0 0 0 0 0 0 0 2
Primary Health Centres
101 0 0 0 0 0 0 0 101
Health Sub Centres 427 0 0 0 0 0 0 0 427
Other Medicals
institutions(ESI) 0 0 0 0 0 0 0 0 0
Medical college 1 0 1 0 0 1 2 0 3
Bed Strength 781 0 45 0 0 0 45 0 826
Number of Doctors
125 3 37 0 0 40 0 165
Number of Nurses
214 0 0 0 0 0 0 0 214
Source: J.D.Health
15.2 NO.OF ALLIED PATHOLOGICAL UNITS AVAILABLE-:2020-21 Sl.No.
Name of the Block/Municipality
No.of Pathological Units
1 CheyyarDHQH 1
Source: J.D. Health
15.3 DISTRICTWISE PATIENTS TREATED-2020-21
Sl.No. Name of the Disease No.of patients treated
1 Fever
71850
2 Cough and Fever 177981
3 Hyper Tension 91741
4 Diabetes Mellitus 87887
5 Obsteric&Gyanecology 19847
6 Non Communicable Disease 97543
7 Others 3187467
Total 3734316 Source :J.D.Health
15.4 DISTRIBUTION OF MEDICAL PERSONNEL-2020-21
Sl.No. Name of the Post
No.of Person
Modern
Medicine
/Indian
Medicine
1 No.of Doctors 125 87
2 No.of Staff Nurses 214 0
3 No.of Pharmacist 27 27
4 No.of Other Para Medical Staff 30 0
5 No.of Ministerial Staff 25 3
6 No.of Basic Services 5 10 Source: J.D.Health

P a g e | 69
15.5 PROGRESS OF FAMILY WELFARE PROGRAMMES-:2020-21
Source: J.D.Health
16.HOUSING
16.1 PLAN SANCTIONED, BUILDING COMPLETED
UNDER PRIVATE SECTOR-2020-21
Sl.No.
Name of the Municipalities
Room Unit Size
Private Sector
1 Tiruvannamalai
Different in Sizes 122
2 Arni 87
Sl.No.
Name of the Town Panchayts
Room Unit Size
Private Sector
1 Nil
Source: Dept of Economics & Statistics-Chennai-6
Sl.
No Name of the Block
Sterilization IUD
Users of
conventional
contraceptives
Users of oral pills
Target Achiev
ement Target
Achievem
ent Target
Achiev
ement Target
Achieve
ment
1 Tiruvannamalai 781 611 795 1151 1245 124 858 74 2 Thurinjapuram 549 403 559 741 876 84 604 32 3 Kilpennathur 594 413 604 812 947 91 652 46 4 Chengam 764 549 778 997 1219 95 840 69 5 Thandrampet 868 621 884 1124 1385 115 954 67 6 Puthupalayam 441 342 449 629 703 57 485 32 7 Polur 764 608 777 968 1217 121 839 48 8 Kalasapakkam 554 405 564 811 883 92 609 64 9 Chetpet 502 363 511 721 801 78 552 52
10 Arni 504 381 513 625 803 75 553 34 11 Jawadhu Hills 233 174 237 331 371 21 256 15 12 West Arni 500 367 509 612 797 59 549 35 13 Cheyyar 400 192 450 334 800 28 550 13 14 Anakavoor 300 149 300 213 650 69 400 19 15 Vembakkam 600 239 450 330 800 53 570 31 16 Vandhavasi 400 278 400 321 850 104 600 86 17 Thellar 400 284 300 235 800 73 550 39
18 Peranamallur 400 336 300 245 750 47 500 39
Total 9554 6715 9380 11200 15897 1386 10921 795
Municipality
1 Tiruvannamalai 705 501 718 868 1125 107 778 57
2 Arni 300 231 306 395 479 37 330 26
3 Cheyyar 161 118 164 207 257 19 177 17
4 Vandavasi 179 141 182 251 285 21 196 18
Total 1345 991 1370 1721 2146 184 1481 118
District Total 10899 7706 10750 12921 18043 1570 12402 913

P a g e | 70
16.2 PLANS SANCTIONED, BUILDING COMPLETED
UNDER PUBLIC SECTOR-2020-21
Sl.No. Name of the Panchayat Union Room Unit size Public Sector
1 Tiruvannamalai
Different in Sizes
239
2 Thurinjapuram 207
3 Kilpennathur 119
4 Chengam 187
5 Thandrampat 146
6 Pudupalayam 147
7 Polur 121
8 Kalasapakam 164
9 Chetpat 178
10 Arni 147
11 Jawadhu Hills 22
12 Arni (west) 146
13 Cheyyar 120
14 Anakkavoor 255
15 Vembakam 220
16 Vandavasi 328
17 Thellar 354
18 Peranamallur 299
Sl.No. Name of the Office Public Sector
1 PWD 20
2 Tiruvannamalai Municipality 2
3 Vandhavasi Municipality -
Source: Dept of Economics & Statistics-Chennai-6
16.3 AMOUNT INVESTED IN HOUSING AND BUILDING
ACTIVITY UNDER PUBLIC SECTOR-2020-21
Residential
Rs.in ‘000’
Percentage to
total
Non-Residential
Rs.in ‘000’
Percentage to total
Total
Rs.in ‘000’
Figures compiled State as a whole
Source: Dept of Economics & Statistics-Chennai-6
16.4 CONSTRUCTION ACTIVITY OF TAMIL NADU HOUSING BOARD-2020-21 Sl.no
Name of the Scheme
Number
1.
2.
3.
4.
5.
6.
7.
8.
9.
Low Income Group Housing Schemes Flats
Middle Income Group Housing Schemes
Slum Improvements/Clearance Tenaments
Tamil Nadu Government Rental Housing Flats
Subsidised Industrial Housing Tenaments
Fire Proof Tenaments
Special Low Cost Housing Scheme {EWS}
Police
Specify any other (Community Hall)
--
Nil
--
--
--
--
---
--
--
--
--
--
Note : I,Low income group II, Income >40000 Source: Concerned District Office.

P a g e | 71
16.5 CONSTRUCTION ACTIVITY OF TAMIL NADU
SLUM CLEARANCE BOARD-2020-21
Sl.no
Item
Achievement
1.
2.
3.
4.
5.
6.
Number of Tenements sanctioned for construction
Number of Tenements constructed
Amount sanctioned (Rs.in lakhs)
Amount spent (Rs.in lakhs)
Number of tenements occupied
Rent received (Rs.in lakhs)
Nil
Source: Concerned District Head Office
16.6 INDEXNUMBERS OF BUILDINGS COST IN URBAN CENTRES-(1980-81=100)
Sl.No..
District Urban
Cerntres
Building Index
Building materials
Construction cost for
building Lab our
Other
Charges
Combined Index
NIL
Source: Dept of Economics & Statistics-Chennai-6.
16.7 LABOUR CHARGES OF CONSTRUCTION WORKERS
Charges of Female Construction Workers
Charges of Male Construction Workers
-- -- Source: Dept of Economics & Statistics-Chennai-6.
17. INDUSTRIES
17.1 RESULTS OF ANNUAL SURVEY OF INDUSTRIES-(FACTORY SECTOR)
Characteristics
Units
Results for all Industries
Figures compiled State as a whole
Source: Dept of Economics & Statistics-Chennai-6
17.2. ESTIMATES OF OUTPUT AND VALUE ADDED BYMANUFACTURE BASED ON
ANNUAL SURVEY OF INDUSTRIES-( In lakhs) Industry Group
Description of the
Industry
All Employees
Value of output Rs. In lakhs
Value added
Figures compiled State as a whole Source: Dept of Economics & Statistics-Chennai-6.
17.3. INDUSTRIAL PRODUCTION
Sl.No. and Name of the Product
Unit of quantity
Production
Figures compiled State as a whole
Source: Dept of Economics & Statistics-Chennai-6
17.4. PRODUCTION AND VALUE OF MAJOR MINERALS
Name of the District
Name of the Mineral
Quality (Tonne)
Value (Rs.in ‘000’)
Tiruvannamalai -NIL-
.Source: Controller, Indian Bureau of Mines, Nagpur.
17.5. PRODUCTION OF HANDLOOM CLOTH-‘In 000’ Metres
Sl.No.
Variety of Cloth
Production
1 SILK ---
2 COTTON 6.96000
Source: Dept of Economics & Statistics-Chennai-6

P a g e | 72
17.6 SMALL SCALE INDUSTRIES-2020-21
Sl.No
Classification
(NIC 2008)
Details of Classification
No.of Units
1 01 – 03 Agriculture, Forestry and Fishing 37
2 05-09 Mining and Quarrying 0
3 10-11 Food Production 264
4 13-14 Wearing Apparel (Redymade and Tayloring) 126
5 15 Mfg of Leather and related Products 5
6 16 Wood Products 11
7 17-18 Paper products, Publishing Printing 12
8 19-22 Chemicals, Plastics and Rubber Products 39
9 23 Other Non-Metallic Products 25
10 24 Mfg of Basic Metals 9
11 25 Fabricated Metal Products 13
12 26 Mfg of Computer and Electronic and Optical Production 7
13 27 Mfg of Electrical equipments 6
14 28 Mfg of Machinery and equipments N.E.C 7
15 29,30 Mfg of motor vehicals, trailers and semi trailers 1
16 31 Mfg of Furniture 6
17 32 Other manufacturing 29
18 33 Repair and installisation of machinery and equipments 14
19 35 Elactricity, gas stream and air conditioning supply 1
20 36-39 Water supply , sewerage, waste management and remediation
activities
0
21 41-43 Construction 47
22 45-47 Whole sale and retail trade, repair of Motor Vehicles and Motor
cycles
0
23 49-53 Transportation and storage 148
24 55-56 Accommodation and food service activities 128
25 58-63 Information and communication 23
26 64-66 Financial and insurance activities 33
27 68 Real estate activities 2
28 69-75 Professional scientific and technical activities 34
29 77-82 Administrative and support activities 18
30 84, 85 Public Administration and Education 44
31 86-88 Human heaqlth activities and social work activities 24
32 90-93 Arts and entertainment and recreation 4
33 94-96 Other service activities 424
34 97-98 Activities of household as employers, undifferentiated goods
services- producing activities of private households for own use
1
35 99 Activities of extraterritorial organizations and bodies 0
Total 1542
Note: Total No of UAM filed from April 2020 to June 2020 -1542.
Total No of URC filed from July 2020 to March 2021 - 4915.
(Mfg Sector : 2040 and Service Sector : 2875 = 4915. Source: District Industries Center Office.
17.7 KHADI AND VILLAGE INDUSTRIES-:2020-21
Sl.No. and
Industry
Production
(Rs. In lakhs)
Sales
(Rupees in
lakhs)
Employments
(Lakhs of persons
Earnings
(Rs. In lakhs)
Khadi - 97.06 - -
Vilage industries - 79.80 - - Source: District Khadi and Village Industries, T.V. Malai.

P a g e | 73
17.8.NO.OF PRINTING PRESSES-:2020-21 Sl.No.
District
Number
1 Tiruvannamalai 08
Source: District Industries Center Office.
17.9- NO.OF PHOTOCOPY (XEROX) CENTRES – 2020-21
Sl.No.
Name of the Block /
Municipality
No.of Xerox
Centres
Sl.No.
Name of the Block /
Municipality
No.of Xerox
Centres
1 Tiruvannamalai 0 13 Cheyyar 0
2 Thurinjapuram 0 14 Anakkavoor 0
3 Kilpennathur 0 15 Vembackam 0
4 Chengam 0 16 Vandavasi 0
5 Pudupalayam 0 17 Thellar 0
6 Thandrampat 0 18 Peranamallur 0
7 Polur 0 Municipalities
8 Kalasapackam 0 1 Tiruvannamalai 0
9 Chetpat 0 2 Cheyyar 0
10 Jawadhu 0 3 Arni 0
11 Arni 0 4 Vandavasi 0
12 Arni (w) 0
18. FACTORIES
18.1. REGISTERED AND WORKING FACTORIES 2020-21
Sl.No.
Item16
07
Numbers
1.
2.
3.
4.
5.
Factories on the Register at the beginning of the year
Factories added during the year
Factories removed during the year
Factories on the register at the end of the year
Number of working factories
315
10
-
325
185
Source: District Inspector of Factories.
18.2 EMPLOYMENT IN WORKING FACTORIES 2020-21
S.No.
Item
Numbers
Men Women
1 Firms and Shops 3731 1191
2 Hotels 1000 170
3 Beedi and Suruttu 71 40
4 Motor transport firms 893 --
Source: District Inspector of Factories.
18.3 UNIONS: INDUSTRIAL DISPUTES BY STRIKES AND LOCKOUTS GHERAOS-2020-21
Sl.No.
Items
Numbers
1.
2.
3.
Number of Registered Trade Unions
Strike:
Number of Strikes
Number of Workers Involved
Number of Man days Lost
Lockouts:
Number of Lockouts
Number of workers involved
1
-
-
-
--
--

P a g e | 74
4.
Number of Man days Lost
Gheraos:
Number of Gheraos
Number of Workers involved
Number of Mandays Lost
--
--
--
-- Source: District Labour Office. Vellore
19. LOCAL BODIES
19.1 MUNICIPAL BODIES AREA AND POPULATION BY GRADES-2020-21
Sl.No
Classification of Municipal Bodies
Number
Area (Sq.Km.)
Population
(In ‘000’)
1.
2.
3.
4.
5.
6
7
Corporations
Special Grade
Selection Grade
First Grade
Second Grade
Third Grade
Township Committee
-
1
-
1
1
1
-
-
13.64
-
11.62
10.75
9.71
-
-
145278
-
63671
37802
15754
Source: Census 2011
19.2 MUNICIPAL BODIES BY TALUKS-2020-21
Sl.
No.
Name of the Taluk Grade of Municipal Councils Township
Committees
Total
Special
Selection
First
Second
Third
1 Tiruvannamalai 1 - - - - - 1
2 Arni - - 1 - - - 1
3 Tiruvathipuram - - - 1 - - 1
4 Vandavasi - - - - 1 - 1
Source: Dept of Economics & Statistics-Chennai-6
19.3. PANCHAYAT UNIONS, VILLAGE PANCHAYATS/ TOWN PANCHAYATS-2020-21
Sl.
No.
Village Panchayat/ Development
Division
Panchayat
Union
Village
Panchayats Town Panchayats
1 860 - 18 860 10
Source: District Rural Development Office.
19.4. REVENUE DIVISIONS, TALUKS, FIRKAS AND REVENUE VILLAGES-2020-21
Sl.
No.
Revenue Divisions
No
Revenue Taluks
No
Revenue Firkas
Revenue
Villages
1 Tiruvannamalai 1
Tiruvannamalai 1 7 136
Kilpennathur 1 3 77
Chengam 1 5 107
Thandrampat 1 3 63
2 Arni 1
Arni 1 5 48
Polur 1 5 94
Kalasapakkamm 1 3 49
Jawadhu Hills 1 2 34
3 Cheyyar 1
Cheyyar 1 5 131
Vandavasai 1 8 161
Vembakkam 1 4 91
Chetpet 1 4 76
Total 3 12 54 1067
Source: District Revenue Administrative Office.

P a g e | 75
19.5 TAX COLLECTED BY CORPORATION / MUNICIPALITY / PANCHAYAT
UNION / TOWN PANCHAYAT / VILLAGE PANCHAYAT-2020-21
19.5. TAX COLLECTED BY CORPORATION / MUNICIPALITY / PANCHAYAT
UNION / TOWN PANCHAYAT / VILLAGE PANCHAYAT-2020-21
Item Corporation Municipality
Panchayat Union
Town
Panchayat
Village Panchayat
Tax collected
in Rs. in '000' - 344791.00 119335.00
35073.00
77680.00
Source: Concerned Local Bodies
Sl.
No Name of the Block Tax collected in Rs “000”
1 Tiruvannamalai 19884.00
2 Kilpennathur 3192.00
3 Thurinjapuram 322.00
4 Chengam 3638.00
5 Thandrampat 4963.00
6 Pudupalayam 3348.00
7 Polur 5498.00
8 Kalasapakam 6991.00
9 Chetpat 2630.00
10 Arni 2121.00
11 Jawadhu 3460.00
12 Arni (west) 4076.00
13 Cheyyar 4864.00
14 Anakkavoor 1805.00
15 Vembakam 34196.00
16 Vandavasi 4837.00
17 Thellar 3745.00
18 Peranamallur 9765.00
Total 119335.00
Municipality Tax collected in Rs “000”
1 Tiruvannamalai 283959.00
2 Arni 9811.00
3 Cheyyar 25969.00
4 Vandavasi 25052.00
Total 344791.00

P a g e | 76
19.6. RURAL DEVELOPMENT PROGRAMME-2020-21
Sl.
No. Scheme Name
Physical Progress-2020-21 Financial Progress-2020-21
Taken UP
completed Pending % of
Completion AS Amount Expenditure Balance
% of Expenditure
Scheme Group: Area Development
1 SSS 4 0 4 0 63.03 0 63.03 0
Scheme Group: Housing
2 PMAY(G) 0 0 0 0 0 0 0 0
GREEN HOUSING SCHEME 3161 186 2975 5.88 8988.9 1457.7 7531.2 16.22
Scheme Group: Scheme Component of Pooled Assigned Revenue
3 SCPAR PU Office 1 0 1 0 310.1 0 310.1 0
Scheme Group: MLACDS
4 MLACDS-CHENGAM 58 26 32 44.83 200 60.84 139.15 30.42
5 MLACDS-
TIRUVANNAMALAI 64 12 52 18.75 200 38.86 161.14 19.43
6 MLACDS-
KALASAPAKKAM 34 0 34 0 160.75 0 160.75 0
7 MLACDS-POLUR 54 17 37 31.48 200 71.49 128.51 35.75
8 MLACDS-ARNI 24 5 19 20.83 194.98 27.62 167.36 14.17
9 MLACDS-CHEYYAR 40 17 23 42.5 173.68 57.18 116.51 32.92
10 MLACDS-VANDAVASI 82 36 46 43.9 200 94.26 105.74 47.13
11 MLACDS-
KILPENNATHUR 50 9 41 18 172.45 28.98 143.46 16.81
Scheme Group: MGNREGS
12 Panchayat Office 42 0 42 0 951.3 41.22 910.08 4.33
13 Anganwadi 45 0 45 0 458.55 2.14 456.41 0.47
14 Cattle Shelter – (AAVIN) 2275 889 1386 39.08 3752.7 400.65 3352.05 10.68
15 Goat Shelter 1425 591 834 41.47 2690.85 242.71 2448.14 9.02
Food Grain Godown 4 0 4 0.000 56.32 0.58 55.74 1.03
Construction of Check Dams 500 151 349 30.200 2504 550.8 1953.2 22.00
Scheme Group: Roads
16 TNRRIS –Stream1-
Upgradation 17 9 8 52.94 739.86 323.9 415.96 43.78
17 TNRRIS-Stream2-
Strengthening 101 63 38 62.38 3678.08 2243.79 1434.29 61
18 TNRRIS-Stream3-Renewal
B T 1 0 1 0 12.6 0 12.6 0
19 PMGSY III(2020-2021) 56 0 56 0 9838.24 0 9838.24 0
Scheme Group: Infrastructure
20 VPA No.2 Surplus Fund - - - - - - - -
21 Basic Aminities to Adi
Dravidar Habitations 93 40 53 43.01 504 176.87 327.13 35.09
22 RCSIDS 16 0 16 0 251.99 0 251.99 0
Scheme Group: Pond and Ooranies
23 Kudimaramathu 5 0 5 0 15.01 0 15.01 0
24 MI tank – Pond and Ooranies
MGNREGS 2 0 2 0 13.04 0 13.04 0
Total 9798 555 9243 5.66 46250.89 5056.25 41194.64 10.93
Source : PD, DRDA,Tiruvannamalai

P a g e | 77
20. LABOUR AND EMPLOYMENT 20.1 NO.OF PERSONS REGISTERED DURING THE YEAR AND TOTAL NO.OF PERSONS
WAITING UPTO THE END OF THE YEAR AS PER LIVE REGISTER –2020-21
Sl.No.
Type of Employment Exchange
No.of Persons registered during
the year
Total No.of persons waiting
upto the end of the year
1 District Employment office,
Tiruvanamalai 30268
211488
Source: District Employment Exchange
20.2 NO.OF PLACEMENTS DURING AND UPTO THE END OF THE YEAR-2020-21
Sl.No.
Type of Employment Exchanges
Placements during the year
Placements up to the
year
1 District employment office,
Tiruvanamalai 111 4272
Source: District Employment Exchange.
21. LEGAL SERVICES
21.1 JUDICIAL DIVISION AND ORIGINAL JURISDICTION- 2020-21
Sl.no Item Number
1 Principal District Judge 1
2 Fast Track Mahila Court 1
3 Addl..District-- Judge - 2
4 Special Court (District Judge Level) 3
5 Chief judicial magistrate –Tiruvannamalai 1
6 Judicial magistrate 9
7 District Munsif 8
8 Sub-Ordinate Judge 6
9 Munsif cum JM 2 Source: District Court.
21.2 RESULTS OF CIVIL AND REVENUE CASES IN THE COURTS OF ORIGINAL
JURISDICTION CIVIL SUITS REGULAR- 2020-21
Sl.no
Item
Number of cases
1
.District Munsif court -Tiruvannamalai
77
2. Taluk Munsif court—Polur 186
3. Taluk Munsif court—Arni 28
4
.Taluk
Munsif
court—
Chegam
Taluk Munsif court—Chengam 82
5. Taluk Munsif court—Cheyyar 73
6 District Munsif Court-Vandavasi 72
Source: District Court.
21.3 NATURE OF FREE LEGAL AVAILABLE AND NO.OF BENEFICIARIES, NO.OF
CASES DISPOSED OF IN LOK ADALAT DURING THE YEAR- 2020-21
Nature of free legal available
No.of Beneficiaries
No.of cases disposed of in Lok Adalat
Civil, criminal, and maintenance, bail appeal
and other cases 452
309
Source: District Court.

P a g e | 78
21.4 NO.OF ADVOCATES PRACTICING IN COURTS-2020-21 Sl.No
.
Name of the Court No. of Advocates
Practicing
1
District Court ,
Chief Judicial Magistrate Court,
Principal Sub court & Additional Sub Court
Principal District Munsif Court & Tiruvannamalai
Additional District munsif Court,
Judicial Magistrate Court-1
Judicial Magistrate court-2
Fast track Court ( Magistrial Level)
300
2 Principal District Munsif cum Judicial magistrate court, Chengam
Additional Distict Munsif Court, Chengam
50
3 Judicial magistrate Court, Polur
District munsif court, Polur
30
7 Judicial magistrate Court, Arni
District munsif court, Arni
40
8 Principal District Munsif cum Judicial magistrate court, Vandavasi
Additional Distict Munsif Court, Vandavasi
25
9
Principal District munsif court, Cheyyar
Judicial magistrate Court, Cheyyar
Additional District Munsif Court, Cheyyar
40
Source: District Court.
22. LIBRARIES
22.1. List of Head and Branch Libraries in the district all the details of Members,
Books available and Readers -2020-21
Name of the Head/Branch Numbers
(Nos.) Members
No. of Books
available Number of Readers
Tir
uv
ann
amal
ai
Dis
tric
t
Central Library 1 49691 92821 10085
Branch libraries 49 163786 742267 137229
Village libraries 73 67950 606550 152155
Part time libraries 18 3357 400 6449
Source: District Head Library Office.
22.2. Number of Libraries housed in Government Building/Rental Building-2020-21 Libraries in Government Building (in Nos.)
Libraries in Rental Building in (Nos.)
58 3
Source: District Head Library Office.

P a g e | 79
22.3. Number of Reading Rooms -2020-21
sl.no Name of block Name of place of libraries Numb
er of
room
Branch Libraries Rural Libraries Part Time Libraries
1 Tiruvannamalai
Tiruvannamalai (7)
SP Office 1
Kattampoondi (2) 1
Pallikondapattu (3) 1
Vengikkal (2) 1
2
Thurinjapuram
Thurinjapuram (2)
Ananthal (1)
1
Bhoothamangalam(1) 1
Narthampoondi(1) 1
Naidumangalam(1) 1
Mangalam(1) 1
Vedanthavadi(1) 1
3 Kilpennathur
Kilpennathur (2) Ranjanthangal (2) Makkalur 1
Kikkalur (1) Vaipur (2) 1
Vettavalam (3) 1
Nariyamangalam (2) 1
4 Arni
Arni (4) Ariyapadi (1) Saithapet (1) 1
SVNagaram (2) Sevur (2) Melseesamangalam 1
Munukkappattu 1
5 West Arni
Onnupuram (2) Kamakkur (1) Sathuperipalayam 1
Kannamangalam (4) Kolathur (1) Thatchur 1
Kattukanur (2) Kunnathur (2) MR Nagar 1
Devigapuram (2) Mel Nagar (1)
1
Thellur(1) 1
Ammapalayam(1) 1
sathuparepalayam 1
Periya
Ayyampalayam(1)
1
6
Thandrampet
Thandrampattu(2) Thenmudiyanur(2) Thadarappattu(2)
1
Sathanur(1)
1
Thanipadi(1) 1
Perunkulathur(2) 1
7 Polur
Polur (4) 50.Kuppam(1) Kasthampadi
(Samath)
1
Kasthambadi (2) Periyakaram(1) Thuluvapushpagiri 1
Santhavasal(2) Athimur (2) Vellur 1
Kalambur (2) Kelur (1) Kalasamuthiramm 1
Padavedu (2) Mampattu(2) 1
Arjunapuram (2) 1
Potharai (1) 1
Thirisur(1) 1
Chinna Pushpagiri(2) 1
8 Jawathumalai
Jamunamarathur (1) 1
Kilaiyur(1) 1
9 Kalasapakkam
Kalasapakkam(2) Kettavarampalyam(1) 1
Kadaladi(2) Palankoil(1) 1
Vilvarani(2) Siruvallur(1) 1

P a g e | 80
10 Chetpat
Tirumalai(1) 1
Chetpat(2) Gudalur(1) Ariyathur(1) 1
Vadamathimangalam(2) Semmiyamangalam(1) Rantham 1
Mandakolathur(1) Ettivadi(1) Alliyallamangalam(1 1
Periyakolapalur(2) Mansurapath(1) Modaiyur(1) 1
Sathuperi(1) 1
Sevarapondi(1) 1
Kilpattu(1) 1
Gangapuram(2) 1
Rantham(1) 1
11 Chengam
Chengam(3) Elankunni(2) Pariyur 1
Paramanandal(2) Puliyampatti(1) 1
Melpallipattu(2) Kuppanatham(1) 1
Gandhi nagar(1) 1
12 Pudupalayam
Pudupalayam(2) Kanji(1) Ammapalayam
(Sam)(1)
1
Karapattu(1) 1
13 Vandavasi
Vandavsi(3) Irumbedu(2) 1
Maruthadu(1) 1
Kilnarma(1) 1
Kilkodungalur(1) 1
14 Peranamallur Peranamallur(2) Anaiboki(1) 1
15 Thellar
Thellar(2) Korakkottai(2) Korakotai Colany(1) 1
Desur(1) Kunnakampoondi(1) 1
Chitharukavoorputhur Ponnur(1) 1
Malayur(1) Madam(1) 1
Vayalambur(2) 1
Kilvillivalam(1) 1
Nerkunam(1) 1
16 Cheyyar
Cheyyar(2) Korukkathur(2) Puliyampakkam(1) 1
Kuzamanthal(2) kunnavakkam(1) Thiruvothur(1) 1
17 Vembakkam
Vembakkam(2) Azhividaithanki(1) Kilnelli 1
Asanamapet(2) Sithathur(2) Monalur 1
Sumankali(1) Kuthanur(1) 1
Venkalathur(2) Vellakulam(1) 1
Abdullahpuram(2) Natteri(1) 1
Brammadesam(2) 1
Dusi(2) 1
Perunkattur(2) 1
Vadamanapakkam(1) 1
18 Anakkavur
Ankkavur(1) Mulagiripattu(1) 1
Paiyur(1) 1
Akkur(1) 1
Gunnavakkam(1) 1
Monalur(1) 1
Source: District Head Libraries Office.

P a g e | 81
23. MINING AND QUARRYING
23.1 Number of Mining and Quarrying units in the district-2020-21
Sl.No. Name of the Taluk
Number of Mining and Quarrying
Major
Minaral
Fire Clay
Black
granite
colored
granite
Rough
stone Gravel Total
1 Tiruvannamalai -- 2 -- 6 -- 8
2 Chengam -- 1 -- 6 -- 7
3 Thandrampattu -- 15 1 10 -- 26
4 Polur -- -- 1 6 -- 7
5 Kalasapakkam -- -- -- -- -- --
6 Kilpennathur -- 1 -- 2 -- 3
7 Chetpet -- -- -- 3
-- 3
8 Vembakkam -- -- -- 23 -- 23
9 Cheyyar 1 -- -- 16 -- 17
10 Arni -- -- 1 2 -- 3
11 Vandavasi -- 2 -- 7 -- 9
Total 1 22 3 81 -- 107
Source: Assistant Director of Geology and Mining
23.2 . Classification-wise production during the year-2020-21 Sl.No
. Name of the Minerals Production (in Cu .M)
1 Fire clay 0
2 Black granite 1687.263
3 Multi colored granite 126.310
4 Blue metal 1614012
5 Sand --
6 Red earth --
7 Gravel 231811
8 Brick clay --
Source: Assistant Director of Geology and Mining.
24. MANUFACTURING SECTOR2020-21
24.1. No. of Food and allied manufacturing units in the district.- 2020-21
Industry
Group
Name of
the District
Description of the Industry No.of units All Employees Value of output
Rs. In lakhs
Value added
Rs. In lakhs
10-11
Tir
uv
ann
amal
ai 1.Dairy Products 38 98 114.00 136.80
2.Mfg.of Grain Mill
Products 113 814 904.00 1084.80
3.Bakery Products 6 28 30.00 36.00
4.Other Food Products 107 701 321.00 385.20
Source: DIC

P a g e | 82
24.2 . Number of Non-Food Manufacturing units in the District.- 2020-21
Name of
District
Industry
Group Description of the Industry No. of units
All
Employees
Value of
output Rs. In lakhs
Value added
Tir
uv
ann
amal
ai
13-14 Textile & Wearing Apparel 126 1154 518.00 621.60
15 Mfg of leather and related products 5 22 10.00 12.00
16 Wood Products 11 38 33.00 39.60
17 -18 Paper & Paper products, Publishing Printing 12 80 48.00 57.00
19-22 Mfg of Cake, Refined Petrolium Products,
Plastic and Rubber. 34 205 170.00 204.00
23 Other Non-Metallic Products 25 175 125.00 150.00
24 Basic Metals 9 32 45.00 54.00
25
Fabricated Metal Products 13 51 65.00 78.00
26-27 Computer, Electronic and Electrical Equipments 13 45 52.00 62.40
28 Mfg of Machinery and equipments N.E.C 7 71 35.00 42.00
29-30 Mfg of motor vehicles, Trailers and semi-
Trailers 1 10 6.00 7.20
31 Furniture 6 30 30.00 36.00
32 Other manufacturing 29 496 116.00 139.20
Source: Source: DIc
25. MEDICAL SERVICES
25.1. Number of Medical Colleges in the District with Students and Teachers -2020-21 Sl
.
N
o
Name of the
Institution Name of the Course
Students
Teachers
Staff Nurses
Boys Girls Total
1
Go
vt.
Tir
uvan
nam
alai
Med
ical
Co
lleg
e,
Tir
uv
ann
amal
ai.
.
MBBS 210 290 500
163 92
DMLT 47 77 124
DRDT 31 14 45
DPOT 15 12 27
EEG,TECH. 2 1 3
ANAES.TECH. 5 7 12
Audio.METRY.TECH 0 4 4
MPHW 4 4 8
ORTHO.TECH 6 0 6
Theathre.TECH 3 5 8
Hearing & Language
Speech .TECH 0 0 0
Dialysis Tech. 5 3 8
Source: Concerned Institution.
25.2. Number of College of Pharmacy with Students and Teachers-2020-21
Sl.No Name of the Institution Students
Teachers Boys Girls Total
1
Kamalatchi Pandurangan College of
Pharmacy-Tiruvannamalai 221 111 332
20
Source: Concern Institution.
25.3. Number of Medical Stores in the District (Category-wise)- 2020-21
S. No
Item
Number of Medical Stores
1. Indian Medicine By Drugs Control
2. English Medicine
By Drugs Control
Source: Concerned Departments

P a g e | 83
25.4 No .of Veterinary Colleges with Students and Teachers-2020-21
S. No Name of the Institution
Students
Teachers Boys Girls Total
-NIL-
Source: Concerned Department.
26. MOTOR VEHICLES
26.1 No.of Motor Vehicles (Category-wise) Registered during the year
and up to the end of the year-2020-21
Commercial
Stage Carriage Auto Rickshaw Ordinary Taxi
Public Private
End of
the year
Upto the
year
End of the
year
Upto the
year
End of the
year
Upto the
year
End of the
year
Upto the year
(1) (2) (3) (4) (5) (6) (7) (8)
- - - 182 129 1058 - -
Commercial
Motor Cab Maxicab Omni Buses Private Station Vehicle and others
End of
the year
Upto the
year
End of the
year
Upto the
year
End of the
year
Upto the
year End of the
year Upto the year
(9) (10) (11) (12) (13) (14) (15) (16)
- 658 36 554 - - 17 91
Commercial
School Bus Ambulance Fire Fighter Light Commercial Vehicle
End of
the year
Upto the
year
End of the
year
Upto the
year
End of the
year
Upto the
year
End of the
year
Upto the year
(17) (18) (19) (20) (21) (22) (23) (24)
- 130 - 6 - - - 125
Commercial
Lorry Articulated Vehicle
State Permit National Permit State Permit National Permit
End of
the year
Upto the
year
End of the
year
Upto the
year
End of the
year
Upto the
year
End of the
year
Upto the year
(25) (26) (27) (28) (29) (30) (31) (32)
201 1126 40 295 - - 23 34
Commercial Non-Commercial Vehicles
Tractor / Trailor Total Motor Cycle Scooter
End of
the year
Upto the
year
End of the
year
Upto the
year
End of the
year
Upto the
year
End of the
year
Upto the year
(33) (34) (35) (36) (37) (38) (39) (40)
- - 535 2576 19 27615 8566 10091
Non-Commercial Vehicles
Moped Tri-Cycle Auto Motor Car Jeep
End of
the year
Upto the
year
End of the
year
Upto the
year
End of the
year
Upto the
year
End of the
year
Upto the year
(41) (42) (43) (44) (45) (46) (47) (48)
258 2901 - - 436 2230 - -
Non-Commercial Vehicles

P a g e | 84
Station Wagon Tractor Three Wheeler Four Wheeler
End of
the year
Upto the
year
End of the
year
Upto the
year
End of the
year
Upto the
year
End of the
year
Upto the year
(49) (50) (51) (52) (53) (54) (55) (56)
- - 397 2130 1 5 - -
Non-Commercial Vehicles Road Rollers Others Total Grand Total
End of
the year
Upto the
year
End of the
year
Upto the
year
End of the
year
Upto the
year
End of the
year
Upto the year
(57) (58) (59) (60) (61) (62) (63) (64)
- - 66 404 9443 19971 9743 19971
Source: District Transport Department.
26.2 NO.OF MOTOR VEHICLES (CATEGORY WISE) AVAILABLE
FOR HIRE PURPOSE DURING & UPTO THE END OF THE YEAR-2020-21
Sl.No.
Category
During the year
End of the year
1 Goods vehicle 463 5048
2 Auto rickshaw 129 1079
3 Tourist Taxi(Motor Cab) 88 688
4 Stage carriage 136 498
5 Maxi cab 36 554
6 Omni bus
-- 21
Source: District Transport Department
26.3 NO.OF PERSONS ISSUED WITH DRIVING LICENCE-2020-21
Sl.No.
Category
No. of Driving License issued
1
Professional 4360
2 Non- professional 19919
27. NON-CONVENTIONAL ENERGY GENERATION
27.1 NO.OF SOLAR ENERGY GENERATING UNITS IN THE DISTRICT WITH PRODUCTION DATA –2020-21
Sl.No.
Name and Place of Solar energy system exist
Install Capacity
(in Mega Watts)
Generation
(in Mega Watts)
1 M/s. Shapooriji Pallonji Solar PV Private
Limited
30
51.204
2 M/s. Sivalinga Nadar & Sons, Vandavasi.
1
1.007
Source: Concerned Electricity Generation Units.
27.2 NO.OF WIND MILLS GENERATING UNITS WITH PRODUCTION DATA-2020-21 Sl.No.
Name and Place of Wind Mills
Generation exist
Instal Capacity
(in Mega Units)
Generation
(in Mega Units)
1 Nil
Source: Concerned Electricity Generation Units.
28. POLICE AND PRISONS
28.1 POLICE FORCE-2020-21 Sl.No.
Name of the District
Police Stations
Out Posts
Actual Strength
Total
Local
Strength
Armed Reserve
Strength
1 Tiruvannamalai
46 -- 1310 498 1808
Source: District Police Head Office.

P a g e | 85
28.2 COGNIZABLE OFFENCES UNDER INDIAN PENAL CODE
(Including Attempts)- 2020-21
Sl.No.
Item
Number of Cases Reported
1. Murder 32
2. Culpable Homicide Note amounting to Murder 9
3. Rape 21
4. Kidnapping and Abduction 35
5. Dacoity 4
6 Robbery 49
7. Burglary 55
8. Thefts 114
9. Riots 92
10. Criminal Breach of Trust 1
11. Cheating 29
12. Counterfeiting --
13. Miscellaneous 77217
Total Cognizable Crime Under I.P.C. 77658
Source: District Police Head Office.
28.3 PRISONS AND CONVICTS -2020-21
Sl.No.
Classification of Prisons
Number
1. Central Prisons --
2. State Prison for Women 1
3. Sub-Jails 17
4. Special Sub-Jails -
5. Open Air Prison -
6. Fifth Garden (Salem) -
7. Borstal School -
28.4 CLASSIFICATION OF CONVICTS-2020-21 Sl.No.
Length of Sentences
Male
Female
Total
1. Below One Year 4 1 5
2. Above One Year and not exceeding Two Years 4 - 4
3. Above Two Years and not exceedingf Five Years - - -
4. Exceeding Five Years and not exceeding Ten Years 4 - 4
5. Exceeding Ten Years - - -
6. Life Sentence 5 1 6
7. Sentence to death - - -
Total 17 2 19
Source: District Prisons Head Office.
28.4 NO.OF CASES REGISTERED UNDER P.C.R - 2020-21
Sl.No.
Name of the Stations
No. of Cases Registered under P.C.R.
1 Tiruvannamalai district --
Source: District Police Head Office.
28.5 NO.OF CASES REGISTERED AGAINST WOMEN HARRASSMENT AND DOWRY-2020-21
Sl.No.
Name of the Station
No. of Cases Registered against Women Harassment and Dowry
Dowry Death Harassment
1 Tiruvannamalai district 1 6
Source: District Police Head Office

P a g e | 86
29. PUBLIC HEALTH 29.1 PUBLIC HEALTH AND MEDICAL SERVICES RENDERED BY ORGANISATIONS AND INDIVIDUAL-:2020-21
Sl.No
Items
Numbers
Govt Pvt Total
1. Hospitals 110 178 288
2. Dispensaries 1 526 527
3. Sanitary -- -- --
4. Nursing Home -- -- --
5. Maternity & Child Welfare Clinic -- -- --
6. Allopathy 110 70 180
7. Ayurvedic 3 7 10
8. Unani 1 -- 1
9. Homeopathy 4 59 63
10 Siddha 42 42 84
11 Yoga & Naturopathy 6 0 6
Source: D.D. Health
29.2 NO.OF PRIMARY HEALTH CENTRES WITH SUB-CENTRES-2020-21
Sl.No.
Name of the Block / Municipality
No.of Primary Health
Centres
No.of Primary Health Sub Centres
No.of Sub-Centres
1 Tiruvannamalai 7 28
2 Thurinjapuram 5 21
3 Kilpennathur 8 24
4 Chengam 6 36
5 Pudhupalayam 3 18
6 Thandrampet 6 34
7 Polur 6 33
8 Kalasapakkam 5 26
9 Chetpet 3 20
10 Jawwadhu 3 13
11 Arni 6 18
12 Arni (w) 6 22
13 Cheyyar 5 19
14 Anakkavoor 3 15
15 Vembakkam 6 23
16 Vandavasi 6 21
17 Thellar 6 21
18 Pernamallur 3 18
Rural Total 93 410
1 Tiruvannamalai Municipality 3 0
2 Thiruvathipuram Municipality 1 0
3 Arni Municipality 1 0
4 Vandavasi Municipality 1 0
Total 6 0
Grand Total 99 410 Source: D.D. Health

P a g e | 87
30.PRINTING AND PUBLICATION
30.1 NO.OF NEWS PAPERS, WEEKLY MAGAZINES, MONTHLY MAGAZINES
ETC., PUBLISHED-2020-21
Sl.No.
Name of the News
Paper
Language of Publication
Type of Periodicals
1 Nam Thinamathi Tamil Daily
Source: Respective District Collectors.
30.2 NO.OF PUBLISHERS IN THE DISTRICT OTHER THAN
NEWS PAPERS AND MAGAZINES-2020-21
Sl.No.
Name of the District
No.of Publishers
1 Tiruvannamalai
1
30.3 NO.OF PRINTING PRESSES IN THE DISTRICT-2020-21
Sl.
No.
Name of the Block /
No.of
the
Printing
Press
Type of the Press
(Letter Press/Off
set/Litho/Colour
Graphics)
Sl.
No.
Name of the Block
/ Municipality
No.of the
Printing Press
Type of the Press
(Letter Press/Off
set/Litho/Colour
Graphics)
1 Tiruvannamali 3 Screen Printing /
Offset Printing
13 Cheyyar 0
Screen Printing /
Offset Printing
2 Thurinjapuram 0 Screen Printing /
Offset Printing 14
Anakkavoor 0 Screen Printing /
Offset Printing
3 Kilpennathur 0 Screen Printing /
Offset Printing 15
Vembakkam 1 Screen Printing /
Offset Printing
4 Chengam 0 Screen Printing /
Offset Printing 16
Vandavasi 1 Screen Printing /
Offset Printin
5 Pudhupalayam 0 Screen Printing /
Offset Printing 17
Thellar 1
6 Thandrampet 1 Screen Printing /
Offset Printing 18
Pernamallur 0
7 Polur 0 Screen Printing /
Offset Printing
Municipality
8 Kalasapakkaam 0
Screen Printing /
Offset Printing 1
Tiruvannamalai 2
Offset Printing
9 Chetpet 0 Screen Printing /
Offset Printing 2
Cheyyar 0 Screen Printing /
Offset Printing
10 Jawwadhu 1 3
Arni 0 Screen Printing /
Offset Printing
11 Arni 0 Screen Printing /
Offset Printing 4
Vandavasi 0
12 Arni (w) 0
Source: District In0dustrial Centres.

P a g e | 88
31. PRICE INDICES
31.1. CONSUMER PRICE INDEX NOS FOR INDUSTRIAL WORKERS 2020-21 (Central Series - BASE YEAR:2011=100)
* Base year 2001=100 Source: Director General of Labour Bureau, Shimla.
** Base year 2011=100 Source: Department of Economics & Statistics, Chennai.
31.2. ALL INDIA & TAMIL NADU CONSUMER PRICE INDEX NOS FOR INDUSTRIAL WORKERS 2020-21 (BASE YEAR:2001=100)
Source: Director General of Labour Bureau, Shimla. * Average of centres( Chennai, Trichy, Madurai, Coiambatore, Coonnor & Salem).
.
MONTH CHENNAI
*
TRICHY
*
MADURAI
*
COIMBA
BATORE
*
COON
OOR
*
SALE
M
*
CUDDA
LORE
* *
NAGAR
KOVIL
**
VELLOR
E **
TUTICOR
N
**
APRIL -20 289 318 316 302 343 310 168 171 166 163
MAY-20 291 321 311 300 346 301 169 172 167 164
JUNE-20 296 318 315 302 350 298 170 172 168 164
JULY-20 299 331 310 302 348 299 172 173 170 165
AUG-20 299 331 316 311 351 306 174 174 171 166
AVERAGE 295 324 314 303 348 303 171 172 168 164
SEPT-20 119.9 - 119.5 118.3 121.7 114.0 175 175 171 167
OCTOBER-
20 119.5 - 119.2 119.3 122.2 116.7 178 177 172 170
NOVEMBE
R-20 122.6 - 118.0 119.1 122.2 118.9 179 177 173 171
DECEMBE
R-20 120.4 - 118.6 118.0 122.6 118.5 177 176 171 170
JANUARY-
21 121.5 - 120.1 118.3 125.3 118.9 178 177 172 172
FEBURAR
Y-21 120.7 - 124.1 118.4 128.4 120.6 177 177 172 171
MARCH-21 119.5 - 124.9 119.1 125.8 120.1 178 177 173 172
AVERAGE 120.6 - 120.6 118.6 124 118.2 177 176 172 170
Period All India Tamil Nadu*
2006 123 117
2007 131 164
2008 142 136
2009 157 151
2010 176 166
2011 192 177
2012 209 198
2013 232 221
2014 247 238
2015 261 254
2016 274 263
2017 281 273
2018 295 283
2019 317 302
2020(UPTO AUG) 331 314
2020(SEP TO DEC) 119 120

P a g e | 89
31.3CONSUMER PRICE INDEX NUMBERS FOR SELECTED ESSENTIAL ITEMS IN URBAN TAMIL NADU 2020-21
(Base Year 2012=100)
Source: Ministry of Statistics and Programme Implementation, India.
31.4.CONSUMER PRICE INDEX NUMBERS FOR SELECTED ESSENTIAL ITEMS IN RURAL & URBAN COMBINED IN
TAMIL NADU 2020-21 (Base Year 2012=100)
Source: Ministry of Statistics and Programme Implementation, India.
MONTH FOOD &
BEVARAGES
PAN, TOBACCO
AND
INTOXICANTS
FUEL AND
LIGHT
CLOTHING &
FOOTWEAR OTHERS
COMPOSIT
E INDEX
APRIL'20 -- -- -- -- -- --
MAY'20 -- -- -- -- -- --
JUNE'20 -- -- -- -- -- 156.5
JULY'20 -- -- -- -- -- 158.8
AUGUST'20 166.2 196.2 131.5 141.9 152.3 159.4
SEPTEMBER'20 169.5 196.5 131.3 142.7 151.5 160.5
OCTOBER'20 172.5 197.2 132.0 142.9 151.5 162.3
NOVEMBER'20 173.2 198.2 133.5 143.7 151.6 163.0
DECEMBER'20 171.8 199.4 140.1 145.1 152.8 163.4
JANUARY’21 171.3 199.5 143.4 147.5 154.4 164.0
FEBRURAY’21 172.8 199.8 148.8 149.4 155.0 165.1
MARCH’21 170.4 200.1 156.9 150.3 156.2 165.2
Average 171.0 168.80
139.7 145.4 153.2 161.8
MONTH FOOD &
BEVARAGES
PAN, TOBACCO
AND
INTOXICANTS
FUEL AND
LIGHT
CLOTHING &
FOOTWEAR OTHERS
COMPOSIT
E INDEX
APRIL'20 -- -- -- -- -- --
MAY'20 -- -- -- -- -- --
JUNE'20 -- -- -- -- -- 157.5
JULY'20 -- -- -- -- -- 159.1
AUGUST'20 164.2 188.2 135.2 147.8 153.5 159.2
SEPTEMBER'20 167.4 187.6 134.5 148.2 153.4 160.6
OCTOBER'20 170.9 188.6 136.3 148.4 153.3 162.5
NOVEMBER'20 171.8 188.6 137.8 149.0 153.6 163.3
DECEMBER'20 170.0 189.2 143.3 150.1 154.8 163.4
JANUARY’21 169.2 189.7 146.8 151.8 156.3 163.8
FEBRURAY’21 170.4 190.6 151.3 153.6 157.4 165.0
MARCH’21 168.5 191.2 158.6 154.9 158.2 165.0
Average 169.1 189.2 143.0 150.5 155.1 161.9

P a g e | 90
31.5.TIME SERIES DATA OF CONSUMER PRICE INDEX NUMBER FOR INDUSTRIAL WORKERS
(Central Series - BASE YEAR:2001=100)
Source: Ministry of
Statistics and Programme Implementation, India.
31.6.TIME SERIES DATA OF CONSUMER PRICE INDEX NUMBER FOR INDUSTRIAL WORKERS
State Series -
*2015 Calender year Average ** Base year Shifting w.e.f 01/2015
Source: Department of Economics & Statistics, Chennai.
YEAR CHENNAI
TRICHY
MADURAI
COIMBA
BATORE
COON
OOR
SALE
M
ALL INDIA
2006-07 119 119 117 121 117 116 125
2007-08 126 128 123 129 125 124 133
2008-09 139 146 137 140 136 139 145
2009-10 153 160 152 156 154 154 163
2010-11 163 178 165 168 171 166 180
2011-12 176 187 177 178 186 176 195
2012-13 202 216 203 200 209 197 215
2013-14 221 235 222 219 227 220 236
2014-15 234 259 245 235 246 239 251
2015-16 253 262 264 245 265 260 265
2016-17 254 267 265 252 273 267 276
2017-18 264 288 280 268 285 272 284
2018-19 272 292 285 279 312 284 300
2019-20 286 311 310 294 341 301 323
2020-21 299 324 320 306 359 312 335
YEAR CUDDALORE NAGERCOIL CUDDALORE NAGERCOIL VELLORE TUTICORIN
Old Series- Base Year1982-=00 New Series –Base Year-2011=100**
2006-07 521 515 -- -- -- --
2007-08 555 552 -- -- -- --
2008-09 638 624 -- -- -- --
2009-10 728 677 -- -- -- --
2010-11 814 783 -- -- -- --
2011-12 898 877 -- -- -- --
2012-13 1008 973 -- -- -- --
2013-14 1126 1059 -- -- -- --
2014-15 -- -- 135* 138* 135* 139*
2015-16 -- -- 137 139 137 140
2016-17 -- -- 140 145 141 141
2017-18 -- --
150 158 149 153
2018-19 -- --
157 164 153 157
2019-20 -- --
166 170 165 163
2020-21 -- --
172 174 169 166
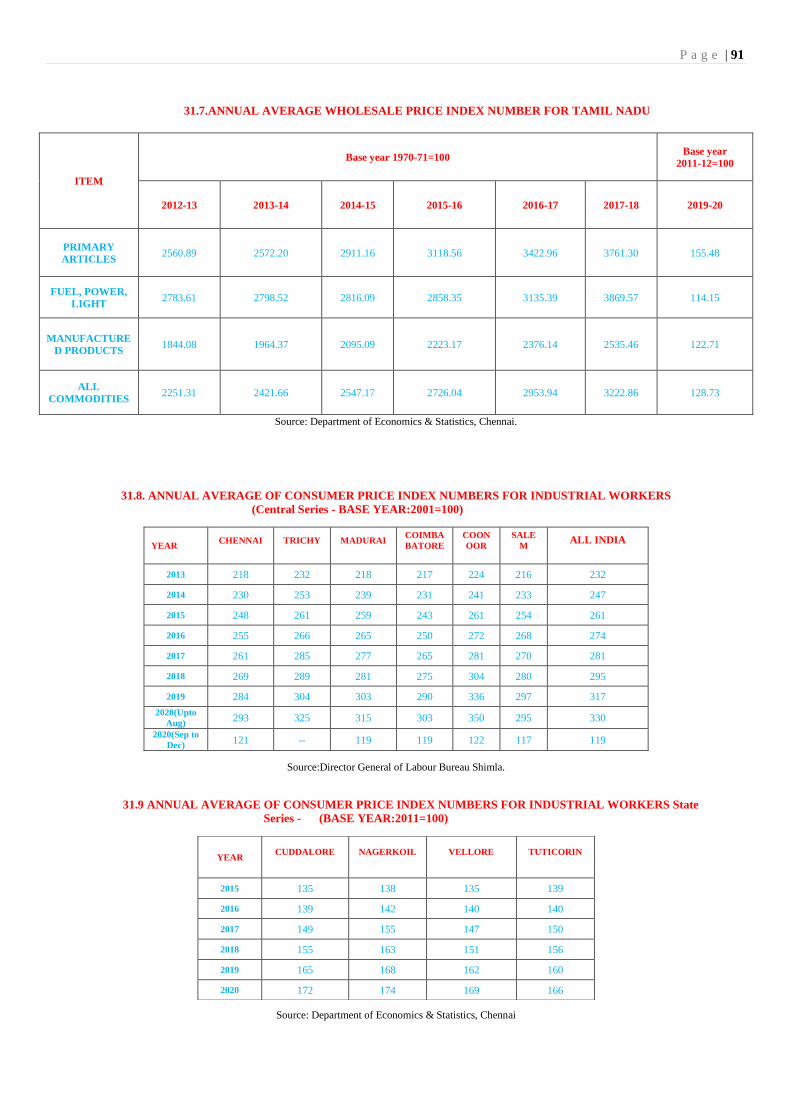
P a g e | 91
31.7.ANNUAL AVERAGE WHOLESALE PRICE INDEX NUMBER FOR TAMIL NADU
Source: Department of Economics & Statistics, Chennai.
31.8. ANNUAL AVERAGE OF CONSUMER PRICE INDEX NUMBERS FOR INDUSTRIAL WORKERS
(Central Series - BASE YEAR:2001=100)
Source:Director General of Labour Bureau Shimla.
31.9 ANNUAL AVERAGE OF CONSUMER PRICE INDEX NUMBERS FOR INDUSTRIAL WORKERS State
Series - (BASE YEAR:2011=100)
Source: Department of Economics & Statistics, Chennai
ITEM
Base year 1970-71=100 Base year
2011-12=100
2012-13 2013-14 2014-15 2015-16 2016-17 2017-18 2019-20
PRIMARY
ARTICLES 2560.89 2572.20 2911.16 3118.56 3422.96 3761.30 155.48
FUEL, POWER,
LIGHT 2783.61 2798.52 2816.09 2858.35 3135.39 3869.57 114.15
MANUFACTURE
D PRODUCTS 1844.08 1964.37 2095.09 2223.17 2376.14 2535.46 122.71
ALL
COMMODITIES 2251.31 2421.66 2547.17 2726.04 2953.94 3222.86 128.73
YEAR CHENNAI
TRICHY
MADURAI
COIMBA
BATORE
COON
OOR
SALE
M
ALL INDIA
2013 218 232 218 217 224 216 232
2014 230 253 239 231 241 233 247
2015 248 261 259 243 261 254 261
2016 255 266 265 250 272 268 274
2017 261 285 277 265 281 270 281
2018 269 289 281 275 304 280 295
2019 284 304 303 290 336 297 317
2020(Upto
Aug) 293 325 315 303 350 295 330
2020(Sep to
Dec) 121 -- 119 119 122 117 119
YEAR CUDDALORE
NAGERKOIL
VELLORE
TUTICORIN
2015 135 138 135 139
2016 139 142 140 140
2017 149 155 147 150
2018 155 163 151 156
2019 165 168 162 160
2020 172 174 169 166
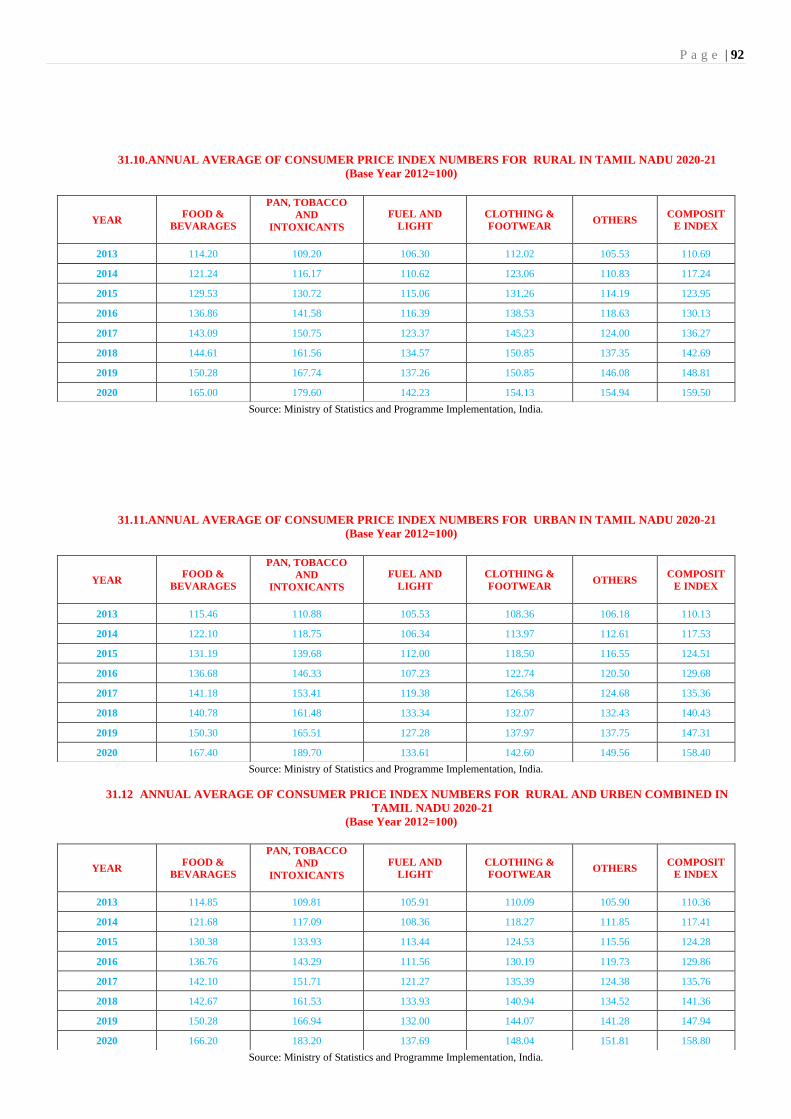
P a g e | 92
31.10.ANNUAL AVERAGE OF CONSUMER PRICE INDEX NUMBERS FOR RURAL IN TAMIL NADU 2020-21
(Base Year 2012=100)
Source: Ministry of Statistics and Programme Implementation, India.
31.11.ANNUAL AVERAGE OF CONSUMER PRICE INDEX NUMBERS FOR URBAN IN TAMIL NADU 2020-21
(Base Year 2012=100)
Source: Ministry of Statistics and Programme Implementation, India.
31.12 ANNUAL AVERAGE OF CONSUMER PRICE INDEX NUMBERS FOR RURAL AND URBEN COMBINED IN
TAMIL NADU 2020-21
(Base Year 2012=100)
Source: Ministry of Statistics and Programme Implementation, India.
YEAR FOOD &
BEVARAGES
PAN, TOBACCO
AND
INTOXICANTS
FUEL AND
LIGHT
CLOTHING &
FOOTWEAR OTHERS
COMPOSIT
E INDEX
2013 114.20 109.20 106.30 112.02 105.53 110.69
2014 121.24 116.17 110.62 123.06 110.83 117.24
2015 129.53 130.72 115.06 131.26 114.19 123.95
2016 136.86 141.58 116.39 138.53 118.63 130.13
2017 143.09 150.75 123.37 145.23 124.00 136.27
2018 144.61 161.56 134.57 150.85 137.35 142.69
2019 150.28 167.74 137.26 150.85 146.08 148.81
2020 165.00 179.60 142.23 154.13 154.94 159.50
YEAR FOOD &
BEVARAGES
PAN, TOBACCO
AND
INTOXICANTS
FUEL AND
LIGHT
CLOTHING &
FOOTWEAR OTHERS
COMPOSIT
E INDEX
2013 115.46 110.88 105.53 108.36 106.18 110.13
2014 122.10 118.75 106.34 113.97 112.61 117.53
2015 131.19 139.68 112.00 118.50 116.55 124.51
2016 136.68 146.33 107.23 122.74 120.50 129.68
2017 141.18 153.41 119.38 126.58 124.68 135.36
2018 140.78 161.48 133.34 132.07 132.43 140.43
2019 150.30 165.51 127.28 137.97 137.75 147.31
2020 167.40 189.70 133.61 142.60 149.56 158.40
YEAR FOOD &
BEVARAGES
PAN, TOBACCO
AND
INTOXICANTS
FUEL AND
LIGHT
CLOTHING &
FOOTWEAR OTHERS
COMPOSIT
E INDEX
2013 114.85 109.81 105.91 110.09 105.90 110.36
2014 121.68 117.09 108.36 118.27 111.85 117.41
2015 130.38 133.93 113.44 124.53 115.56 124.28
2016 136.76 143.29 111.56 130.19 119.73 129.86
2017 142.10 151.71 121.27 135.39 124.38 135.76
2018 142.67 161.53 133.93 140.94 134.52 141.36
2019 150.28 166.94 132.00 144.07 141.28 147.94
2020 166.20 183.20 137.69 148.04 151.81 158.80

P a g e | 93
31.13. WHOLESALE PRICE INDEX NUMBERS OF TAMILNADU (Base Year 2011-12=100) TAMIL NADU 2020-21
Source: Ministry of Statistics and Programme Implementation, India.
32. QUALITY CONTROL LIST OF INDUSTRIAL/ESTABLISHMENT UNITS HAVING QUALITY CONTROL FACILITIES AND
THE PRODUCTS SUBJECTED TO QUALITY CONTROL.- 2020-21
Sl.No.
List of Industries
Establishment Units having, Quality
Control Facilities
Products subjected to Quality Control
NIL
Source: Concerned Office.
33. REGISTRATION
33.1 NO.OF REGISTRATION OFFICES IN THE DISTRICT-2020-21
Sl.No
Places of Regd.Office in
Tiruvannamalai
Regd.District
No.of Document
Registration Office
Sl.No.
Places of Regd.Office in
Cheyyar Regd.District
No.of Document
Registration Office
1 Tiruvannamalai- 1&2 7241 1 Cheyyar Joint-1 1114
2 Kadaladi 4194 2 Cheyyar Joint-2 4934
3 Kalasapakkam 2502 3 Arni 10498
4 Kilpennathur 2492 4 Kannamangalam 3129
5 Chengam 8436 5 Kalambur 2830
6 Chetpat 3719 6 Kizhkodungalure 1550
7 Thandrampat 4259 7 Thellar 2386
8 Thanipadi 4689 8 Dusi 1996
9 Polur 4383 9 Peranamallur 2305
10 Mangalam 2387 10 Vandavasi 5214
11 Vettavalam 3344 11 Vembakkam 2394
Total 47646 Total 38350
Source: District Registration Office
33.2 REGISTRATION AND AGGREGATE VALUE OF PROPERTIES TRANSFERRED
DURING THE YEAR-2020-21
Name of Registration District
No.of Registration
(Moveable and
Immoveable)
Aggregate Value of Properties Transferred
(Moveable and Immoveable)Rs
Value Stamp
Thiruvannamalai 47646 9007460000 850763636
Cheyyar 38350 11569316785 411634112
Source: District Registration Office.
MONTH I.PRIMARY
ARTICLES
I.(A). FOOD
ARTICLES
I.(B). NON-
FOOD
ARTICLES
I.(C).
MINERALS
I.(D). CRUDE
PETROLIUM
&NG
II.FUEL &
POWER
SECTOR
III.MFD
PRODUC
TS
ALL
COMMO
DITIES
APL'20 160.25 165.17 138.46 196.54 72.14 94.11 126.14 128.80
MAY'20 171.48 180.56 126.80 196.54 77.82 71.23 126.87 128.21
JUNE'20 175.31 183.21 137.48 196.54 82.54 81.42 127.38 130.97
JULY'20 171.49 176.62 148.91 197.12 84.04 89.30 128.39 131.97
AUG'20 175.02 174.50 185.35 197.14 83.76 90.68 130.67 134.39
SEPT'20 173.07 178.61 148.52 197.44 81.90 90.07 131.20 134.19
OCT'20 179.31 181.07 178.80 199.68 64.66 88.27 131.23 135.32
NOV'20 184.37 181.74 209.69 199.68 65.80 87.37 132.49 137.10
DEC'20 182.53 174.52 238.18 199.68 69.03 93.57 134.03 138.61
JAN’21 192.45 176.80 293.14 200.22 71.08 96.55 136.03 142.54
FEB’21 187.19 176.75 257.08 200.22 72.93 104.06 136.87 143.05
MAR’21 175.35 175.30 183.93 200.22 72.93 106.78 138.28 141.69
Average 177.32 177.07 187.20 198.42 74.87 91.12 131.63 135.57

P a g e | 94
34. REPAIR AND SERVICE
34.1 AUTHORISED AUTOMOBILES REPAIR AND SERVICE STATIONS-2020-21
Name of the Block /
Municipalities
Authorized Automobiles
Repair and Service (in
No's.)
Name of the Block /
Municipalities
Authorized Automobiles Repair
and Service (in No's.) Tiruvannamalai 192 Cheyyar 101
Thurinjapuram 17 Anakkavoor 19
Kilpennathur 20 Vempakkam 17
Chengam 39 Vandavasi 104
Pudhupalayam 10 Thellar 26
Thandrampet 42 Pernamallur 17
Polur 54
Kalasapakkam 39 Municipality
Chetpet 66 Tiruvannamalai 61
Jawwadhuhills 8 Cheyyar 42
Arni 89 Arni 48
Arni(w) 66 vandavasi 36
Source: Concerned Office.
34.2 AUTHORISED ELECTRICAL AND ELECTRONIC GOODS REPAIR AND
SERVICE UNITS-2020-21
Sl.no
Name of the Block /
Municipalities
Electrical and Electronic
goods Repair and Service
Units (in No's)
Sl.no
Name of the
Block /
Municipalities
Electrical and Electronic
goods Repair and Service
Units (in No's)
1 Tiruvannamalai 56 10 Jawwadhu 2
2 Thurinjapuram 5 11 Arni 31
3 Kilpennathur 6 12 Arni(w) 19
4 Chengam 15 13 Cheyyar 37
5 Pudhupalayam 4 14 Anakkavoor 8
6 Thandrampet 17 17 Vembakkam 7
7 Polur 19 17 Vandavasi 31
8 Kalasapakkam 12 17 Thellar 10
9 Chetpet 24 17 Pernamallur 8
Municipality
Municipality
1 Tiruvannamalai 32 3 Arni 28
2 Cheyyar 24 4 Vandavasi 21
Source: Concerned Office.
35. RESTAURANTS AND HOTELS
35.1 RESTAURANTS, CATES AND OTHER EATING AND DRINKING PLACES –2020-21
Sl.No.
Items
Place
1. Restaurants 58
2. Cafes 96
3. Other Eating and Drinking Centers 396
Source: Concerned Office.
35.2 DETAILS OF HOTELS-2020-21
Sl.No.
Place
Name of the Hotels with Lodging
Facilities
Name of the Hotels without Lodging
Facilities
1 Tiruvannamalai
Trisul,Ramakrishna,Udipi
Brindhavan.Akash, Arunai
Annanda, Aparna
Aariyas,Ganesh,Arunachalam,
Deepam, Abirami,,Asoka
2 Arni Ambal Saravanabhavan,vasanthabhavan
3 cheyyar ---- Bharani
4 Polur ---- Aryabhavan, Muniyandy vilas
5 chengam ---- Aryabhavan, Muniyandy vilas
6 vandavasi ---- Muniyandy vilas, Aryabhavan Source: Concerned Office.

P a g e | 95
36. RECREATION AND CULTURAL SERVICES
36.1 LIST OF CINEMA THEATRES AND THEIR CAPACITIES-2020-21
Sl .No
Name of the Block / Municipality
No of the Cinema
Theatres
Capacity
Sl
.No
Name of the Block / Municipality
No of the Cinema
Theatres
Capacity
1 Tiruvannamalai 9 3013 12 Arni (w) - -
2 Thurinjapuram - - 13 Cheyyar 2 1233
3 Kilpennathur 1 306 14 Anakkavoor - -
4 Chengam 1 519 17 Vembakkam - -
5 Pudhupalayam - - 17 Vandavasi 2 962
6 Thandrampet 1 362 17 Thellar - -
7 Polur 2 1090 17 Pernamallur - -
8 Kalasapakkam - - Municipality-----
9 Chetpet 2 865 1 Tiruvannamalai 9 3013
10 Jawwadhu - - 2 Cheyyar 2 1233
11 Arni 5 3269 3 Arni 5 3269
4 Vandavasi 2 962
Source: District Collectorate.
36.2 LIST OF CLUBS AND ASSOCIATIONS-2020-21 Place
Name of the Club and Association
Tiruvannamalai Lions club,Rotary Club, Exnora club,Moon City Club
Chengam Lions club ,rottaryclub, exnora
Polur Lions club, jaycee club, Rottary club
Arni Lions Club, rottary club, officers club,arni town
-club Cheyyar Lions club, rottary club, Exnora.
Vandavasi Lions club, Rottary club.
Source: District Collectorate.
36.3 LIST OF MOTION PICTURE DISTRIBUTORS AND PROJECTION SERVICES-2020-21
Sl.
No.
Name of the Block / Municipality
Name of the Picture Distributors / Projection Services
NIL
Source: Concerned Controlling Departments.
37. SOCIAL WELFARE
37.1 PURATCHI THALAIVAR M.G.R. NUTRITIOUS MEALS PROGRAMME CENTRES-2020-21
No. of centres School sector Local Body Sector Social
welfare
AWC
Sector
ICDS
Total Panchayat Union Municipal
Bodies
Panchayat
Union
Municipal Bodies
1969 41 - - - 68 2010 Source: PA Noon Meal & ICDS
37.2 NO.OF BENEFICIARIES UNDER PURATCHI
THALAIVAR M.G.R. NUTRITIOUS MEALS PROGRAMME-2020-21
Name of
the
Schemes
No of
center
No. of Beneficiaries under age group 1 to 2 age
children weekly
one egg
beneficiries
2 to 5 age
children
noon meal
beneficiaries
6 to 36
Months ANW/PNM
11 to 14+
Adolescent
Girls
ICDS 2020-21
2127 99191 16726/17148 59724 31914 59359
1 to 5 6 to 10
Panchayat
union Municipal bodies Panchayat union
Municipal
bodies Total
PTMGR
2020-21 2010 101691 2474 105435 2683 212283
Source: PA Noon Meal & ICDS.

P a g e | 96
37. 3. NUMBER OF BENEFICIARIES UNDER FREE SUPPLY OF
TEXT BOOKS AND UNIFORMS –2020-21
Sl.
No
NAME OF THE
INSTITUTION
Age group 6-17 (Standards I to XII)
Uniforms Text Books Bicycles Laptop
Boys
Girls
Boys
Girls
Boys
Girls
Boys Girls
1 Secondary &
Hr.hSec
(2020-21) 25443 25031 80265 81415 10574 12114 0 0
2
Primary (1
to 5) & Upper
Primary ( 6 to 8)
65579 66259 65579 66259 - - - -
Source: District Educational office, CEO
37.4 NUMBER OF BENEFICIARIES UNDER OLDAGE PENSION SCHEME-2020-21
Taluk
Old
ag
e p
ensi
on
er
for
aged
Old
ag
e p
ensi
on f
or
Ph
ysi
call
y
han
dic
app
ed
Old
ag
e p
ensi
on f
or
wid
ow
Old
ag
e p
ensi
on t
o
agri
. L
abo
ur
Old
ag
e p
ensi
on f
or
des
erte
d w
ives
(OD
WP
)
IG W
ido
w P
ensi
on
Sch
eme
Ch
ief
Min
iste
r
Uzh
avar
Pat
hu
kap
pu
Th
itta
m
Un
mar
ried
wo
men
pen
sio
n
To
tal
Tiruvannamali 758 242 531 - 13 2 178 7 1731
Polur 1097 362 893 - 54 3 717 13 3139
Chengam 793 118 542 - 30 61 233 1 1778
Thandrampat 543 158 468 - 21 0 248 1 1439
Arni 696 168 435 - 117 98 77 15 1606
Vandhavasi 519 136 287 - 17 45 623 2 1629
Cheyyar 192 198 464 - 13 5 708 3 1583
Chetpet 242 178 345 - 23 45 426 3 1262
Kalasapakkam 78 67 194 - 15 0 287 0 641
Vembakkam 367 85 245 - 10 36 271 2 1016
Kilpennathur 851 185 493 - 31 0 385 3 1948
Jamunamarathur 60 60 85 - 33 0 77 0 315
Total 6196 1957 4982 - 377 295 4230 50 18087
Source: District Revenue Office
37.5 FREE HOUSES AND HOUSE SITES DISTRIBUTED TO COMMUNITIES –2020-21
District total
House distributed
S.C. S.T. B.C. D.C.& MBC Others Total
3334 394 3731 3490 1383 12332
Source: District Revenue Office.

P a g e | 97
37.6 IMPLEMENTATION OF RELIEF MEASURES AND PENSION SCHEMES-2020-21
Sl.
No Name of the scheme/Relief measures
No.of beneficiaries Total amount
disbursed
(Rs,in ‘000’ SC ST Others Total
1 Nalinthor nala thittam 7 0 58 67 1340000
2 Accidental relief for worker’s (Srilankan Refugees)
- - - 190 17615000
3 Freedom fighters pension scheme
1.State Government - - - - -
2.Central Government - - - - -
3.State Government & Central Government
- - - - -
4 C.M.’s Relief fund
1.Road accident 13 2 32 47 5150000
2.Riot Victim- - - - - -
3.Others ( specify) - - - - - 5. Mozhi kavalar Pension scheme - - - - - 6 Nalintha kalaignar Pension scheme - - 2 2 36000 7 Other if any - - - - -
Source: District Revenue Office
38. SANITARY SERVICES
38.1 No. of Sanitary Workers engaged in Sanitation, Garbage
and Sewage disposal and other particulars-2020-21
Place
No. of Workers
engaged in
Sanitation
No. of Garbage and
Sewage disposal
Other connected works related with sanitation
District 592 171 Sweeping, Drain Cleaning, Solid waste management
works, Dengue control activities
Source: Concerned Departments
38.2. NO. OF VEHICLES ENGAGED IN SANITARY SERVICE-2020-21 Sl.No.
Name of the Town
Panchayat /Municipality
No. of Vehicles in
Sanitary
Sl.No.
Name of the Block
/Municipality
No. of Vehicles
in Sanitary
1 Vettavalaam 24 10 Desur 9
2 Kilpennathur 17
3 Chengam 23
4 Pudhupalayaam 14
5 Polur 41 Municipalities
6 Kalambur 26 1 Tiruvannamalai 22
7 Chetpet 50 2 Cheyyar 27
8 Kannamangalam 19 3 Arni 9
9 Pernamallur 3 4 Vandavasi 5
Source: Concerned Body

P a g e | 98
39. SCIENTIFIC AND RESEARCH SERVICE
39.1 INSTITUTIONS AND LABORATORIES ENGAGED IN RESEARCH WORK-2020-21
Name and address of Institutions
and Laboratories
Type of Research Field
No of
Scientists in
Laboraties
No of Non-
Scientists in
Laboraties
Center of Excellence in Millets,
Athiyanthal , Tiruvannamalai-
606603
Agriculture:
• Small Millets research in Ragi,
Tenai, Samai, Panivaragu,
Kuthiraivali and Varagu.
• Germplasm Maintenance.
• Evolving new high yielding
varieties.
• Crop Management.
• Plant Protection.
• Training to the Students,
Extention Officials and farmers.
4 9
Source: Concerned Institution.
40. STORAGE FACILITIES 40.1 LIST OF AGRICULTURAL AND NON-AGRICULTURAL STORAGE GODOWNS-2020-21
Name and address of Agricultural Godowns Capacity-M.TONNE
Tamilnadu Warehousing corporation - Tiruvannamalai No.6
700
Tamilnadu Warehousing –corporation Godown- Polur No. 4 700
.Tamilnadu warehousing Corporation-Arni No.5
(i) Main Centre 17
(ii) Sub-Centre- 21
1500
1700
800 Source: District Warehousing office.
40.2 LIST OF COLD STORAGE AND GODOWNS Sl.No.
Name and address of the cold storage each has capacity of 25 MT
1 Cheyyar – Regulated market, Arcot Road, Cheyyar.
2 Chengam – Regulated market, Thukkapet Main Road , Chengam
3 Chetpet – Regulated market, Vandhavasi Road, Chetpet.
4 Tiruvannamalai – Regulated market, Tindivanam Road, Tiruvannamalai.
5 Vettavalam – Regulated market, Tiruvannamalai Road , Vettavalam.
6 Vandhavasi – Regulated market, Kulathu Street, Vandhavasi.
7 Polur – Regulated market, Vellore Main Road, Polur.
Source: Concerned Department
41. TEXTILES
41.1 No. of Ginning, Spinning and Weaving mills-2020-21
Sl.No
Name of the
Block/Municipaities
No. of Ginning mills
No. of Spinning mills
No. of Weaving mills
1 Tiruvannamalai - - -
2
Arni -
- -
- 3 Polur - - -
Source: Concerned office
41.2 QUANTUM OF PRODUCTION DURING THE YEAR.- 2020-21 Ginning Mills
production
Spinning mills production
Weaving mills Production
-- -- -- Source: Concerned office

P a g e | 99
42. TRADE AND COMMERCE
42.1 NO. OF MAJOR AND MINOR TRADE AND COMMERCIAL ESTATE-2020-21
No. of Micro, Small, and
Medium Enterprises
No. of Commercial Estate
-- -- Source: Concerned office
43. TRANSPORT 43.1 LENGTH OF ROADS (IN KM) -2020-21
Surfaced Roads
Un surfaced
Roads
Grand
Total
Item
Cement
Concrete
Bituminous Water bound
Macadam
Total
SH 0.84 336.040 - 336.880 - 336.880
MDR 0.20 178.800 - 179.000 - 179.000
ODR 0.280 975.900 - 976.180 - 976.180
Sugarcane road
ODR 29.370 - 29.370 - 29.370
Total 1.320 1520.11 - 1521.430 - 1521.430
Source: Divisional Office, Highways,Tiruvanamalai
43.2 ROAD ACCIDENTS -2020-21 Sl.No.
Period
Total Number of
Accidents
No. of persons
injured
Number of persons
killed
1 (01.04.2018 to 31.03.2019) 1364 1523 308
2 (01.04.2019 to 31.03.2020) 2111 2181 387
3 (01.04.2020 to 31.03.2021)
Source: S.P. Office T.V. Malai

P a g e | 100
43.3 REGISTERED MOTOR VEHICLES -2020-21 Commercial
Stage carriage Auto-
rickshaw
Ordinary
Taxi
Motor
Cab
Maxi
Cab
Omni
Buses
Private Station Vehicle &
others Public Private
1 2 3 4 5 6 7 8
- 182 1058 - 658 554 - 91
Commercial
School Bus
Ambul
ance
Fire
Fighter
Light Commercial
Vehicle
Lorry Articulated Vehicle
Commercial
Tractor/
Tractor/
Tractor/
Total State
Permit
National
Permit
State
Permit
National Permit
9 10 11 12 13 14 15 16 17 18
130 6 - 125 1126 295 - 34 535 4794
Non-Commercial Vehicles
Motor Cycle
Scooter
Moped
Tri-Cycle Auto
Motor Car
Jeep
Station Wagon
19 20 21 22 23 24 25
27615 10091 2901 - 2230 - -
Non-Commercial Vehicles
Tractor
Three
Wheeler
Four Wheeler
Road Rollers
Others
Total
Grand Total
26 27 28 29 30 31 32
2130 5 - - 404 45376 50170
Source Regional Transport Office, Tiruvannamalai/Arni
43.4 TRANSPORT CORPORATIONS-2020-21
Sl.No
Name of the Corporations
Year of
Formation
Headquarter
District covered
No.of buses as
on 31st March
1
Tamilnadu state Transport
corporation
(Villuppuram -Division-II).
Ltd/TVM.region,
22.01.2007 Tiruvannamalai Tiruvannamalai 626
Source: Cerncerned Transport Department
43.5 SELECT INDICATORS ON OVERALL PERFORMANCE OF STATE
TRANSPORT CORPORATIONS- 2020-21 Sl.
No.
Item
Name of the Transport Corporation
( TNTC-Villuppuram) Vellore Region
1.
2.
3.
4.
5.
6.
7.
8.
9.
10.
11.
12.
Fleet Strength
Kilometers operated carried per day (in lakhs)
Number of passengers carried per day (in lakhs)
Fleet Utilization (Percentage)
Kilometer efficiency (Percentage)
Kilometer run per liter of diesel-
a) City / Town
b) Mofussil
Number of routes (As on day)
Number of New routes introduced during the year
New villages benefited during the year
Benefited village population (in lakhs)
Staff strength
Number of New Buses purchases
631
1.49
1.00
50.23
49.28
6.07
5.60
564
-
-
-
3730
-

P a g e | 101
43.6 RAILWAY LINES AND STATIONS-2020-21 Item
Broad
Gauge
Meter
Gauge
Broad Gauge &
Meter Gauge
Total
1. Route Length (in Km.) 93 - 93 93
2. Tract Length (in Km.) 104.53 - 104.53 104.53
3. Number of Railway Stations 11 - 11 11
Source: Concerned Railway Station.
43.7 PORT DEVELOPMENT
Name of the Port
Vessels entered
Cargo handled
Major Ports:
Intermediate Ports
Minor Port
* Including Transshipment, Cargo and Container cargo
NIL NIL
Source: Concerned Port Office
43.8 AIR PORTS-2020-21 Sl.
No.
Airport
Passengers (in ‘000’)
Embarked
Disembarked
Transit
Total
1. INTERNATIONAL AIRPORT, MADRAS
a) International
b) Domestic
2. DOMESTIC AIRPORT NIL
a) Madras
b) Coimbatore
c) Madurai
d) Tiruchirappalli
TABLE 43.8 Contd. Cargo Handled (Tonne) Revenue (Rs. In lakhs)
Loaded
Unloaded
Total
PAX
Cargo
Total
NIL
Source: Concerned Airport
43.9 PRIVATE TRANSPORT OPERATIONS-2020-21
Sl.No.
Name of the Transport Operations
1
Tiruvannamalai :Pichandavar transport, S.T.M.S ,, Pachaiamman, T.B.N, Balasubramaniyar,
Rukkkumani, Prabhagar, Manonmani, Artheeswari, Majastic, Arunai, N.S., Arasu, Narayanan, Deen
motors, Murugan, Ramajayam, Bala murugan, Dhomotharan, Tirumalai, VDSR, VDS Sayar, Srinivasan
2 Arni: Renukammbal Transport, Dhanapal, Venketeswara, KVS
3 Polur: Rangasami, Sri lakshmi Bhaskar, V.M. Motor, Vasavi
4 Vandavasi: A.P.R. Transport, Dhadha, Balasubramanian
Source: Concerned Transport Corporation

P a g e | 102
44. TOURISM
44.1 PLACES OF TOURIST ATTRACTION-2020-21
Sl.No.
Name of the Block
Tourist Place
1 Tiruvannamalai Arulmigu Annamalaiyar Temple, Ramna Maharishi Ashramam, Seshathri
ashramam, Yogi Ramsurath kumar ashramam, Adi Annamalai Temple
2 Thandrampat Sathanur dam
3 Polur Lakshmi Narasimmar Temple,Erikuppam Enthira Sanibagavan Temple,Padavedu
Sri Renugambal temple,Senbhagathoppu Dam
4 Kalasapakkam Vilvarani-Star Temple,Pachai Amman Temple Parvathamalai Shiva Temple,
Miruganda Dam
5 Jawadhu hills Neermathi Tree, Beema Falls, Komuteri Lake,
Kullar Kugai,Kannadi Maaligai
6 Chetpat Thurumalai Jain Temple, Loorthu Matha Church
7 Chegam Kuppanatham Dam
8 Cheyyar Arulmigu Vedhapurishwarar Temple
9 Anakavur Pesum Perumal, Koozhamandhal
10 Vandavasi Birudhar Jain Temple,Thennangur Sri Panduranga Temple, Venkundram
Thavalagreeshwarar Temple
11 Peranamallur Injimedu Sivan Temple, Avaniyapuram, Narasimma Swami Temple
12 Pudhupalayam Pudhur Mariyamman Temple
13 Vembakkam Mamandur Lake
Source: District Tourist Development Office.
44.2 LIST OF PLACES OF WORSHIP-2020-21 Sl.No.
Name of the Taluk
Places of Worship
1 Tiruvannamali Arulmigu Annamalaiyar Temple, Ramana ashramam, Shesathri asramam, Yogi
Ramsurath kumar ashramam,Adi annamalai temple
2 Polur
Sri Murugan Temple-Vilvaarani
Sri Sampathgiri temple, Lakshmi narasimmar temple-Polur
Jain temple-Thirumalai
Renugambal Temple, Shiva Temple -Padavedu
Erikuppam Endhira Sanibagavan Temple,Shanbagathoppu Dam
3 Arni Puthira Kamatchi amman temple,
Periyanayagi amman temple,Kailasanathar Temple, Arni Eswararan Kovil -
Devigapuram
4 Chengam Neepathurai, Pudur Mariyamman koil,kuppanatham Dam
5 Cheyyar
Sri Vedhapurieswarar Temple
Eswaran Kovil - Thiruppanagadu
Eswaran Kovil - Kuranginil Muttam
Koozhamandhal Pesum Perumal Temple
6 Chetpet Tirumalai Jain Temple
7 Kalasapakkam Star Temple,Pachai Amman Temple,Parvadhmalai,Miruganda Dam
8 Vandavasi
Sri Panduranga Temple- Thennangur
Eswaran Kovil - Injimedu Peranamellur
Jain Temple Ponnur,Birudhar Jain Temple,Venkundram Thavalagreeshwarar
Temple
9 Thandarampet Sathanur Dam
10 Anakavoor Pesum perumal,Koozhzmandhal
11 Peranamallur Injimedu Sivan Temple,Avaniyapuram Narasimma Swami temple
12 Pudhupalayam Pudhur Mariyamman Temple
13 Vembakkam Mamandur Lake and Temple
Source: Concerned Office.
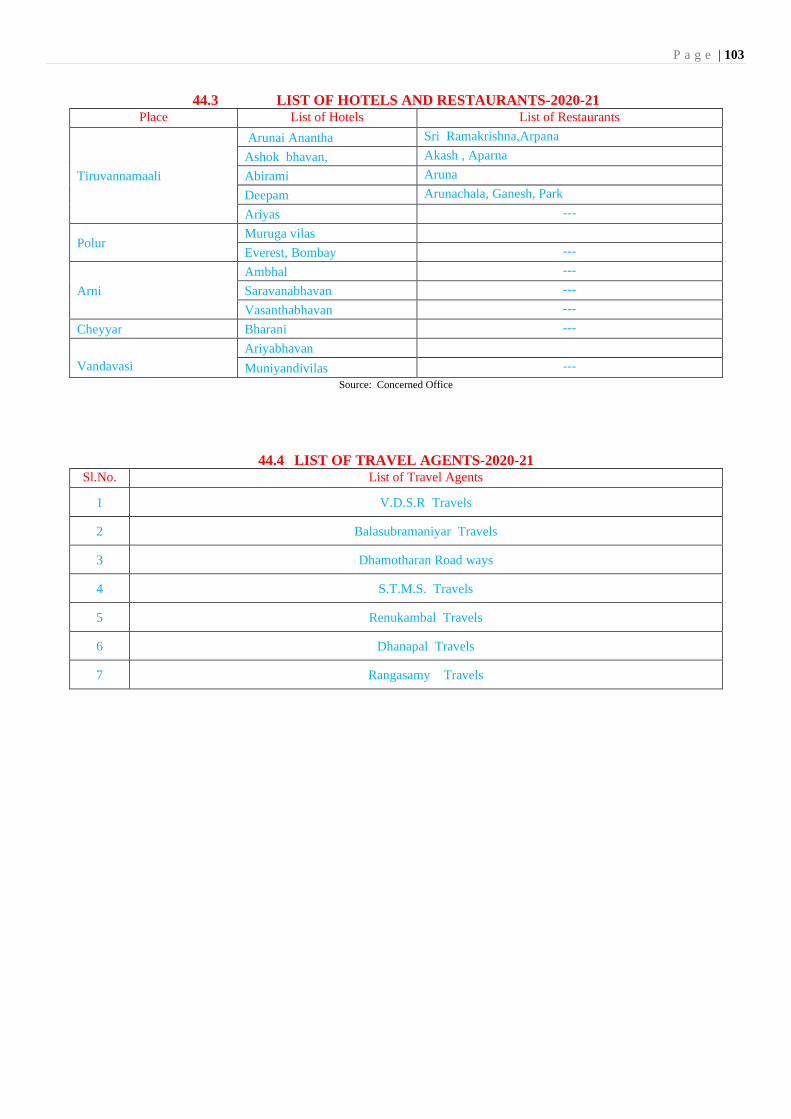
P a g e | 103
44.3 LIST OF HOTELS AND RESTAURANTS-2020-21 Place
List of Hotels
List of Restaurants
Tiruvannamaali
Arunai Anantha Sri Ramakrishna,Arpana
Ashok bhavan, Akash , Aparna
Abirami Aruna
Deepam Arunachala, Ganesh, Park
Ariyas ---
Polur Muruga vilas
Everest, Bombay ---
Arni
Ambhal ---
Saravanabhavan ---
Vasanthabhavan ---
Cheyyar Bharani ---
Vandavasi
Ariyabhavan
Muniyandivilas ---
Source: Concerned Office
44.4 LIST OF TRAVEL AGENTS-2020-21 Sl.No.
List of Travel Agents
1 V.D.S.R Travels
2 Balasubramaniyar Travels
3 Dhamotharan Road ways
4 S.T.M.S. Travels
5 Renukambal Travels
6 Dhanapal Travels
7 Rangasamy Travels

P a g e | 104
44.5 TRAIN AND AIR SERVICE TIMINGS-2020-21
Sl.no Time( Departure) Train Number Place
Air Service Timings
From To
Sunday
- No Air-Port
in this
District -
1 01.40 17413 Tirupati Puduchery
2 04.30 01005 DADAR Puducherry
3. 05.00 16780 Rameshwaram Tirupati
4. 10.35 17414 Puducherry Tirupathi
5. 11.20 17408 Mannargudi Tirupathy
6 17.30 06779 Tirupathy Rameswaram
7 23.20 01006 Puducherry DADAR
Monday
1 04.20 06780 Rameshwaram Tirupati
2 10.50 07408 Mannarkudi Tirupati
Tuesday
1 04.20 01005 DADAR Puducherry
2 05.30 16780 Rameswaram Tirupathy
3 13.02 06178 Villupuram Kharagpur
4 16.00 07407 Tirupathy Mannargudi
5 17.30 16779 Tirupathy Rameswaram
6 17.12 06169 Purulia Villupuram
7 23.20 01006 Puducherry Dadar
Wednesday
1 04.20 01005 DADAR Puducherry
2 10.50 07408 Mannargudi Tirupathi
3 13.02 06170 Villupuram Purulia
4 23.20 01006 Puducherry DADAR
Thursday
1 16.00 07407 Tirupati Mannarkudi
Friday
1 04.20 06780 Rameshwaram Tirupati
2 10.50 07408 Mannarkudi Tirupati
3 16.00 06779 Tirupati Rameshwaram
4 17.12 06177 Korakpur Vilupuram
Saturday
1 04.20 06780 Rameshwaram Tirupati
2 13.02 06170 Vilupuram Purulia
3 15.00 07407 Tirupati Mannarkudi
4 16.00 06779 Tirupati Rameshwaram
5 17.12 06169 Purulia Vilupuram
Daily Passenger
1 6.30 56882 Vilupuram Thirupati
2 7.15 56881 Katpadi Vilupuram
3 9.00 56883 Thirupathi Vilupuram
4 18.00 56884 Vilupuram Thirupati
5 18.40 56885 Thirupathi Vilupuram
6 20.00 56886 Vilupuram Katpadi
Source: Southern Railways

P a g e | 105
45. VITAL STATISTICS
45.1 BIRTHS AND DEATHS REGISTERED-2020-21 Sl.
No.
Name of the Block
/ Municipality
Live Births
Registered
Deaths
Registered
Sl.No.
Name of the Block
/ Municipality
Live Births
Registered
Deaths
Registered
1 Tiruvananmali 12487 3047 13 Cheyyar 100 757
2 Thurinjapuram 278 914 14 Anakkavoor 108 731
3 Kilpennathur 602 968 15 Vempakkam 259 1083
4 Chengam 1133 1312 16 Vandavasi 490 1078
5 Pudhupalayam 273 693 17 Thellar 188 925
6 Thandrampet 1250 1275 18 Pernamallur 136 728
7 Polur 1053 1475 Total 20968 19221
8 Kalasapakkam 629 1022 Municipality
9 Chetpet 401 1002 1 Tiruvannamalai 1671 874
10 Jawadhuhills 932 395 2 Cheyyar 2096 314
11 Arni 307 941 3 Arni 806 422
12 Arni (w) 342 875 4 vandavasi 22 168
Total 4595 1778
Grand Total 25563 20999
Source: D.D.Health.
45.2 BIRTH, DEATH AND INFANT MORTALITY RATES-2020-21
Birth
Death
Infant Mortality
Rural 13.7 6.5 14.1
Urban 10.8 5.3 9.3
Combined 13.3 6.3 13.6 Source: D.D.Health.
45.3 DEATH BY CAUSES-2020-21 Sl.No.
Name of the Causes for Death
No.of the Death
1 Cholera 0
2 Dysentery 2
3 Malaria 0
4 Typhoid 2
5 Other Fever 0
6 T .B. 54
7 Other Disease Infections 186
8 Accidents & Injuries 73
9 Heart disease 541
10 Other specified disease 2817
11 All other causes 17324
Total 20999
Source: D.D.health.

P a g e | 106
46. VOLUNTARY SERVICES 46.1 LIST OF VOLUNTARY SERVICES AVAILABLE IN THE DISTRICT
FOR THE DEVELOPMENT OF RURAL AND URBAN POPULATION-2020-21
Sl.No List of Voluntary Service
1 Rotary club
2 Lion's Club
3 JCI Club
4 Exnora
Source: Concerned Organization.
47. WATER WORK AND SUPPLY 2020-21
47.1 I.NO OF SCHEMES OPEARTED IN THE DISTRICT 2020-21 S.NO Name of the Schemes
No. of works Allocation Rs in lakhs
1 Maintenance of CWSS 27 Nos. 1045.85
2(a) SDRF Works Phase - II 14 Nos. 155.00
(b) SDRF Works Phase - III 13 Nos. 135.00
3(a) Outlived CWSS under CGF works 3 Nos. 167.00
(b) ODF Works under NRDWP 10 Nos. 223.05
4 TWAD Fund Works 3 Nos. 115.00
Source: TWAD Board, RWS Division.
47.2 NO.OF WORKERS ENGAGED IN THE WATER WORKS AND SUPPLY
Sl.No.
Name of the Schemes
No.of Workers engaged in water works and supply
1 WSIS to Tiruvathipuram Municipality 10
2 WSIS to Arani municipality 12
3
CWSS to 4 Municipality , 10 Town panchayats
and 4753 rural Habitations in
Tiruvannamalai dt., 11 town panchayats 5068
Habitations in vellore Dt.(Part)
Nil
Source: TWAD Board, RWS Division.
47.3 NO.OF HOUSE CONNECTIONS, FOUNTAINS-2020-21
Sl.No.
Name of the Blocks
No.of House water
connections
Sl.No.
Name of the Town
Panchayat/ Municipalities
No.of House water
connections
1 TIRUVANNAMALAI 3883 TOWN PANCHAYAT
2 THURINJAPURAM 2106 1 KILPENNATHUR 1476
3 KILPENNATHUR 2011 2 CHENGAM 2336
4 CHENGAM 3486 3 PUDHUPALAYAM 1124
5 PUDHUPALAYAM 1096 4 POLUR 4007
6 THANDRAMPET 1880 5 KALAMBUR 2321
7 POLUR 2100 6 PERANAMALLUR 857
8 KALASAPAKKAM 4229 7 CHETPET 1288
9 CHETPET 13806 8 DESUR 671
10 JAWWADHU 62 9 VETTAVALAM 1386
11 ARNI 6816 10 KANNAMANGALAM 576
12 ARNI( W) 5576
13 CHEYYAR 5685 MUNICIPALITY
14 ANAKKAVOOR 4833 1 TIRUVANNAMALAI 19224
15 VEMBAKKAM 8266 2 CHEYYAR 5607
16 VANDAVASI 4481 3 ARNI 6021
17 THELLAR 771 4 VANDAVASI 4635
18 PERNAMALLUR 10323
Source: Concerned Department.

P a g e | 107

P a g e | 108
.