Choosing Who You Are: The Structure and Behavioral Effects ...
63
Choosing Who You Are: The Structure and Behavioral Effects of Revealed Identification Preferences Florian Hett * MarkusKr¨oll † Mario Mechtel ‡ October 4, 2017 Abstract Social identity is an important driver of behavior. But where do differences in social identity come from? We use a novel laboratory experiment based on a revealed pref- erence approach to analyze how individuals choose their identity. Facing a trade-off between monetary payments and belonging to different groups, individuals are willing to forego significant earnings to avoid certain groups and thereby reveal their identifica- tion preferences. We then show that these identification preferences are systematically related to behavioral heterogeneity in group-specific social preferences. These results illustrate the importance of identification as a choice and its relevance for explaining individual behavior. JEL Codes: C91, C92, D03 Keywords: Social Identity, Identification, Social Preferences, Outgroup Discrimination * Department of Management and Microeconomics, Goethe University Frankfurt, Theodor-W.-Adorno- Platz 4, D-60323 Frankfurt/Main, Germany, e-mail: [email protected]. † Department of Management and Microeconomics, Goethe University Frankfurt, Theodor-W.-Adorno- Platz 4, D-60323 Frankfurt/Main, Germany, e-mail: [email protected]. ‡ Leuphana University L¨ uneburg, Institute of Economics, Scharnhorststr. 1, D-21335 L¨ uneburg, Germany, e-mail: [email protected]. 1
-
Upload
khangminh22 -
Category
Documents
-
view
6 -
download
0
Transcript of Choosing Who You Are: The Structure and Behavioral Effects ...
Choosing Who You Are: The Structure and BehavioralEffects of Revealed Identification Preferences
Florian Hett∗ Markus Kroll† Mario Mechtel‡
October 4, 2017
Abstract
Social identity is an important driver of behavior. But where do differences in socialidentity come from? We use a novel laboratory experiment based on a revealed pref-erence approach to analyze how individuals choose their identity. Facing a trade-offbetween monetary payments and belonging to different groups, individuals are willingto forego significant earnings to avoid certain groups and thereby reveal their identifica-tion preferences. We then show that these identification preferences are systematicallyrelated to behavioral heterogeneity in group-specific social preferences. These resultsillustrate the importance of identification as a choice and its relevance for explainingindividual behavior.
JEL Codes: C91, C92, D03Keywords: Social Identity, Identification, Social Preferences, Outgroup Discrimination
∗Department of Management and Microeconomics, Goethe University Frankfurt, Theodor-W.-Adorno-Platz 4, D-60323 Frankfurt/Main, Germany, e-mail: [email protected].†Department of Management and Microeconomics, Goethe University Frankfurt, Theodor-W.-Adorno-
Platz 4, D-60323 Frankfurt/Main, Germany, e-mail: [email protected].‡Leuphana University Luneburg, Institute of Economics, Scharnhorststr. 1, D-21335 Luneburg, Germany,
e-mail: [email protected].
1
1 Introduction
Individuals’ social identity – their sense of who they are based on their perceived membership
in social groups – has substantial effects on how they act.1 Accordingly, a large literature
shows the distinct role social identity plays across a broad variety of domains, ranging from
the optimal design of the educational system and organizations (Akerlof and Kranton 2002,
2005, Fryer and Torelli 2010), preferences for redistribution (Klor and Shayo 2010), female
labor supply and the gender pay gap (Bertrand et al. 2015), dishonest behavior and crime
and even risk-taking and amplified dynamics in financial markets (Cohn et al. 2015a,b).
Understanding the origins of variation in social identity would therefore facilitate under-
standing differences in behavior. Existing studies typically assume that an individual takes
her identity as given or study its long-term determinants (Nunn 2010, Rustagi and Veronesi
2016). In contrast, the social identity approach claims that individuals also actively choose
their identity through identification (Tajfel 1974). So what if individuals actually do “choose
who they are”? Differences in behavior are then not only driven by exogenous variation in
individuals’ identity, but also endogenously affected by their choice of identity.
In this paper, we investigate whether and in which sense individuals actually do “choose
who they are” and whether such endogenous identification affects behavior. Identification
constitutes a choice among different alternative identities (social categories). For instance,
an African American alumn of Stanford, born in Wisconsin, working for a bank in New York
can, among others, identify with her gender, race, alma mater, origin, occupation, or current
residence. If individuals differ in these choices, these differences should be reflected in the
relation between their social identity and behavior. Accordingly, differences in identification
should be a key element in explaining the considerable heterogeneity of identity-related be-
havior (Mueller 2017, Kranton et al. 2017, Paetzel and Sausgruber 2016).
From an economic perspective, treating identity as a choice implies that individuals should
have preferences over the respective alternatives. In our experiment, participants face a
tradeoff between monetary payments and identification with different groups that have dif-
ferent characteristics. The implicit monetary valuations for different identification choices
then imply a preference ordering over these different identities. Our first objective is assess-
1The feeling of belonging to a particular group leads to a stronger compliance with behavioral stereotypes(Shih et al. 1999, Benjamin et al. 2010). It segregates society by defining insiders and outsiders which servesas a basis for discrimination, for instance in distributional decisions (Chen and Li 2009, Kranton et al. 2016)or trust (Fershtman and Gneezy 2001). It also affects the effectiveness of cooperation and coordination ingroups (Eckel and Grossman 2005, Chen and Chen 2011) and the extent to which norms are being enforced(Goette et al. 2006).
2
ing whether identification preferences explain heterogeneity in the behavioral effects of social
identity, namely outgroup discrimination in dictator games. If identity is actually a choice,
heterogeneity in the strength of identification constitutes a natural source of variation in the
behavioral effects of social identity. This would imply that to understand and potentially
affect individual behavior originating from social identity requires insights in how individuals
actually want to identify. Our second objective is therefore to isolate key factors shaping
the structure of identification preferences.
Empirically studying identification is challenging for a number of reasons. As previously
discussed, an individual’s social identity is multi-dimensional: individuals can identify with
many different social categories whose salience and relevance vary over time (Tajfel 1974,
Akerlof and Kranton 2000). This multi-dimensionality creates substantial ambiguity with
respect to what individuals perceive to be available identities in a specific situation. In eco-
nomic terminology: the researcher has imperfect knowledge about the individual’s perceived
choice set. Second, identity is a cognitive concept: it is not a part of how people act, but how
people think (Tajfel 1974). Hence, identification is an inherently cognitive action without a
straight-forward behavioral – and thus observable – counterpart. Third, in almost all natural
settings, different identities have different “instrumental values”. This means that a specific
identification choice can typically be rationalized by some sort of expected future (material)
payoff (Algan et al. 2013). Think, for example, of joining a political party: while it might
sound reasonable to interpret such a decision as being driven by identity considerations, it
is not clear how to disentangle the identity motive from indirect material motives through
improved career and network opportunities within the party. To really isolate pure identifi-
cation preferences, it is crucial to provide a setting in which such strategic concerns about
the instrumental value of identity are minimized.2
Our research design features a laboratory experimental setup that explicitly addresses these
challenges. Participants at two different universities begin by individually performing a
mathematics task (adding numbers). Subsequently, we assign them to groups. Groups dif-
fer with respect to the university affiliation (university A or B) and the performance in the
mathematics task (above or below median) of their members. This yields four different types
of groups: “good” and “bad” groups in both universities. Within these groups, participants
then interact in a non-incentivized group activity (solving picture riddles). This creates
a social environment with a fixed, known set of group identities. To make identification
2In a recent field experiment, Burstyzn et al. (2016) argue along similar lines in order to identify politicalideology as an intrinsic motivation for political behavior.
3
choices observable, we rely on the notion that joining a group and identifying with it are
closely related. In the next step, we therefore confront participants with the possibility to be
re-assigned to one of the other groups. Using the Becker-DeGroot-Marschak (1964) proce-
dure, we elicit each individual’s willingness to accept re-assignment to each of the alternative
groups and interpret this as revealing a preference for identifying with this particular group.
Importantly, our design even allows us to elicit these differences within-subject : we allow
individuals to express a different willingness to accept reassignment to different alternative
groups. Finally, the high degree of anonymity combined with control over monetary payoffs
allows us to eliminate any potential direct or indirect incentives for group-switching within
or outside the experiment (instrumental values). In the second part of the experiment, each
participant makes a series of distributional choices affecting herself as well as another indi-
vidual. As these choices are made conditional on group-membership of the other player, we
are able to investigate whether revealed identification preferences are related to differences
in discriminatory behavior and thereby assess the behavioral relevance of identification as a
choice.
Our results show the relevance of deliberate self-identification in understanding identity-
related behavior. First, we find that individuals generally display preferences for identifi-
cation, as they are willing to sacrifice a substantial part of their experimental earnings to
identify with specific groups. In particular, the monetary amounts they are willing to forego
depend on the characteristics of the group in question.
Second, we find that revealed identification preferences matter for subsequent behavior.
In particular, they are systematically related to behavioral heterogeneity in group-specific
social preferences as measured by dictator games. Individuals who reveal a stronger prefer-
ence for identifying with their initial group discriminate more strongly between this group
and other groups in allocation choices. We also find individuals discriminating not just
between in- and outgroups but even among different outgroups. Strikingly, even this within-
subject-heterogeneity in allocation choices is paralleled by the within-subject-heterogeneity
in identification preferences: differences in revealed identification preferences correlate with
subsequent allocation choices even up to the behavioral variation towards different out-
groups.
Finally, we take a closer look at the structure of identification preferences. We focus on
two dimensions established within the social psychology literature which have recently also
been applied in the economic literature (e.g., Shayo 2009 and Bernard et al. 2016). First,
4
individuals prefer to identify with groups whose stereotype(s) are more similar to their own
group’s characteristics, a motive referred to as “social distance”. Second, individuals prefer
to identify with groups whose average salient characteristics are superior to those of a com-
parison group, called “social status”. Our experiment is explicitly designed to allow for these
two dimensions to vary across different groups and thus to analyze their role in detail: We
assume that participants perceive a larger social distance to groups of the other university
and perceive groups with a better mathematics performance to have a higher social status.
We find that both these dimensions carry a substantial weight in revealed identification pref-
erences.
Our paper contributes to two strands of literature. First, we provide a novel perspective
on the rapidly growing empirical literature on social identity in economics. This literature
experimentally varies the salient identity an individual perceives while making a decision,
and observes a broad variety of behavioral effects. These encompass strengthened social
preferences towards individuals sharing an identity (Chen and Li 2009), increased stereo-
typical group behavior (Benjamin et al. 2010), and improved cooperation and coordination
through shared group identity (Chen and Chen 2011). These papers induce the required ex-
ogenous variation in group identification via two methods. Studies like the one by Chen and
Li (2009) build on the minimal group paradigm. This means inducing a specific new identity
by forming groups based on an arbitrary assignment mechanism.3 In contrast to the original
minimal group paradigm (Tajfel et al. 1971), however, most studies then strengthen these
identities by subsequent social interaction (for example by chat-supported group activities).4
Studies like Benjamin et al. (2010), rather than inducing new identities, experimentally vary
the salience of pre-existing dimensions of an individual’s identity via priming methods.5 In
both approaches, group identity is varied exogenously. In contrast, our paper analyzes the
identification behavior of individuals, thereby explicitly considering the endogeneity of an
individual’s identity. So far, this aspect has been largely neglected by the experimental
economics literature, despite being explored in the theoretical literature on identification as
an explicit choice (Akerlof and Kranton 2000, Shayo 2009, Bernard et al. 2016, Akerlof 2017).
This analysis is also related to the broader literature on the existence, heterogeneity and sta-
bility of social preferences (Andreoni and Miller 2002, Charness and Rabin 2002, Engelmann
and Strobel 2004, Fisman et al. 2007, Bellemare et al. 2008, Iriberri and Rey-Biel 2011,
3The classical way to do this is to build on preferences for paintings (Tajfel et al. 1971).4Other economic studies using a near minimal group method are, for instance, Ockenfels and Werner
(2014).5Other studies using priming techniques are Cohn et al. (2014, 2015a, 2015b).
5
2013, Breitmoser 2013, Bruhin et al. 2016, and Schumacher et al. 2017). In this regard
our paper advocates the consideration of identification behavior as a potential mechanism
underlying the existence and heterogeneity of social preferences across settings, individuals,
and time.
The papers most closely related to ours are Hargreaves-Heap and Zizzo (2009), Charness et
al. (2014) and Kranton et al. (2017). Hargreaves-Heap and Zizzo (2009) study the “value
of groups” and document substantial “additional psychological benefits of group member-
ship”. Within our framework, this could be interpreted as indicating a general preference for
identification – a result we are able to confirm in our analysis. The focus of our paper will
be to investigate the underlying structure of these identification preferences and its behav-
ioral consequences. Charness et al. (2014) analyze group choice in public-good games while
explicitly considering the multi-dimensionality of identity. The main result is that induced
identities are dominated by endowment levels when it comes to endogenous group choice.
This can be interpreted as individuals trading-off the effects on social identity and material
payoffs when choosing group affiliation. However, in this setup it is not possible to cleanly
isolate revealed preferences for identification as group choice is inherently linked to potential
material and strategic effects. Kranton et al. (2017) share the spirit of our analysis in several
ways. First, exploiting a within-subject design, they also allow for individual heterogeneity
in the strength of identity-related social preferences. Second, they accordingly document
different behavioral effects as a result of different identities. Our paper complements this by
explicitly analyzing the process underlying these different identities, namely identification
decisions of individuals.
The remainder of the paper is structured as follows. Section 2 presents a framework illustrat-
ing how identification takes place and why it should matter for economic decisions. Section 3
provides a detailed description of our experimental design. Results are presented in Section
4. Section 5 provides a discussion of our findings and concludes.
2 How do people identify and why should it matter?
Social groups are a major determinant of a person’s identity. Once an individual perceives
herself as belonging to a certain group, she derives utility from this affiliation both through
the favorable comparison of her own groups (ingroups) with relevant others (outgroups) and
from following her ingroups’ behavioral prescriptions (Tajfel and Turner 1979, Akerlof and
Kranton 2000).
6
However, what an individual perceives as ingroup and outgroup is not simply exogenous.
Rather, it is the result of categorization and, even more importantly, identification. A person
identifies herself by her perceived belonging to any of several group-characterizing categories
(Tajfel and Turner 1979). Tajfel and Turner (1979) highlight that “Individuals must have
internalized their group membership as an aspect of their self-concept: they must be sub-
jectively identified with a relevant ingroup. It is not enough that the others define them as
a group”. Identification with different groups is a choice among different alternative iden-
tities (social categories). From an economic perspective, this raises the question about the
structure of the particular preferences individuals hold over these choices.
Work in social psychology and economics has identified social status and social distance as
two main dimensions which affect utility from social identity (Tajfel and Turner 1979, Turner
et al. 1987, Akerlof and Kranton 2000, Shayo 2009, Bernard et al. 2016). Groups of higher
social status facilitate favorable comparisons to other groups (Tajfel et al. 1971, Tajfel 1972,
1978, and Tajfel and Turner 1979). Thus, status influences social identity from an inter-
group perspective and individuals should seek to identify with groups of high status (Tajfel
1974). Social distance addresses the intra-group perspective of social identity (Turner et
al. 1987). Identifying, i.e. perceiving membership with a given social category, comes more
naturally for an individual if her own actual characteristics match this category’s stereotypes
(Akerlof and Kranton 2000). Hence, individuals should, ceteris paribus, prefer to identify
with groups whose defining characteristics are more similar to their own.6
From an economic perspective, identification should, however, not just be constrained to
more frequent identification with groups of high status and small social distance. It should
also translate into consistent choices when identification with a certain group entails mon-
etary trade-offs. When identification decisions are associated with group-specific monetary
costs, choices should be consistent with maximization of a preference ordering which takes
into account the relative price of utility from social identity and balance this with the cor-
responding monetary opportunity costs. This facilitates the elicitation of underlying identi-
fication preferences.
While identification and its associated monetary value can thus be an economically relevant
entity by itself, its effect might even extend to other behavioral phenomena relevant for eco-
6Social distance is thus also related to the concept of homophily (Currarini and Mengel, 2016), describingthe tendency of network ties in social structures being typically formed according to similarity (McPhersonet al. 2001, Girard et al. 2015).
7
nomic outcomes. A particular manifestation of the pursuit to create a favorable comparison
between groups is discrimination against outgroups, which has been demonstrated persis-
tently in psychological as well as economic studies (e.g., Tajfel and Turner 1986, Chen and
Li 2009). It is thus a natural conjecture that the extent to which people engage in outgroup
discrimination depends on the strength by which they identify with their particular ingroup
and should therefore care for creating such a favorable comparison.
To illustrate this, consider the framework proposed by Charness and Rabin (2002) and ex-
tended by Chen and Li (2009):
πA and πB represent monetary payoffs of players A and B. According to the following utility
function, wA measures the weight by which player A’s payoff enters player B’s utility function:
uB(πA, πB) = wAπA + (1− wA)πB.
Social identity enters via a conditionality on the weight wA
wIA = (1 + Ia)wA
where I equals 1 if player A shares the same identity as player B. Thus, the effect of player
A’s payoff on player B’s utility can differ (being scaled up by a) depending on whether play-
ers share or not share a common identity.
Chen and Li (2009) experimentally vary whether I is 0 or 1 using minimal group procedures.
They document substantial effects of social identity on social preferences. Building on this
framework, our conjecture is that variation in the revealed strength of identification with
particular groups should explain variation in the strength by which these groups shape social
preferences. Formally, this can be interpreted as individuals explicitly choosing I by their
identification choices. Subsequently, they should act accordingly when it comes to allocation
decisions. The more strongly that individuals identify with a particular group, the larger
the impact on their subsequent group-specific behavior. In fact, previous experiments have
found that some behavioral effects of social identity become stronger or can only be observed
if induced identities are particularly strong. For instance, in Chen and Chen (2011), identity-
dependent behavior only occurs when subjects had extensive social interaction, but not in a
pure minimal group treatment. Goette et al. (2012) show that altruistic norm enforcement
only appears within “real” groups, but not in minimal groups.
8
3 Research Design
Answering our research question requires measuring both preferences for identification and
their behavioral consequences. Whereas discrimination in dictator games across varying
recipients is routinely used to measure the latter (Chen and Li 2009), there exists no es-
tablished procedure to measure identification preferences. Observing group identification is
not straightforward: Identification itself is an inherently cognitive process and therefore not
readily observable. While certain observable actions are commonly interpreted as proxies
for identification (e.g. joining and interacting with particular groups), the social and eco-
nomic structure of the natural settings in which such social interaction takes place gives
rise to alternative motivations, including reputational concerns, sequential or repeated game
dynamics, or instrumental values associated with membership in particular groups.
Another major concern regards the multi-dimensionality of an individual’s social iden-
tity: given the multitude of different social categories potentially available to an individual,
a researcher cannot credibly assess what the perceived alternatives are among which an in-
dividual chooses in a given situation. We design a novel laboratory experiment tailored to
address these challenges.
3.1 Measuring Identification preferences
Our experiment allows individual choices to reflect the non-monetary utility an individual
derives from identification. These choices should thereby reveal identification preferences in
an incentive-compatible way. Our approach first categorizes participants into several dif-
ferent groups. Subsequently, they face the possibility of reassignment to any of the other
groups. Using the Becker-DeGroot-Marschak (1964) value-elicitation procedure (BDM), we
then elicit each individual’s monetary payment required to accept this re-assignment for
any particular group. These monetary payments then imply the corresponding structure of
identification preferences.
As has been repeatedly shown by psychological and economic studies employing the “minimal-
group”-paradigm, laboratory environments create a social environment in which the avail-
able set of identities is tightly controlled (Tajfel et al. 1971, Chen and Li 2009). This
facilitates the interpretation of revealed identification preferences as it eliminates ambiguity
regarding how individuals actually perceive different groups. In the standard framework,
the respective group characteristics are intendedly arbitrary, typically reflecting preferences
for different painters (Tajfel et al. 1971). However, measuring meaningful identification
preferences requires exposing participants to a richer and more meaningful set of alternative
9
groups to identify with. To provide such a setting, we apply two different group assignment
rules, which are particularly designed to capture social distance as well as social status. As
a result, each group carries not just one but two different characteristics. This allows us to
observe differences in identification not only between one’s own ingroup and outgroup, but
also across different outgroups with different characteristics.
Importantly, the laboratory environment permits us to explicitly control the monetary ben-
efits and instrumental values associated with the different groups in our experiment. To
that end, monetary incentives are muted in all stages unrelated to the elicitation of prefer-
ences for identification and identity-contingent discrimination. We thereby avoid that these
decisions are affected by income effects arising from prior stages, feelings of generalized reci-
procity due to group performance-related payoffs (Yamagishi and Kiyonari 2000) or strategic
considerations for upcoming stages.
3.2 Experimental Design
The experiment consists of five stages. Groups are assigned and characteristics are formed
and enhanced in the first two stages. In the third and fourth stages, we measure identification
preferences and group-specific dictator game behavior respectively. The fifth and final stage
merely increases the psychological relevance of identification. Figure 1 shows the timing of
the experiment as well as the information provided to the participants at the beginning of
each stage.7
Stage 1: Group assignment and identity formation
We conduct the experiment simultaneously at two universities. Participants’ affiliation with
one of two different public universities serves as a first assignment rule to different groups.
Within the groups of participants of each university, we add a second group dimension by
sorting participants according to their performance in a real-effort task. Following Bartling
et al. (2009), participants are asked to solve as many arithmetic problems (adding three
two-digit numbers) as possible in 90 seconds. Participants whose performance exceeds the
median number of correctly solved math problems of that session at their university are
assigned to the blue group of their university, while those with an inferior score are assigned
to the red group of their university.
Conditional on their performance in the math task and their affiliation with the two uni-
7The instructions are provided in Appendix Appendix C.
10
versities, we then assign participants to non-overlapping groups of four: (i) a group of high
performance (blue) from university A, (ii) a group of high performance (blue) from university
B, (iii) a group of low performance (red) from university A, and (iv) a group of low perfor-
mance (red) from university B. Using university affiliation and performance in a real effort
task for group assignment provides scope for social distance as well as social status to affect
the individuals’ identification in both dimensions.8 To emphasize the status-component of
the real effort task even further, participants’ screens display a winner’s podium with the
blue group on top and the red group standing next to it. The corresponding message says
that participants assigned to the blue group belonged to the top half of the students in that
session at their university. Accordingly, participants in the red group are informed that their
performance is in the bottom half within their university.
We inform participants about the group assignment and the content of the following stage
only after the completion of the real-effort task. Thus, when completing the task partici-
pants have no information about its purpose. This ensures strategic considerations based
on the ensuing task do not factor into the effort decision and thereby not actively influence
group assignment. The performance in the math-task is not incentivized to rule out that
the elicitation of preferences for identification is affected by prior earnings.
Stage 2: Group enhancement
Recent evidence shows that studying identity successfully in the laboratory may often require
enhancement through some joint activity (e.g. Eckel and Grossman 2005, Chen and Li 2009,
Chen and Chen 2011, Guala et al. 2013). We therefore engage participants in a group-quiz.
The quiz consists of three quartets of pictures. For each of these three sets of four pictures,
groups have to find an umbrella term and have 60 seconds to discuss the solution via the
chat program.9 Participants then enter their answers individually.10 Even though we do not
incentivize correct answers and do not provide feedback about the solutions to preclude that
performance in the group task affects identification, all participants actively engaged in all
of their group’s problems and entered at least one line per quiz.
8Note that the overwhelming majority of participants perceive the reputation of the two universities tobe about equal. This suggests that there is no status difference between universities. We elaborate more onthat in the robustness checks.
9Participants are prohibited to discuss personal information during the chat phase and are informed thatviolation of this rule would result in expulsion from the experiment. Aside from this constraint, conversationsare unrestricted. Chat-logs reveal that there was no communication about personal information. Sinceparticipants had no information about subsequent stages at the time of the group chats, they were alsounable to discuss their choices in the following tasks in advance.
10Although participants are not bound by the prior group discussions, the chat-log reveals that almost allparticipants entered the group consensus in the chat.
11
Stage 3: Elicitation of Revealed Identification Preferences
In a first step, each of the four groups is attached a random monetary value πd,s, d ∈{University A, University B}, s ∈ {high performance, low performance}, drawn from a uni-
form distribution in the interval [200, 800], but not yet revealed to the participants.11 Im-
portantly, to elicit clean identification preferences, group membership must not entail any
other potential strategic benefits. The monetary group values are therefore independent of
the groups’ prior performance in the math task and group-quiz, so that different monetary
values cannot give rise to feelings of guilt, spite, or reciprocity towards other group members.
Based on these group values, we request participants to state the minimum difference in the
payoff of their own group and any other group, i.e. WTAk, k ∈ {(d,−s), (−d, s), (−d,−s)},they demand to accept a reassignment to the respective group for the remainder of the ex-
periment.12 A purely money-oriented individual would be willing to accept re-assignment to
any other group if the group’s monetary value exceeds the one of her own group, given the
information that the ensuing task in the new group does not yield any monetary benefits.
The stated minimum difference for such an individual should thus be zero. We interpret
any deviation in the stated WTAk as a revealed preference for identification as there are no
other potential motives by design.13
Out of the four groups, one participant is randomly selected for actual re-assignment to a
random group. She is reassigned to that group k only if the stated WTAk is equal to or
below the actual difference in monetary values between the respective groups.14 Importantly,
by restricting the number of participants who can be reassigned to one, the choice of the
WTAs does not depend on participants’ beliefs about the behavior of the other participants,
because participants are assured that the characteristics and composition of the other groups
do not change apart from their own potential entry. Similarly, since the stated WTAs are
not communicated to the other group members who are only informed if anybody left or
11Throughout the paper, index d (s) refers to groups of the same university (performance), whereas −d(−s) refers to groups of the other university (performance) from the perspective of the respective participant.
12As an illustration, an individual who states a positive WTAk, would accept re-assignment to that grouponly if the payoffs of group k exceed the payoffs of her own group at least by the stated amount, i.e. ifπk−πd,s > WTAk. If the difference in payoffs between the two groups would fall, however, below that level,she would prefer to remain with her initial group, even if the payoffs of the other group are larger.
13Becker et al. (1964) show that this mechanism is incentive-compatible. There has been a recent debateon the reliability of the BDM mechanism for the measurement of WTP-WTA gaps to identify reference-dependence (Cason and Plott 2014, Bartling et al. 2015). However, given that our main results focus ondifferences between different WTAs, our approach appears robust towards these concerns.
14For example, if the group of the same university, but different status was selected for re-assignment, theparticipant would only be re-assigned if πd,−s − πd,s > WTAd,−s holds.
12
entered the own group, we can rule out that WTAs are inflated by the motivation to enhance
the others’ group identity or diminished by anticipatory regret, if others learn about the own
identification.
Stage 4: Two-Person Dictator Games
Before revealing the outcome of the random draws from the third stage, i.e. the realizations
of the attached monetary group values and whether they are re-assigned to another group,
we ask every participant to make a series of decisions in four two-person dictator games
selected from Bartling et al. (2009) to elicit group-specific social preferences (see Appendix
C.II.). Just as in the group selection stage, we use the strategy-method to collect decisions
for all groups. Every individual has to choose an allocation between herself and another
member of each of the three other groups as well as between herself and a member of her
own group. For each participant, one game, one role (dictator or receiver), and one partner
is randomly selected for payment at the end of the experiment. Importantly, members are
matched based on the initial group assignment. This means that by switching groups in
stage 3, a participant cannot affect the monetary payoff resulting from stage 4.
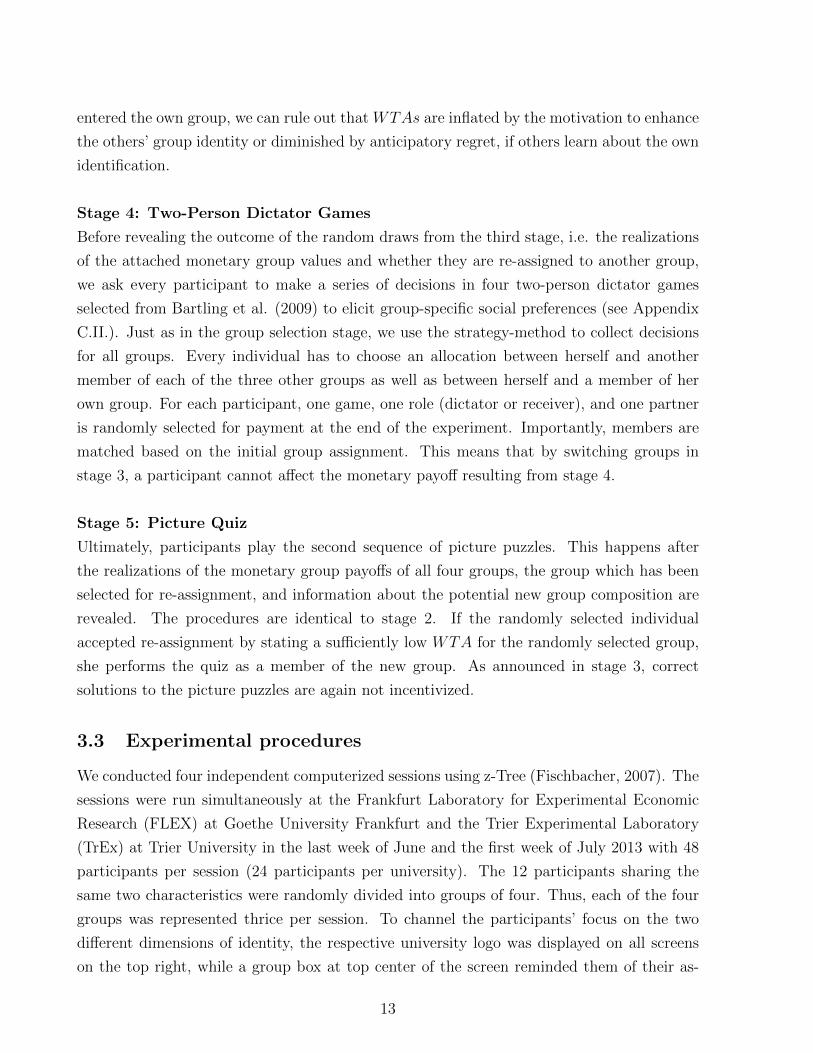
Stage 5: Picture Quiz
Ultimately, participants play the second sequence of picture puzzles. This happens after
the realizations of the monetary group payoffs of all four groups, the group which has been
selected for re-assignment, and information about the potential new group composition are
revealed. The procedures are identical to stage 2. If the randomly selected individual
accepted re-assignment by stating a sufficiently low WTA for the randomly selected group,
she performs the quiz as a member of the new group. As announced in stage 3, correct
solutions to the picture puzzles are again not incentivized.
3.3 Experimental procedures
We conducted four independent computerized sessions using z-Tree (Fischbacher, 2007). The
sessions were run simultaneously at the Frankfurt Laboratory for Experimental Economic
Research (FLEX) at Goethe University Frankfurt and the Trier Experimental Laboratory
(TrEx) at Trier University in the last week of June and the first week of July 2013 with 48
participants per session (24 participants per university). The 12 participants sharing the
same two characteristics were randomly divided into groups of four. Thus, each of the four
groups was represented thrice per session. To channel the participants’ focus on the two
different dimensions of identity, the respective university logo was displayed on all screens
on the top right, while a group box at top center of the screen reminded them of their as-
13
signment to either the blue or red group. The logo and the group box were removed on the
group selection screen. As an additional means to make one’s group identity more salient,
the ensuing instructions were printed on colored paper matching the participant’s respective
group assignment.
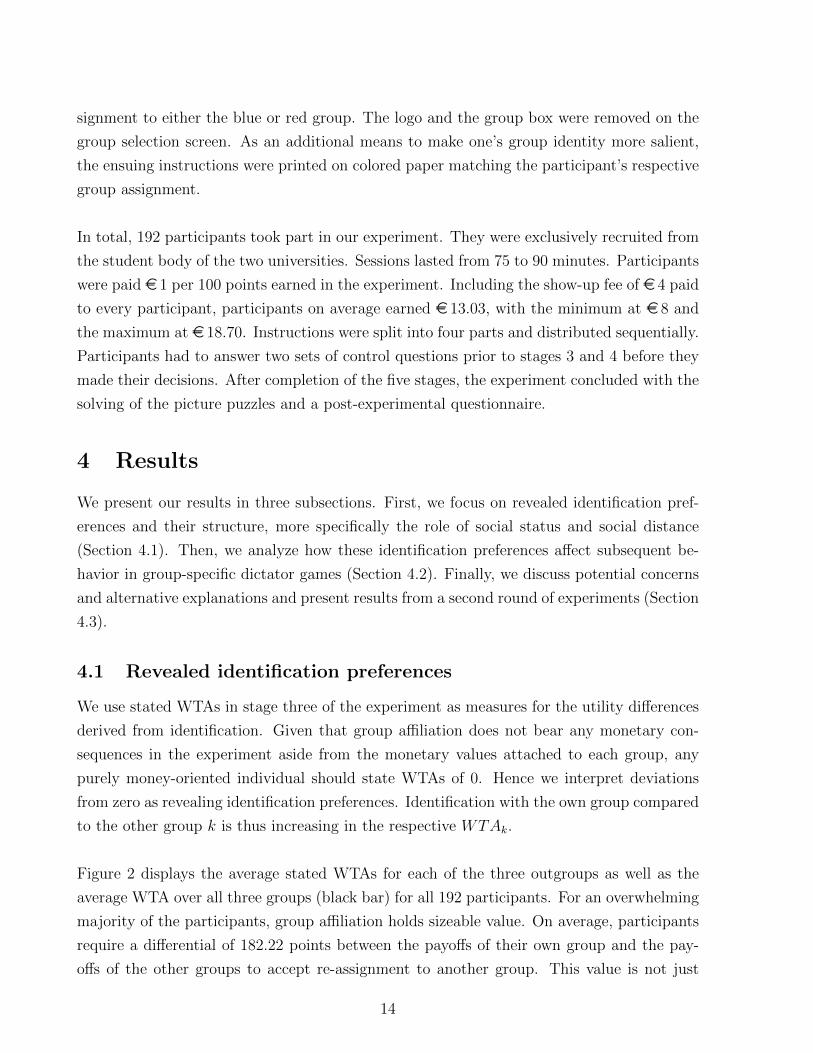
In total, 192 participants took part in our experiment. They were exclusively recruited from
the student body of the two universities. Sessions lasted from 75 to 90 minutes. Participants
were paid e 1 per 100 points earned in the experiment. Including the show-up fee of e 4 paid
to every participant, participants on average earned e 13.03, with the minimum at e 8 and
the maximum at e 18.70. Instructions were split into four parts and distributed sequentially.
Participants had to answer two sets of control questions prior to stages 3 and 4 before they
made their decisions. After completion of the five stages, the experiment concluded with the
solving of the picture puzzles and a post-experimental questionnaire.
4 Results
We present our results in three subsections. First, we focus on revealed identification pref-
erences and their structure, more specifically the role of social status and social distance
(Section 4.1). Then, we analyze how these identification preferences affect subsequent be-
havior in group-specific dictator games (Section 4.2). Finally, we discuss potential concerns
and alternative explanations and present results from a second round of experiments (Section
4.3).
4.1 Revealed identification preferences
We use stated WTAs in stage three of the experiment as measures for the utility differences
derived from identification. Given that group affiliation does not bear any monetary con-
sequences in the experiment aside from the monetary values attached to each group, any
purely money-oriented individual should state WTAs of 0. Hence we interpret deviations
from zero as revealing identification preferences. Identification with the own group compared
to the other group k is thus increasing in the respective WTAk.
Figure 2 displays the average stated WTAs for each of the three outgroups as well as the
average WTA over all three groups (black bar) for all 192 participants. For an overwhelming
majority of the participants, group affiliation holds sizeable value. On average, participants
require a differential of 182.22 points between the payoffs of their own group and the pay-
offs of the other groups to accept re-assignment to another group. This value is not just
14
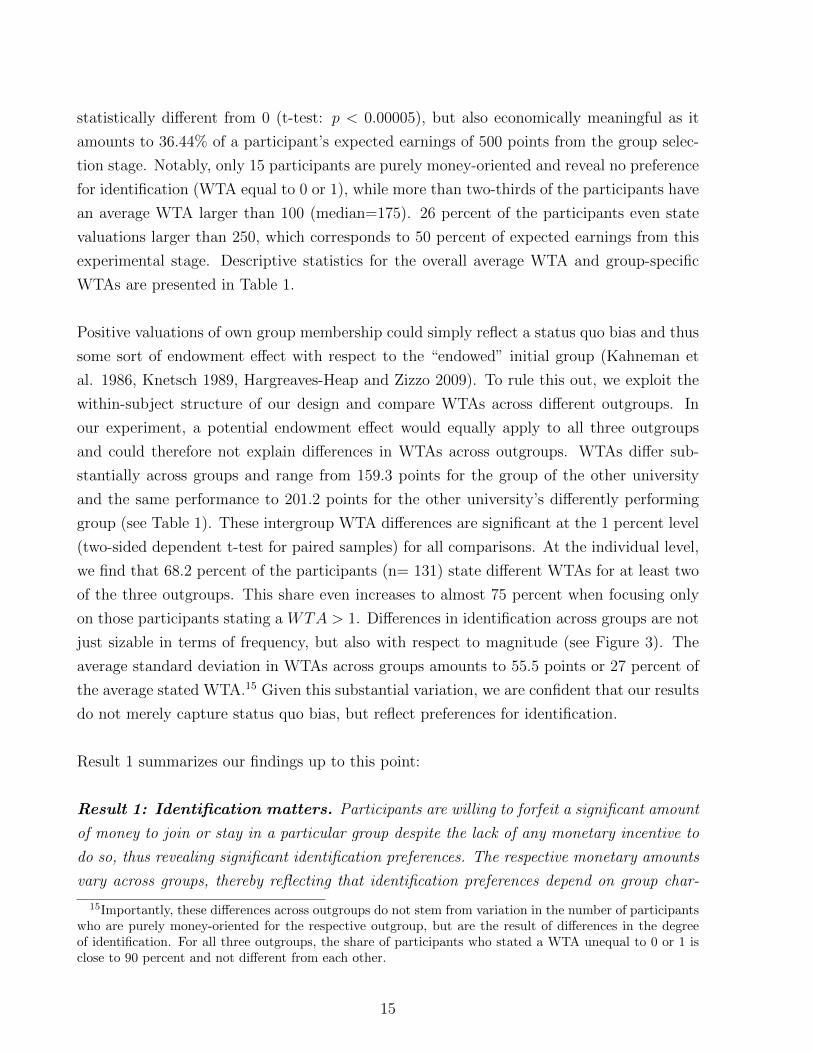
statistically different from 0 (t-test: p < 0.00005), but also economically meaningful as it
amounts to 36.44% of a participant’s expected earnings of 500 points from the group selec-
tion stage. Notably, only 15 participants are purely money-oriented and reveal no preference
for identification (WTA equal to 0 or 1), while more than two-thirds of the participants have
an average WTA larger than 100 (median=175). 26 percent of the participants even state
valuations larger than 250, which corresponds to 50 percent of expected earnings from this
experimental stage. Descriptive statistics for the overall average WTA and group-specific
WTAs are presented in Table 1.
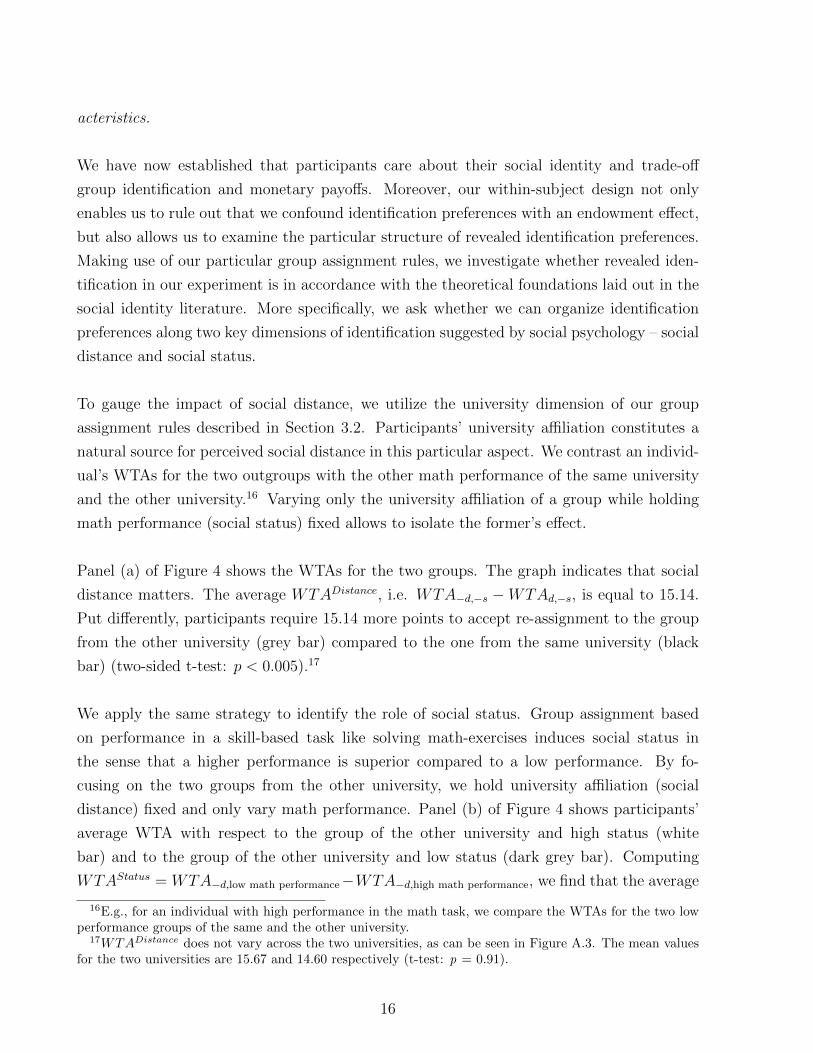
Positive valuations of own group membership could simply reflect a status quo bias and thus
some sort of endowment effect with respect to the “endowed” initial group (Kahneman et
al. 1986, Knetsch 1989, Hargreaves-Heap and Zizzo 2009). To rule this out, we exploit the
within-subject structure of our design and compare WTAs across different outgroups. In
our experiment, a potential endowment effect would equally apply to all three outgroups
and could therefore not explain differences in WTAs across outgroups. WTAs differ sub-
stantially across groups and range from 159.3 points for the group of the other university
and the same performance to 201.2 points for the other university’s differently performing
group (see Table 1). These intergroup WTA differences are significant at the 1 percent level
(two-sided dependent t-test for paired samples) for all comparisons. At the individual level,
we find that 68.2 percent of the participants (n= 131) state different WTAs for at least two
of the three outgroups. This share even increases to almost 75 percent when focusing only
on those participants stating a WTA > 1. Differences in identification across groups are not
just sizable in terms of frequency, but also with respect to magnitude (see Figure 3). The
average standard deviation in WTAs across groups amounts to 55.5 points or 27 percent of
the average stated WTA.15 Given this substantial variation, we are confident that our results
do not merely capture status quo bias, but reflect preferences for identification.
Result 1 summarizes our findings up to this point:
Result 1: Identification matters. Participants are willing to forfeit a significant amount
of money to join or stay in a particular group despite the lack of any monetary incentive to
do so, thus revealing significant identification preferences. The respective monetary amounts
vary across groups, thereby reflecting that identification preferences depend on group char-
15Importantly, these differences across outgroups do not stem from variation in the number of participantswho are purely money-oriented for the respective outgroup, but are the result of differences in the degreeof identification. For all three outgroups, the share of participants who stated a WTA unequal to 0 or 1 isclose to 90 percent and not different from each other.
15
acteristics.
We have now established that participants care about their social identity and trade-off
group identification and monetary payoffs. Moreover, our within-subject design not only
enables us to rule out that we confound identification preferences with an endowment effect,
but also allows us to examine the particular structure of revealed identification preferences.
Making use of our particular group assignment rules, we investigate whether revealed iden-
tification in our experiment is in accordance with the theoretical foundations laid out in the
social identity literature. More specifically, we ask whether we can organize identification
preferences along two key dimensions of identification suggested by social psychology – social
distance and social status.
To gauge the impact of social distance, we utilize the university dimension of our group
assignment rules described in Section 3.2. Participants’ university affiliation constitutes a
natural source for perceived social distance in this particular aspect. We contrast an individ-
ual’s WTAs for the two outgroups with the other math performance of the same university
and the other university.16 Varying only the university affiliation of a group while holding
math performance (social status) fixed allows to isolate the former’s effect.
Panel (a) of Figure 4 shows the WTAs for the two groups. The graph indicates that social
distance matters. The average WTADistance, i.e. WTA−d,−s −WTAd,−s, is equal to 15.14.
Put differently, participants require 15.14 more points to accept re-assignment to the group
from the other university (grey bar) compared to the one from the same university (black
bar) (two-sided t-test: p < 0.005).17
We apply the same strategy to identify the role of social status. Group assignment based
on performance in a skill-based task like solving math-exercises induces social status in
the sense that a higher performance is superior compared to a low performance. By fo-
cusing on the two groups from the other university, we hold university affiliation (social
distance) fixed and only vary math performance. Panel (b) of Figure 4 shows participants’
average WTA with respect to the group of the other university and high status (white
bar) and to the group of the other university and low status (dark grey bar). Computing
WTAStatus = WTA−d,low math performance−WTA−d,high math performance, we find that the average
16E.g., for an individual with high performance in the math task, we compare the WTAs for the two lowperformance groups of the same and the other university.
17WTADistance does not vary across the two universities, as can be seen in Figure A.3. The mean valuesfor the two universities are 15.67 and 14.60 respectively (t-test: p = 0.91).
16
difference between these two groups amounts to 48.2 points and is both economically (almost
10% of the expected payoff from that experimental stage) and statistically (p < 0.00005 in
a two-sided t-test) highly significant.
Result 2: Social distance and social status matter. Participants prefer to identify
with groups (a) to which they have a lower social distance and (b) that have a higher social
status.
Notably, individuals differ markedly in their valuation of social status contingent on their
own performance. Whereas the average WTAStatus exceeds 90 points for members of the
high performance groups, it is only 6.3 points for those in the low performance groups (see
Figure A.3). This asymmetry in the importance of social status is in line with theoretical
arguments raised by Wichardt (2008) and Akerlof (2017). Wichardt (2008) suggests that
when confronted with multiple dimensions of group characteristics, an individual’s focus
on a particular group increases in its positive contribution to their identity in a certain
context. Similarly, Akerlof (2017) argues that individuals manage identity by reweighting
“achievements” in different dimensions. We provide a more detailed account on this and on
heterogeneity in social distance and social status in Appendix A.I.
4.2 Behavioral effects of identification
We now investigate the relation between identification and subsequent behavior and test
whether the observed variation in identification preferences translates into heterogeneity in
group-specific social preferences measured in the dictator games in stage 4 of our experiment.
4.2.1 Preferences for identification and allocation choices: Ingroup vs out-
groups
We start by comparing discrimination in allocation choices between a member of one’s own
group and a member of the three different outgroups. In a first step, we define outgroup
discrimination as choosing a less favorable allocation for a matching partner from one of
the three outgroups compared to the one from the ingroup in at least one of the dictator
games. According to this definition, 80 participants discriminate in their allocation decisions.
The share of individuals discriminating against outgroups is substantially higher for partic-
ipants with a high average WTA. Whereas 49.0 percent of the participants whose average
WTA is above the median discriminate against outgroups, the corresponding share is only
17
34.4 percent for participants with a WTA average below the median (see also Figure A.1).
This difference is statistically significant (Pearson-χ2-test: p = 0.04).
This result is also confirmed by regression analyses. Columns (1) and (2) of Table 2 present
average marginal effects for logistic regressions of outgroup discrimination in allocation
choices on preferences for identification and a set of socio-demographic controls. The de-
pendent variable is a dummy variable that takes the value of 1 if a participant discriminates
against outgroups in the allocation decisions and is zero otherwise. We control for a par-
ticipant’s age, gender, and the enrollment status (using a dummy variable that is equal to
1 if the participant is enrolled in a bachelor program, and 0 otherwise). Standard errors
are clustered at the group level and reported in parentheses. In column 1, identification is
measured using a median split of average WTA. Closely mirroring the raw difference, indi-
viduals whose average WTA is above the median level are 16 percentage points more likely
to discriminate against at least one outgroup. The marginal effect is statistically significant
at the 5%-level. In column (2), we employ the average stated WTA in units of 100 over
all three alternative groups as a more detailed, intensive margin measure of the degree of
identification. Again, we find that the numerical impact is quite large. The probability of
discrimination against at least one outgroup in the allocation games rises by 7.2 percentage
points for every 100 point increase in the average WTA. This estimate is also statistically
significant at the 5%-level.
This relation holds not only at the aggregate level but also for specific outgroups. Table 3
presents results of a logistic regression considering discrimination against a particular out-
group k in the four dictator games and uses the corresponding WTAk as the explanatory
variable. Once again, we find that our measure of identification is highly significant in our
estimations. Column (1) reveals that the probability to discriminate against a particular
outgroup in the allocation decisions increases by 5.3 percentage points for every 100-points
increase in the stated WTA with respect to this outgroup. As a test for the importance
of identification in comparison to outgroup characteristics, we add two dummy variables in
columns (2) and (3). Outgroup – other uni indicates whether an outgroup stems from the
other university, while Outgroup – low performance takes on the value of 1 for outgroups
of below median performance in the math task. The numerical impact of identification
preferences on outgroup-specific social preferences remains unchanged once we control for
outgroup characteristics in column (2) and participants’ socio-demographic information in
column (3). Our results reveal that an individual’s decision to discriminate in these alloca-
tion choices is driven by her level of identification and not (necessarily) by the exogenous
18
group characteristics. Whereas the coefficients of both characteristics are insignificant, our
measure of identification remains a significant predictor of discrimination in the dictator
games. This highlights the relevance of endogenous identification as a relevant source of
variation in individuals’ social identity.
Result 3: Identification explains ingroup-outgroup discrimination. Individuals
who identify more strongly with their initial group (who have a high average WTA) are more
likely to discriminate against outgroups in allocation choices. A given participant is more
likely to discriminate against a particular outgroup the lesser she identifies with this partic-
ular group (the higher her WTA towards this outgroup).
4.2.2 Preferences for identification and allocation choices: Between outgroups
Result 3 already provides strong support for our hypothesis that the degree of identification
is related to heterogeneity in outgroup discrimination. However, our design allows for an
even stronger test of the link between identification preferences and group-specific discrim-
ination in allocation choices. Looking at discrimination between outgroups, we analyze if
differences in the allocation choices parallel participants’ differences in the revealed prefer-
ences for identification with these outgroups. Thus, we not only test if participants consider
the characteristics of the respective outgroups in both decision domains, but also if they do
so consistently.
Looking at the share of participants who discriminate in allocation choices between the
three outgroups (see Figure A.1), we find that this share is significantly higher for individ-
uals who also display differences in their identification with the three groups. Out of these
131 participants, 49.6 percent allocate different amounts of money across the outgroups in
at least one game (i.e. they discriminate in the same direction), while only 6.56 percent of
the 61 individuals who state equal WTAs for the three outgroups do so. This difference is
highly statistically significant (p < 0.001) and virtually unaffected once we control for socio-
demographic factors in a regression. The estimated average marginal effect of identification
is 43 percentage points (column (3) of Table 2).
Turning again from the aggregate to the within-subjects level, we next consider pairwise
comparisons of two outgroups each, yielding three observations per individual in total.18
18For each participant, we compare (1) the two outgroups from the other university, (2) the outgroup fromthe own university and the outgroup of the same color but other university, and (3) the outgroup from the
19

Columns (4) and (5) of Table 3 present average marginal effects of logistic regressions, using
the difference in WTAs between the respective outgroups as the explanatory variable. The
dependent variable is equal to 1 for each pair of outgroups if a participant chooses a less fa-
vorable allocation for the member of the outgroup she is identifying less strongly with and 0
otherwise. Mirroring our previous results, differences in identification are once again related
to discrimination in allocation decisions. The marginal effect of Identification in column (4)
reveals that a 100 points higher WTA difference between two outgroups increases the prob-
ability of allocation discrimination between the two groups by 8.9 percentage points. This
estimate is unaffected when we control for socio-demographic information in column (5).
Heterogeneity with respect to identification thus translates into heterogeneity with respect
to allocation choices regarding different outgroups.
Result 4: Identification explains outgroup-outgroup discrimination. Individuals
whose identification differs among outgroups are more likely to also differ in their alloca-
tion decisions between outgroups. Differences in identification between a particular pair of
outgroups explain differences in the likelihood to discriminate between these outgroups at the
within-subject level.
4.3 Discussion and replication study
The results presented thus far are in line with the conjecture that both social distance and
social status shape identification preferences and that heterogeneity in these preferences are
related to behavior induced by the underlying social identity. We have demonstrated that
(i) group identification matters, as participants are willing to forego a significant amount
of money in order to remain a member of a particular group, that (ii) the structure of the
participants’ revealed identification preferences can be organized along social distance and
social status, two key identity dimensions proposed by social identity theory, and that (iii)
lower degrees of identification with a certain group translate into less preferential treatment.
Although the presented results are strong and consistent, we now discuss alternative ex-
planations and interpretations. First, we break down the data in more detail and uncover
heterogeneity in the behavior of our participants which is clouded in the aggregated results.
Second, we report results from a replication study with 128 participants in which we refined
the original design to test for the robustness of our findings. Table 5 provides an overview of
own university and the outgroup of the other color and other university.
20
the key features and differences of the two experiments. The instructions and a full discus-
sion of all the results in more detail are presented in Appendix B. In short, all of our main
findings are confirmed in the replication study.
Role and Interpretation of Social Distance
Although WTADistance is statistically highly significant and clearly confirms the hypothesized
role of social distance for identification, it appears to be comparatively small in economic
terms. A more detailed analysis reveals that heterogeneity in the individuals’ responses to
social distance conceals its strength in the previous aggregate analysis. Panel (a) of Fig-
ure A.2 displays the average difference in WTAs (bars) and the share of participants who
distinguish between outgroups (diamonds). The difference of 15 points (black bar) between
the group of the same university and different performance and the corresponding one of
the other university amounts to slightly more than 3 percent of the expected earnings in
this stage. Once we restrict our analysis on those 76 individuals who actually discriminate
between the two groups, the difference in WTAs becomes much more pronounced and is
also economically highly significant. 51 individuals identify more strongly with their own
university, requesting 91.47 points (18.3 percent of expected earnings) more to accept re-
assignment to the group of the other university (grey bar). 25 participants on the other
hand state a higher WTA for the group from their own university compared to the group of
the other university (white bar). Their average difference amounts to 70.4 points (or 14.1
percent of expected earnings).
To provide another test for the role and significance of social distance in shaping identi-
fication preferences, we chose an emotionally more charged characteristic than university
affiliation to induce differences in social distance in our replication study. Unlike in the US,
where university affiliation is commonly a source of pride, the emotional attachment is much
lower in the German system. One likely reason is the fact that college sports and intercolle-
giate competition, which fuels rivalries across schools, is nearly non-existent in Germany. We
therefore conducted the replication study with supporters of two different professional soccer
teams. To dampen the potential for differences in social status within the social distance
dimension, we chose two clubs which resemble each other quite closely in their historical
achievements: Eintracht Frankfurt and 1. FC Koln. Both teams share a long history in Ger-
man professional soccer. Both were founding members of the German Bundesliga, played
around 1550 Bundesliga matches, and are ranked 9th and 10th in the all-time table. Each of
them won the German cup (DFB-Pokal) four times. Koln was relegated to the 2nd division
(and afterwards promoted again to the Bundesliga) five times, Frankfurt four times.
21
Enhancing the relevance of social distance propels identification along this dimension. Com-
paring the WTAs of the two outgroups who differ only in the affiliation with the soccer
clubs but share the same performance in the math task, the WTA difference amounts to 36.7
points. This is not only statistically significant (t-test: p = 0.0338), but also substantially
closer to identification in the social status dimension (71.2 points) than what we observed
in the main study (15.14 vs. 48.2 points). The fact that we observe significant identification
preferences with respect to social distance in two separate experimental studies and different
characteristics (university as well as soccer club affiliation) supports the claim that social
distance plays a significant role in shaping identification preferences. Further, the relative
effect size across the two experiments is also in line with the relative strength of the induced
social distance.
Interpreting WTAs as revealed identification preferences
A key feature of our design is its ability to interpret stated WTAs as reflecting pure iden-
tification preferences. This ability hinges upon stripping away the consequences of group
re-assignment of any potential alternative motive other than identity. For this reason, we
made the last round of the experiment – the second chat phase which is potentially carried
out in the new group – anonymous and non-incentivized and explicitly informed participants
about this. Despite this design feature, one might argue that the second chat phase could
still induce motives for group-reassignment other than identity. We tackle this alternative
explanation by re-running our analysis for the subset of 121 participants who stated in the
post-experimental questionnaire that the second chat phase had no or only low relevance. For
these participants, average WTA is 159.7 points (s.e.: 122.07), i.e. still more than 32 % of the
expected earnings from that stage, and highly significantly different from 0 (p < 0.00005).
The same holds for WTADistance and WTAStatus with values of 10.1 points (s.e.: 5.27, p =
0.058) and 41.2 points (s.e.: 10.5, p =0.0001) respectively.
Elicitation procedure
Irrespective of the sizable variation in the participants’ stated WTAs across groups (see
Figure 3), one might argue that our measures of group identification might be inflated by
the chosen elicitation procedure. One indicator is the small number of observed zeros, i.e.
the low share of individuals who are purely money-oriented and do not care about group
affiliation (< 8%). In the replication study, we therefore asked individuals to set their WTA
for each group on a scrollbar ranging from -8 Euro to +8 Euro instead of entering a value
in a text box. The rationale for this was twofold: on the one hand, this highlighted the pos-
22
sibility that stating a negative WTA (i.e. expressing to prefer another group to the initial
one even if this other group earns less money) was viable. On the other hand, it allowed us
to specify a default, which we set at 0 so that individuals did not feel compelled to add a
positive number as might have been the case with the text boxes. Another concern might be
that participants did not understand that they maximize earnings by stating WTAs of zero
even though it was clearly stated in the instructions. To rule this out we added a mandatory
control question which asked for the optimal strategy of a purely payoff-oriented individual.
Indeed, we find that the share of individuals who do not reveal any preference over the dif-
ferent groups increases significantly under these new conditions. 26.6 % of the participants
state WTAs of ‘0’ for all three groups. However, the level of the average WTA remains re-
markably high (see Figure 5). Using the absolute value for the eight participants who state a
negative WTA for at least one group, the average WTA in the replication study amounts to
236.2 points and is significantly different from 0 (t-test: p < 0.0001).19 Thus, our replication
study provides even stronger evidence for heterogeneity of identification preferences.
Limited Action Space for Discrimination Decisions
Lastly, we also probed the association between preferences for identification and discrim-
ination in the allocation games by extending the action space in the latter. The set of
games used in the main study limited participants’ actions to binary decisions and might
thus cloud heterogeneity in discrimination behavior for those participants who would like to
discriminate at an intermediate level between the two binary options. To account for this,
we replaced the four binary dictator games with a single continuous dictator decision.
This design change not just introduces heterogeneity in the allocation decisions at the in-
tensive margin, but also leads to more discrimination at the extensive margin. Whereas in
the main study, only 34.0% of the participants discriminated against an outgroup in at least
one of the four binary dictator games, this share rises to 50.8% with the continuous dictator
game. Even more importantly, discrimination between outgroups by a given individual rises
significantly from 21.4% to 46.9%. This within-subject variation allows us to include par-
ticipant fixed effects in our regression analyses, which absorb any unobserved heterogeneity
that might drive allocation decisions (see Table 4).20 Regressing the amount sent to the re-
19While the absolute value of average WTA in the replication is higher than in our main experiment, it hasto be noted that the range of potential WTAs also increased from 600 to 800. Normalizing average statedWTAs, we find that average WTAs are 30.4% of the maximum permissible WTA in our main experimentand 29.5% in the replication.
20In the main experiment, using fixed effects leads to a substantial reduction of the sample as there is asignificant number of individuals who do not discriminate between outgroups due to the binary nature of
23
ceiver of group k in the dictator game on the stated WTA for that group, we find all of our
previous results confirmed.21 The amount sent reduces significantly with the stated WTA,
i.e. lower degrees of identification are associated with lower dictator giving. This result is
independent of whether we control for outgroup characteristics (i.e. other football club and
low performance) or not. Similarly, when we focus again on differences in allocations to
different outgroups (columns (3) and (4)), discrimination across groups increases with the
corresponding variation in stated WTAs, i.e. the degree of identification with the respective
groups.
5 Conclusion
This paper investigates identification as a choice and its role in shaping individual behavior.
We analyze if and how individuals want to identify with different groups using a revealed
preference approach. We then test whether these revealed preferences for identification are
related to behavior in the domain of social preferences as measured by allocation decisions
in group-specific dictator games.
We find that individuals display economically meaningful and substantially heterogeneous
preferences for identification and are willing to forego significant monetary payments in or-
der to choose their social identity. In line with the predictions of social identity theory, we
find that participants prefer more strongly identifying with groups that have a higher social
status and to which they have a smaller social distance.
Further, we find that identification affects behavior. Participants who identify more strongly
with their initial ingroup also discriminate more strongly between this ingroup and other
groups in allocation choices. Our experimental design additionally allows us to analyze the
within-subject-dimension of allocation choices. Notably, we find a strong connection be-
tween the within-subject heterogeneity in identification preferences and the within-subject-
heterogeneity in social preferences. Individuals consistently consider the specific identity-
related characteristics of groups across different domains. Finally, a replication exercise
supports the results from our main experiment and sheds light on potential alternative ex-
planations.
the decision.21We set the WTA equal to 0 for the receiver from the ingroup.
24
The observed consistency in revealed identification preferences and discrimination behavior
shows the behavioral relevance of considering social identity as an endogenous choice instead
of a purely exogenous characteristic. The presented findings provide insights into how indi-
viduals make these important identification decisions as they trade-off monetary gains and
identity utility.
From an applied perspective, our results provide a novel angle to better understand when
and how common group membership can shape behavior, when it does not, and what the
underlying mechanism behind these different effects might be. It thereby also helps to
assess the effectiveness of attempts to increase identification with organizations and in other
economically relevant domains aiming at utilizing the potentially beneficial effects of common
group identities. Our paper thus also helps in understanding why increasing the level of
identification with a particular group might not be that easy. For example, Carell et al.
(2013) find that some individuals tend to avoid interacting with certain peers with whom they
were intended to interact by organizational design. According to our results, strengthening
the general feeling of belonging to groups can rather be achieved by shaping the salient
characteristics of the particular group such that they match the respective identification
preferences of the relevant individuals more closely. As our study shows, social distance and
social status appear as particularly promising dimensions to be utilized.
25
References
Akerlof, Robert. 2017. “Value Formation: The Role of Esteem.” Games and EconomicBehavior 102: 1–19.
Akerlof, George A., and Rachel E. Kranton. 2000. “Economics and Identity.” Quar-terly Journal of Economics 115 (3): 715–53.
Akerlof, George A., and Rachel E. Kranton. 2002. “Identity and Schooling: SomeLessons for the Economics of Education.” Journal of Economic Literature 40 (4): 1167–1201.
Akerlof, George A., and Rachel E. Kranton. 2005. “Identity and the Economics ofOrganizations.” Journal of Economic Perspectives 19 (1): 9–32.
Algan, Yann, Thierry Mayer, and Mathias Thoenig. 2013. “The Economic Incen-tives of Cultural Transmission: Spatial Evidence from Naming Patterns across France.”Working Paper.
Andreoni, James, and John Miller. 2002. “Giving According to GARP: An Exper-imental Test of the Consistency of Preferences for Altruism.” Econometrica 70 (2):737–753.
Bartling, Bjoern, Ernst Fehr, Michel Andre Marechal, and Daniel Schunk. 2009.“Egalitarianism and Competitiveness.” The American Economic Review 99 (2): 93–98.
Bartling, Bjoern, Florian Engl, and Roberto A. Weber. 2015. “Game Form Miscon-ceptions are Not Necessary for a Willingness-to-Pay vs. Willingness-to-Accept Gap.”Journal of the Economic Science Association 1 (1): 72–85.
Becker, Gordon M., Morris H. Degroot, and Jacob Marschak. 1964. “Measuringutility by a single-response sequential method.” Behavioral Science 9 (3): 226–232.
Bellemare, Charles, Sabine Kroeger, and Arthur Van Soest. 2008. “MeasuringInequity Aversion in a Heterogeneous Population Using Experimental Decisions andSubjective Probabilities.” Econometrica 76 (4): 815–839.
Benjamin, Daniel J., James J. Choi, and A. Joshua Strickland. 2010. “SocialIdentity and Preferences.” The American Economic Review 100 (4): 1913–28.
Bernard, Mark, Florian Hett, and Mario Mechtel. 2016. “Social Identity and SocialFree-Riding.” European Economic Review 90: 4–17.
Bertrand, Marianne, Emir Kamenica, and Jessica Pan. 2015. “Gender Identity andRelative Income within Households.” The Quarterly Journal of Economics 130 (2):571–614.
Billig, Michael, and Henri Tajfel. 1973. “Social categorization and similarity in inter-group behavior.” European Journal of Social Psychology 3 (1): 27–52.
26
Breitmoser, Yves. 2013. “Estimation of social preferences in generalized dictator games.”Economic Letters 121 (2): 192–197.
Bruhin, Adrian, Ernst Fehr, and Daniel Schunk. 2016. “The Many Faces of HumanSociality: Uncovering the Distribution and Stability of Social Preferences.” WorkingPaper 1603, Gutenberg School of Management and Economics.
Bursztyn, Leonardo, Michael Callen, Bruno Ferman, Saad Gulzar, and Ali Hasanaink.2016. “Identifying Ideology: Experimental Evidence on Anti-Americanism in Pakistan.”Working Paper.
Carrell, Scott E. , Bruce I. Sacerdote, and James E. West. 2013. “From NaturalVariation to Optimal Policy? The Importance of Endogenous Peer Group Formation.”Econometrica 81 (3): 855–82.
Cason, Timothy N., and Charles R. Plott. 2014. “Misconceptions and Game FormRecognition: Challenges to Theories of Revealed Preference and Framing.” Journal ofPolitical Economy 122 (6): 1235–1270.
Charness, Gary, and Matthew Rabin. 2002. “Understanding Social Preferences withSimple Tests.” The Quarterly Journal of Economics 117 (3): 817–869.
Charness, Gary, Ramon Cobo-Reyes, and Natalia Jimenez. 2014. “Identities,selection, and contributions in a public-goods game.” Games and Economic Behavior87: 322–338.
Chen, Roy, and Yan Chen. 2011. “The Potential of Social Identity for EquilibriumSelection.” The American Economic Review 101 (6): 2562–89.
Chen, Yan, and Sherry Xin Li. 2009. “Group Identity and Social Preferences.” TheAmerican Economic Review 99 (1): 431–457.
Cohn, Alain, Ernst Fehr, and Michel Andre Marechal. 2014. “Business Culture andDishonesty in the Banking Industry.” Nature 516: 86–89.
Cohn, Alain, Jan Engelmann, Ernst Fehr, and Michel Andre Marechal. 2015a.“Evidence for Countercyclical Risk Aversion: An Experiment with Financial Profes-sionals.” The American Economic Review 105 (2): 860–885.
Cohn, Alain, Michel Andre Marechal, and Thomas Noll. 2015b. “Bad Boys: HowCriminal Identity Salience Affects Rule Violation.” Review of Economic Studies 82 (4):1289–1308.
Currarini, Sergio, and Friederike Mengel. 2016. “Identity, homophily and in-groupbias.” European Economic Review 90: 40–55.
Eckel, Catherine C., and Philip J. Grossman. 2005. “Managing Diversity by CreatingTeam Identity.” Journal of Economic Behavior & Organization 58 (3): 371–392.
27
Engelmann, Dirk, and Martin Strobel. 2004. “Inequality Aversion, Efficiency, andMaximin Preferences in Simple Distribution Experiments.” The American EconomicReview 94 (4): 857–869.
Fershtman, Chaim, and Uri Gneezy. 2001. “Discrimination in a Segmented Society:An Experimental Approach.” Quarterly Journal of Economics 116 (1), 351–377.
Fischbacher, Urs. 2007. “z-Tree: Zurich toolbox for ready-made economic experiments.”Experimental Economics 10 (2): 171–178.
Fisman, Raymond, Shachar Kariv, and Daniel Markovits. 2007. “Individual Pref-erences for Giving.” The American Economic Review 97 (5): 1858–76.
Fryer, Roland G. Jr., and Paul Torelli. 2010. “An empirical analysis of ‘acting white’.”Journal of Public Economics 94 (5-6): 380–396.
Girard, Yann, Florian Hett, and Daniel Schunk. 2015. “How individual charac-teristics shape the structure of social networks.” Journal of Economic Behavior &Organization 115: 197–216.
Goette, Lorenz, David Huffman, and Stephan Meier. 2006. “The impact of groupmembership on cooperation and norm enforcement: Evidence using random assignmentsto real social groups.” The American Economic Review 96 (2): 212–216.
Goette, Lorenz, David Huffman, and Stephan Meier. 2012. “The Impact of SocialTies on Group Interactions: Evidence from Minimal Groups and Randomly AssignedReal Groups.” American Economic Journal: Microeconomics 4 (1): 101–115.
Hargreaves Heap, Shaun P., and Daniel John Zizzo. 2009. “The Value of Groups.”The American Economic Review 99 (1): 295–323.
Hogg, Michael A., and Dominic Abrams. 1988. Social Identifications: A Social Psy-chology of Intergroup Relations and Group Processes. London: Routledge.
Hornsey, Matthew J. 2008. “Social Identity Theory and Self-Categorization Theory: AHistorical Review.” Social Personality Psychology Compass 2 (1): 204–222.
Iriberri, Nagore, and Pedro Rey-Biel. 2011. “The role of role uncertainty in modifieddictator games.” Experimental Economics 14 (2): 160–180.
Iriberri, Nagore, and Pedro Rey-Biel. 2013. “Elicited beliefs and social information inmodified dictator games: What do dictators believe other dictators do?” QuantitativeEconomics 4 (3): 515–547.
Kahneman, Daniel, Jack L. Knetsch, and Richard Thaler. 1986. “Fairness as aconstraint on profit seeking: Entitlements in the market.” The American EconomicReview 76 (4): 728–741.
Klor, Esteban F., and Moses Shayo. 2010. “Social identity and preferences overredistribution.” Journal of Public Economics 94: 269–278.
28
Knetsch, Jack L. 1989. “The Endowment Effect and Evidence of Nonreversible IndifferenceCurves.” The American Economic Review 79 (5): 1277–1284.
Kranton, Rachel, Matthew Pease, Seth Sanders, and Scott Huettel. 2017. “De-constructing Bias: Individual Groupiness and Income Allocation.” Working Paper.
McPherson, Miller, Lynn Smith-Lovin, and James M. Cook. 2001. “Birds of aFeather: Homophily in Social Networks.” Annual Review of Sociology 27: 415–44.
Muller, Daniel. 2017. “The Anatomy of Distributional Preferences with Different SocialIdentities.” Working Paper..
Nunn, Nathan. 2010. “Religious Conversion in Colonial Africa.” American EconomicReview Papers & Proceedings 100 (2), 147–152.
Ockenfels, Axel, and Peter Werner. 2014. “Beliefs and ingroup favoritism” Journal ofEconomic Behavior & Organization 108: 453–462.
Paetzel, Fabian and Rupert Sausgruber. 2016. “Entitlements and Loyalty in Groups:An Experimental Study.” Working Paper.
Rustagi, Devesh, and Marcella Veronesi. 2016. “Social Identity, Attitudes TowardsCooperation, and Social Preferences: Evidence From Switzerland.”Working Paper 01/2016,University of Verona.
Shayo, Moses. 2009. “A Model of Social Identity with an Application to Political Economy:Nation, Class, and Redistribution” American Political Science Review 103 (2): 147–174.
Shih, Margaret, Todd L. Pittinsky, and Nalini Ambady. 1999. “Stereotype Suscep-tibility: Identity Salience ad Shifts in Quantitative Performance” Psychological Science10 (1): 80–83.
Schumacher, Heiner, Iris Kesternich, Michael Kosfeld, and Joachim Winter.2017. “One, Two, Many – Insensitivity to Group Size in Games with ConcentratedBenefits and Dispersed Costs” Review of Economic Studies 84 (3), 1346–1377.
Tajfel, Henri. 1972. Experiments in a Vacuum. In J. Israel and H. Tajfel (Eds.), TheContext of Social Psychology: A Critical Assessment. (pp. 69–122). London/New York:Academic Press.
Tajfel, Henri. 1974. “Social identity and intergroup behaviour” Social Science Informa-tion/sur les sciences sociales.
Tajfel, Henri. 1978. Differentiation between social groups: Studies in the social psychologyof intergroup relations. Oxfod, England: Academic Press
Tajfel, Henri, and John C. Turner. 1979. An integrative theory of intergroup conflict.In W. G. Austin and S. Worchel (Eds.), The social psychology of intergroup relations(pp. 33–47). Monterey, CA: Brooks/Cole.
29
Tajfel, Henri, and John C. Turner. 1986. The Social Identity Theory of IntergroupBehavior. In S. Worchel and W. Austin (Eds.), The Social Psychology of IntergroupRelations (pp. 7–24). Chicago: Nelson-Hall.
Tajfel, Henri, Michael G. Billig, Robert P. Bundy, and Claude Flament. 1971.“Social Categorization and Intergroup Behavior” European Journal of Social Psychology1 (2): 149–78.
Turner, John C., and Rupert J. Brown. 1978. Social Status, cognitive alternatives andintergroup relations. In H. Tajfel (Ed.), Differentiation between social groups: Studiesin the social psychology of intergroup relations (pp. 201-234). London: Academic Press.
Turner, John C., Michael A. Hogg, Penelope J. Oaks, Stephen D. Reicher, andMargaret S. Wetherell. 1987. Rediscovering the social group: A self-categorizationtheory. Oxford, UK: Blackwell.
Wichardt, Philipp C. 2008. “Identity and why we cooperate with those we do” Journalof Economic Psychology 29 (2): 127–139.
Yamagishi, Toshio, and Toko Kiyonari. 2000. “The Group as the Container of Gener-alized Reciprocity” Social Psychology Quarterly 63 (2): 116–132.
30
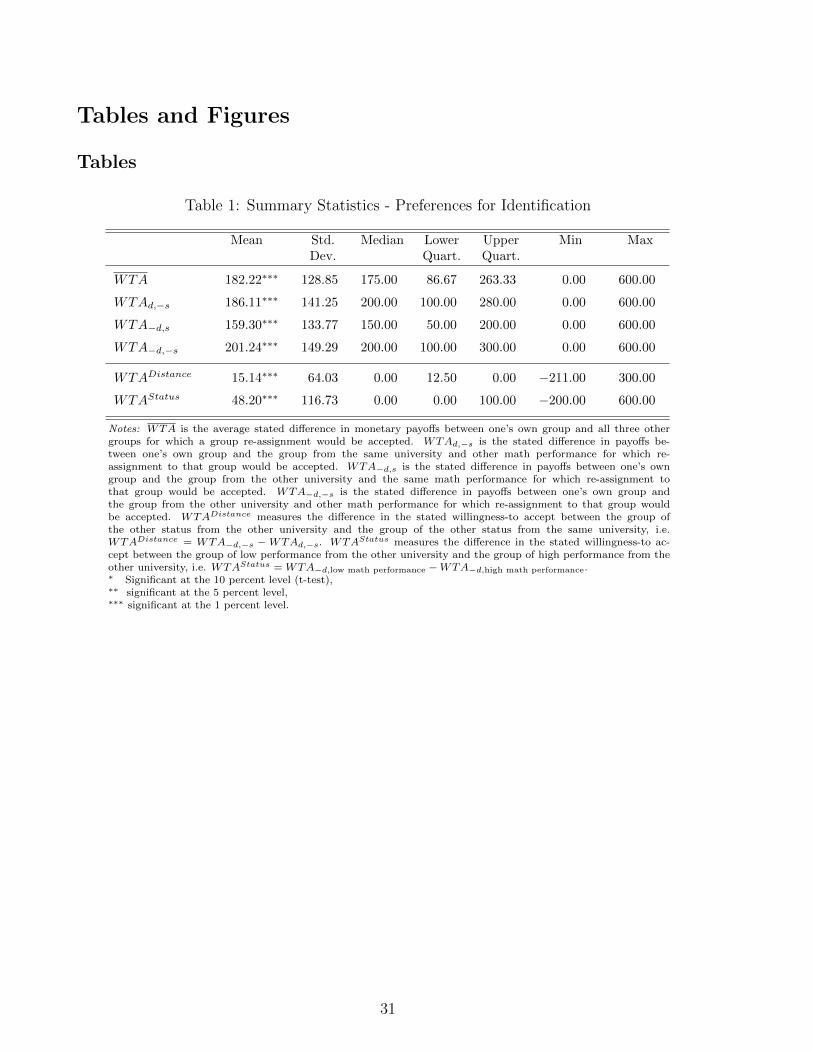
Tables and Figures
Tables
Table 1: Summary Statistics - Preferences for Identification
Mean Std. Median Lower Upper Min MaxDev. Quart. Quart.
WTA 182.22∗∗∗ 128.85 175.00 86.67 263.33 0.00 600.00
WTAd,−s 186.11∗∗∗ 141.25 200.00 100.00 280.00 0.00 600.00
WTA−d,s 159.30∗∗∗ 133.77 150.00 50.00 200.00 0.00 600.00
WTA−d,−s 201.24∗∗∗ 149.29 200.00 100.00 300.00 0.00 600.00
WTADistance 15.14∗∗∗ 64.03 0.00 12.50 0.00 −211.00 300.00
WTAStatus 48.20∗∗∗ 116.73 0.00 0.00 100.00 −200.00 600.00
Notes: WTA is the average stated difference in monetary payoffs between one’s own group and all three othergroups for which a group re-assignment would be accepted. WTAd,−s is the stated difference in payoffs be-tween one’s own group and the group from the same university and other math performance for which re-assignment to that group would be accepted. WTA−d,s is the stated difference in payoffs between one’s owngroup and the group from the other university and the same math performance for which re-assignment tothat group would be accepted. WTA−d,−s is the stated difference in payoffs between one’s own group andthe group from the other university and other math performance for which re-assignment to that group wouldbe accepted. WTADistance measures the difference in the stated willingness-to accept between the group ofthe other status from the other university and the group of the other status from the same university, i.e.WTADistance = WTA−d,−s − WTAd,−s. WTAStatus measures the difference in the stated willingness-to ac-cept between the group of low performance from the other university and the group of high performance from theother university, i.e. WTAStatus = WTA−d,low math performance −WTA−d,high math performance.∗ Significant at the 10 percent level (t-test),∗∗ significant at the 5 percent level,∗∗∗ significant at the 1 percent level.
31
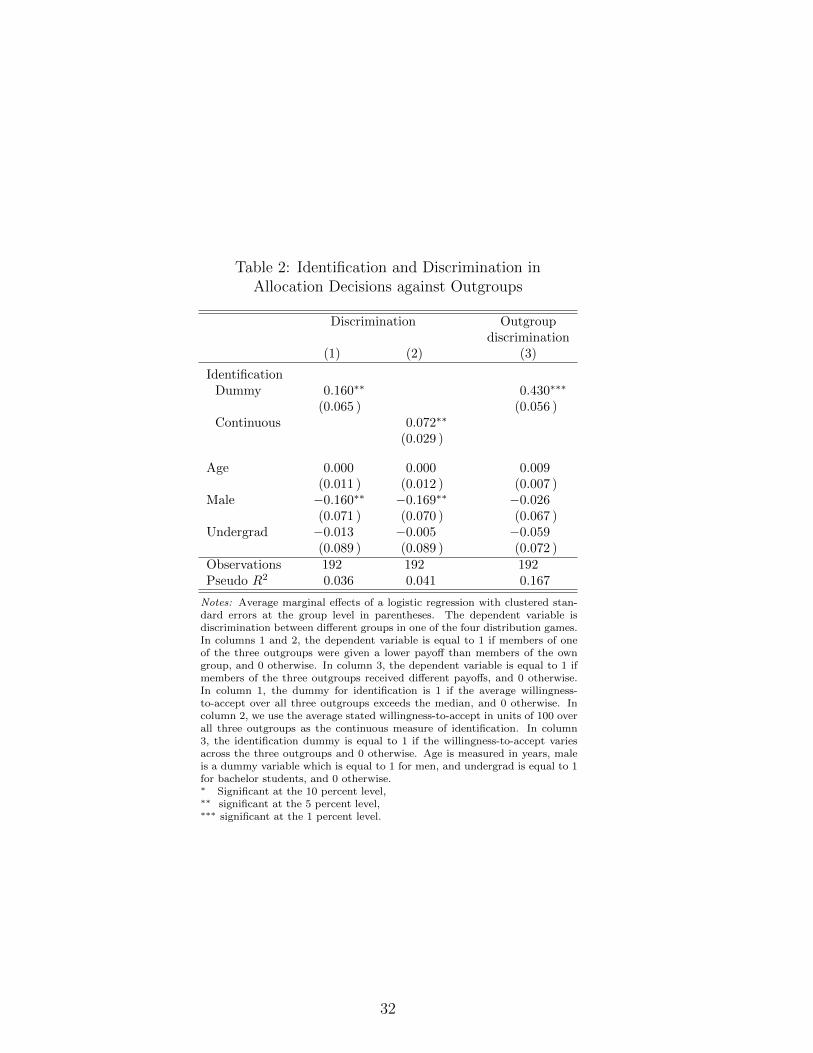
Table 2: Identification and Discrimination inAllocation Decisions against Outgroups
Discrimination Outgroupdiscrimination
(1) (2) (3)
IdentificationDummy 0.160∗∗ 0.430∗∗∗
(0.065 ) (0.056 )Continuous 0.072∗∗
(0.029 )
Age 0.000 0.000 0.009(0.011 ) (0.012 ) (0.007 )
Male −0.160∗∗ −0.169∗∗ −0.026(0.071 ) (0.070 ) (0.067 )
Undergrad −0.013 −0.005 −0.059(0.089 ) (0.089 ) (0.072 )
Observations 192 192 192Pseudo R2 0.036 0.041 0.167
Notes: Average marginal effects of a logistic regression with clustered stan-dard errors at the group level in parentheses. The dependent variable isdiscrimination between different groups in one of the four distribution games.In columns 1 and 2, the dependent variable is equal to 1 if members of oneof the three outgroups were given a lower payoff than members of the owngroup, and 0 otherwise. In column 3, the dependent variable is equal to 1 ifmembers of the three outgroups received different payoffs, and 0 otherwise.In column 1, the dummy for identification is 1 if the average willingness-to-accept over all three outgroups exceeds the median, and 0 otherwise. Incolumn 2, we use the average stated willingness-to-accept in units of 100 overall three outgroups as the continuous measure of identification. In column3, the identification dummy is equal to 1 if the willingness-to-accept variesacross the three outgroups and 0 otherwise. Age is measured in years, maleis a dummy variable which is equal to 1 for men, and undergrad is equal to 1for bachelor students, and 0 otherwise.∗ Significant at the 10 percent level,∗∗ significant at the 5 percent level,∗∗∗ significant at the 1 percent level.
32
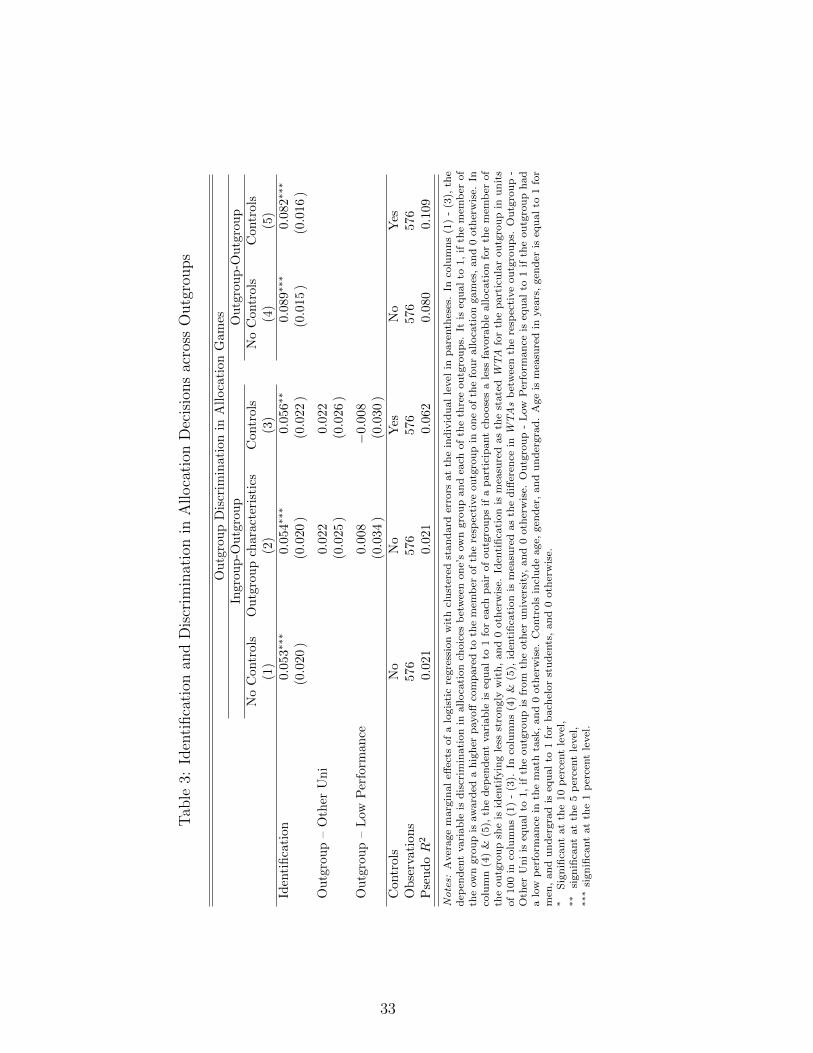
Tab
le3:
Iden
tifica
tion
and
Dis
crim
inat
ion
inA
lloca
tion
Dec
isio
ns
acro
ssO
utg
roups
Ou
tgro
up
Dis
crim
inati
on
inA
lloca
tion
Gam
esIn
gro
up
-Ou
tgro
up
Outg
rou
p-O
utg
rou
pN
oC
ontr
ols
Ou
tgro
up
chara
cter
isti
csC
ontr
ols
No
Contr
ols
Contr
ols
(1)
(2)
(3)
(4)
(5)
Iden
tifi
cati
on0.
053∗∗∗
0.054∗∗∗
0.056∗∗
0.089∗∗∗
0.0
82∗∗∗
(0.0
20
)(0.0
20
)(0.0
22
)(0.0
15
)(0.0
16
)
Ou
tgro
up
–O
ther
Un
i0.0
22
0.0
22
(0.0
25
)(0.0
26
)
Ou
tgro
up
–L
owP
erfo
rman
ce0.0
08
−0.
008
(0.0
34
)(0.0
30
)
Con
trol
sN
oN
oY
esN
oY
esO
bse
rvat
ion
s576
576
576
576
576
Pse
ud
oR
20.
021
0.021
0.0
62
0.080
0.1
09
Notes:
Aver
age
marg
inal
effec
tsof
alo
gis
tic
regre
ssio
nw
ith
clu
ster
edst
an
dard
erro
rsat
the
indiv
idu
al
level
inp
are
nth
eses
.In
colu
mn
s(1
)-
(3),
the
dep
end
ent
vari
ab
leis
dis
crim
inati
on
inalloca
tion
choic
esb
etw
een
on
e’s
ow
ngro
up
an
dea
chof
the
thre
eou
tgro
up
s.It
iseq
ual
to1,
ifth
em
emb
erof
the
ow
ngro
up
isaw
ard
eda
hig
her
payoff
com
pare
dto
the
mem
ber
of
the
resp
ecti
ve
ou
tgro
up
inon
eof
the
fou
ralloca
tion
gam
es,
an
d0
oth
erw
ise.
Inco
lum
n(4
)&
(5),
the
dep
end
ent
vari
ab
leis
equal
to1
for
each
pair
of
ou
tgro
up
sif
ap
art
icip
ant
choose
sa
less
favora
ble
all
oca
tion
for
the
mem
ber
of
the
ou
tgro
up
she
isid
enti
fyin
gle
ssst
ron
gly
wit
h,
an
d0
oth
erw
ise.
Iden
tifi
cati
on
ism
easu
red
as
the
state
dW
TA
for
the
part
icu
lar
ou
tgro
up
inu
nit
sof
100
inco
lum
ns
(1)
-(3
).In
colu
mn
s(4
)&
(5),
iden
tifi
cati
on
ism
easu
red
as
the
diff
eren
cein
WTAs
bet
wee
nth
ere
spec
tive
ou
tgro
up
s.O
utg
rou
p-
Oth
erU
ni
iseq
ual
to1,
ifth
eou
tgro
up
isfr
om
the
oth
eru
niv
ersi
ty,
an
d0
oth
erw
ise.
Ou
tgro
up
-L
ow
Per
form
an
ceis
equ
al
to1
ifth
eou
tgro
up
had
alo
wp
erfo
rman
cein
the
math
task
,an
d0
oth
erw
ise.
Contr
ols
incl
ud
eage,
gen
der
,an
du
nd
ergra
d.
Age
ism
easu
red
inyea
rs,
gen
der
iseq
ual
to1
for
men
,an
du
nd
ergra
dis
equ
al
to1
for
bach
elor
stu
den
ts,
an
d0
oth
erw
ise.
∗S
ign
ifica
nt
at
the
10
per
cent
level
,∗∗
sign
ifica
nt
at
the
5p
erce
nt
level
,∗∗
∗si
gn
ifica
nt
at
the
1p
erce
nt
level
.
33
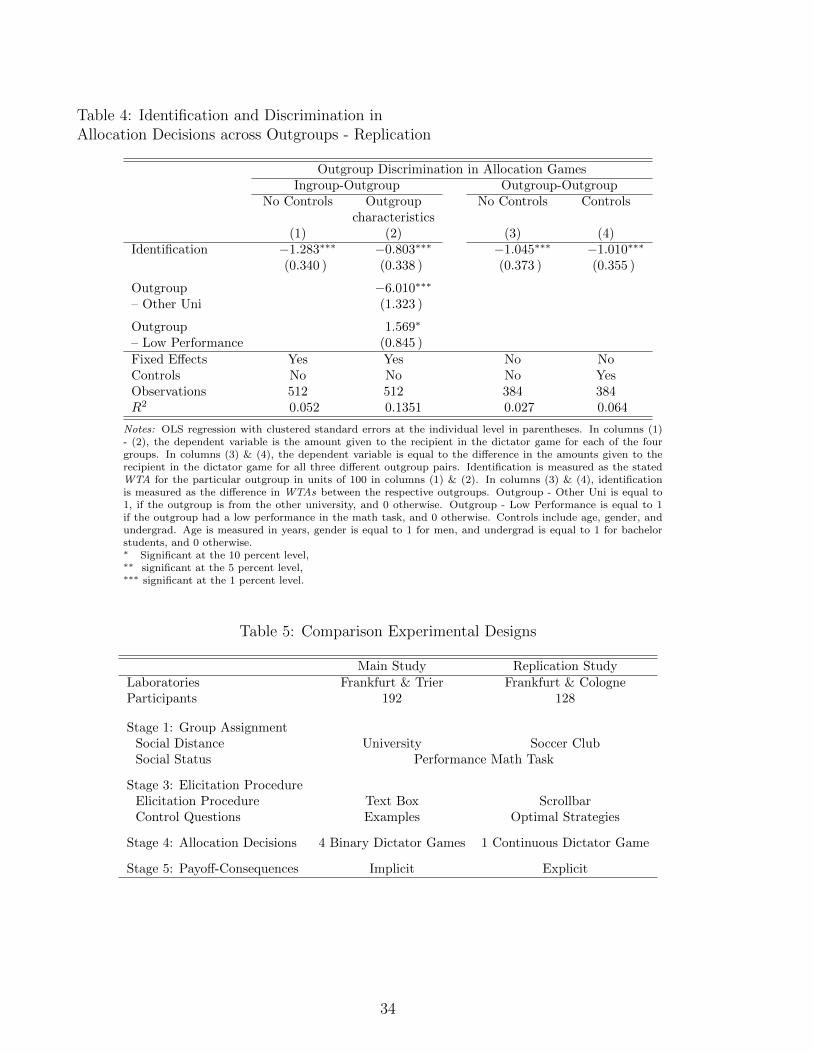
Table 4: Identification and Discrimination inAllocation Decisions across Outgroups - Replication
Outgroup Discrimination in Allocation GamesIngroup-Outgroup Outgroup-Outgroup
No Controls Outgroup No Controls Controlscharacteristics
(1) (2) (3) (4)Identification −1.283∗∗∗ −0.803∗∗∗ −1.045∗∗∗ −1.010∗∗∗
(0.340 ) (0.338 ) (0.373 ) (0.355 )
Outgroup −6.010∗∗∗
– Other Uni (1.323 )
Outgroup 1.569∗
– Low Performance (0.845 )
Fixed Effects Yes Yes No NoControls No No No YesObservations 512 512 384 384R2 0.052 0.1351 0.027 0.064
Notes: OLS regression with clustered standard errors at the individual level in parentheses. In columns (1)- (2), the dependent variable is the amount given to the recipient in the dictator game for each of the fourgroups. In columns (3) & (4), the dependent variable is equal to the difference in the amounts given to therecipient in the dictator game for all three different outgroup pairs. Identification is measured as the statedWTA for the particular outgroup in units of 100 in columns (1) & (2). In columns (3) & (4), identificationis measured as the difference in WTAs between the respective outgroups. Outgroup - Other Uni is equal to1, if the outgroup is from the other university, and 0 otherwise. Outgroup - Low Performance is equal to 1if the outgroup had a low performance in the math task, and 0 otherwise. Controls include age, gender, andundergrad. Age is measured in years, gender is equal to 1 for men, and undergrad is equal to 1 for bachelorstudents, and 0 otherwise.∗ Significant at the 10 percent level,∗∗ significant at the 5 percent level,∗∗∗ significant at the 1 percent level.
Table 5: Comparison Experimental Designs
Main Study Replication StudyLaboratories Frankfurt & Trier Frankfurt & CologneParticipants 192 128
Stage 1: Group AssignmentSocial Distance University Soccer ClubSocial Status Performance Math Task
Stage 3: Elicitation ProcedureElicitation Procedure Text Box ScrollbarControl Questions Examples Optimal Strategies
Stage 4: Allocation Decisions 4 Binary Dictator Games 1 Continuous Dictator Game
Stage 5: Payoff-Consequences Implicit Explicit
34
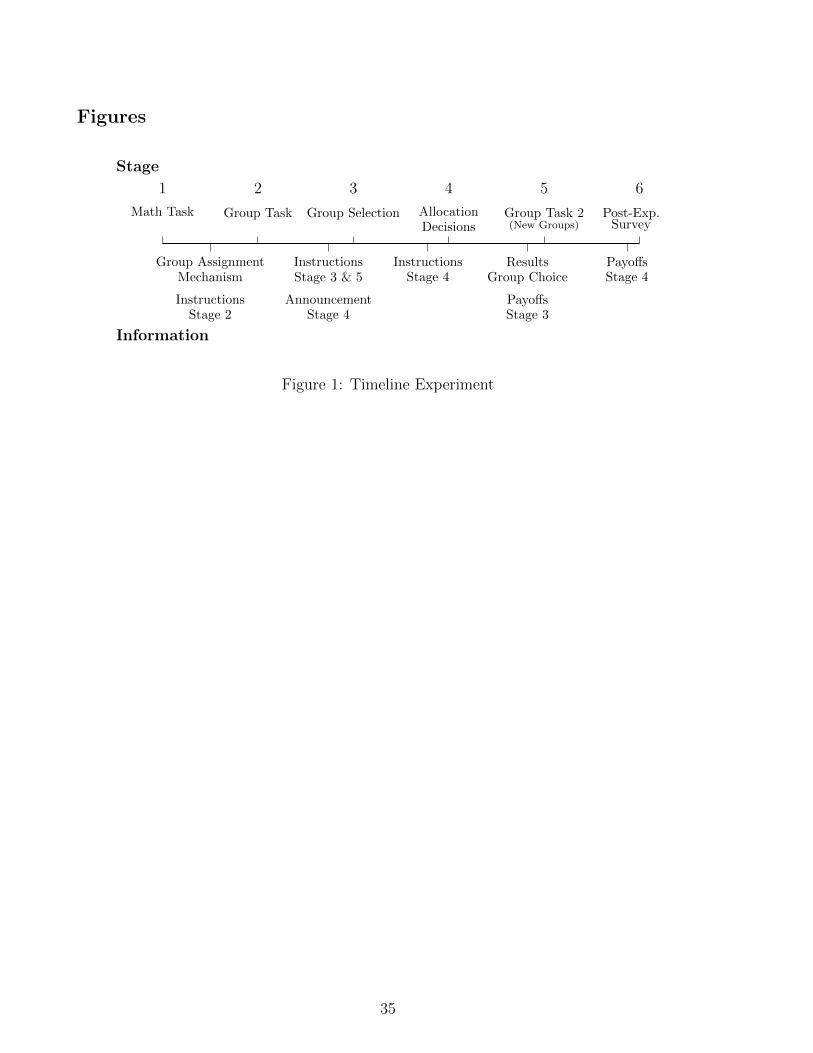
Figures
Stage
Information
1 2 3 4 5 6
Math Task Group Task Group Selection AllocationDecisions
Group Task 2(New Groups)
Post-Exp.Survey
Group AssignmentMechanism
InstructionsStage 2
InstructionsStage 3 & 5
AnnouncementStage 4
InstructionsStage 4
ResultsGroup Choice
PayoffsStage 3
PayoffsStage 4
Figure 1: Timeline Experiment
35
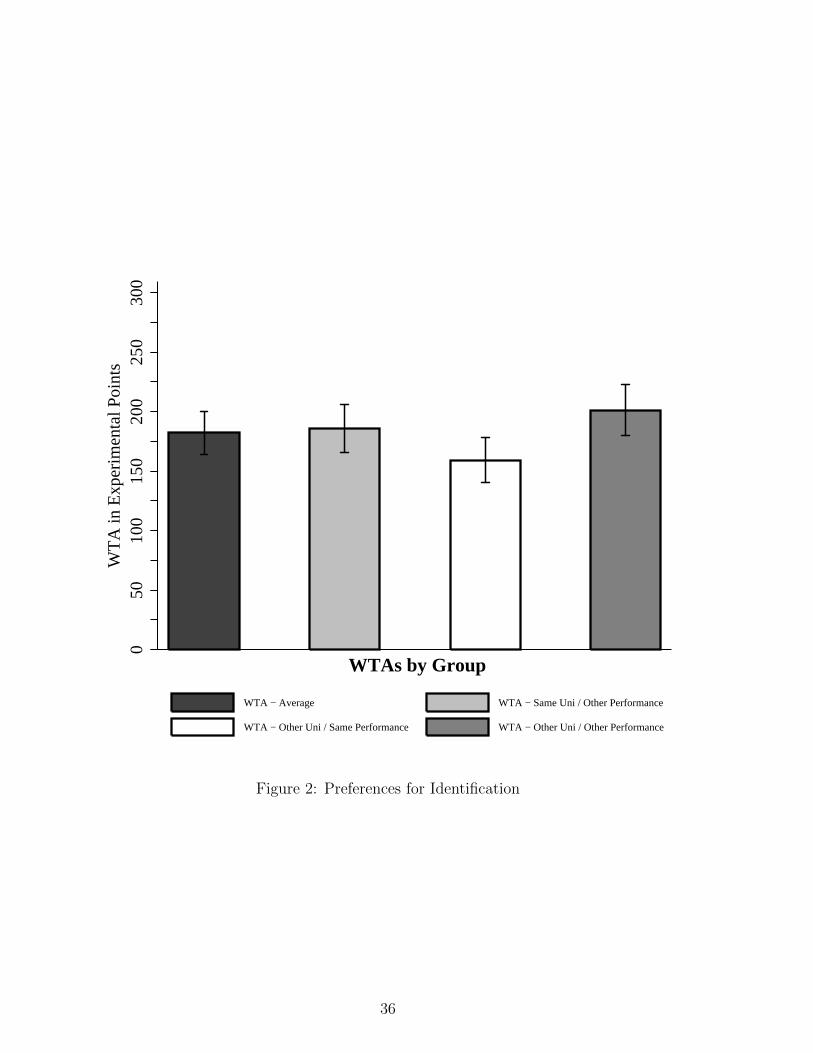
050
100
150
200
250
300
WT
A in
Exp
erim
enta
l Poi
nts
WTA − Average WTA − Same Uni / Other Performance
WTA − Other Uni / Same Performance WTA − Other Uni / Other Performance
WTAs by Group
Figure 2: Preferences for Identification
36
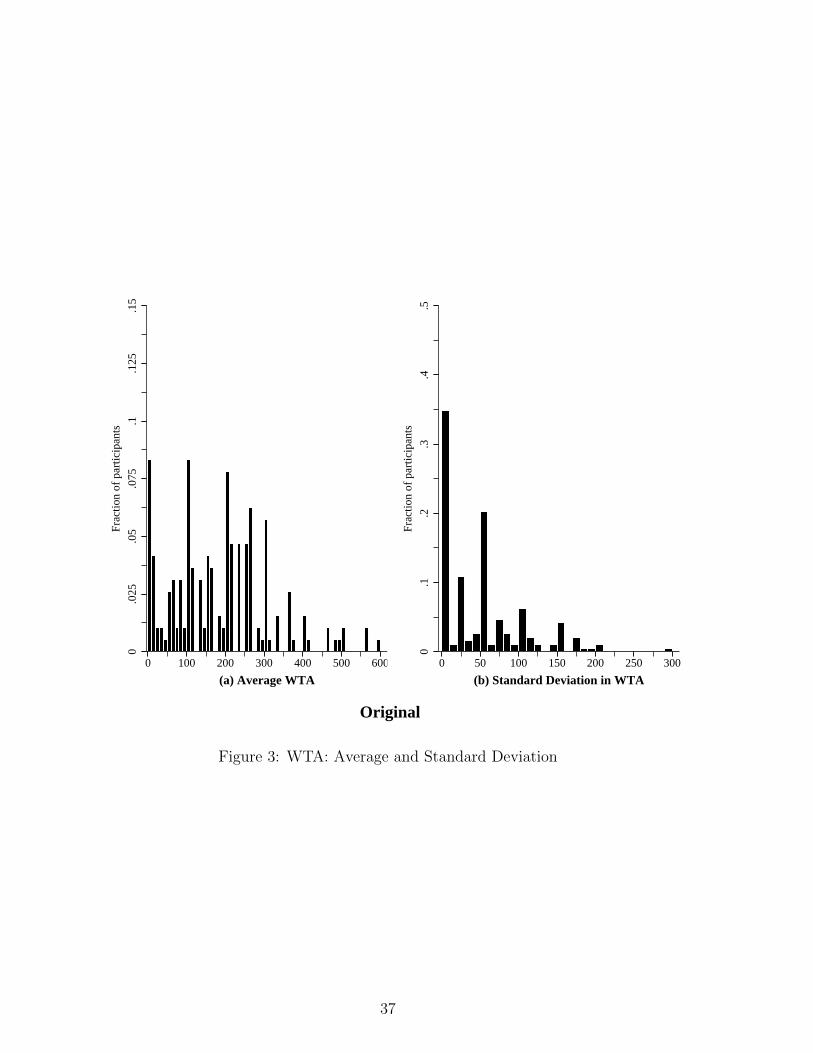
0.0
25.0
5.0
75.1
.125
.15
Frac
tion
of p
artic
ipan
ts
0 100 200 300 400 500 600
(a) Average WTA
0.1
.2.3
.4.5
Frac
tion
of p
artic
ipan
ts
0 50 100 150 200 250 300
(b) Standard Deviation in WTA
Original
Figure 3: WTA: Average and Standard Deviation
37
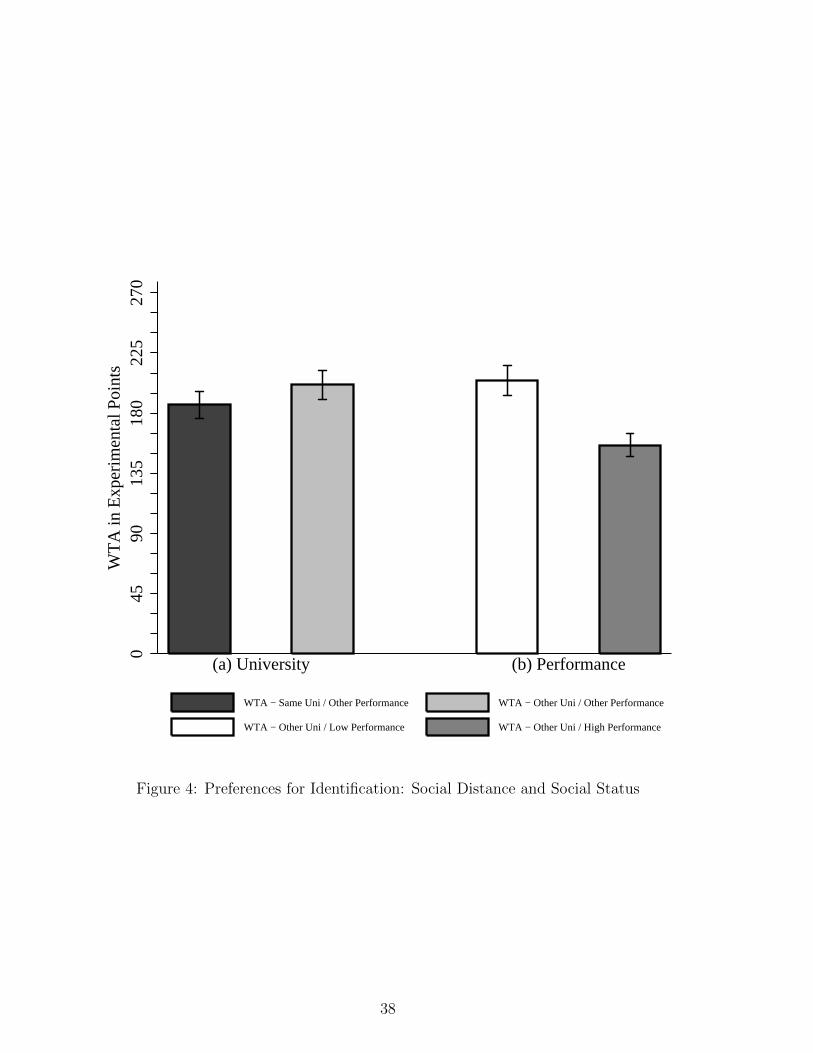
045
9013
518
022
527
0W
TA
in E
xper
imen
tal P
oint
s
(a) University (b) Performance
WTA − Same Uni / Other Performance WTA − Other Uni / Other Performance
WTA − Other Uni / Low Performance WTA − Other Uni / High Performance
Figure 4: Preferences for Identification: Social Distance and Social Status
38
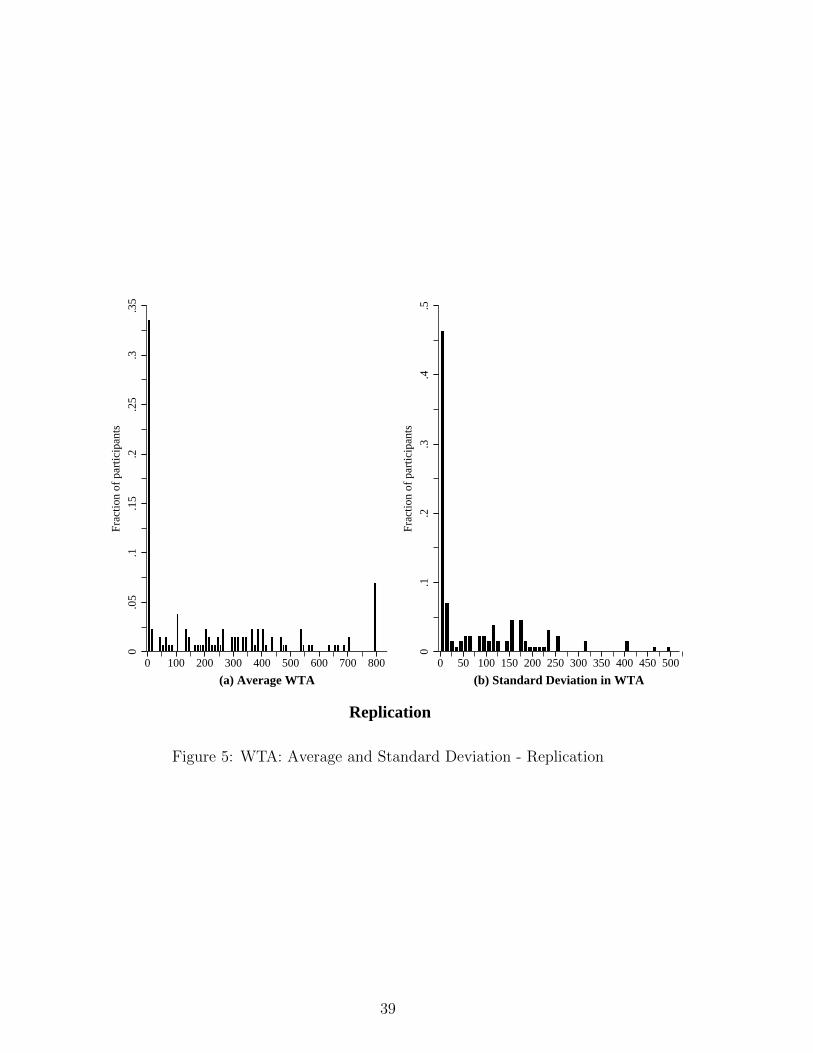
0.0
5.1
.15
.2.2
5.3
.35
Frac
tion
of p
artic
ipan
ts
0 100 200 300 400 500 600 700 800
(a) Average WTA
0.1
.2.3
.4.5
Frac
tion
of p
artic
ipan
ts
0 50 100 150 200 250 300 350 400 450 500
(b) Standard Deviation in WTA
Replication
Figure 5: WTA: Average and Standard Deviation - Replication
39
For Online Publication
ONLINE APPENDIX:
Choosing Who You Are: The Structure and
Behavioral Effects of Revealed Identification Preferences
Florian Hett, Markus Kroll, and Mario Mechtel
Appendix A. Additional results
I. Heterogeneity in identification preferences
In this section, we give a more detailed account of the role of social distance and social status
for identification preferences. As outlined in Section 4.1, both of these components affect
identification preferences. Individuals identify more strongly with groups of close social dis-
tance and higher social status. As previously discussed, while social distance appears to
have a weaker impact than social status, heterogeneity in the individuals’ responses to social
distance conceals its strength in the aggregate analysis. It is not just that a large share of
individuals (120 out of the 196) do not distinguish between the two respective outgroups,
but also that 25 participants identify more strongly with the group of the other university.
For these individuals, WTADistance amounts to -70.4 points (or 14.1 percent of expected
earnings) and thus considerably pulls down the aggregate value for the full sample.
The choices of these 25 participants seem puzzling at first glance, because they appear to
identify more strongly with the group to which they have a higher social distance. However,
data from our post-experimental questionnaire hints at another explanation. Asked to rate
the relative reputation of the other university compared to one’s own university, the vast
majority of participants (∼ 75 percent) perceive the two universities to be about equal. For
the 25 participants who identify more strongly with the other university, the perception of
their own university is significantly lower than for the other participants (p = 0.013). This
indicates that their decision might be driven by social status concerns, which could manifest
themselves in the university affiliation as well.
1
As for social distance, we also observe substantial heterogeneity between individuals with
respect to social status (see panel (b) of Figure A.2). 64.6 percent of the participants display
status-induced differences in identification (i.e. state different WTAs for the two groups
from the other university). Out of these, 86 participants (or 44.8 percent of the full sample)
identify more strongly with the high status group, i.e. WTAStatus > 0. Their average stated
difference is 144.42 points (grey bar), which equates to almost 30 percent of expected earn-
ings, underlining the importance of social status for identification. Another 37 individuals,
however, show a somewhat lower yet still strong identification with the low status group
(white bar) and request 85 points more to accept re-assignment to the high status group.
This heterogeneity is due to an asymmetry in the effect of status. Breaking down identi-
fication preferences regarding status for participants of high and low status groups indeed
reveals an interesting pattern (Figure A.3). The overall status effect is driven by participants
from the high status groups. While participants from the high status groups strongly and
almost exclusively identify with the high status group, there is no clear pattern for members
of the low status groups. Whereas 29 of the 96 members of the low status groups identify
with the low status, 28 members identify with the high status.
This result demonstrates that social distance and social status are inherently intertwined,
as participants might perceive social distance not only with respect to university affiliation,
but also with respect to status. Any variation in the status dimension automatically also
induces differences in the social distance dimension, as differences in the characteristic that
induces status imply a social distance in this characteristic as well. For individuals from
a high status group, a high status group from the other university dominates a low status
group from the other university in both, social status and social distance. For individuals
from a low status group, however, the high status group from the other university provides
higher social status, but also larger social distance.
Alternatively, the social identity literature suggests that individuals might devalue dimen-
sions in which their ingroup performs poorly and focus on other dimensions instead (Turner
and Brown 1978, Tajfel and Turner 1979, Hogg and Abrams 1988, Hornsey 2008). Con-
sistent with that idea is Wichardt’s (2008) argument that individuals who are confronted
with different dimensions of group characteristics focus the more on a particular group the
more it offers them a positive contribution to their identity in a certain context. Akerlof
(2015) focuses on a similar margin along which individuals can manage identity: reweighting
“achievements” in different dimensions. Our result that WTA differences in the status di-
2
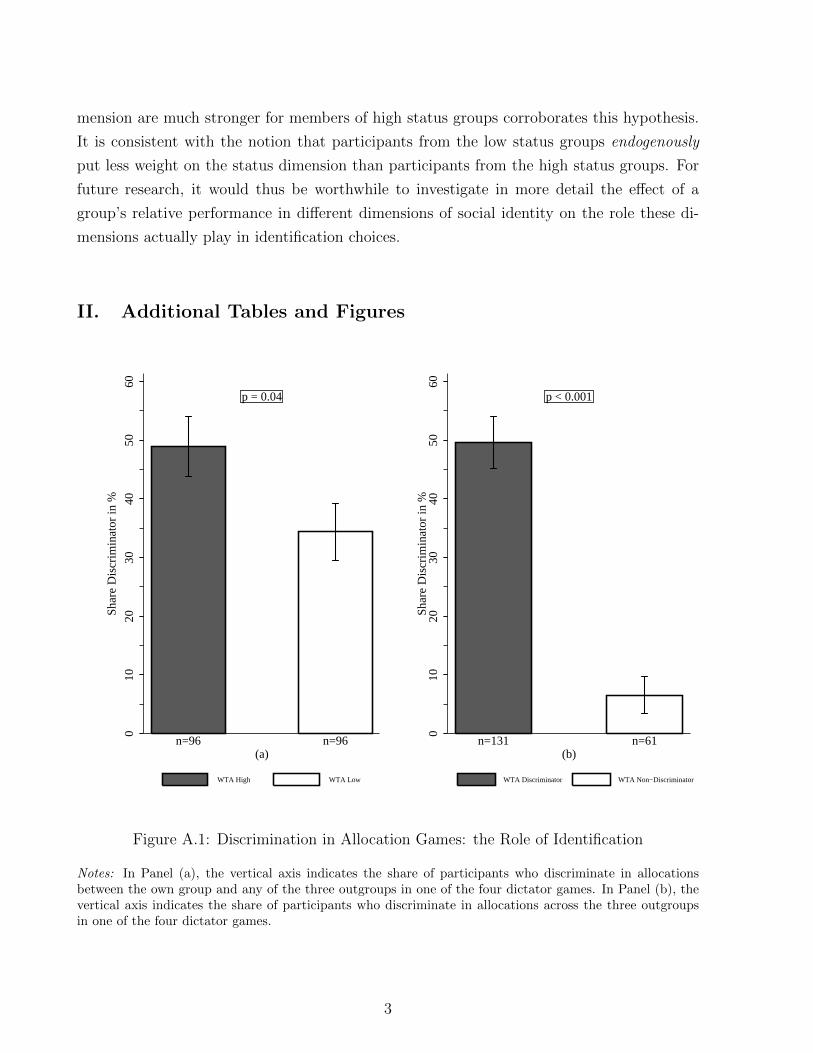
mension are much stronger for members of high status groups corroborates this hypothesis.
It is consistent with the notion that participants from the low status groups endogenously
put less weight on the status dimension than participants from the high status groups. For
future research, it would thus be worthwhile to investigate in more detail the effect of a
group’s relative performance in different dimensions of social identity on the role these di-
mensions actually play in identification choices.
II. Additional Tables and Figures
p = 0.04
010
2030
4050
60
Sha
re D
iscr
imin
ator
in %
n=96 n=96(a)
WTA High WTA Low
p < 0.001
010
2030
4050
60S
hare
Dis
crim
inat
or in
%
n=131 n=61(b)
WTA Discriminator WTA Non−Discriminator
Figure A.1: Discrimination in Allocation Games: the Role of Identification
Notes: In Panel (a), the vertical axis indicates the share of participants who discriminate in allocationsbetween the own group and any of the three outgroups in one of the four dictator games. In Panel (b), thevertical axis indicates the share of participants who discriminate in allocations across the three outgroupsin one of the four dictator games.
3
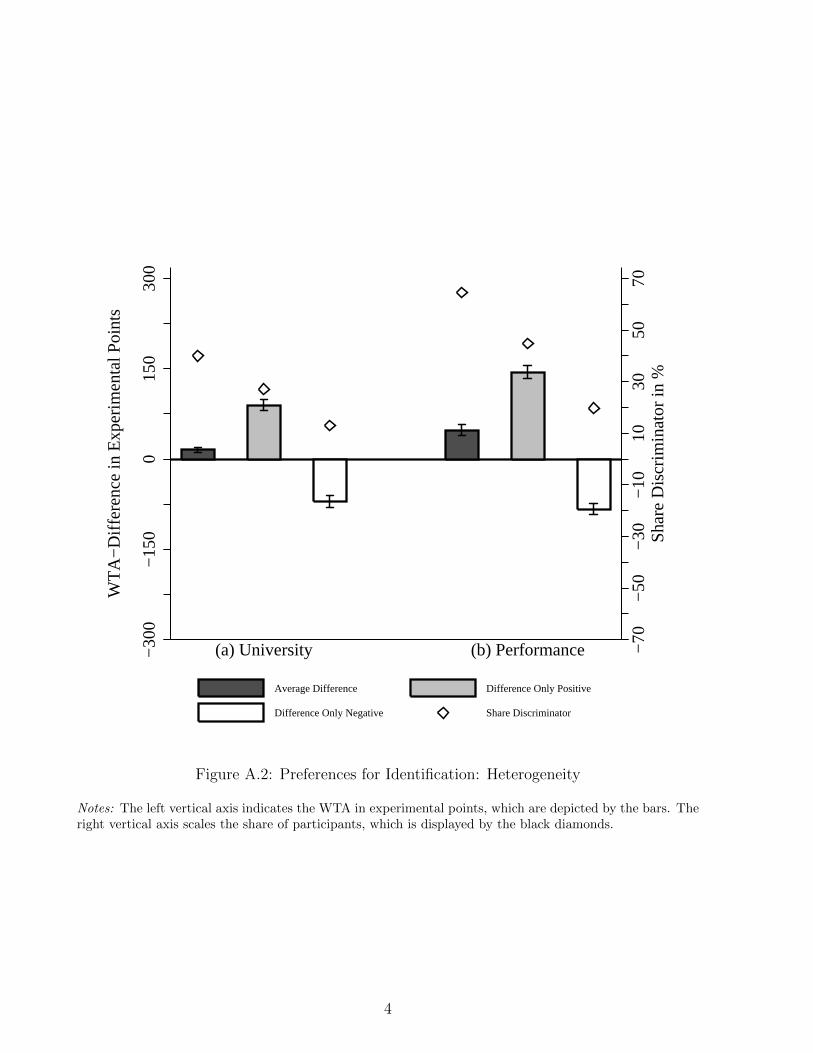
−70
−50
−30
−10
1030
5070
Sha
re D
iscr
imin
ator
in %
−30
0−
150
015
030
0
WT
A−
Diff
eren
ce in
Exp
erim
enta
l Poi
nts
(a) University (b) Performance
Average Difference Difference Only Positive
Difference Only Negative Share Discriminator
Figure A.2: Preferences for Identification: Heterogeneity
Notes: The left vertical axis indicates the WTA in experimental points, which are depicted by the bars. Theright vertical axis scales the share of participants, which is displayed by the black diamonds.
4
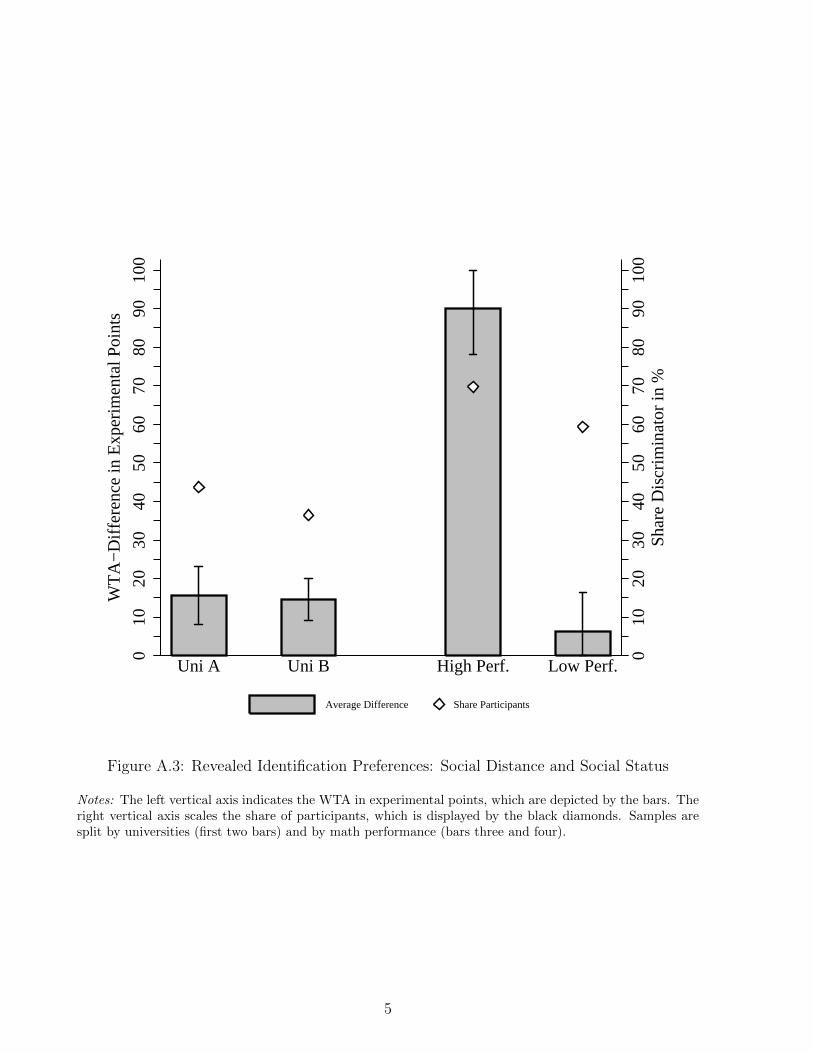
010
2030
4050
6070
8090
100
Sha
re D
iscr
imin
ator
in %
010
2030
4050
6070
8090
100
WT
A−
Diff
eren
ce in
Exp
erim
enta
l Poi
nts
Uni A Uni B High Perf. Low Perf.
Average Difference Share Participants
Figure A.3: Revealed Identification Preferences: Social Distance and Social Status
Notes: The left vertical axis indicates the WTA in experimental points, which are depicted by the bars. Theright vertical axis scales the share of participants, which is displayed by the black diamonds. Samples aresplit by universities (first two bars) and by math performance (bars three and four).
5
Appendix B. Replication Study
I. Experimental design
Our replication study consisted of the same five stages as the main experiment. Again, we
assigned groups based on two characteristics in the first stage and used three unincentivized
picture puzzles and a chat phase for group enhancement through joint activity. We then
used the same revealed preference approach to elicit identification preferences in stage 3 and
measured identity-contingent social preferences with a simple dictator game in stage 4. Once
more, the experiment was capped with a second unincentivized round of picture puzzles after
payoff-realizations as well as group changes were revealed. While we thus fully replicated the
original experiment in terms of the underlying experimental strategy and design, we made
four important procedural changes to address some potential concerns with the initial design.
Group assignment characteristics – Even though our initial design was successful in
spanning an identity space which reflected social distance and social status, other categories
than university affiliation might carry stronger social distance. Identification with one’s
alma mater is less salient in Germany than for example the US, where university affiliation
is more culturally ingrained and reinforced by intercollegiate competition. We therefore de-
fine new groups based on a characteristic which is in Germany emotionally more charged
than university affiliation: support for the professional soccer clubs Eintracht Frankfurt and
1. FC Koln. We specifically chose these two clubs as they share a long history in German
professional soccer and mirror each other quite closely in terms of their historic as well as
recent performance. This allowed us to dampen the potential for additional social status
concerns in this group assignment characteristic by design.
We conducted the experiments with the subject pools of the Frankfurt Laboratory for Ex-
perimental Economic Research (FLEX) and the Cologne Laboratory for Economic Research
(CLER). To ensure that supporters of the two clubs participated in the experiment, we tar-
geted soccer fans within the subject pool by announcing that we would ask team-specific
questions in the experiment and asked only supporters of the two clubs to sign up at the
respective university. For the social status dimension, we again used the math task from the
original experiment and assigned participants in high or low performance groups contingent
on their performance in this task. We however changed the color labels attached to the
high (from blue to green) and low (from red to green) perfoming group so that they did not
overlap with any of the colors of the soccer teams.
6
Instructions and Control Questions – In order to make the payoffs in the third stage
even more salient and ensure that every participant understood the payoff consequences of
their decisions, we altered the control questions in the replication study. Rather than giving
examples and asking what would happen under the described circumstances, we opted for
comprehension questions which focused on the optimal strategy given a certain objective.
More specifically, every individual had to state the optimal strategy for three types of indi-
viduals: (i) an individual who would like to remain with her initial group, (ii) one who would
like to leave her initial group, and (iii) one who does not care about group membership and
wants to maximize her own payoffs.
Additionally, we rephrased the description of the second round of picture puzzles and group
chats. In the main experiment, we stated that this second phase would be fully identical
to the first one aside from the potential new group compositions. This implies that this
stage has no payoff consequences. However, one might argue that participants still had some
strategic considerations when making their identification choices. We therefore added the
following line to the instructions of stage 3 in the replication study: “You will not receive
any payments for correct solutions to the picture puzzles in the second round of the group
quiz.”
Elication Procedure – We used plain text boxes to elicit the WTAs in our main experi-
ment. This procedure might artificially inflate the WTAs because participants might have
felt compelled to add a positive number. Secondly, although the experimental setting was
very transparent, participants might not have been aware that entering negative values was
viable. Indeed, we found that only a very small fraction of participants stated WTAs of 0
and did not care about group affiliation (< 8%). Nobody entered a negative number.
In the replication study, we therefore replaced the text boxes with scrollbars ranging from
-8 Euro to +8 Euro. This highlighted the possibility that stating a negative WTA (i.e.
expressing to prefer another group to the initial one) was possible and allowed us to specify
a default, which we set at 0.
Dictator Games – The set of games used in the main study limited participants’ actions
to binary decisions and might thus cloud heterogeneity in discrimination behavior for those
participants who would like to discriminate at an intermediate level between the two binary
options. To account for this, we replaced the four binary dictator games with a single con-
tinuous dictator decision.
7
Individuals were again matched in pairs of two. There are two roles: dictator and receiver.
The dictator was endowed with 10 Euros, whereas the receiver was given 5 Euros. The dic-
tator could now share some of her endowment with the receiver, take some of the endowment
from the receiver, or leave both players with the initial endowment. Giving or taking was
restricted to increments of 10 Cents. Every Cent given to the receiver was doubled by the
experimenter, every Cent taken from the receiver was halved by the experimenter. Thus,
giving (taking) was efficient (inefficient).
We again employed the strategy method: Every participant made the decision in the role of
the dictator being matched with a receiver from each of the four groups (receiver from her
own group/group of the same soccer team and other performance/group of the other soccer
team and same performance/group of the other soccer team and other performance). We
informed participants that roles and one group combination would be randomly selected and
that participants would be paid according to these decisions.
II. Results
To test for the robustness of our results with respect to the described design features, we ran
the replication study with 128 participants. Table 5 provides an overview of the key features
and differences to the main experiment as described above. Within this section, we describe
the results of the replication in detail and relate them to our findings presented in the main
part of the paper.
Participants’ average WTA amounts to 236.2 points in the replication study (using the ab-
solute value for negative stated WTAs), which equals 59.1% of expected earnings at the
group selection stage. The WTA average over all participants is significantly different from
0 (t-test: p < 0.0001). The same holds for the average values of outgroup-specific WTAs.
As in the main experiment, revealed WTAs were group-contingent: The highest average
WTA (243.08 points) results for the outgroup of different performance and the other soccer
club, while average WTA is the lowest for the outgroup of different performance and the
same soccer club (206.36 points). This latter finding is a first indicator for a more important
role of the social distance (i.e. soccer club) dimension in the replication study. While the
absolute value of average WTA in the replication is higher than in our main experiment, we
should take into account that the interval of potential WTA differences between two groups
is 800 in the replication study instead of 600. The fraction of average WTA over potential
8
WTA difference is, thus, 30.4% in our main experiment and 29.5% in the replication. In
contrast to the main experiment, two participants state a negative WTA average for all
three outgroups (0 in the main experiment). While only 15 of 192 participants in the main
experiment chose a WTA average of 0 or 1, the share of participants for whom groups do not
matter is larger in the replication (26.6% with an average WTA of 0). However, 22 percent
of the participants even state WTAs larger than 400, which corresponds to 50 percent of
expected earnings from the group selection stage in the replication study. Combining these
results supports the view that there is much heterogeneity with respect to the perceived
importance of groups, i.e. that some people are more “groupy” than others (Kranton et al.
2016). Taken together, result 1 is, thus, confirmed by the replication study.
Result 2 focuses on the structure of identification preferences (see Figure B.2). As in the
main experiment, we compare the WTA regarding two outgroups of the same math per-
formance but different soccer teams to identify the role of social distance. On average, the
WTA difference amounts to 36.7 points and is statistically significant (t-test: p = 0.0338).
The first part of result 2 is, thus, confirmed. The same holds true for the second part:
social status matters for identification. On average, participants have a 71.2 points higher
WTA regarding the outgroup from the other soccer team that performed worth in the math
task. While the social distance effect amounts to around 30% of the social status effect in
the main experiment, its relative importance is substantially higher in the replication study
(more than 50%).
Results 3 and 4 established that identification is related to ingroup-outgroup discrimination
and outgroup-outgroup discrimination. The data from the replication study confirm that
participants who identify more strongly with their initial group are significantly more likely
to discriminate against outgroups. This is true both for the replication of Figure A.1 and a
logistic regression where the explanatory variable of main interest is a dummy that equals 1 if
a participant’s average WTA exceeds the median value. The average marginal effect equals
0.191 and is, thus, very similar to that in column (1) of Table 2. Applying a participant’s
WTA average as continuous measure for identification yields a positive but statistically in-
significant marginal effect in the replication study.22 The continuous version of the dictator
games utilized in the replication study allows for more within-subject variation and enables
to push the analysis one step further. In the flavor of Table 3, we can now analyze alloca-
22Using WTA as explanatory variable assumes a linear relationship between WTA and the probabilityto discriminate against outgroups. Given the larger level of heterogeneity with respect to identificationobserved in the replication study (with a much higher share of participants with an average WTA of 0), thisassumption appears to be less appropriate than in the main experiment.
9
tion choices at the group level, taking into account unobserved heterogeneity by including
participant fixed effects (see Table 4). The dependent variable captures the amount sent
to the receiver in the dictator game (contingent on the receiver’s group membership). Our
explanatory variable of main interest captures identification with the receiver’s group. It
equals the group-specific WTA for outgroup receivers and is 0 if the receiver stems from the
ingroup. The estimations strongly support the results from Table 3: the stronger the level of
identification with the receiver’s group, the larger is the amount sent by a participant. This
result is independent of whether we control for outgroup characteristics (i.e. other soccer
club and low performance) or not. Result 3 is, thus, supported (and augmented) by the
replication study.
Our finding that WTA discrimination across outgroups relates to discrimination in alloca-
tion choices across outgroups (result 4) is also supported by the replication exercise. The
share of outgroup-outgroup allocation discriminators is significantly larger among those par-
ticipants who also discriminate across two particular outgroups with respect to WTA in
the flavour of Figure A.1. This result also holds for the replication study when introducing
additional controls (as in column (3) of Table 2). The marginal effect of the WTA dummy
which captures a WTA difference between outgroups is 0.368 and statistically significant at
the 1%-level. Furthermore, the result is confirmed when focusing on the group-level (as in
Table 3).
Overall, the replication exercise supports the results from our main experiment. We find
that identification matters (result 1), a group’s social distance and social status matter for
identification (result 2), and identification predicts group specific social preferences (results
3 and 4). As expected, the role of social distance became larger and identification again
played an important role, although we stressed the possibility to enter a negative WTA.
Furthermore, the effects of group-specific identification on social preferences remain stable
even when we account for participant fixed effects which is possible due to the change in the
experimental design in the replication study (continuous dictator game).
10
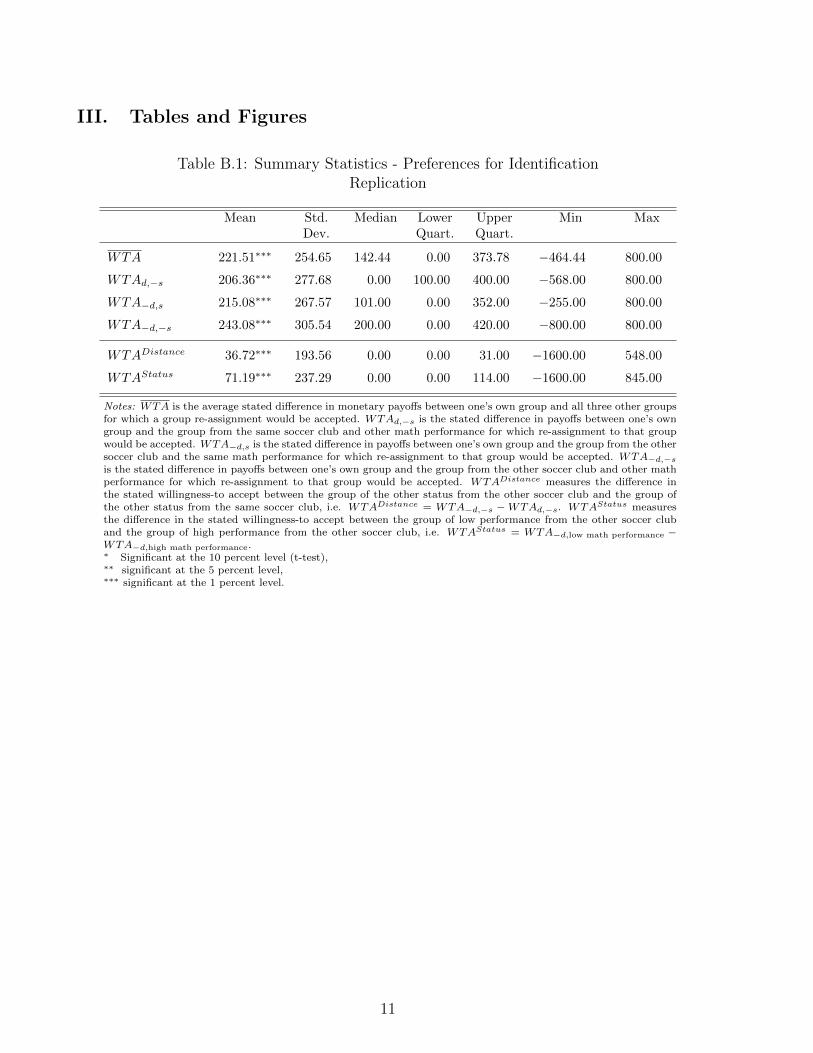
III. Tables and Figures
Table B.1: Summary Statistics - Preferences for IdentificationReplication
Mean Std. Median Lower Upper Min MaxDev. Quart. Quart.
WTA 221.51∗∗∗ 254.65 142.44 0.00 373.78 −464.44 800.00
WTAd,−s 206.36∗∗∗ 277.68 0.00 100.00 400.00 −568.00 800.00
WTA−d,s 215.08∗∗∗ 267.57 101.00 0.00 352.00 −255.00 800.00
WTA−d,−s 243.08∗∗∗ 305.54 200.00 0.00 420.00 −800.00 800.00
WTADistance 36.72∗∗∗ 193.56 0.00 0.00 31.00 −1600.00 548.00
WTAStatus 71.19∗∗∗ 237.29 0.00 0.00 114.00 −1600.00 845.00
Notes: WTA is the average stated difference in monetary payoffs between one’s own group and all three other groupsfor which a group re-assignment would be accepted. WTAd,−s is the stated difference in payoffs between one’s owngroup and the group from the same soccer club and other math performance for which re-assignment to that groupwould be accepted. WTA−d,s is the stated difference in payoffs between one’s own group and the group from the othersoccer club and the same math performance for which re-assignment to that group would be accepted. WTA−d,−s
is the stated difference in payoffs between one’s own group and the group from the other soccer club and other mathperformance for which re-assignment to that group would be accepted. WTADistance measures the difference inthe stated willingness-to accept between the group of the other status from the other soccer club and the group ofthe other status from the same soccer club, i.e. WTADistance = WTA−d,−s − WTAd,−s. WTAStatus measuresthe difference in the stated willingness-to accept between the group of low performance from the other soccer cluband the group of high performance from the other soccer club, i.e. WTAStatus = WTA−d,low math performance −WTA−d,high math performance.∗ Significant at the 10 percent level (t-test),∗∗ significant at the 5 percent level,∗∗∗ significant at the 1 percent level.
11
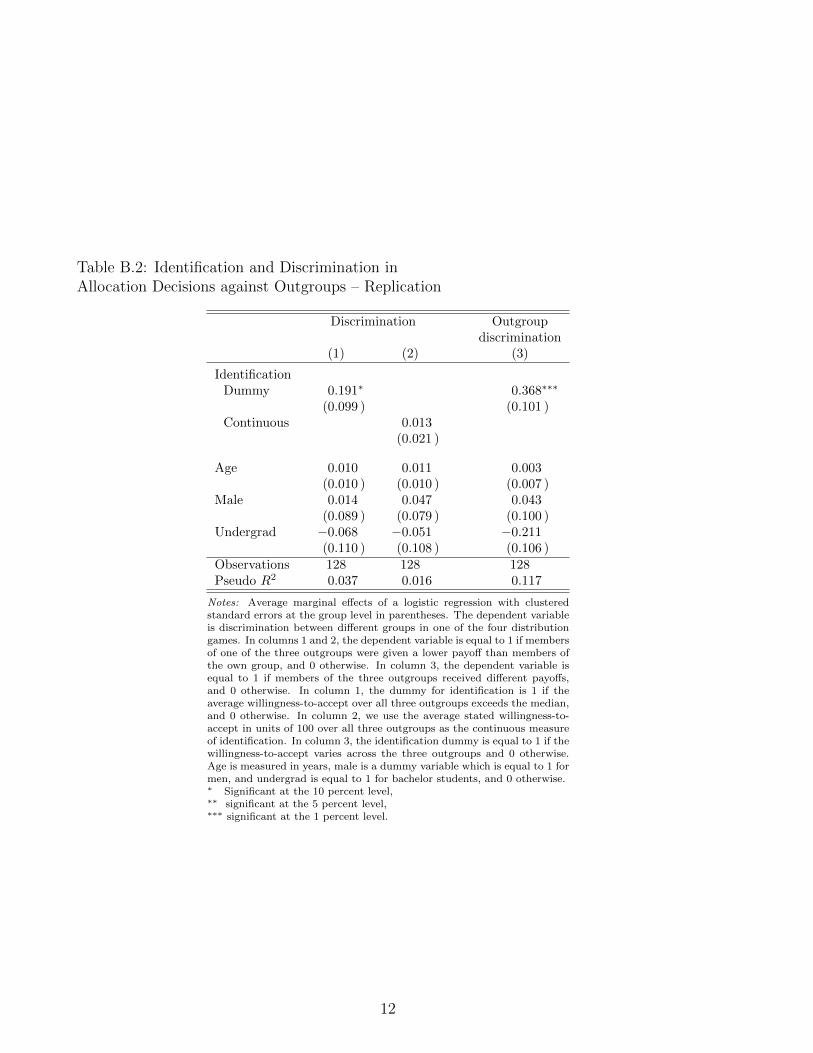
Table B.2: Identification and Discrimination inAllocation Decisions against Outgroups – Replication
Discrimination Outgroupdiscrimination
(1) (2) (3)
IdentificationDummy 0.191∗ 0.368∗∗∗
(0.099 ) (0.101 )Continuous 0.013
(0.021 )
Age 0.010 0.011 0.003(0.010 ) (0.010 ) (0.007 )
Male 0.014 0.047 0.043(0.089 ) (0.079 ) (0.100 )
Undergrad −0.068 −0.051 −0.211(0.110 ) (0.108 ) (0.106 )
Observations 128 128 128Pseudo R2 0.037 0.016 0.117
Notes: Average marginal effects of a logistic regression with clusteredstandard errors at the group level in parentheses. The dependent variableis discrimination between different groups in one of the four distributiongames. In columns 1 and 2, the dependent variable is equal to 1 if membersof one of the three outgroups were given a lower payoff than members ofthe own group, and 0 otherwise. In column 3, the dependent variable isequal to 1 if members of the three outgroups received different payoffs,and 0 otherwise. In column 1, the dummy for identification is 1 if theaverage willingness-to-accept over all three outgroups exceeds the median,and 0 otherwise. In column 2, we use the average stated willingness-to-accept in units of 100 over all three outgroups as the continuous measureof identification. In column 3, the identification dummy is equal to 1 if thewillingness-to-accept varies across the three outgroups and 0 otherwise.Age is measured in years, male is a dummy variable which is equal to 1 formen, and undergrad is equal to 1 for bachelor students, and 0 otherwise.∗ Significant at the 10 percent level,∗∗ significant at the 5 percent level,∗∗∗ significant at the 1 percent level.
12
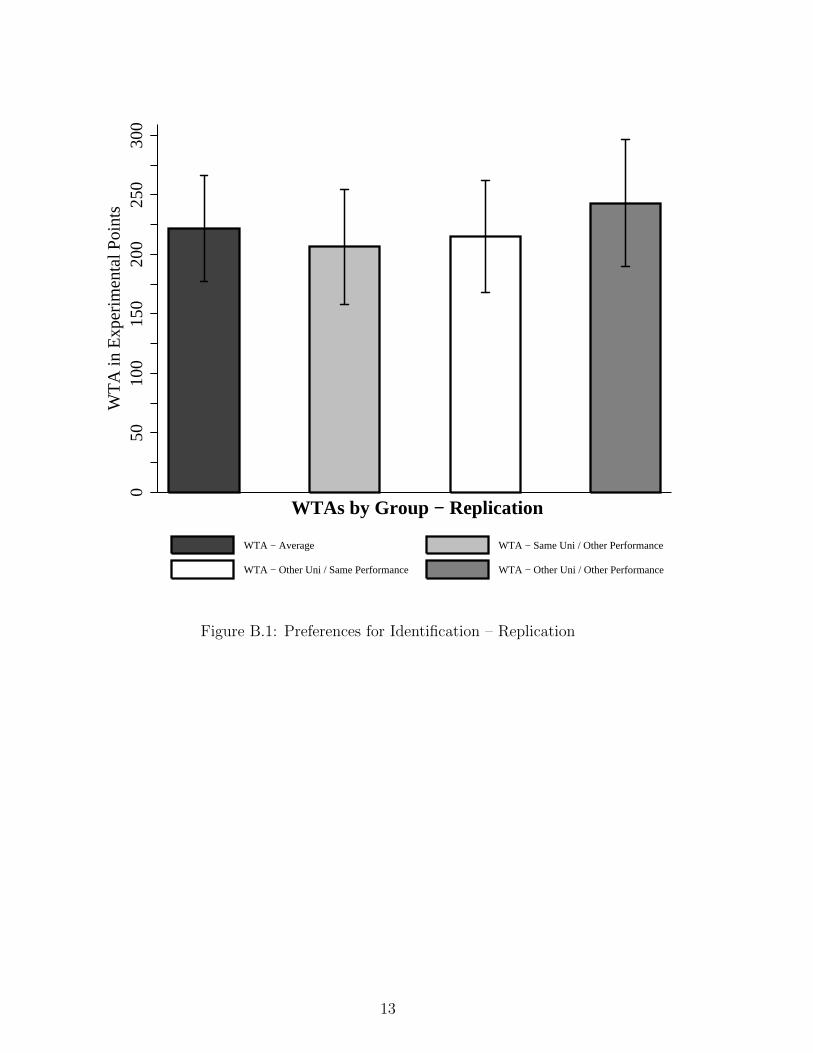
050
100
150
200
250
300
WT
A in
Exp
erim
enta
l Poi
nts
WTA − Average WTA − Same Uni / Other Performance
WTA − Other Uni / Same Performance WTA − Other Uni / Other Performance
WTAs by Group − Replication
Figure B.1: Preferences for Identification – Replication
13
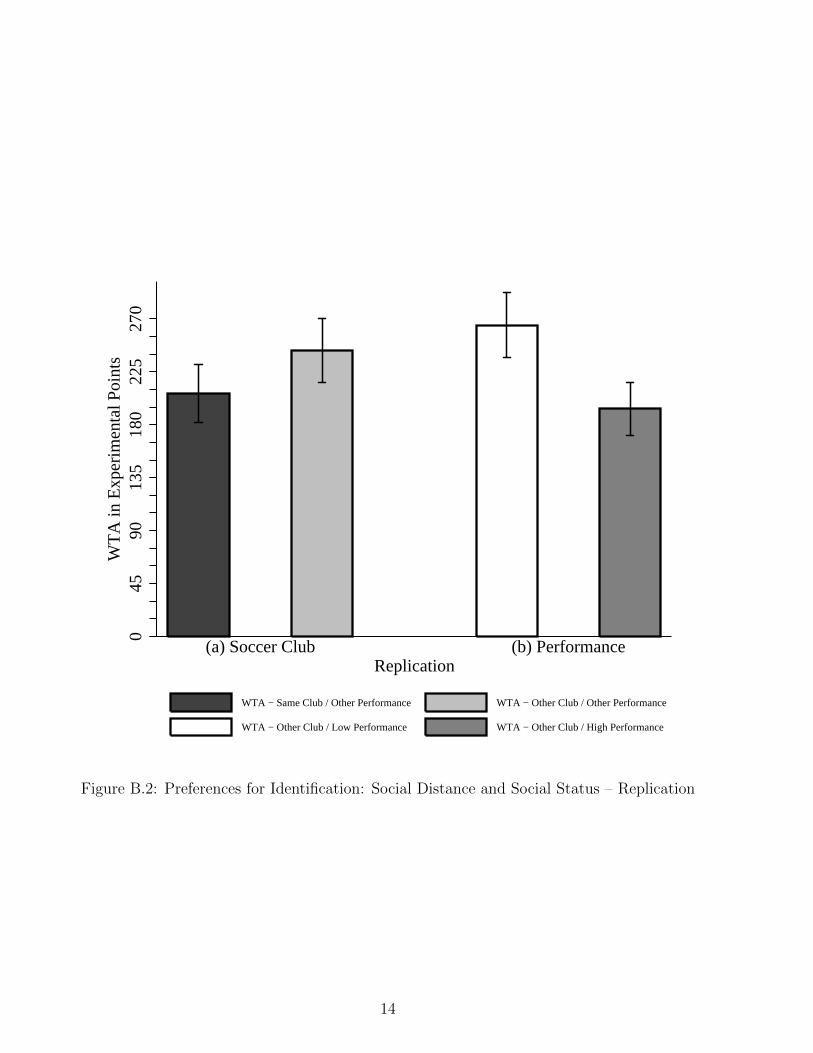
045
9013
518
022
527
0W
TA
in E
xper
imen
tal P
oint
s
(a) Soccer Club (b) PerformanceReplication
WTA − Same Club / Other Performance WTA − Other Club / Other Performance
WTA − Other Club / Low Performance WTA − Other Club / High Performance
Figure B.2: Preferences for Identification: Social Distance and Social Status – Replication
14
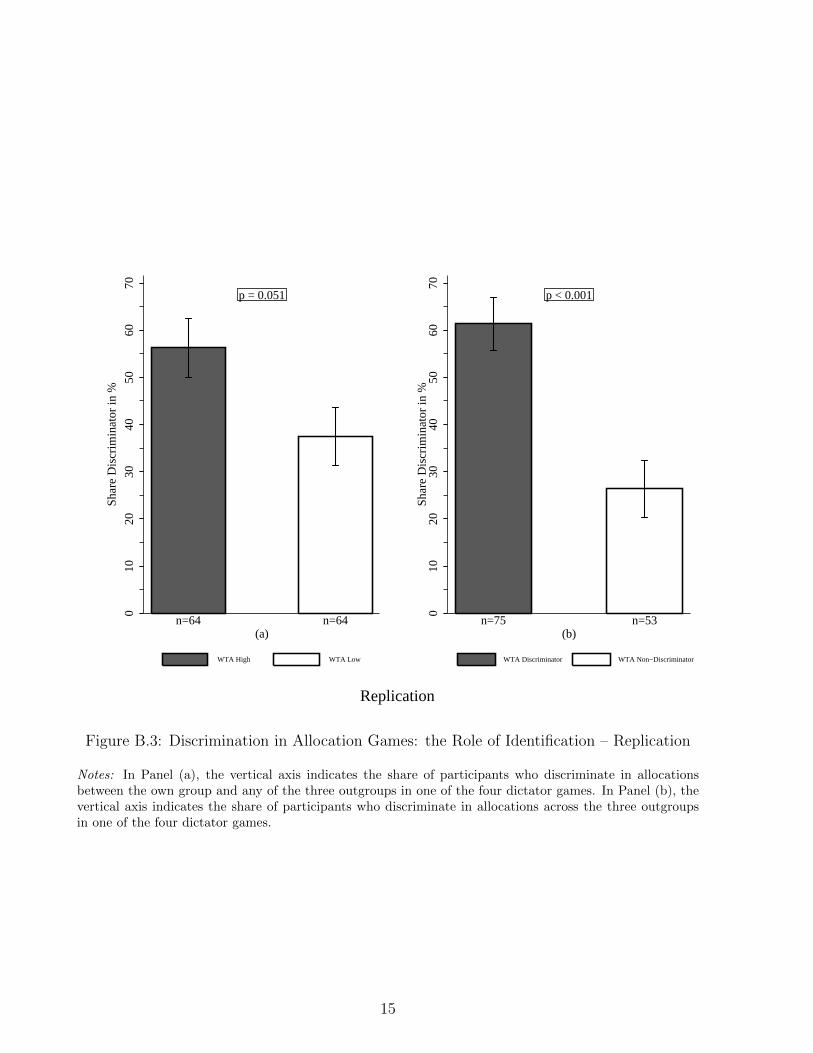
p = 0.051
010
2030
4050
6070
Sha
re D
iscr
imin
ator
in %
n=64 n=64(a)
WTA High WTA Low
p < 0.001
010
2030
4050
6070
Sha
re D
iscr
imin
ator
in %
n=75 n=53(b)
WTA Discriminator WTA Non−Discriminator
Replication
Figure B.3: Discrimination in Allocation Games: the Role of Identification – Replication
Notes: In Panel (a), the vertical axis indicates the share of participants who discriminate in allocationsbetween the own group and any of the three outgroups in one of the four dictator games. In Panel (b), thevertical axis indicates the share of participants who discriminate in allocations across the three outgroupsin one of the four dictator games.
15
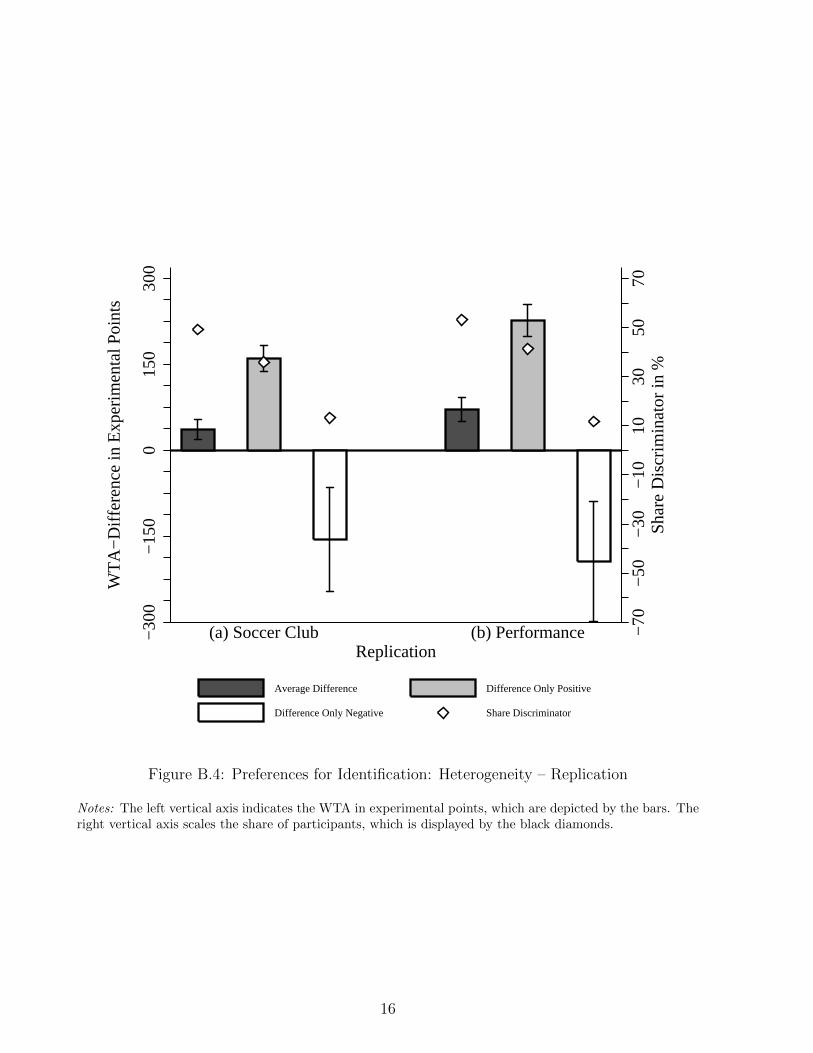
−70
−50
−30
−10
1030
5070
Sha
re D
iscr
imin
ator
in %
−30
0−
150
015
030
0
WT
A−
Diff
eren
ce in
Exp
erim
enta
l Poi
nts
(a) Soccer Club (b) PerformanceReplication
Average Difference Difference Only Positive
Difference Only Negative Share Discriminator
Figure B.4: Preferences for Identification: Heterogeneity – Replication
Notes: The left vertical axis indicates the WTA in experimental points, which are depicted by the bars. Theright vertical axis scales the share of participants, which is displayed by the black diamonds.
16
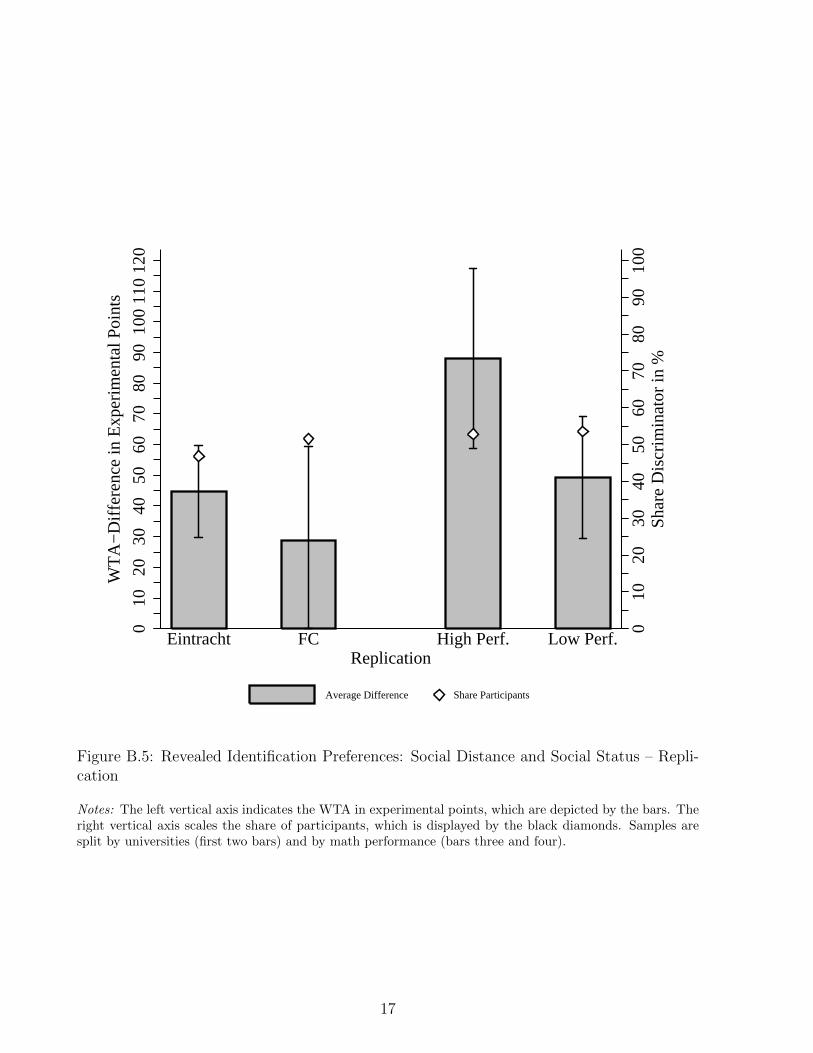
010
2030
4050
6070
8090
100
Sha
re D
iscr
imin
ator
in %
010
2030
4050
6070
8090
100
110
120
WT
A−
Diff
eren
ce in
Exp
erim
enta
l Poi
nts
Eintracht FC High Perf. Low Perf.Replication
Average Difference Share Participants
Figure B.5: Revealed Identification Preferences: Social Distance and Social Status – Repli-cation
Notes: The left vertical axis indicates the WTA in experimental points, which are depicted by the bars. Theright vertical axis scales the share of participants, which is displayed by the black diamonds. Samples aresplit by universities (first two bars) and by math performance (bars three and four).
17

Appendix C. Experimental Instructions
I. Experimental Instructions
General Instructions
Thank you for your participation in this scientific study. Please read through the instruc-
tions carefully. Everything that you have to know about the participation in this study will
be explained in the following. If you have any difficulties in understanding the instructions,
please raise your hand. We will then come to your place and answer your question.
For your appearance on time to participate in this study, you receive 4 Euro. Throughout
the experiment, you can earn additional money. Your earnings depend on your own decisions
and those of the other participants. You have to make your decisions on the screen.
This study takes place simultaneously at the universities of Frankfurt and Trier. The group
of participants thus consists of students from both universities that are present in the labs
either in Frankfurt or Trier.
In this study, you collect points and the amount of points that you additionally earn at the
end of the study depends on your decisions and those of the other participants. All points
that you earn throughout the study will finally be converted into Euros and paid out to you.
The exchange rate is the following:
100 Points = 1.00 Euro.
The amount of money that you earn will be paid out to you together with the 4 Euro in
cash at the end of the study.
Please note that, during the study, communication among participants is only allowed in the
prepared chat windows. All other form of communication is prohibited. We request you to
only use the open programs for the experiment. Communication with other participants as
well as other cases of interference will lead to your exclusion from the experiment.
Note that all the information you provide will be treated confidentially and will not be
given to third parties. The data only serves scientific purpose.
Please do now click the ‘Continue’-button and follow the instructions.
18

Instructions Stage I
In the beginning you are asked to do some calculations. In each exercise, you have to add
up three double-digit numbers.
Only when you solve the exercise correctly, the next exercise will appear.
You now have 90 seconds to solve as many exercises as you can.
Instructions Stage II
Within both universities, all participants are now assigned to four-person-groups, that is
either a red group or a blue group.
The selection into the groups depends on the number of exercises you have previously solved
correctly. The twelve best performing participants of each university will be allocated to one
of the blue groups whereas the twelve worst performing participants will be allocated to one
of the red groups.
So there are three blue groups and three red groups at each university and the blue group
members have answered more questions correctly than the red group members in round 1.
Neither you nor the other members of your group know each other’s identity.
Following group assignment, you are asked to solve three picture puzzles, one after the other,
such as the following. Each picture puzzle consists of four pictures that all have one main
theme in common. In the given example, this main theme would be ‘geometry’ (picture
top left: geometric body; picture top right: set square and compass; bottom left: geometric
functions; bottom right: theorem of Pythagoras).
For each picture puzzle, you have 60 seconds to discuss with the other members of your
group via the chat window. The chat messages sent by you are only visible for the members
of your group. You can only see the messages sent by your own group members. After the
one minute of discussion time you have 15 seconds to state your personal answer.
Note that you are allowed to exchange any content you want via the chat. However, it is
prohibited to give any hints about your own identity via the chat. Doing so can lead to your
exclusion from the experiment.
19
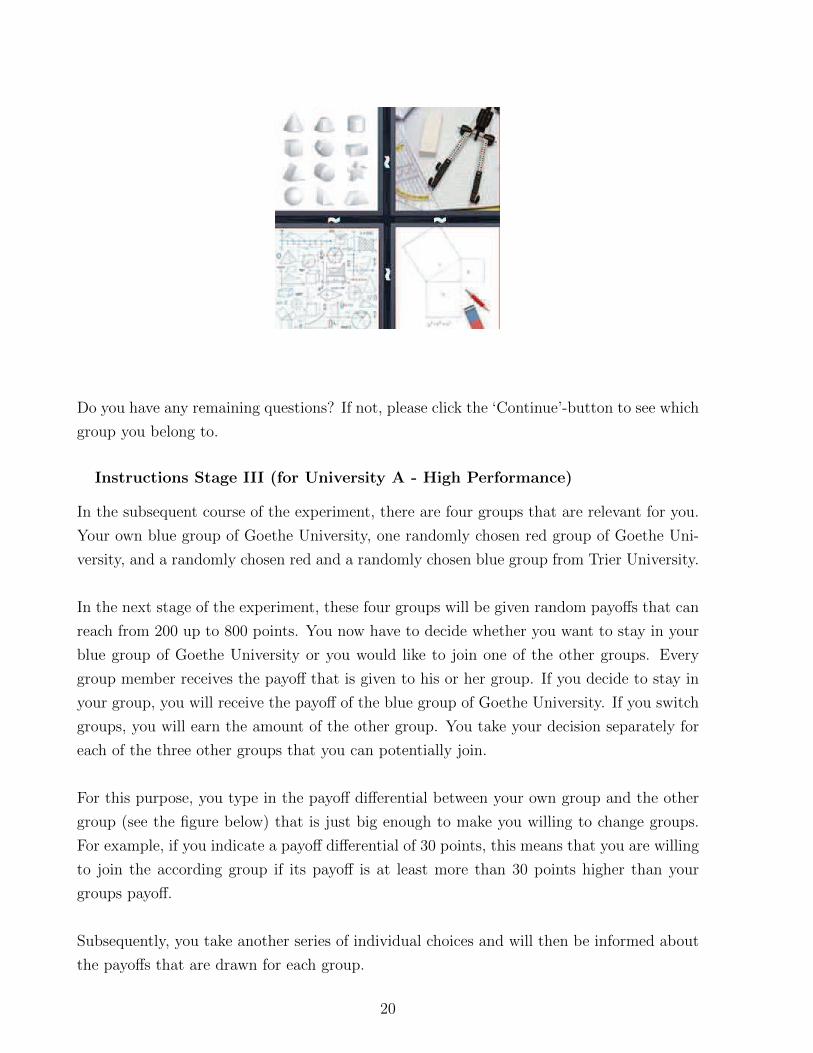
Do you have any remaining questions? If not, please click the ‘Continue’-button to see which
group you belong to.
Instructions Stage III (for University A - High Performance)
In the subsequent course of the experiment, there are four groups that are relevant for you.
Your own blue group of Goethe University, one randomly chosen red group of Goethe Uni-
versity, and a randomly chosen red and a randomly chosen blue group from Trier University.
In the next stage of the experiment, these four groups will be given random payoffs that can
reach from 200 up to 800 points. You now have to decide whether you want to stay in your
blue group of Goethe University or you would like to join one of the other groups. Every
group member receives the payoff that is given to his or her group. If you decide to stay in
your group, you will receive the payoff of the blue group of Goethe University. If you switch
groups, you will earn the amount of the other group. You take your decision separately for
each of the three other groups that you can potentially join.
For this purpose, you type in the payoff differential between your own group and the other
group (see the figure below) that is just big enough to make you willing to change groups.
For example, if you indicate a payoff differential of 30 points, this means that you are willing
to join the according group if its payoff is at least more than 30 points higher than your
groups payoff.
Subsequently, you take another series of individual choices and will then be informed about
the payoffs that are drawn for each group.
20
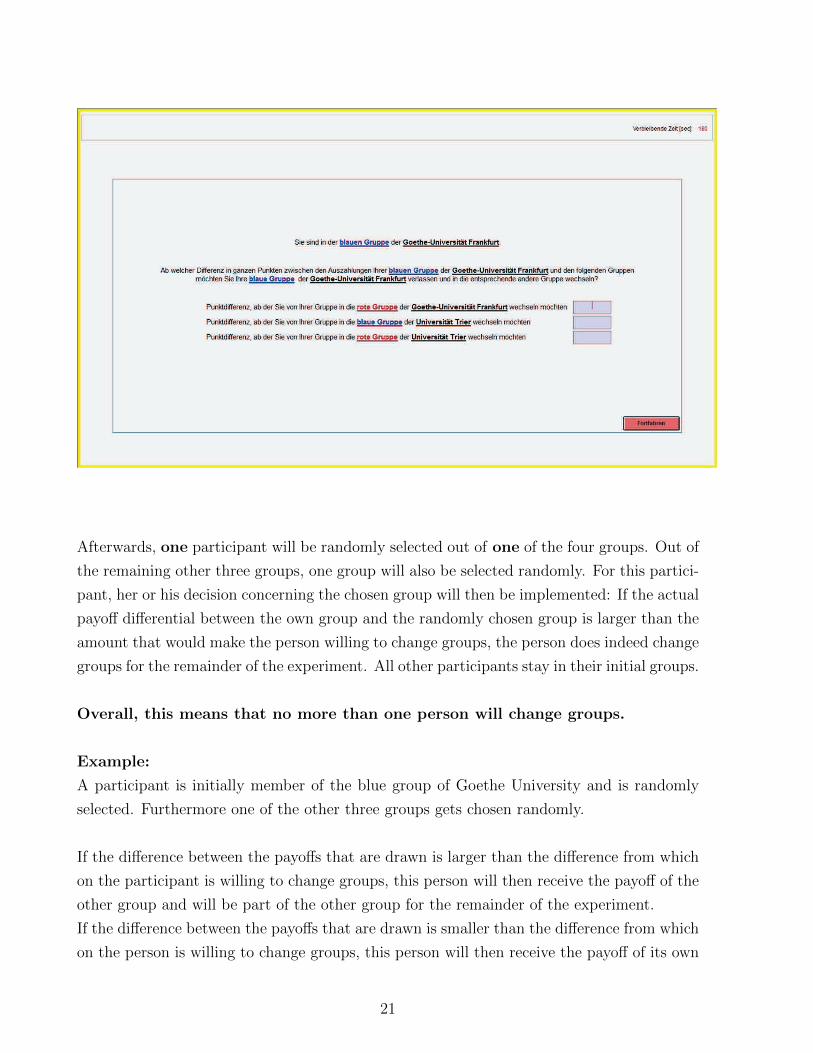
Afterwards, one participant will be randomly selected out of one of the four groups. Out of
the remaining other three groups, one group will also be selected randomly. For this partici-
pant, her or his decision concerning the chosen group will then be implemented: If the actual
payoff differential between the own group and the randomly chosen group is larger than the
amount that would make the person willing to change groups, the person does indeed change
groups for the remainder of the experiment. All other participants stay in their initial groups.
Overall, this means that no more than one person will change groups.
Example:
A participant is initially member of the blue group of Goethe University and is randomly
selected. Furthermore one of the other three groups gets chosen randomly.
If the difference between the payoffs that are drawn is larger than the difference from which
on the participant is willing to change groups, this person will then receive the payoff of the
other group and will be part of the other group for the remainder of the experiment.
If the difference between the payoffs that are drawn is smaller than the difference from which
on the person is willing to change groups, this person will then receive the payoff of its own
21
blue group of Goethe University and will stay in her or his initial group for the remainder
of the experiment.
In the following, there are three more examples for illustration:
Example 1: You indicate a payoff-differential of 210 points to the red group of Trier Uni-
versity and are randomly selected. The red group of Trier University gets selected as well.
The actual payoff for the red group of Trier University is 180 points higher than the payoff
for your own group (this means the differential is 180 points). Hence you do not change
groups.
Example 2: You indicate a payoff-differential of 100 points to the red group of Trier Uni-
versity and are randomly selected. The red group of Trier University gets selected as well.
The actual payoff for the red group of Trier University is 300 points higher than the payoff
for your own group (this means the differential is 300 points). Hence you change groups.
Example 3: You indicate a payoff-differential of 0 points to the red group of Trier Univer-
sity and are randomly selected. The red group of Trier University gets selected as well. You
change groups in case that the payoff for the red group of Trier University is at least as high
as the payoff for your own group.
After that, there are three more picture puzzles to solve in the potentially newly composed
groups. In case you change groups, you will solve the puzzles together with the members of
your new group. If you do not change groups, you will solve the puzzles together with the
members of your initial blue group of Goethe University.
Both the members of the blue group of Goethe University and the members of the other
group will be informed about a potential group member change.
Except for the possible new group arrangement, the rules for solving the puzzles remain
the same: You have again 60 seconds to advise with the other group members via chat and
afterwards have 15 seconds to type in your answer.
Do you have any remaining questions? If not, please click the ‘Continue’-button and answer
the control questions.
22
Instructions Stage IV (for University A - High Performance)
In the fourth stage of the experiment, you are asked to take some allocation decisions in four
different games.
In each game, the decisions you take and their consequences are independent of your deci-
sions in the other three games. This means that the decision you take in one game has no
influence on what you earn in another game.
In each game you are randomly matched with another anonymous participant. You take
your decisions in each game for four different scenarios:
• Your partner is member of your own group.
• Your partner is member of the red group of Goethe University.
• Your partner is member of the blue group of Trier University.
• Your partner is member of the red group of Trier University.
Your decision influences the payoff for your partner in the same way that her or his decision
influences your payoff.
In every game there are each two roles A and B.
At the end of the experiment one game (and your according role in this game) will be chosen
randomly to determine your payoff. Only now you will be informed about your partner’s
decisions in the according game. All games and both of the two roles A and B have the same
probability to be chosen.
Do you have any remaining questions? If not, please click the ‘Continue’-button and answer
the control questions.
Instructions Stage V
Please do now solve the following three picture puzzles. You again have 60 seconds to advise
with your blue group of Goethe University, before you give your answer.
23
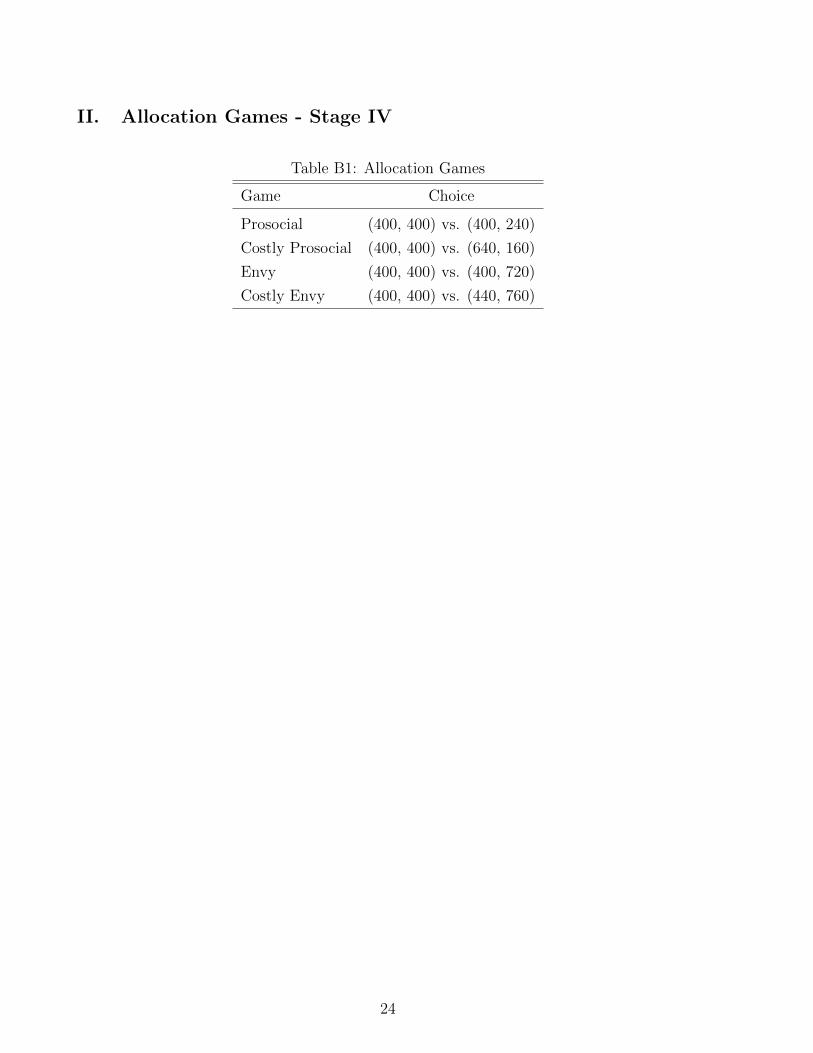
II. Allocation Games - Stage IV
Table B1: Allocation Games
Game Choice
Prosocial (400, 400) vs. (400, 240)
Costly Prosocial (400, 400) vs. (640, 160)
Envy (400, 400) vs. (400, 720)
Costly Envy (400, 400) vs. (440, 760)
24