número 27 | volume 14 janeiro - junho 2020 - revistas.usp.br
Upload
khangminh22Category
view
1download
0
RTA | ECA-USP | v. 28, n. 2, p. 224-244, May/Aug., 2017. 224
RTARevista Turismoem Análise
DOI: http://dx.doi.org/10.11606/issn.1984-4867.v28i2p224-244Revista Turismo em Análise - RTA | ISSN: 1984-4867
Articles and essays
224
a. Master’s degree in Administration at the Centro Universitário Una. Specialist in Public Management from Universidade Estadual de Minas Gerais (UEMG). Specialist in Strategic People Management from Centro Universitário Una. Graduated in Pedagogy from Universidade Federal de Minas Gerais. Belo Horizonte, Minas Gerais, Brazil. E-mail: [email protected]
b. PhD in Administration from Universidade Federal de Minas Gerais (UFMG). Master’s degree in Administration at the UFMG. Graduated in Information Technology from Universidade Federal de Viçosa. Specialist in Information Technology from Universidade Federal de Viçosa. Belo Horizonte, Minas Gerais, Brazil. E-mail: [email protected]
c. PhDinAdministrationfromUniversidadeFederaldeLavras(Ufla).Master’sdegreeinAdministrationatUfla.GraduatedinVeterinaryMedicineatUfla.SpecialistinInformationTechnologyinAgricuturefromUfla.BeloHorizonte,MinasGerais,Brazil.E-mail:[email protected]
Choosing a Restaurant: important attributes and related features of a consumer’s decision making process
Lorna das Graças Martins Rosa Pires Pinheiro de Azevedoa
Luiz Rodrigo Cunha Mourab
Gustavo Quiroga Soukic
Abstract
Theidentificationoftheattributesconsideredbyconsumersintheirdecision-makingprocess is a competitive factor for organizations and consists of a field of research on the products and services available on the market. This study aimed at identifyingwhicharetheattributesandrelatedfeaturestakenintoaccountbyconsumersintheirdecision-makingprocessforchoosingarestaurant.Twostudieswerethusconducted,the first being a qualitative study based on interviews with 23 restaurant consumers. The research contributions were used for the development of a questionnaire for the second study carried out in the city of Belo Horizonte, Brazil, in March 2014, which consisted of a survey made up of a sample of 600 customers of fast-food restaurants, continuous service (all-you-can-eat restaurants), buffet, and a la carte, totaling 438 valid questionnaires analyzed statistically, obtaining 12 groups with 46 attributes (service, beauty, comfort, nearby location, convenient location, choices, children, convenience, offers, perceived value, entertainment, and queue). On food evaluation, two groups were identified (organoleptic and presentation), regarding beverages, a single group was formed for seven indicators. The attributes on hygiene, food quality, service, and price made up the list of the most important aspects in the consumers’ decision-makingprocessforchoosingarestaurant(fast-food,continuousservice–“all-you-can-eatrestaurants”–,buffetanda la carte). The identification of these attributes showed similarities between the restaurants surveyed and allowed the comparison of results with other surveys conducted in that field.Keywords: Consumerbehavior;Productattributes;Consumer’sdecision-makingprocess;Restaurant.

RTA | ECA-USP | ISSN: 1984-4867 v. 28, n. 2, p. 224-244, May/Aug., 2017.
Choosing a Restaurant
225
ResumoEscolhendo um Restaurante: atributos importantes e suas respectivas dimensões consideradas no processo de decisão do consumidorA correta identificação dos atributos considerados pelos consumidores em seu processo decisório de compra é um fator de competitividade para as organizações, bem como constitui um campo de conhecimento teórico sobre produtos e serviços existentes no mercado. Este trabalho buscou identificar quais são os atributos, e suas respectivas dimensões, considerados pelos consumidores em seu processo decisório para a escolha de restaurantes. Para tal, foram realizados dois estudos, sendo o primeiro um estudo qualitativo baseado em entrevistas com 23 consumidores de restaurantes. As contribuições dessa pesquisa foram utilizadas na elaboração do questionário usado no segundo estudo na cidade de Belo Horizonte em março de 2014. O questionário consistiu em um levantamento com amostra de 600 consumidores em restaurantes fast food, rodízio, self service e a la carte, resultando em 438 questionários válidos que foram analisados estatisticamente, obtendo-se 12 grupos formados a partir de 46 atributos (atendimento, beleza, conforto, localização próxima, localização conveniente, possibilidade de escolha, crianças, comodidade, promoções, valor percebido, entretenimento e fila). Na avaliação da comida, foram identificados dois grupos (organoléptica e apresentação) e no caso das bebidas foi gerado somente um grupo formado por sete indicadores. Os atributos relacionados à higiene, qualidade da comida, atendimento e preço compõem a lista dos aspectos mais importantes no processo decisório do consumidor dos restaurantes (self service, rodízio, fast food e à la carte). A identificação desses atributos revelou similaridades entre os restaurantes pesquisados, além de possibilitar a comparação dos resultados obtidos com outras pesquisas realizadas na área.Palavras-chave: Comportamento do consumidor; Atributos do produto; Processo decisório do consumidor; Restaurante.
ResumenEligiéndose un Restaurante: atributos importantes y sus respectivas dimensiones del proceso de toma de decisiones del consumidorLa identificación de los atributos que son considerados por los consumidores en su proceso de toma de decisiones es un factor de competitividad para las organizaciones y consiste en un campo de investigación sobre los productos y servicios disponibles en el mercado. Este estudio tuvo como objetivo identificar cuáles son los atributos y características relacionadas que son tomados en cuenta por los consumidores en su proceso de toma de decisiones para elegir un restaurante. Dos estudios se llevaron a cabo por lo tanto, siendo la primera un estudio cualitativo basado en entrevistas con 23 consumidores de restaurantes. Se utilizaron las contribuciones de la investigación en la elaboración de un cuestionarioparaelsegundoestudio–enlaciudaddeBeloHorizonte,Brasil,enmarzode 2014–, que consistió en una encuesta realizada con una muestra de 600 clientesde los restaurantes de comida rápida, servicio continuo (todo-lo-que-puedas-comer restaurantes), buffet y a la carta, por un total de 438 cuestionarios válidos analizados estadísticamente, obteniendo 12 grupos con 46 atributos (servicios, belleza, comodidad, cerca de la ubicación, ubicación conveniente, opciones, niños, conveniencia, ofertas, valor percibido, entretenimiento y cola). En la evaluación de alimentos, se identificaron dos grupos (organoléptica y presentación) y en la evaluación de las bebidas se formó un solo grupo de siete indicadores. Los atributos con respecto a la higiene, la calidad de la comida, servicio y precio componen la lista de los aspectos más importantes en el proceso de toma dedecisionesdelconsumidorderestaurantes(comidarápida,serviciocontinuo–todo-lo-que-puedas-comerrestaurantes–,buffetyalacarta).Laidentificacióndeestosatributosmostró similitudes entre los restaurantes encuestados y se les permitió la comparación de los resultados con otros estudios realizados en este campo.Palabras clave: Comportamiento del consumidor; Atributos del producto; Proceso de toma de decisiones del consumidor; Restaurante.
RTA | ECA-USP | ISSN: 1984-4867 v. 28, n. 2, p. 224-244, May/Aug., 2017.
Azevedo L. G. M. R. P. P., Moura L. R. C., Souki G. Q.
226
introduction
The word “restaurant” originated in France, in the sixteenth century, todescribe the business houses that provided restoring food, which consisted of a soupthatrehabilitatedthesick(Ferreira,Valduga&Bahl,2016;Spang,2003).Initially, the act of eating had the unique purpose of meeting the nutritional needs of the person. However, eating became responsible not only for satisfying a person’s hunger over time, but also to satisfy hedonic desires through meals (Ferreira,Valduga&Bahl,2016;Barreto&Senra,2001;Jesus,2005).Inaddition,the number of people who eat out increased largely, thus generating variety of restaurantsthatmeetthedesiresofdifferentmarketsegments(Leal,2010).
Data from the Brazilian Household Budget Survey (POF), organized by the Brazilian Institute of Geography and Statistics in 2008-2009 (IBGE, 2010) indicate that more than 30% of the Brazilian food expenditures were made out of home. Moreover, in recent years, food services had a higher growth than the sale of food products in retail (Carneiro, 2012).
From that phenomenon, this study presents the following question: which are the attributes and related level of importance in consumers’ decision-makingprocess to chose a restaurant? The main objective is to identify the attributes andtheirlevelofimportancetoconsumersinthedecision-makingprocessforthe choice of restaurants. In addition, other important objectives are to group these attributes in similar dimensions or corresponding factors and validate them statistically. A total of 600 questionnaires were collected in Belo Horizonte, a metropolis of Brazil’s southeast region, in March 2014.
The theoretical contribution of this study refers to the development of issues related to consumer behavior and the relevance of the attributes related to the areaoffoodservicesandidentifiedbyconsumers.Inaddition,itmotivatesthescientificcommunitytoexplainthephenomenaofthisexpandingsectorinBrazil.
Previous studies have already addressed restaurants, identifying aspects and attributes that create value for consumers, such as the ones by: Singh (2006), whichidentifiedhowcolorscanbeusedbymanagerstoincreaseordecreaseappetite, improve mood, calm down consumers and reduce the perceived waiting time,forexample;Park(2004),whichsoughttomeasuretheattributes,aswellas utilitarian and hedonic values at Korean fast-food restaurants; and Glanz et al. (2007),which described the process, motivation, and challenges of offering healthier options in restaurant menus. Furthermore, the diversity of options tends to complicate thedecision-makingprocess.Therefore, researchers getmoreinterestedinunderstandingconsumerbehavior,henceseekingtoidentifythe relevant attributes in the evaluation and choice of a restaurant among the existingoptions(Aguiar&Carvalho,2010;Leal,2010).Themisidentificationof attributes generates difficulties inmeasuring the quality of the providedservice (Deng, 2008).
This study may also provide better understanding on the factors that influence the choiceof restaurant, inmanagement terms, also contributing tocompanies, which will know what generates value for consumers. From thisinformation, companies can tailor their characteristics, such as the place they operate, products, brands, price and payment terms, advertisements and sales, among other features. They may, therefore, prioritize their efforts to meet the

RTA | ECA-USP | ISSN: 1984-4867 v. 28, n. 2, p. 224-244, May/Aug., 2017.
Choosing a Restaurant
227
most important attributes, according to the consumers, promoting the creation of competitive advantages opportunities in the area of operation.Furthermore, the identification of the relevant attributes according to
consumers is essential. Through a list of attributes, it is possible to improve the restaurant’smarketing process based on consumer needs, thus creatingvalue(Angnes&Moyano,2013;Aguiar&Carvalho,2012),contributingtotheimprovement of perceived quality and, therefore, to consumer satisfaction andloyalty(Angnes,Lengler&Moyano,2015).Companiesshouldfocustheireffortsonidentifyingattributesandbenefitsthatimprovetheirperformanceand bring satisfaction to consumers. The essential investment must be on the aspect that has high importance and low performance, i.e., aspects that can be improved and have more impact on consumer satisfaction and loyalty. High performance and impact aspects become a competitive advantage for the company(Gustafsson&Johson,2004),whileensuringconsumersatisfactionbecomescrucialtothecompaniesforstayingonthemarket(Mouraetal.,2007).Infinancialterms,thefoodservicesector(restaurants,bars,coffeeshops,and
evenmealsservedatsupermarkets)earnedR$235billionin2012,agrowthof16% compared to 2010 (Carneiro, 2014). The importance of the food service sector in the national economic context, coupled with fierce competitionamong the wide variety of types and existing establishments options, as well as, especially, the constant need for new consumers to ensure survival in a highly competitivemarket,demandthe identificationofcriteriabywhichconsumersevaluate service excellence in a restaurant.
literature review
New habits are developed in society with the creation of new products, cultural, social and technological factors, consumer’s needs, andmodificationontherelevanceofattributes(Aguiar&Carvalho,2012;Gomes&Hein,2011).Therefore,oneofthemaintasksofmanagersistoidentifythereasonsthatleadconsumerstopurchaseaproduct(Espinoza&Hirano,2003).
By analyzing the options among the different types of available products, services, brands, and stores, the consumer compares process between the already known itemsandwhat isconsidered important tomeetconsumers’needs.Theassessmentcriteriausedinthisprocessvaryaccordingtoeachperson(Blackwell,Engel&Miniard,2005),andthemaintypesaretheattributesorcharacteristicsofthegoodorservice,thebenefitsofitsuseoreventhevaluestheyhelpconsumerstomeetorachieve(Olson&Peter,2009).Theproductsmust,therefore,beevaluatedfromthesumofattributes,benefits,andvalues.Ingeneral,attributesarerelatedtotangiblefeaturesthatintegratethepreferencecreation,whilebenefitscorrespondto utility and performance of the good/service (Espartel, 1999).
Figure 1 – Consumer’s Cognitive Structure
Solidattributes
Abstractattributes
Functionalbenefits
Psychologicalbenefits
Instrumentalvalues
Endvalues
Source – adapted from Wu, Day and MacKay (1988)

RTA | ECA-USP | ISSN: 1984-4867 v. 28, n. 2, p. 224-244, May/Aug., 2017.
Azevedo L. G. M. R. P. P., Moura L. R. C., Souki G. Q.
228
On the other hand, solid and abstract attributes and instrumental and end values represent a short chain of four levels. Even with this change, the function of the model is preserved as being the provision of analysis of the consumer knowledgeunder the influenceof attributesand its impacton theperceptionof benefits and values/risks. The rational structures of means and ends aredescribed in that model, in which solid attributes (corresponding to the physical characteristics of the product) are linked to abstract attributes (intangibleaspects, such as quality), functional benefits (tangible benefits of using theproduct),psychologicalbenefits(socialandpsychologicalbenefitsofusingtheproduct),instrumentalvalues(behavior),and,finally,endvalues(wayofbeing).Theattributesare,therefore,takenasthemaininfluenceonconsumers’decision--making process, according to their experiences, values and beliefs (Peter &Olson,2009).Thepurchasedecisionisinfluencedbytheassessmentofintrinsic(composed by tangible characteristics, such as design, durability, and size) and extrinsic attributes (intangible characteristics of a product, such as price and brand) (Zeithalm, 1988).
Regarding services, some attributes are more relevant than others on the consumer’s perception of value. That influence may come from the level ofimportance given by the consumer to these attributes. Identifying these critical attributeslinkedtosatisfactionenablesthesegmentationandadaptationoftheservice provision for its audience. This adaptation favors the evaluation of the quality and satisfaction of service, as well as the implementation of improvements andadaptations(Ghisi,Merlo&Nagano,2006;Mowen&Minor,2003;Espinoza&Hirano,2003).
There are several ways of categorizing attributes (Grohmann, Battistella & Schoedler, 2012). For example, consumers use three different categories ofattributesduringtheirbuyingprocess(Zeithalm,Bitner&Gremler,2014):
a) Search attributes: product features that consumers can immediately evaluatebeforepurchase,whichreducethepurchaseriskperception.Thelocation of a restaurant, image and reputation in social media, tangible aspects,amongothers,arespecificfeaturesforrestaurants.
b) Experience attributes: performance of the product that consumers can evaluate only during service delivery. Regarding restaurants, it is representedbytheservice,foodanddrink,amongothers.
c) Trust or credibility attributes: characteristics of the product that consumers may not be able to evaluate even after purchase and consumption. They are related to trust or credibility of the company or brand. Regarding restaurants, it is presented in the manufacturing process of the dishes, suppliers’ reliability, storage conditions, and others.
Basedontheforegoingclassification,itispossibletodescribethecredibilityattributesasthemostdifficulttobeassessedbyconsumers.Thetangibilityoftheservicedirectly influences theprevalenceof some typesofattributes,andthe“mosttangible”servicesthushaveahigheramountofsearchattributesandexperienceattributes(Zeithalm,Bitner&Gremler,2014).
RTA | ECA-USP | ISSN: 1984-4867 v. 28, n. 2, p. 224-244, May/Aug., 2017.
Choosing a Restaurant
229
Restaurant consumers often evaluate different criteria, related to food quality, prices,andotherbenefitsthatgeneratevalue(Harrington,Ottenbacher&Kendall,2011). This is consistent with the perception of the wide range of products/services from which consumers can choose from, to meet their needs. In this process, relevant information are selected, integrated, and judged, concerning brand and other aspects, thus arriving at a judgment that will set the purchase (Espinoza & Hirano, 2003), while themost common approach to be used byconsumers is the use of products and services’ attributes to evaluate alternative options andmake their decision. Thismethod is defined as amulti-attributeapproach (Grunert, 1989).
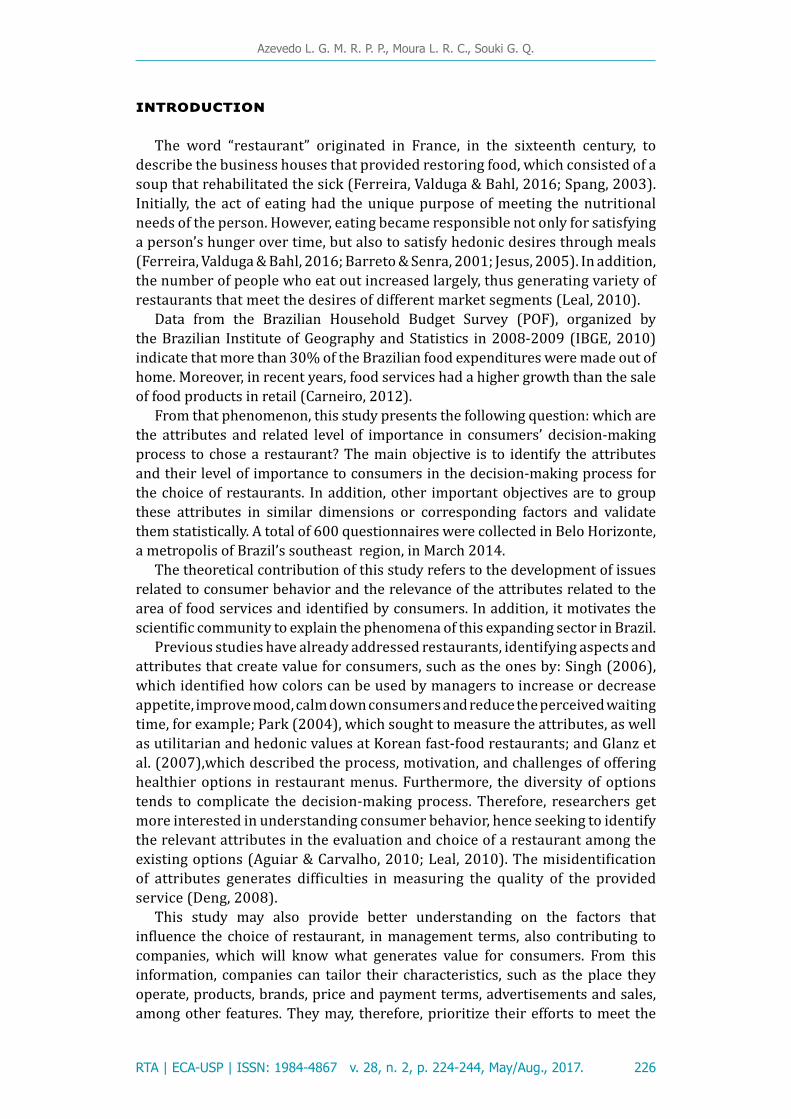
Consumers constantly monitor the attributes considered relevant, such as quantity, size, quality, and price. Changes in these indicators may directly affect brandandproductchoices(Blackwell,Engel&Miniard,2005).Zeithaml (1988) proposes a model to identify this trend that seeks to
understand what consumers consider to be quality, value, and price. The model is set to measure how the concepts of perceived price, quality, and value influence the purchase decision,with a direct relationship between productattributes, both intrinsic and extrinsic. These aspects integrate the perceptions of quality, price, and value of the different alternatives considered at the purchasemoment. People can identify the presence of benefits (or absenceofsacrifices)throughtheattributes,thusformingageneralperceptionoftheproduct (Portolan, 2011).
Figure 2 – A model relating price, quality, and value
Extrinsic attributes
High level of abstraction
Intrinsicattributes
Intrinsic attributes
Perceivedsacrifice
PurchasePerceivedprice
Direct price
Low-level attributes
Perception oflow-levelattributes
High-levelattributers
Pecuniaryprice
Non pecuniary
cost
Perceivedquality
Source – adapted from Zeithaml (1988)
This model, proposed by Zeithaml (1988), is based on the intrinsic and extrinsic attributes, and the price is divided between the neutral price (refers to the monetary price) and perceived price (corresponding to cheap or expensive

RTA | ECA-USP | ISSN: 1984-4867 v. 28, n. 2, p. 224-244, May/Aug., 2017.
Azevedo L. G. M. R. P. P., Moura L. R. C., Souki G. Q.
230
evaluation). This model shows the connection between the purchase decision process and the assessment of intrinsic and extrinsic attributes of the product by the consumers, who perceive the standards of quality, price, and value of the different alternatives at the purchase time (Borges, 2010). The question made referstotheidentificationofwhichattributes(intrinsicorextrinsic)ofaproductthe consumers use as quality indicators (Espartel, 1999).Thisarticlepresents twosurveys,with twodifferentapproaches.The first,
is exploratory and qualitative, while the second, is descriptive and quantitative.
study 1
Methodology
Inthefirststudy,23individualswhooftengotorestaurantswereinterviewed,using a convenience sample. The research script consisted of open-ended questions regarding general attributes (e.g., what is important in a restaurant, what cannot be missing etc.), price (e.g., how it can be an indicator of quality, why would they pay more etc.), food/beverage (e.g., which are the desirable characteristics etc.), behavioral (e.g.: how to encourage word of mouth advertising etc.), offers (e.g., discounts granted by restaurants etc.), environment (e.g.., which are the best physical characteristics, how the restaurant should be etc.), cleaning (e.g., importanceofhygiene,howtheyevaluatethehygieneetc.),parking(e.g.,whetherparkingisimportantornot,whenisparkingrelevantetc.),security(e.g.,what creates security and insecurity etc.), entertainment (e.g., which attractions do they value, entertainment for children etc.), service (e.g., what good service is, what they value the most, what please or displease etc.), location (e.g.: the importance of location, what does it mean to be well located etc.).Todeveloptheinterviewscript,weconsultedmarketingexperts,aswellas
literature on consumer behavior at restaurants, based on Angnes and Moyano (2013), Liu and Jang (2009), Tinoco and Ribeiro (2008), Namkung and Jang(2008), Siebeneichler et al. (2007), Rodrigues and Sabes (2006), Andaleeb and Conway(2006),MehtaandManiam(2002),andYukselandYuksel(2002).
The content analysis proposed by Bardin (1977) was used for better data understanding, which covers the thematic categorization of discourse, allowing the organization of the most cited attributes by the respondents.
Data analysis and results achieved
We obtained 12 dimensions, formed by several attributes, through content analysis:
• Price: cost, benefit, payment method, credit card, debit card, cash, foodvouchers,restaurantcoupon,companybenefitscard,bankcheck,fairprice,price, price-performance, variety of payment methods, and good price.

RTA | ECA-USP | ISSN: 1984-4867 v. 28, n. 2, p. 224-244, May/Aug., 2017.
Choosing a Restaurant
231
• Food,consistingof:eat,drink,goodfood,meal, lunch, food,healthyfood,variety in dishes options, good menu, food quality and attractive taste, good seasoning, excellent variety of foods on the menu, variety, quality and taste of the food, varied menu, bad food, varied seasoning, problem in food preparation,flavor/taste,brand,aspect,quality,variety,presentation,andfeeling of being a fresh and clean product.
• Behavior: leaving, comfort, tranquility, comfort, satisfaction in eating, pleasure to be in good company, happiness, joy in satisfying hunger, comfort, daring, glamor, relax, gluttony, concern with general hygiene, fear of food quality, frustrationwiththetasteandseasoning,feelingofdisorganization,lackofpeace and quiet due to excessive noise, sadness and dissatisfaction with service, rudeness, waiter/chef’s suggestion, spouses/valentines, and family and friends.
• Offers: discounts, gifts, feeling of winning, feeling of advantage, attractive, satisfied consumers, generate loyalty to the establishment, attract newconsumers, represent a sign of attention and thank the consumer forattending the restaurant, relationship program, consumer bonus with points to exchange for products or free meals on birthdays or even free dessert.
• Environment: comfort, sophistication, coziness, beauty, utensils, cozy atmosphere that offers a pleasant experience, good taste in decor, adequate lighting, air conditioning, good ventilation, comfort, enough space for foot trafficbetweentablesandchairs,comfortablefurniture,provideprivacyatmeal time,beautyanddecoration,unpreparedwaiters,darkplace,noisy,crowdedplace, lackoftablesandchairstomakethemeal,andproximitybetweensmokingandnon-smokingareas.
• Cleaning: clean place, hygiene, cleanliness/hygiene in the rooms (hall, bathroom, kitchen,facade,parkingetc.),utensils(plates,glasses,cutlery,traysetc.),furniture(tables,chairs,buffetsetc.),goodhygiene,appearanceoftherestaurant,lackofcleanliness, conservation problems in food, feelings of disgust, objects located inthefood,dirty,poorhygieneattherestaurant,lackofcleanlinessinfoodpreparation, and ingredients that do not match the dish chosen.
• Parking:parking,notbotheringtofindaplacetoparkneartherestaurant,convenience, safety of consumers who have cars, do not want to leave the caronthestreetorinoutsourcedparkingneartherestauranttobeattendedasjustification,parkingspace,andtopark.
• Security:security,secureplace,dangerous,darkplace,andremoteandnon--trustable location.
• Entertainment: having fun and a moment for relaxing, television to watch the news, children’s playground, music, happy hour, dinner, special dates (Mother’sDay,Valentine’sDay,andChildren’sDay),weekends,nice,relaxed,music volume must be low, allowing the conversation between people and hearing the television.
RTA | ECA-USP | ISSN: 1984-4867 v. 28, n. 2, p. 224-244, May/Aug., 2017.
Azevedo L. G. M. R. P. P., Moura L. R. C., Souki G. Q.
232
• Service:service, line,quickness,servicequality,well-trainedand friendlystaffwholiketowork,goodorganizationof therestaurant,goodservice,organization, wrong order, service delay, lining up to serve and pay for the meal, delay for preparing the food, problems with the card machine, and minimumpriceforpayingbycardorcheck.
• Drink:varietyofbeverages,alcoholicbeverages,non-alcoholic,beer,soda,wine,champagne,sparklingwater,mineralwater,andnaturaljuice.
• Location: good location, location, distance, near and far.
study 2
Methodology
Thesecondsurvey–ofdescriptiveandquantitativeapproach–wasconductedaftertheanalysisofthefirstsurvey’sdata.Thedatawereusedfortheformulationof the questions, using a scale of 11 points, with extreme points accounting for “stronglydisagree”and“stronglyagree”fromstatements,whichbeganwiththephrase“myperceptionofimportanceregarding…”.Thescalewith11pointswaschosen as it can register with accuracy and detail when the respondents change theirminds(Nunnaly&Bernstein,1994).Beforethefieldwork,thequestionnairewas pretested, which led to the implementation of minor changes.The final version of the questionnaire consisted of 46 attributes regarding
restaurants,11attributesregardingfood,7attributesrelatedtodrinksandsomebehavioral and demographic questions.
Consumers of fast-food restaurants, continuous service (all-you-can-eat restaurants), buffet and a la carte were chosen to compose the sample. Despite having differences in the importance of the attributes for each type of restaurant, the aim of the research was to identify the dimensions or factors considered by consumers when choosing a restaurant. We decided, therefore, to choose the fourmostsignificantcategories,basedontheopinionofthemarketingexpertsconsulted. A total of 600 questionnaires were collected in Belo Horizonte, a metropolis of Brazil’s southeast region, in March 2014.
data analysis
Characteristics of the sample and data processing
By analyzing all the 600 questionnaires, inconsistencies were found in 162 of them. As a result, the 438 valid questionnaires were divided for each type of restaurant, as follows: 106 for a la carte restaurants (24.2%), 108 for buffet restaurants (24.7%) and 112 questionnaires for fast-food and continuous service restaurants(25.6%).
Regarding the respondents, 222 are female and 216 are male. Singles are themajority,totaling222cases–about50.7%–,followedby183marriedorin

RTA | ECA-USP | ISSN: 1984-4867 v. 28, n. 2, p. 224-244, May/Aug., 2017.
Choosing a Restaurant
233
stable union respondents, about 41.8%. Over 60% of respondents received up to five times theminimumwageand thevastmajority completedelementaryeducation or are in higher education. Considering the behavior as a consumer, thelargestgroupofrespondents–over46%–havebeengoingtotherestauranttheyfilledoutonthequestionnaireformorethan10yearsandover60%havebeen attending this type of restaurant for less than a month; also for over 60% of respondents,thereisnotaspecifictimeforgoingtothisrestaurant.Regardingmissingdata,therewasnotanyquestionthatshowedupto5%of
missingdata,whichindicatesthattheseissuescanbekeptforanalysis(Hairetal.,2009).ThevalidityofthesampleswascheckedthroughKolgomorov-Smirnovtest (Malhotra, 2011), and no sample had normal distribution. Finally, the verificationofoutlierswasperformedbycalculatingthedistance,usingtheD2 of Mahalanobis, with 64 degrees of freedom for the chi-square test. When analyzing the samples from the four restaurants separately, no multivariate outlier was found. As subsequent analyses used the samples of the four types of restaurants, these outliers were removed from the analyzed sample.
Dimensionality, reliability and validity
First, an exploratory factor analysis (EFA) was performed with the 46 attributes regarding the restaurant, 11 attributes regarding food, and 7 attributes regardingdrinks.Asfortherestaurants,the46attributesweregroupedinto12 dimensions (service, beauty, comfort, nearby location, convenient location, choices, children, convenience, offers, perceived value, entertainment, and queue), totaling 33 items. For food, the 11 attributes for the assessment of food were grouped into two dimensions (organoleptic and presentation), totaling eightitems.Finally,fortheevaluationofthedrinks,thesevenattributesweregrouped into only one group. In the case of organoleptic characteristics, the perceptionoffoodisconsideredthroughthefivesenses–smell,color,beauty,brightness, and others.ConcerningtheassumptionsforperformingEFA:(1)Barlett’sSphericityTest–
measuring correlations between variables (Hair et al., 2009), in which a favorable resultistheonethatpresentsasignificantcorrelationof95%(Morgan&Griego,1998);(2)AdequacyofsampleKaiser-Meyer-Olkin(KMO)–shallpresentvaluesabove 0.80, being accepted values above 0.60 (Malhotra, 2011; Hair et al., 2009) forexploratorystudies;(3)significantcorrelationsbetweentheitemsthatformthe constructs, which showed adequate results. All assumptions of EFA are met and the values of the components have very good values. Moreover, only items with value above 0.40 of commonality were retained.
RTA | ECA-USP | ISSN: 1984-4867 v. 28, n. 2, p. 224-244, May/Aug., 2017.
Azevedo L. G. M. R. P. P., Moura L. R. C., Souki G. Q.
234
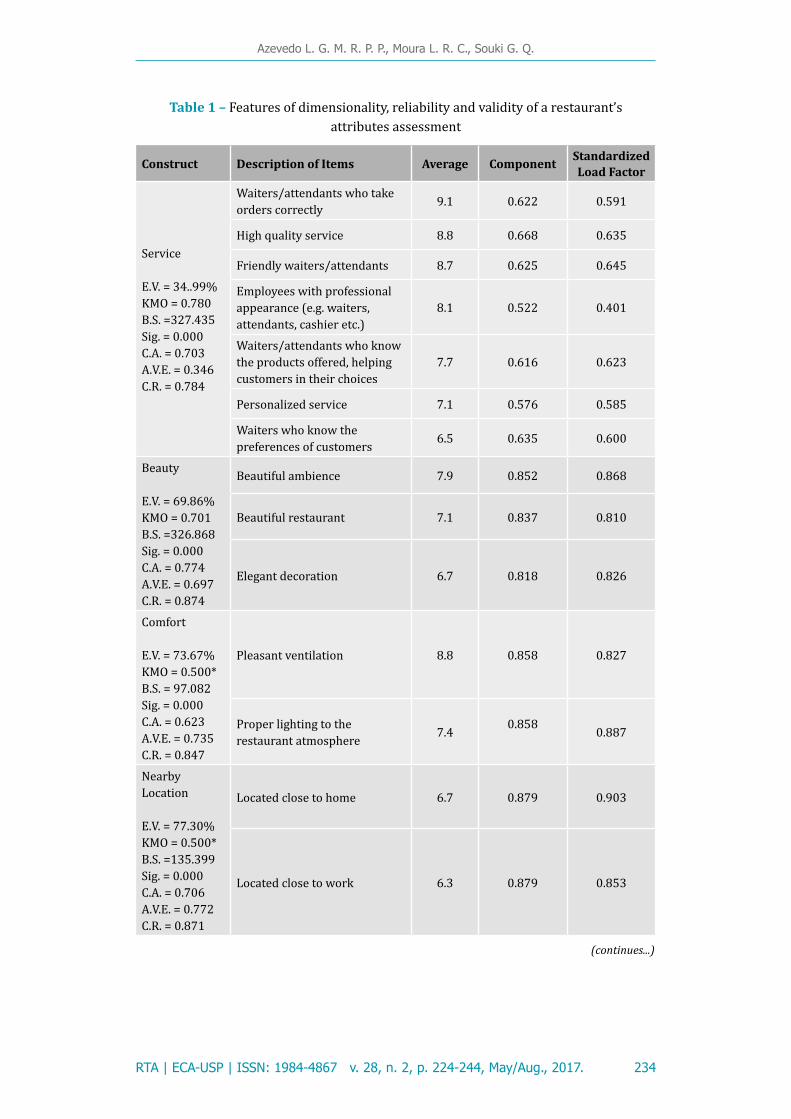
Table 1 – Features of dimensionality, reliability and validity of a restaurant’s attributes assessment
Construct Description of Items Average Component Standardized Load Factor
Service
E.V. = 34..99%KMO = 0.780B.S.=327.435Sig. = 0.000C.A. = 0.703A.V.E. = 0.346C.R. = 0.784
Waiters/attendantswhotakeorders correctly 9.1 0.622 0.591
High quality service 8.8 0.668 0.635
Friendly waiters/attendants 8.7 0.625 0.645
Employees with professional appearance (e.g. waiters, attendants, cashier etc.)
8.1 0.522 0.401
Waiters/attendantswhoknowthe products offered, helping customers in their choices
7.7 0.616 0.623
Personalized service 7.1 0.576 0.585
Waiterswhoknowthepreferences of customers 6.5 0.635 0.600
Beauty
E.V. = 69.86%KMO = 0.701B.S. =326.868Sig. = 0.000C.A. = 0.774A.V.E. = 0.697C.R. = 0.874
Beautiful ambience 7.9 0.852 0.868
Beautiful restaurant 7.1 0.837 0.810
Elegant decoration 6.7 0.818 0.826
Comfort
E.V. = 73.67%KMO=0.500*B.S. = 97.082Sig. = 0.000C.A. = 0.623A.V.E.=0.735C.R. = 0.847
Pleasant ventilation 8.8 0.858 0.827
Proper lighting to the restaurant atmosphere 7.4 0.858 0.887
Nearby Location
E.V. = 77.30%KMO=0.500*B.S.=135.399Sig. = 0.000C.A. = 0.706A.V.E. = 0.772C.R. = 0.871
Located close to home 6.7 0.879 0.903
Locatedclosetowork 6.3 0.879 0.853
(continues...)

RTA | ECA-USP | ISSN: 1984-4867 v. 28, n. 2, p. 224-244, May/Aug., 2017.
Choosing a Restaurant
235
Construct Description of Items Average Component Standardized Load Factor
Convenient Location
E.V.=52.45%KMO=0.584B.S.=95.048Sig. = 0.000C.A.=0.529A.V.E.=0.521C.R.=0.765
Located in a city region considered safe 8.4 0.799 0.742
Convenient location 8.0 0.626 0.698
Located in an upscale neighborhood of the city 4.8 0.737 0.725
Choices
E.V. = 66.84%KMO=0.500*B.S. = 46.032Sig. = 0.000C.A.=0.500A.V.E. = 0.667C.R. = 0.800
Wide range of products 8.3 0.818 0.780
Ease of understanding the menu 8.2 0.818 0.852
Children
E.V. = 73.86%KMO = 0.627B.S.=91.955Sig. = 0.000C.A. = 0.820A.V.E. = 0.739C.R. = 0.893
Place for children to play 5.5 0.923 0.925
Assistantstotakecareofchildren 5.0 0.921 0.922
Gifts for children 4.2 0.717 0.713
Convenience
E.V. = 91.39%KMO=0.500*B.S. =442.204Sig. = 0.000C.A. = 0.906A.V.E. = 0.914C.R.=0.955
Easyaccessforparking 8.9 0.956 0.956
Freeparkingforcustomers 8.8 0.956 0.956
Offers
E.V. = 71.01%KMO=0.500*B.S. = 74.301Sig. = 0.000C.A.=0.580A.V.E. = 0.704C.R. = 0.826
Specials (e.g. free meal or dessert on the customer’s birthday)
7.7 0.843 0.899
Low price 7.4 0.843 0.775
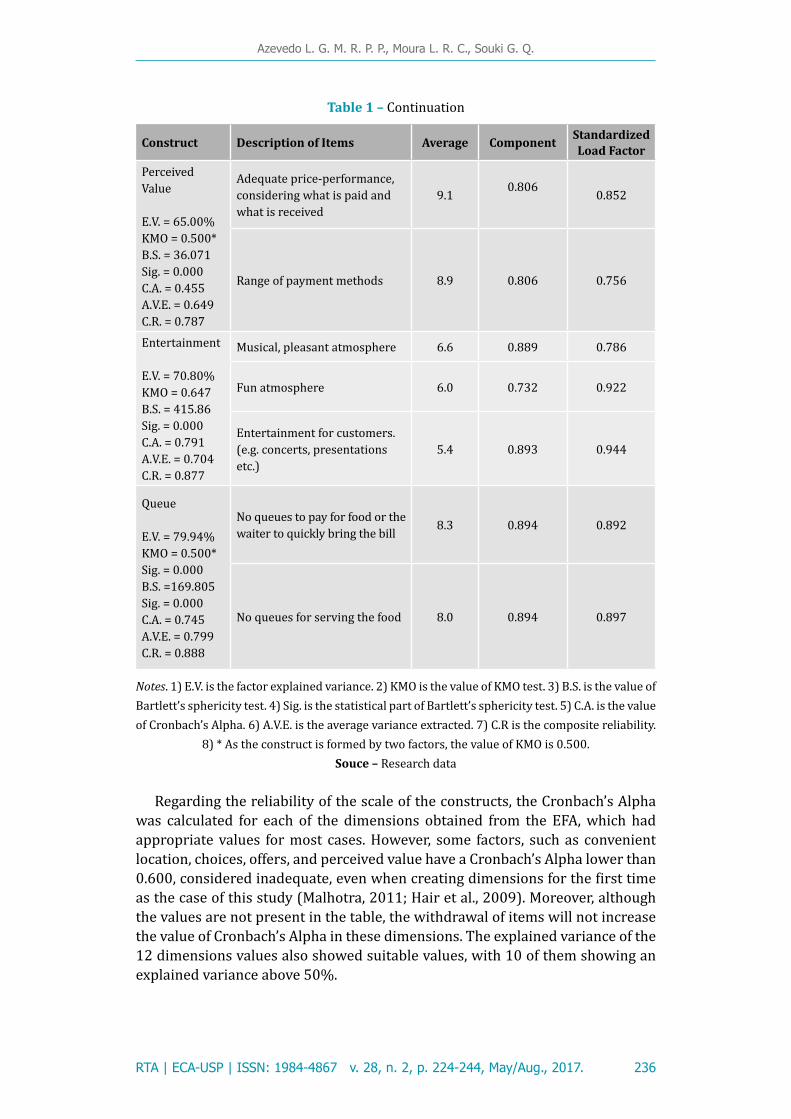
Table 1 – Continuation
(continues...)
RTA | ECA-USP | ISSN: 1984-4867 v. 28, n. 2, p. 224-244, May/Aug., 2017.
Azevedo L. G. M. R. P. P., Moura L. R. C., Souki G. Q.
236
Construct Description of Items Average Component Standardized Load Factor
Perceived Value
E.V.=65.00%KMO=0.500*B.S. = 36.071Sig. = 0.000C.A.=0.455A.V.E. = 0.649C.R. = 0.787
Adequate price-performance, considering what is paid and what is received
9.1 0.806 0.852
Range of payment methods 8.9 0.806 0.756
Entertainment
E.V. = 70.80%KMO = 0.647B.S.=415.86Sig. = 0.000C.A. = 0.791A.V.E. = 0.704C.R. = 0.877
Musical, pleasant atmosphere 6.6 0.889 0.786
Fun atmosphere 6.0 0.732 0.922
Entertainment for customers. (e.g. concerts, presentations etc.)
5.4 0.893 0.944
Queue
E.V. = 79.94%KMO=0.500*Sig. = 0.000B.S.=169.805Sig. = 0.000C.A.=0.745A.V.E. = 0.799C.R. = 0.888
No queues to pay for food or the waitertoquicklybringthebill 8.3 0.894 0.892
No queues for serving the food 8.0 0.894 0.897
Notes. 1) E.V. is the factor explained variance. 2) KMO is the value of KMO test. 3) B.S. is the value of Bartlett’ssphericitytest.4)Sig.isthestatisticalpartofBartlett’ssphericitytest.5)C.A.isthevalueof Cronbach’s Alpha. 6) A.V.E. is the average variance extracted. 7) C.R is the composite reliability.
8)*Astheconstructisformedbytwofactors,thevalueofKMOis0.500.Souce – Research data
Regarding the reliability of the scale of the constructs, the Cronbach’s Alpha was calculated for each of the dimensions obtained from the EFA, which had appropriate values for most cases. However, some factors, such as convenient location, choices, offers, and perceived value have a Cronbach’s Alpha lower than 0.600,consideredinadequate,evenwhencreatingdimensionsforthefirsttimeas the case of this study (Malhotra, 2011; Hair et al., 2009). Moreover, although the values are not present in the table, the withdrawal of items will not increase the value of Cronbach’s Alpha in these dimensions. The explained variance of the 12 dimensions values also showed suitable values, with 10 of them showing an explainedvarianceabove50%.
Table 1 – Continuation

RTA | ECA-USP | ISSN: 1984-4867 v. 28, n. 2, p. 224-244, May/Aug., 2017.
Choosing a Restaurant
237
Another item discussed is the validity of the constructs. Convergent validity was verified to reflect howmuch the same construct variables are positivelyrelated (Malhotra, 2011). Except for one item from service construct, other results for all indicators showed convergent validity, hence the loads of standard values areabove0.500(Hairetal.,2009).Moreover,exceptfortheconstructservice,the average variance extracted (AVE)has a value of at least 0.45 (Netemeyer,Bearden&Sharma,2003)foreachoftheconstructs.Compositereliability(CR)has values above 0.7 (Hair et al., 2009).
Table 2 – Features of dimensionality, reliability and validity of a restaurant’s food attributes assessment
Construct Description of Items Average Component Standardized Load Factor
Organoleptic
E.V.=66.56%KMO = 0.800B.S.=574.512Sig. = 0.000C.A.=0.825A.V.E.=0.665C.R. = 0.888
Good hygiene 9.8 0.770 0.757
Fresh food 9.7 0.845 0.844
Pleasant smell 9.6 0.854 0.859
Suitable temperature 9.5 0.791 0.800
Appearance
E.V.=50.59%KMO = 0.647B.S.=252.296Sig. = 0.000C.A. = 0.667A.V.E.=0.503C.R. = 0.799
Method of preparing the food 9.2 0.782 0.822
Goodlooking 9.0 0.579 0.596
The wide variety of dishes options or food choices 8.6 0.685 0.627
Seasoning used in food preparation 8.6 0.779 0.767
Notes. 1) E.V. is the factor explained variance. 2) KMO is the value of KMO test. 3) B.S. is the value of Bartlett’ssphericitytest.4)Sig.isthestatisticalpartofBartlett’ssphericitytest.5)C.A.isthevalueof Cronbach’s Alpha. 6) A.V.E. is the average variance extracted. 7) C.R is the composite reliability.
8)*Astheconstructisformedbytwofactors,thevalueofKMOis0.500.Souce – Research data
In the case of constructs relating to food, the results are very good. The explainedvarianceof the two factorshasvalue above50%.Cronbach’sAlphaalso has adequate values for EFA on the scales resulting from exploratory studies.
For convergent validity, both the load factor of each item of the constructs and the AVE’s value have adequate results, indicating convergent validity regarding the evaluation of food. Moreover, the present composite reliability shows value above 0.7.

RTA | ECA-USP | ISSN: 1984-4867 v. 28, n. 2, p. 224-244, May/Aug., 2017.
Azevedo L. G. M. R. P. P., Moura L. R. C., Souki G. Q.
238
Table 3 – Featuresofdimensionality,reliabilityandvalidityofarestaurant’sdrinksattributes assessment
Construct Description of Items Average Component Standardized Load Factor
Drinks
E.V. = 44.73%KMO = 0.791B.S. =726.866Sig. = 0.000C.A. = 0.761A.V.E. = 0.446C.R. = 0.848
Good hygiene of glasses or bowls 9.8 0.709 0.682
Suitable temperature 9.7 0.72 0.694
Taste 9.3 0.674 0.657
Quality of the ingredients (e.g. asthecaseofdrinksandjuices) 9.3 0.705 0.711
Preparation method (e.g. as the caseofdrinksandjuices) 9.0 0.727 0.750
Goodlooking 8.9 0.636 0.644
Widerangeofdrinks 8.6 0.475 0.512
Notes. 1) E.V. is the factor explained variance. 2) KMO is the value of KMO test. 3) B.S. is the value of Bartlett’ssphericitytest.4)Sig.isthestatisticalpartofBartlett’ssphericitytest.5)C.A.isthevalueof Cronbach’s Alpha. 6) A.V.E. is the average variance extracted. 7) C.R is the composite reliability.
8)*Astheconstructisformedbytwofactors,thevalueofKMOis0.500.Souce – Research data
Fortheevaluationofdrinks,onlyonegroupwasformed.Inthiscase,sevenitems formed the evaluation factorof drinks.The explainedvariance is about45%. The Cronbach’s Alpha showed a good and proper value, indicating thereliability of the scale.
Regarding convergent validity, the values of the load factor of each item presentedvaluesabove0.500,andAVEvalueof0.45,whicharethelimitdefinedby Netemeyer, Bearden and Sharma (2003). The composite reliability has a high valueofapproximately0.85.
The discriminant validity of the constructs was obtained by comparing the square roots of AVE values to the correlations between them and the analysis of the correlation value between the constructs. The values of the average variance extracted from two constructs should be larger than the square of the correlation between them, while the correlation value between constructs shouldbeatmost0.85(Hairetal.,2009).Theresultsindicatethatallvaluesused to verify the discriminant validity were achieved, which indicates that the constructs have different meanings to each respondent. Correlations between constructs do not exceed the roots of the average variance extracted in convergent analysis and all correlations between constructs have values below0.85.
Finally, regarding the most important attributes for consumers, it is possible toidentifyhygiene,quality,andcharacteristicsoffoodanddrink–temperature,freshnessandsmell–inadditiontowaiters’serviceandqualification,parkingand perceived value, as the most relevant items from consumers’ points of view for choosing a restaurant.

RTA | ECA-USP | ISSN: 1984-4867 v. 28, n. 2, p. 224-244, May/Aug., 2017.
Choosing a Restaurant
239
final remarks
Thequalitativestepofthisstudyidentifiedfeaturesconsideredforchoosingarestaurant. The highlighted attributes were grouped into corresponding subjective dimensions in quantitative research, allowing the categorized analysis to identify theirlevelofimportanceinthedecision-makingprocess.Thesedimensionsareconsistent both at the level of qualitative and quantitative results. The generated dimensions are: service, beauty, comfort, nearby location, convenient location, choices, children, convenience, offers, perceived value, entertainment, and queue, totaling 33 attributes for assessing the restaurant in general; organoleptic and presentation for evaluating the food, totaling eight items; while the evaluation attributes for drinkswere clustered into only one group. Figure 3 shows theresults obtained for the evaluation of restaurants and food.
Figure 3 – Dimensions of the perceived quality regarding restaurants and food
Service
ConvenientLocation
Choices
ChildrenConvenienceOffers
Generalperceived
quality
Perceived value
Appearance OrganolepticFood’s
perceivedquality
Entertainment
Queue
Beauty Comfort NearbyLocation
Souce – Research data
Regarding the most valued attributes in relation to restaurants, service, qualificationofthewaiters,andperceivedvaluecanbecategorizedasexperienceattributes. On the other hand, parking can be classified as a search attribute,since, in theory, it can be evaluated before purchase.
Based on Figure 3, in relation to managerial implications, it can be concluded that the identification of the most relevant attributes providesto the managers an opportunity to invest assertively in ways that shows the excellence of these same factors that, in fact, influence the decision-makingprocess. When these factors are considered satisfactory, consumers shall feel safer in that dining experience and enable the restaurant the possibility to develop a lasting relationship (loyalty). Ensure that the customer has met a customer’s expectations creates incentive for the customer to positive comment and recommend to others. This is really important for restaurants, since the recommendations of nearby people who have attended a certain restaurant are
RTA | ECA-USP | ISSN: 1984-4867 v. 28, n. 2, p. 224-244, May/Aug., 2017.
Azevedo L. G. M. R. P. P., Moura L. R. C., Souki G. Q.
240
considered by many as the most reliable source of information for choosing the bestoptionduringthedecision-makingprocess.
The restaurant’s hygiene is mentioned by consumers as an essential aspect. It is, therefore, important that the atmospheres (facade, corridors, access, ramps, mainroom,bathroom,kitchen,storage,parking,floorsingeneral,playgrounds,andgardens),furnitureandhouseholdappliances(tables,chairs,desks,freezer,refrigerator,stove,hoods,sinks,displaycasesetc.),utensils(plates,cups,bowls,spoons,knives,forks,tongs,pans,traysetc.)andotherequipment(tableliners,employeedress,dumps,spiceholders,saltshaker,toothpicksetc.),whichmakeupa restaurant, are well maintained, organized and clean. In this case, considering theclassificationoftheattributesdescribedinthetheoreticalbasis,thehygieneattribute can be considered in terms of experience, since the consumer observes thehygienic conditions through the five senses (touch, taste, smell, sight, andhearing), but there also are aspects of service that can only be proven after the service experience.
As well as hygiene, the food quality attribute was remembered as one of the most important attributes for consumers. The high quality of the food served is a relevant aspect (as well as meeting the organoleptic aspects and appearance). To, therefore, ensure the quality of the food served, it is important that food, raw materials and spices have guaranteed origin and adequate quality. Food (non- -perishable)andrawmaterialsmustbepackedincool,ventilatedplaces,whileperishablesmustbekeptinpropervalidityandtemperature,alsoensuringthequality of water used in food preparation. As in the case of the hygiene attribute, someattributescanbeclassifiedas“experience”,astheycanbeevaluatedintheservice,butothers–suchastheoriginofthefoodandqualityofrawmaterials,forexample–areconsideredcredibilityattributes.
Organoleptic aspects of food enable consumers to evaluate the characteristics throughtheirsenses,allowingpriorverificationofthefood.Detailssuchasthecolor of the food and selection of products used in the preparation or decoration of dishes (for example, avoid wilted leaves) contribute to a positive evaluation. Water droplets on fruits refer to the freshness of the morning, the lighting on the food highlights colors, cleaning the edge of the plates and containers in which the food is served refers to hygiene and appearance of the food connotes organization and food freshness. Aspects such as these are simple and add sensitive factors to the senses, which, in turn, provide approval regarding the subjective questions of freshness, hygiene, temperature, and other attributes thatmakeupthefood.Inthecaseoforganolepticcharacteristics,theycanbeclassifiedasexperienceattributes.Among the items evaluated in the drinks’ dimension, hygiene is the most
relevant to the four types of restaurants. Hygiene of glasses and bowls was indicatedasextremelyrelevant,aswellasvases,shakers,andotheritemsthatsupporttheconsumptionofjuices,drinks,softdrinks,water,beer,wineetc.Theymust be washed well with water (preferably hot) and soap. It is essential that thefruitusedinjuicesanddrinksaresanitizedbeforeuse.Itmustbeensuredthatwaterusedtoproducejuicesandicecubesisfilteredandstrawsandmixersare discarded and never used again. Another aspect of great importance to consumersisthepropertemperatureofthedrink.Itis,therefore,importanttoinvest in ice buckets, tongs, and thermal containers,which help conserve the

RTA | ECA-USP | ISSN: 1984-4867 v. 28, n. 2, p. 224-244, May/Aug., 2017.
Choosing a Restaurant
241
beverage’s temperature. It is important that refrigerators and freezers be able to achieve low temperature levels.
When comparing the results obtained by other studies, it appears that few are those that specify the type of restaurant being rated, as opposed to this research, whichwasconductedwithspecificfocusonfourtypesofrestaurants:fast-food,a la carte, buffet, and continuous service. In general, as in this study, attributes related toservice,cleanliness,price,service,food,security,parking,location,amongothers,were evaluated and considered relevant from the perspective of consumers.Inastudy(Angnes&Moyano,2013)aimedtoidentifytheattributesofchoice
onrestaurantservices(typewasnotspecified)inSantaCruzdoSul(Brazil),27attributeswere identifiedandthehighest incidencewassimilar to theresultsin this study. Another study, by Siebeneichler et al. (2007), aimed to capture the importanceoftheattributesofrestaurants(typewasnotspecified), identifiedthe most important attributes: cleanliness, service, quality of food, and price, thus also consistent with this research.
The food was considered crucial in both surveys. We noticed a wide range of attributes considered the most valuable for a restaurant, including the quality of food and ingredients, good hygiene of products, fresh food, pleasant smell, proper temperature, and taste.This subject is also studied in other countries. Yüksel and Yüksel (2003)
measured the satisfaction of tourists at restaurants (typewas not specified).Among the cited aspects stood out quality of service and product, diversity of dishes, cleanliness, convenience, location, fast service, prices, and atmosphere. Even though not finding an attribute that stood out among the others in theevaluation of fast-food, buffet, a la carte, and continuous service restaurants, the participants of this research also analyzed the relevance of the menu, location, convenience(parkingandassistantstotakecareofchildren),andatmosphere.Regarding the limitations of this study, the convenience sample makes it
impossibletoassumetheresultsasgeneric,consideringthelackofrandomnessofrespondents. Given that some respondents were inquired in public spaces, we must considerthepossibilityoflackofaccuracywhenrespondingduetosurveysizeandlackoftime.Asfortheresultsobtainedfromthestatisticalanalysis,theKMOvaluesand Barllet’s sphericity test in addition to the indexes of one-dimensionality and internal reliability of the constructs all had appropriate indicators, generally. The constructs that showed lower indicators to those recommended by the references of the statistical area may have been impacted by the review process, in which we decided to process the data of the four types of restaurants together (fast-food, a la carte,continuousservice,andbuffet)andnotseparately,takingintoaccountan individual analysis for each type. In this case, it may happen that some items have presented disparate values concerning the type of restaurant, i.e., showed low values when closer values were expected for the same attributes.
The performance of a new research is encouraged, considering the same analysis used in this study, but with a larger sample. It also would enable a statistical analysis of constructs related to attributes individually created for each of the four types of restaurant. It is also possible to develop a study to evaluate the quality of a restaurant in which the used constructs would be obtained from this research,addingonemorefor“overallquality”.Itwouldthuscreateastructuralmodel for analyzing the consistency of the scale and its nomological validity.
RTA | ECA-USP | ISSN: 1984-4867 v. 28, n. 2, p. 224-244, May/Aug., 2017.
Azevedo L. G. M. R. P. P., Moura L. R. C., Souki G. Q.
242
references
AGUIAR, E.P.S.,&Carvalho,S.M.S.(2012).TuristasdeSãoRaimundoNonato–PI:perfilegrau de satisfação quanto aos serviços de alimentação. Revista Turismo em Análise, 23(3), 600-622. doi: 10.11606/issn.1984-4867.v23i3p600-622.
AANDALEEB, S.S.,&Conway,C.(2006).Customersatisfactionintherestaurantindustry:anexaminationofthetransaction-specificmodel.Journal of Services Marketing, 20(1), 3-11.doi:10.1108/08876040610646536.
ANGNES, D.L.,&Moiano,C.A.M.(2013)Atributosdeescolhaemserviçosderestaurantes:um estudo exploratório. Revista Brasileira de Pesquisa em Turismo, 7(2), 317-336. doi: 10.7784/rbtur.v7i2.607.
ANGNES, D.L.,Moyano,C.A.M.,&Lengler,J.F.B.(2015).Avaliaçãodasatisfaçãodoclienteem serviços de restaurantes com aplicação do ACSI. Revista Brasileira de Pesquisa em Turismo, 9(1),174-193.doi:10.7784/rbtur.v9i1.725.
BARDIN, L. (1977). Análise de conteúdo. Lisboa: 70.
BARRETO, R.L.P,&Senra,A.V.(2001).Agastronomiaeoturismo.InL.G.G.Trigo(Ed.),Turismo: como aprender, como ensinar. São Paulo: Senac. p. 90-108.
BLACKWELL, R.D.,Engel,J.F.,&Miniard,P.W.(2005).Comportamento do consumidor. RiodeJaneiro:LivrosTécnicoseCientíficos.
BORGES, M. A. (2010). Identificação dos atributos intrínsecos e extrínsecos do produto valorizados na escolha da marca de farinha de mandioca. (Dissertação de mestrado). Programa de Pós-Graduação em Administração, Faculdade Novos Horizontes, Belo Horizonte, MG. Recuperado de http://bit.ly/2utwhro.
CARNEIRO, M.(2012,22desetembro).Alimentaçãoforadecasacresce15%aoanoemuma década. Folha de S. Paulo. Recuperado de http://bit.ly/2vrsNTC.
DENG, W.-J.(2008).Fuzzyimportance-performanceanalysisfordeterminingcriticalservice attributes. International Journal of Service Industry Management, 19(2),252-270.doi:10.1108/09564230810869766.
ESPARTEL, L. B. (1999). Atributos de produto e motivações de compra no mercado jornalístico do Rio Grande do Sul. (Dissertação de mestrado). Escola de Administração, Universidade FederaldoRioGrandedoSul,PortoAlegre.Recuperadodehttp://bit.ly/2vJrDoM.
ESPINOZA, F.S.,&Hirano,A.S.(2003).Asdimensõesdeavaliaçãodosatributosimportantesna compra de condicionadores de ar: um estudo aplicado. Revista de Administração Contemporânea, 7(4),97-117.doi:10.1590/S1415-65552003000400006.
FERREIRA, M.R.,Valduga,V.,&Bahl,M.(2016).BaixaGastronomia:caracterizaçãoeaproximações teórico-conceituais. Revista Turismo em Análise, 27(1), 207-228. doi: 10.11606/issn.1984-4867.v27i1p207-228.
GHISI, M.A.,Merlo,E.M.,&Nagano,M.S.(2006).Amensuraçãodaimportânciadeatributosem serviços: uma comparação de escalas. Revista de Administração Mackenzie, 7(2), 123-145.Recuperadodehttp://bit.ly/2wJ7blG.
GLANZ, K.,Resnicow,K.,Seymour,J.,Hoy,K.,Stewart,H.,Lyons,M.,&GoldbergJ. (2007). How majorrestaurantchainsplantheirmenus:theroleofprofit,demand,andhealth.American Journal of Preventive Medicine, 32(5),383-388.doi:10.1016/j.amepre.2007.01.003.
GOMES, G.,&Hein,N.(2011).Avaliaçãodaimportânciadosatributosesatisfaçãocomtelevisores por meio da análise fatorial. In Anais do XIV Simpósio de Administração da Produção, Logística e Operações Internacionais. (pp. 1-13) São Paulo.

RTA | ECA-USP | ISSN: 1984-4867 v. 28, n. 2, p. 224-244, May/Aug., 2017.
Choosing a Restaurant
243
GROHMANN, M.Z.,Battistella,L.F.,&Schoedler,A.R.(2012).Atributosimportantesparaoconsumidordeautomóveis:classificaçãoemfunçãoinstrumentalouexpressiva.Faces: Revista de Administração, 11(1),67-86.Recuperadodehttp://bit.ly/2wNbk7E.
GRUNERT, K. G. (1989). Attributes, attribute values and their characteristics: a unifying approach and an example involving a complex household investment. Journal of Psychologies Economical, 10(2),229-251.doi:10.1016/0167-4870(89)90021-4.
GUSTAFSSON, A.,&Johnson,M.D.(2004).Determiningattributeimportanceinaservicesatisfaction model. Journal of Service Research, 7(2), 124-141.
HAIR Jr.,J.F.,Black,W.C.,Babin,B.J.,Anderson,R.E.,&Tatham,R.L.(2009).Análise multivariada de dados. (6aed.).PortoAlegre,RS:Bookman.
HARRINGTON, R.J.,Ottenbacher,M.C.,&Kendall,K.W.(2011).Fine-diningrestaurantselection: direct and moderating effects of customer attributes. Journal of Foodservice Business Research, 14(3),272-289.doi:10.1080/15378020.2011.594388.
IBGE. (2010). Pesquisa de orçamentos familiares 2008-2009: despesas, rendimentos e condições de vida. Recuperado de http://bit.ly/2fyIy77.
JESUS,A.A.(2005).Satisfaçãodeclientesdeserviçosderestaurantes:umestudonacidadede Salvador/BA. (Dissertação de mestrado). Universidade do Vale do Itajaí, Balneário Camboriú, SC. Recuperado de http://bit.ly/2fz3jQd.
LEAL, D. Crescimento da alimentação fora do domicílio. (2010). Segurança Alimentar e Nutricional, 17(1), 123-132. Recuperado de http://bit.ly/2uy4WQD.
LIU, Y.,&Jang,S.(2009)PerceptionsofchineserestaurantsintheU.S:whataffectscustomersatisfaction and behavioral intentions? International Journal of Hospitality Management, 28(3), 338-348. Recuperado de http://bit.ly/2fz91Bx.
MALHOTRA, N. (2011). Pesquisa de marketing: uma orientação aplicada. (6a ed.). Porto Alegre,RS:Bookman.
MORGAN, G.A.,&Griego,O.V.(1998).Easy use and interpretation of SPSS for Windows: answering research questions with statistics.NewJersey:LawrenceErlbaum.
MOURA, L.R.C.,Saldanha,L.C.L.,Veiga,R.T.,Moura,L.E.L.,&Cunha,N.R.S.(2007).Avaliação da qualidade de serviços utilizando a escala Servqual: o estudo de caso Matermed. REUNA, 12(3), 21-36. Recuperado de http://bit.ly/2vLW6D2.
MOURA, L.R.C.,Berni,M.C.A.R.,Cunha,N.R.S.,&Moura,L.E.L.(2011).Estudodaspercepções e do comportamento dos consumidores de gasolina em uma metrópole brasileira. Nucleus, 8(1),1-19.doi:10.3738/nucleus.v8i1.454.
MOWEN, J.C.,&Minor,M.S.(2003).Comportamento do consumidor. São Paulo: Prentice Hall.
NAMKUNG, Y.,&Jang,S.(2008).Arehighlysatisfiedrestaurantcustomersreallydifferent?A quality perception perspective. International Journal of Contemporary Hospitality Management, 20(2),142-155.doi:10.1108/09596110810852131.
NETEMEYER, R.G.,Bearden,W.O.,&Sharma,S.(2003).Scaling Procedures: issues and applications.ThousandOaks,CA:Sage.
NUNNALY, J.C.,&Bernstein,I.H.(1994).Psychometric theory.(3rded.).NewYork:McGraw-Hill.
PARK, C.(2004).Efficientorenjoyable?Consumervaluesofeating-outandfast food restaurant consumption in Korea. International Journal of Hospitality Management, 23(1), 87-94. doi: 10.1016/j.ijhm.2003.08.001.
PETER, J.P.,&Olson,J.C.(2009).Comportamento do consumidor e estratégia de marketing. (8a ed.). São Paulo: McGraw-Hill.
RTA | ECA-USP | ISSN: 1984-4867 v. 28, n. 2, p. 224-244, May/Aug., 2017.
Azevedo L. G. M. R. P. P., Moura L. R. C., Souki G. Q.
244
PORTOLAN, R. (2011). Análise de atributos valorizados pelos compradores de mini e micro-ônibus. (Dissertação de mestrado). Universidade Federal do Rio Grande do Sul, Porto Alegre.
RODRIGUES, F.S.,&Sabes,J.J.S.(2006).Apercepçãodoconsumidordealimentos“forade casa”: um estudo multicaso na cidade de Campo Grande/MS. Caderno de Administração, 14(2),37-45.
SIEBENEICHLER, T.,Wienningkamp,D.,Ruchel,A.P.,Trombini,E.S.,&Zamberlan, L. (2007). Asatisfaçãodeclientesderestaurantes:umaavaliaçãodasatisfaçãoedaimportânciadosatributos. Revista de Administração, 6(11),39-58.Recuperadodehttp://bit.ly/2uCLSF2.
SINGH, S.(2006).Impactofcoloronmarketing.Management Decision, 44(6), 783-789. doi:doi.org/10.1108/00251740610673332.
SPANG, R. L. (2003). A invenção do restaurante.RiodeJaneiro:Record.
TINOCO, M.A.C.,&Ribeiro,J.L.D.(2008).Estudoqualitativodosprincipaisatributosque determinam a percepção de qualidade e de preço dos consumidores de restaurantes a la carte. Gestão e Produção, 15(1),73-87.doi:10.1590/S0104-530X2008000100008.
WU, T.W.,Day,R.L.,&MacKay,D.B.(1988).Consumerbenefitsversusproductattributes:an experimental test. Quarterly Journal of Business and Economics, 27(3), 88-113.
YÜKSEL, A.,&Yüksel,F.(2003).Measurementoftouristsatisfactionwithrestaurantservices: a segment-based approach. Journal of Vacation Marketing, 9(1),52-68.doi:10.1177/135676670200900104.
ZEITHAML, V. A. (1998). Consumer perceptions of price, quality, and value: a means-end model and synthesis of evidence. Journal of Marketing, 52(3), 2-22.
Received on: 29/09/2016Approved on: 26/06/2017
Copyright © 2022 FDOKUMEN