College Affordability and US News & World Report Rankings
25
- 1 - Peer-Reviewed Article ISSN: 2166-2681 Print/ ISSN: 2690-0408 Online Volume 9, Issue 1 (2020), pp. 1–25 © Journal of Interdisciplinary Studies in Education http://ojed.org/jise College Affordability and U.S. News & World Report Rankings: Analyzing National and Regional Differences Z.W. Taylor The University of Texas at Austin, USA Izzat Alsmadi Texas A&M University-San Antonio, USA ABSTRACT In an era of billions of dollars in outstanding student loan debt, researchers have posited that the U.S. News & World Report rankings continue to be an influential source of information for prospective students, yet these rankings do not include college affordability metrics in their ranking algorithm. As a result, this study performed a series of college affordability experiments by integrating affordability metrics into the U.S. News ranking algorithm to explore whether any affordability metric predicts overall ranking. Results suggest better ranked institutions enrolled lower percentages of Pell grant receiving students (p < 0.00), while the percentage of undergraduates receiving state aid predicted better rankings only at Regional Midwest and Regional West Universities (p < 0.05). These results suggest many college affordability metrics are not predictive of ranking among the best-ranked, elite institutions. Implications for theory, practice, and college student choice are addressed. Keywords: college affordability, college rankings, higher education, student debt, universities, U.S. News & World Report rankings
-
Upload
khangminh22 -
Category
Documents
-
view
1 -
download
0
Transcript of College Affordability and US News & World Report Rankings
- 1 -
Peer-Reviewed Article
ISSN: 2166-2681 Print/ ISSN: 2690-0408 Online Volume 9, Issue 1 (2020), pp. 1–25
© Journal of Interdisciplinary Studies in Education http://ojed.org/jise
College Affordability and U.S. News & World
Report Rankings: Analyzing National and Regional Differences
Z.W. Taylor
The University of Texas at Austin, USA
Izzat Alsmadi Texas A&M University-San Antonio, USA
ABSTRACT
In an era of billions of dollars in outstanding student loan debt, researchers have posited that the U.S. News & World Report rankings continue to be an influential source of information for prospective students, yet these rankings do not include college affordability metrics in their ranking algorithm. As a result, this study performed a series of college affordability experiments by integrating affordability metrics into the U.S. News ranking algorithm to explore whether any affordability metric predicts overall ranking. Results suggest better ranked institutions enrolled lower percentages of Pell grant receiving students (p < 0.00), while the percentage of undergraduates receiving state aid predicted better rankings only at Regional Midwest and Regional West Universities (p < 0.05). These results suggest many college affordability metrics are not predictive of ranking among the best-ranked, elite institutions. Implications for theory, practice, and college student choice are addressed. Keywords: college affordability, college rankings, higher education, student debt, universities, U.S. News & World Report rankings

- 2 -
INTRODUCTION
In early 2019, reports from the United States (U.S.) Department of Education and the Institute for College Success indicated that over 44 million U.S. borrowers collectively owed over $1.5 trillion dollars in outstanding student loan debt, with more than 11% of borrowers in delinquency or default, unable to make timely payments (Friedman, 2019). The U.S. Department of Education (2018) estimated that tuition at public universities has doubled over the past three decades after controlling for inflation, and combined with outstanding student debt, these economic challenges have catalyzed researchers and policymakers to explore methods of making college more affordable and accessible (Patel, 2019).
However, for decades, prospective college students have considered U.S. News & World Report (USN) an authoritative source of information to influence where these students apply, attend, and earn their degrees (Altbach, 2012; Bowman & Bastedo, 2009; Griffith & Rask, 2007; Meredith, 2004; Monks & Ehrenberg, 1999; Morse, 2008; Owings-Edwards, 2005; Sauder & Lancaster, 2006; Taylor, Childs, Bicak, & Alsmadi, 2019). Paradoxically, the USN rankings have been criticized for failing to capture a wide variety of important institutional characteristics (Alsmadi & Taylor, 2018), ignoring inflated variance factors and multicollinearity (Bougnol & Dulá, 2015; Webster, 2001), capturing data in ways that make upward mobility impossible (Gnolek, Falciano, & Kuncl, 2008), and failing to verify self-reported data from highly-ranked institutions (Jaschik, 2018, 2019). As a result, prospective students may be choosing colleges and universities based on a ranking system that does not address college affordability, possibly obscuring student choice, restricting college access, and contributing to the student debt crisis.
However, the USN rankings has claimed to have addressed college affordability in their rankings, explaining that their ranking algorithm for national universities, liberal arts colleges, and regional universities (in north, south, midwest, and west regions) has included percentage of Pell grant graduation rates. Morse, Brooks, and Mason (2018) asserted that Pell grant graduation rates and Pell grant graduation rates against all graduates both contribute 2.5% to an institution’s overall ranking algorithm. As a result, college affordability—measured by the percentage of students graduating with Pell Grants—has only contributed to 5% of the overall USN ranking algorithm. Yet, college affordability metrics for nearly all ranked USN colleges and universities, totaling over 900 institutions—has been available at the National Center for Education

- 3 -
Statistics (NCES) for years. These college affordability metrics include in-state tuition rates, out-of-state tuition rates, percentages of students receiving federal, state, and institutional grant aid, and total price of attendance. The USN rankings have been found to be the most influential and popular among many groups of educational stakeholders (Altbach, 2012; Bowman & Bastedo, 2009; Griffith & Rask, 2007; Morse, 2008). Yet, USN has not addressed why their college rankings does not incorporate more student-level affordability metrics, such as institutional aid per student, debt upon graduation, and entry-level career earnings to provide students with a better understanding of their chosen college’s affordability.
As a result, this study captured all 2018 USN metrics for national universities and regional universities (N=920) and integrated NCES college affordability metrics into the USN rankings in an effort to explore whether college affordability—in any way—predicts USN ranking. As a result, this study answers two research questions pertinent to college affordability and the U.S News & World Report rankings (national universities) and sub-rankings (regional universities): 1.) Does USN ranking correlate with college affordability metrics? 2.) Controlling for all USN ranking metrics and removing multicollinearity (Bougnol & Dulá, 2015; Webster, 2001), how do college affordability metrics predict USN ranking across both national and regional rankings?
LITERATURE REVIEW A large and longitudinal body of research has examined why students choose colleges and universities (Chapman, 1981; Hazelkorn, 2007; Monks & Ehrenberg, 1999; Morse, 2008; Paulsen, 1990). Early work in the field defined student choice as a result of student resources, student academic achievement, and institutional-level characteristics, such as the competitiveness of the school and its available resources (Chapman, 1981). Later reports indicated that student choice may be owed to a student’s academic fit within an institution, particularly a student’s major of study and how that major prepared the student for the job market (Paulsen, 1990). McDonough’s (1997) research specifically addressed prospective students’ socioeconomic status as a large factor in college choice, as McDonough (1997) argued that students from low socioeconomic high schools and living in low-income households were less likely to choose competitive, elite postsecondary institutions than their more affluent peers. However, no studies have examined how

- 4 -
influential ranking systems, such as U.S. News & World Report, captures college affordability data, or how students perceive these rankings as informing how they view a college’s affordability.
Given the increased focus on college affordability and the student debt crisis, many new college and university ranking systems have emerged in recent years, many of which emphasize the costs of postsecondary education. These ranking systems include Niche’s (2019) Best Value Colleges in America, the College Consensus (2019) list of the 100 Most Affordable Colleges and Universities, and Best Value Schools’ (2019) 25 Most Affordable Universities in America. However, many of these ranking systems do not take into account educational quality metrics and only evaluate specific institution types. For instance, Best Value Schools (2019) limited their university ranking system to “schools with an undergraduate enrollment greater than 4,000 students” (para. 2), while only taking net price (total cost of attendance minus the average amount of federal, state, and institutional aid) into account when calculating rank.
To inform the literature on student choice and institutional rankings, it is important to analyze ranking systems that have considerable influence on student choice and institutional administration (e.g., U.S. News & World Report), while also evaluating ranking systems that take into account educational quality, institutional resources, and other validated and reliable predictors of student support (e.g., retention rates, six-year graduation rates). As a result, this study and literature review focuses on the U.S. News & World Report National Universities and Regional Universities rankings, as these rankings have been found to be both influential and robust in their usage of student-, faculty-, and institutional-level data.
How the U.S. News & World Report Rankings Influences Stakeholders
U.S. News & World Report published their first college and university rankings in 1983. The rankings capture many measures of institutional quality, such as year-to-year graduation performance (7.5% of the ranking) and graduation and retention rates (22.5%), academic reputation held by postsecondary administrators (22.5%), faculty resources and earned grant dollars (20%), per-student spending (10%), alumni giving (5%), and student selectivity indicators, such as incoming undergraduate grade-point average and test scores (12.5%) (Morse, 2008). Since the 1980s, educational researchers have explored how these ranking systems influence student choice, institutional leadership, and how

- 5 -
institutions—in the United States and across the world—compete to improve their ranking (Morse, 2008).
In an early exploration of the USN rankings, Monks and Ehrenberg (1999) asserted that many elite institutions, such as Stanford University, have had the USN rankings audited for credibility and reliability, speaking to historically skeptical views of the ranking system. Yet, despite their skepticism, institutional leaders have promoted their USN ranking as a selling point in admissions materials, indicating that institutional leaders view the USN rankings as influential in student choice (Monks & Ehrenberg, 1999). In the decades since the publishing of the USN rankings, a wealth of research has posited that the USN rankings have a considerable impact on how students choose institutions, how institutional leaders make decisions, and how institutions position themselves in an increasingly competitive higher education marketplace (Altbach, 2012). Concerning student choice, Meredith (2004) investigated the role of USN ranking on admissions outcomes and pricing decisions, finding that USN ranking has been predictive of admissions outcomes, such as admission rate and yield, but changes in the rankings were more significant in different geographic regions and public or private institutional settings. Also related to student choice and admissions outcomes, Bowman and Bastedo (2009) discovered that between Fall 1998 to Fall 2005, national universities (e.g., The University of North Carolina at Chapel Hill, Vanderbilt University) who moved onto the front page of the USN rankings experienced a considerable increase in admissions metrics, such as applications, acceptance rate, and admissions yield. Inversely, however, Bowman and Bastedo (2009) also found that the same was not true for liberal arts colleges (e.g., Vassar College, Reed College), as admissions metrics were more strongly influenced by the total price of attendance. These findings indicated that better ranked institutions often charge higher tuition rates and may be less affordable for students and their families (Bowman & Bastedo, 2009) possibly producing a stratifying effect. However, this study did not explore how USN rankings correlated with other college affordability metrics, such as institutional grant aid or average student loan debt upon graduation.
Regarding institutional leadership, Ehrenberg (2002) reasoned that elite institutions often change their behavior in an attempt to artificially improve their USN ranking, ignoring possibilities of collaborating in ways that would benefit students both educationally and financially. Some of Ehrenberg’s (2002) concerns were recently validated, as Jaschik (2018, 2019) reported that many elite institutions have submitted false or incorrect ranking data, leading to a higher ranking than
- 6 -
would be justified using correct data. Similarly, Altbach (2012) and Hazelkorn (2007, 2009) have long studied how USN rankings have contributed to global academic competition between institutions, including how elite institutions have sustained their ranking through an investment in research and knowledge production.
Griffith and Rask (2007) specifically evaluated the role of USN rankings on the decision making of high-ability students, learning that changes in ranking affects where students apply, especially among the best-ranked, elite institutions: These changes in ranking were independent of other changes in educational quality, indicating that the overall USN rank may be more influential in student choice than any student outcome metric, such as retention rate or six-year graduation rate. Moreover, Griffith and Rask (2007) asserted that USN ranking and change in ranking was predictive of admissions yield, meaning that USN ranking was not only influential in informing where high-ability students applied, but also where they ultimately decided to attend. Yet, this study did not investigate low-ability student or define how low-ability students may be differentiated from high-ability students. The same phenomenon was found to be true among law schools in the USN rankings, as Sauder and Lancaster (2006) discovered that not only did USN ranking affect student choice on where to apply, but institutional admissions decisions also changed with ranking.
Grewal, Dearden, and Glilien (2008) explained that as USN rankings gained in popularity among students and administrators, institutions often remain stuck in the rankings given the abundance of financial resources at some institutions compared to others, such as Harvard University’s multi-billion dollar endowment, which has been used to lower the student-faculty ratio and expand the institution’s research impact. Gnolek, Falciano, and Kuncl (2014) also hinted at the stratification and competition to improve in the USN rankings, as their results indicated that an institution ranked in the 30s would require significant financial resources to enter the top 20, rendering it improbable or impossible for many institutions to improve their ranking, even with modest increases in financial resources. Bastedo and Bowman (2010) learned that as USN rankings change, institutional leaders often adjust their perception and peer assessment of other USN-ranked institutions, independent of whether the institution actually improves educational quality or performance, echoing earlier findings of rankings stratification (Sauder & Espeland, 2009; Volkwein & Sweitzer, 2006). Here, the authors asserted that many institutional leaders may consider USN ranking itself as a measure of institutional quality without considering how the ranking

- 7 -
was actually calculated, leading to a stratified set of rankings where elite institutions can assess each other favorably in perpetuity (Bastedo & Bowman, 2010). Moreover, as the USN rankings did not explicitly measure college affordability, these studies were not able to analyze how increases in per-student spending on teaching and faculty support may influence a college’s affordability or a student’s perception of a college’s affordability.
Why the U.S. News & World Report Rankings are Problematic
For as influential as the USN rankings have been for decades, researchers and policymakers have criticized the USN rankings for its ranking algorithm and failure to integrate other meaningful metrics into that algorithm.
To investigate which ranking metrics most contributed to overall USN ranking, Webster (2001) performed a principal component analysis of all 11 ranking metrics used by USN to calculate their national universities rankings. Webster (2001) found that academic reputation most contributed to ranking, prefacing future studies regarding the role of institutional assessments of other institutions producing a stratified ranking hierarchy (Bastedo & Bowman, 2010; Sauder & Espeland, 2009; Volkwein & Sweitzer, 2006). This finding led Webster (2001) to criticize the rankings for placing such a heavy emphasis on subjective measurements (e.g., peer administrator rankings) instead of objectively measurable institutional metrics, such as a college’s cost of attendance or its tuition rate stability over time.
However, Webster (2001) also discovered “severe and pervasive multicollinearity among the ranking criteria” (p. 235), with average SAT score of enrolled students being the most significant ranking criterion, even though some institutions have not required the SAT, nor has any major, national-level study found SAT score predictive of institutional quality, graduation rates, retention rates, or other student- and institutional-level outcomes. As a result, Webster (2001) argued that students and other stakeholders may be making decisions based on a ranking system that primarily relies on a single test score and ignores institutional support of students and an institution’s affordability. Similarly, Bougnol and Dulá (2015) expanded upon Webster’s (2001) study, arguing that USN rankings may take into account average SAT scores of enrolled students, but within the USN ranking algorithm, there has been no differentiating metric among institutions with similar student
- 8 -
outcome metrics but different student enrollment or quality metrics. Bougnol and Dulá (2015) explained:
If we compare two imaginary universities in a ranking using the USNWR model with identical values for all attributes except “SAT/ACT Score” we may conclude that the one with the lower of these two values is more efficient; it produces the same outcomes with the same inputs but proportionately fewer top-testing students. (p. 861)
Here, Bougnol and Dulá (2015) argued that the USN algorithm has not allowed for differentiation between institutions who recruit and retain less-academically advanced students or institutions who produce similar student outcome metrics (e.g., retention rates) with considerably fewer financial resources. This criticism from Bougnol and Dulá (2015) was elaborated upon in their discussion of Webster’s (2001) discovery of multicollinearity inherent in the USN ranking algorithm. Bougnol and Dulá (2015) argued that not only do many USN metrics produce substantial variance inflation factors within regression models predicting ranking, but many institutions could receive the same scores in multiple categories, leading to a lack of differentiation between institutions. This lack of differentiation, for Bougnol and Dulá (2015), may be confusing prospective students exploring postsecondary institutions. These flaws in the USN ranking algorithm led Bougnol and Dulá (2015) to assert that prospective students may use USN rankings to make decisions based using problematic metrics that do not capture how colleges and universities support students from diverse educational or financial backgrounds.
Also related to educational and financial outcomes, Owings-Edwards (2005) reasoned that one of the primary purposes of pursuing higher education is to gain employment after graduation, suggestion echoed by prior research (Chapman, 1981; Paulsen, 1990). Major national surveys have indicated that prospective students often choose colleges based on the perceived earning potential of a degree from a certain institution (Owings-Edwards, 2005). However, Owings-Edwards (2005) found that no statistically significant relationship existed between USN ranking and wage earned after graduation, bringing into question how USN may not be addressing post-graduation outcomes which have been critically important for students and their ability to pay back their student loans. Owings-Edwards (2005) also argued that USN ought to update or alter their ranking algorithm to reflect student behaviors and labor market realities, thus providing students with a better sense of a college’s affordability and how that college may prepare students for their careers.
Finally, given the rise of internet technologies in the student choice process, both Alsmadi and Taylor (2018) and Taylor et al. (2019)

- 9 -
argued that the USN ranking algorithm—for both undergraduate and graduate institutions—do not control for web presence or scholarly research output, leading to an entire digital landscape falling outside of the scope of the rankings. Alsmadi and Taylor (2018) learned that highly-ranked USN institutions often publish larger and more popular websites than lower-ranked peers, while Taylor et al. (2019) reasoned that higher-ranked graduate education programs published smaller but more popular websites than lower-ranked peers. Here, educational research has posited that the Internet has been a critical source of student information for decades (Alsmadi & Taylor, 2018; Morse, 2008; Taylor et al., 2019), yet the USN ranking algorithm has not captured any web-related data, much less data related to college affordability amidst the student debt crisis (Patel, 2019).
As a result, this study fills a considerable gap in the literature related to both U.S. News & World Report rankings and college affordability by answering the following two questions:1.) Does USN ranking correlate with college affordability metrics? 2.) Controlling for all USN ranking metrics and removing multicollinearity (Bougnol & Dulá, 2015; Webster, 2001), how do college affordability metrics predict USN ranking across both national and regional rankings?
RESEARCH METHOD
The following sections detail how the research team established population and sample, collected data, analyzed data, and addressed limitations. This study employs multiple regression to answer the research questions and evaluate how USN measures national and regional universities. In addition, this study makes use of data from multiple sources to make a unique contribution to the literature and provide ample evidence for further exploration into the relationship between institutional rankings and college affordability.
Population and Sample For the 2018 USN rankings, a total of 920 institutions reported complete statistics to USN. All 920 of these institutions are included in the regression analyses, and these institutions were sorted by overall ranking across the five major university ranking categories from USN: national universities (n=301), regional north universities (n=187), regional south universities (n=141), regional midwest universities (n=164), and regional west universities (n=127). All grant, aid, and price related data were

- 10 -
extracted from IPEDS and is not captured by USN rankings. A description of the institutions in this study can be found in Table 1.
Data Collection
All data for this study was gathered from two sources: the 2018 U.S. News & World Report rankings and 2016-2017 institutional data from the Integrated Postsecondary Educational Data System ([IPEDS]; National Center for Education Statistics [NCES], 2019). All institutions of higher education report institutional data to NCES and IPEDS so researchers and policymakers can understand enrollment trends, institutional change, and effects of local, state, and national level policies. For the 2018 USN rankings, institutions reported data to USN one year prior (2017), and a result, 2016-2017 IPEDS data was relevant to 2018 USN rankings.
USN produces rankings of national universities, regional universities, and liberal arts colleges. As liberal arts colleges are traditionally private and have much higher tuition rates than national and regional universities (Bowman & Bastedo, 2009; Morse, 2008), this study focuses on national and regional universities. National universities are generally comprehensive, four-year institutions with some level of Carnegie research classification designation, while regional universities are generally smaller in enrollment and primarily focus on undergraduate education and teaching (Morse, 2008). Of USN variables, the research team gathered 18 metrics used to calculate overall ranking for both

- 11 -
national universities and all regional universities: retention rank, six-year graduation rate, Pell grant graduation rate, retention rate, predicted graduation rate, reputation score, faculty resources rank, percentage of full-time faculty, percentage of faculty with terminal degrees, percentage of classes with ten or fewer students, percentage of classes with fifty or more students, student-to-faculty ratio, selectivity rank, percentage of students in the top 10% of their high school class, percentage of students in the top 25% of their high school class, educational expenses, alumni giving rank, and alumni giving rate. These variables are included in every regression analysis in Tables 3 and 4.
Of IPEDS variables related to college affordability, the research team built upon the Best Values Schools’ (2019) calculation of college affordability by gathering both aid metrics and institutional price metrics. From IPEDS, the research team gathered percentage of students receiving federal grants, percentage of students receiving Pell Grants, percentage of students receiving other federal aid, percentage of students receiving state aid, percentage of students receiving institutional aid, total price for students from in-district living on-campus, total price for students from in-state living on-campus, and total price for students from out-of-state living on-campus.
Finally, the research team used IPEDS to gather institutional metrics related to sector (public or private) and institutional endowment, as prior studies have indicated that USN ranking has produced different effects across institutions from various sectors (Meredith, 2004) and with access to different levels of financial resources (Gnolek et al., 2014; Monks & Ehrenberg, 1999). Data Analysis
To answer this study’s first question, the research team performed a simple correlation analysis using Pearson’s correlation between institutional ranking and all college affordability metrics (Table 2). To answer this study’s second research question, the research team used Python and its numpy and statsmodels packages to perform a series of experimental OLS regressions to predict USN ranking as an outcome variable using both USN ranking metrics and IPEDS college affordability metrics. The first series of OLS models intentionally included multicollinear USN ranking variables, as explained by Webster (2001) to demonstrate how these variables were both collinear with each other and possibly collinear with other IPEDS college affordability metrics (Table 3). Moreover, both USN and IPEDS variables were not transformed
- 12 -
(logged) to the logarithmic scale to explore the multicollinearity eluded to by prior studies (Bougnol & Dulá, 2015; Webster, 2001).
For the second series of OLS models, the research team imputed logged variables of large scales (e.g., institutional endowments, total prices) and performed variance inflation factor (VIF) analyses to remove multicollinearity of both USN and IPEDS variables from the model, as encouraged by prior research (Bougnol & Dulá, 2015; Webster, 2001). These regression models predicted USN ranking as our outcome variable. VIF analyses required the research team to continuously run OLS regressions with all variables, including logged variables, and removing variables with VIF over 10, as VIFs over 10 likely indicate multicollinearity in a regression model. Each variable with a VIF over 10 was removed in the order of VIF, with the variables with the largest VIFs removed in order until the OLS model only included variables with VIFs under 10. The refined OLS models without multicollinear variables can be found in Table 4 across the entire population (N=920) and each USN ranking category.
RESULTS
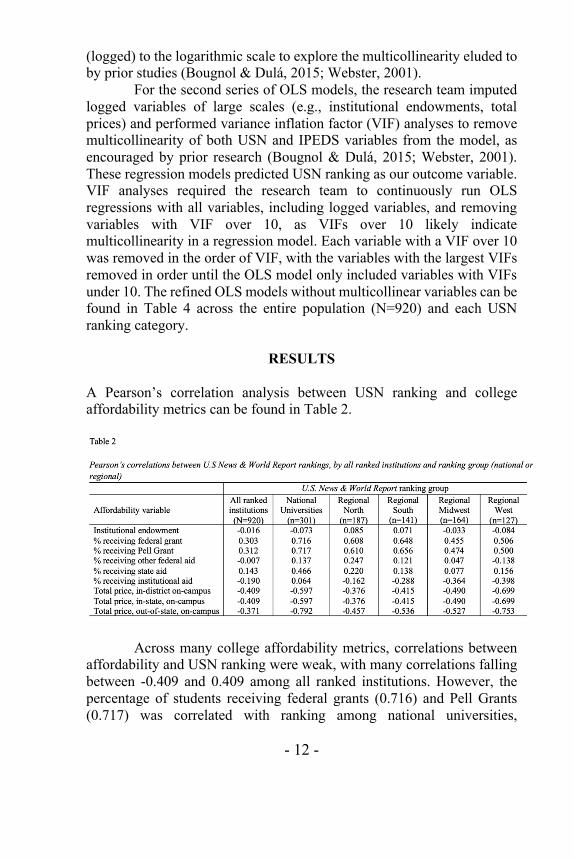
A Pearson’s correlation analysis between USN ranking and college affordability metrics can be found in Table 2.
Across many college affordability metrics, correlations between affordability and USN ranking were weak, with many correlations falling between -0.409 and 0.409 among all ranked institutions. However, the percentage of students receiving federal grants (0.716) and Pell Grants (0.717) was correlated with ranking among national universities,

- 13 -
indicating that better-ranked national universities were associated with lower percentages of students receiving federal and Pell Grants. High, inverse correlations between national university ranking and out-of-state, on-campus total price (-0.792) also indicated that better-ranked institutions were associated with higher total prices. This high, inverse correlation between ranking and total price was apparent among regional west universities (-0.753), also indicating that better-ranked regional west universities were associated with higher total prices.
Correlations across all ranking groups also suggest ranking may be unrelated to percentage of students receiving other federal aid, state aid, or institutional aid, indicating that USN ranking may not be correlated with many traditional college affordability metrics. The USN ranking does include an institution’s financial resources and its per-student spending, yet this inclusion may be confusing to students, as students may assume highly-ranked institutions with high financial resource scores may be more affordable. These findings could inform a student’s college choice, primarily asserting that USN rankings may not be related to college affordability. Regression analyses predicting USN ranking without removing multicollinear variables can be found in Table 3.
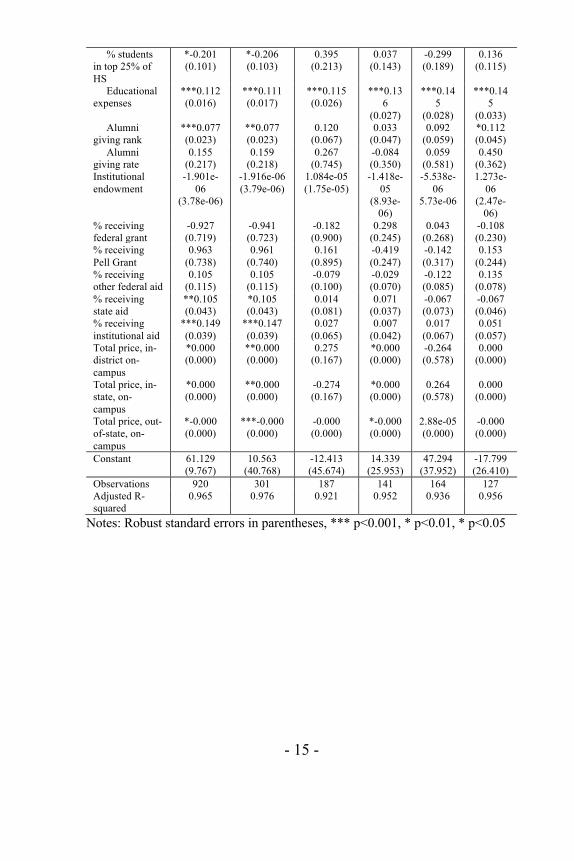
Evidenced by prior research (Bougnol & Dulá, 2015; Webster, 2001) and the data in Table 3, results suggest multicollinearity may exist within the USN ranking criteria when integrated with college affordability metrics. These experimental results suggest reputation score is highly predictive of ranking even when controlling for college affordability metrics, a finding hinted at by prior research (Bastedo & Bowman, 2010). Moreover, educational expenses and selectivity rank were also highly predictive of ranking, along with other traditional measures of institutional quality such as retention rank, and faculty resources rank. Of college affordability metrics, only the percentage of students receiving institutional aid was highly predictive of ranking among the entire population and national universities, yet institutional endowment was not. Future research should investigate this finding, as educational researchers may assume that wealthy institutions with large endowments may be best suited to provide higher levels of institutional aid. Regression analyses predicting USN ranking after performing VIF and removing multicollinear variables can be found in Table 4.

- 14 -
Table 3 Regression analyses predicting U.S News & World Report rankings, by all ranked institutions and ranking group (national or regional), without removing multicollinearity
U.S. News & World Report ranking group
Variables
All ranked institutions (N=920)
National Universitie
s (n=301)
Regional North
(n=187)
Regional
South (n=141)
Regional
Midwest (n=164)
Regional West
(n=127)
Sector (control=private)
***8.357 (2.269)
**14.683 (4.893)
*14.107 (6.724)
5.846 (3.717)
-5.268 (5.326)
*12.449 (4.802)
USN ranking metrics
Retention rank
***0.430 (0.017)
***0.407 (0.054)
***0.638 (0.074)
***0.539
(0.073)
***0.565
(0.066)
***0.665
(0.105) Six-year graduation rate
-0.077 (0.088)
-0.321 (0.252)
**0.971 (0.334)
0.132 (0.222)
0.193 (0.208)
**0.700 (0.212)
Pell Grant graduation rate
*-0.126 (0.058)
0.080 (0.142)
0.271 (0.164)
-0.157 (0.110)
-0.144 (0.142)
**-0.285 (0.095)
Retention rate
*0.199 (0.028)
0.396 (0.235)
0.247 (0.265)
**0.512 (0.190)
*0.482 (0.244)
0.134 (0.157)
Predicted graduation rate
**0.210 (0.090)
***0.913 (0.201)
0.132 (0.240)
0.310 (0.189)
0.098 (0.197)
0.247 (0.134)
Reputation score
***-25.749 (1.542)
***-22.901 (2.897)
***-50.207 (4.698)
***-17.855 (3.147)
***-27.876 (3.840)
***-20.631 (2.938)
Faculty resources rank
***0.083 (0.011)
***0.102 (0.021)
**0.105 (0.032)
***0.102
(0.027)
***0.115
(0.030)
***0.108
(0.025) % full-time faculty
0.027 (0.038)
-0.022 (0.086)
0.001 (0.105)
-0.164 (0.085)
0.017 (0.096)
-0.086 (0.065)
% faculty with terminal degree
-0.059 (0.045)
-0.074 (0.139)
0.051 (0.128)
-0.103 (0.075)
-0.015 (0.100)
-0.090 (0.066)
% classes with <10 students
0.042 (0.035)
0.097 (0.089)
-0.049 (0.102)
-0.030 (0.056)
-0.092 (0.091)
-0.037 (0.059)
% classes with >50 students
***0.338 (0.109)
0.124 (0.188)
0.061 (0.523)
0.240 (0.183)
0.153 (0.425)
0.110 (0.218)
Student-to-faculty ratio
-0.273 (0.163)
-0.276 (0.164)
0.017 (0.045)
0.057 (0.157)
-0.053 (0.182)
-0.090 (0.150)
Selectivity rank
***0.143 (0.027)
***0.141 (0.027)
***0.187 (0.045)
***0.237
(0.043)
**0.116 (0.039)
***0.207
(0.038) % students in top 10% of HS
0.085 (0.109)
0.091 (0.111)
*-0.640 (0.316)
-0.015 (0.238)
0.508 (0.264)
-0.095 (0.191)
- 15 -
% students in top 25% of HS
*-0.201 (0.101)
*-0.206 (0.103)
0.395 (0.213)
0.037 (0.143)
-0.299 (0.189)
0.136 (0.115)
Educational expenses
***0.112 (0.016)
***0.111 (0.017)
***0.115 (0.026)
***0.136
(0.027)
***0.145
(0.028)
***0.145
(0.033) Alumni giving rank
***0.077 (0.023)
**0.077 (0.023)
0.120 (0.067)
0.033 (0.047)
0.092 (0.059)
*0.112 (0.045)
Alumni giving rate
0.155 (0.217)
0.159 (0.218)
0.267 (0.745)
-0.084 (0.350)
0.059 (0.581)
0.450 (0.362)
Institutional endowment
-1.901e-06
(3.78e-06)
-1.916e-06 (3.79e-06)
1.084e-05 (1.75e-05)
-1.418e-05
(8.93e-06)
-5.538e-06
5.73e-06
1.273e-06
(2.47e-06)
% receiving federal grant
-0.927 (0.719)
-0.941 (0.723)
-0.182 (0.900)
0.298 (0.245)
0.043 (0.268)
-0.108 (0.230)
% receiving Pell Grant
0.963 (0.738)
0.961 (0.740)
0.161 (0.895)
-0.419 (0.247)
-0.142 (0.317)
0.153 (0.244)
% receiving other federal aid
0.105 (0.115)
0.105 (0.115)
-0.079 (0.100)
-0.029 (0.070)
-0.122 (0.085)
0.135 (0.078)
% receiving state aid
**0.105 (0.043)
*0.105 (0.043)
0.014 (0.081)
0.071 (0.037)
-0.067 (0.073)
-0.067 (0.046)
% receiving institutional aid
***0.149 (0.039)
***0.147 (0.039)
0.027 (0.065)
0.007 (0.042)
0.017 (0.067)
0.051 (0.057)
Total price, in-district on-campus
*0.000 (0.000)
**0.000 (0.000)
0.275 (0.167)
*0.000 (0.000)
-0.264 (0.578)
0.000 (0.000)
Total price, in-state, on-campus
*0.000 (0.000)
**0.000 (0.000)
-0.274 (0.167)
*0.000 (0.000)
0.264 (0.578)
0.000 (0.000)
Total price, out-of-state, on-campus
*-0.000 (0.000)
***-0.000 (0.000)
-0.000 (0.000)
*-0.000 (0.000)
2.88e-05 (0.000)
-0.000 (0.000)
Constant 61.129 (9.767)
10.563 (40.768)
-12.413 (45.674)
14.339 (25.953)
47.294 (37.952)
-17.799 (26.410)
Observations 920 301 187 141 164 127 Adjusted R-squared
0.965 0.976 0.921 0.952 0.936 0.956
Notes: Robust standard errors in parentheses, *** p<0.001, * p<0.01, * p<0.05

- 16 -
Table 4 Regression analyses predicting U.S News & World Report rankings, by all ranked institutions and ranking group (national or regional), after logging variables, VIF analysis, and removal of multicollinearity
U.S. News & World Report ranking group
Variables
All ranked institutions (N=920)
National Universitie
s (n=301)
Regional North
(n=187)
Regional
South (n=141)
Regional
Midwest (n=164)
Regional West
(n=127)
Sector (control=private)
*3.998 (1.728)
6.131 (3.658)
2.969 (5.956)
2.697 (3.970)
9.022 (6.007)
7.776 (4.220)
USN ranking metrics
Retention rank
***0.429 (0.016)
- -
- -
- -
- -
- -
Six-year graduation rate
- -
- -
- -
- -
- -
- -
Pell Grant graduation rate
*-0.141 (0.054)
***-1.131 (0.121)
***-0.706 (0.171)
***-0.853
(0.117)
***-1.219
(0.122)
***-0.651
(0.088) Retention rate
*0.231 (0.085)
***-0.840 (0.246)
-0.532 (0.300)
***-0.767
(0.198)
-0.375 (0.258)
***-0.509
(0.145) Predicted graduation rate
***0.408 (0.072)
- -
0.186 (0.275)
*0.462 (0.202)
0.217 (0.237)
*0.341 (0.141)
Reputation score
***-25.308 (1.567)
***-25.319 (3.498)
***-52.731 (5.884)
***-17.279 (4.186)
***-28.935 (4.893)
***-19.037 (3.490)
Faculty resources rank
***0.077 (0.011)
***0.140 (0.026)
**0.037 (0.040)
***0.132
(0.035)
**0.126 (0.036)
***0.143
(0.031) % full-time faculty
0.028 (0.039)
0.197 (0.102)
0.001 (0.105)
0.024 (0.109)
-0.046 (0.121)
0.092 (0.076)
% faculty with terminal degree
-0.076 (0.046)
-0.011 (0.171)
0.051 (0.128)
-0.134 (0.100)
0.095 (0.126)
-0.130 (0.082)
% classes with <10 students
*0.068 (0.034)
*0.206 (0.104)
-0.049 (0.102)
-0.017 (0.074)
0.043 (0.105)
0.034 (0.070)
% classes with >50 students
***0.365 (0.103)
*-0.462 (0.217)
0.061 (0.523)
-0.050 (0.249)
-0.254 (0.546)
-0.201 (0.255)
Student-to-faculty ratio
-0.114 (0.095)
-0.415 (0.221)
0.070 (0.346)
0.057 (0.157)
-0.177 (0.236)
-0.164 (0.197)
Selectivity rank
***0.149 (0.014)
**0.068 (0.024)
***0.231 (0.050)
***0.211
(0.055)
**0.189 (0.047)
***0.269
(0.044) % students in top 10% of HS
- -
- -
-0.190 (0.218)
-0.052 (0.174)
0.259 (0.190)
- -

- 17 -
% students in top 25% of HS
-0.005 (0.037)
- -
- -
- -
- -
0.153 (0.080)
Educational expenses
***0.133 (0.010)
***0.094 (0.020)
***0.117 (0.032)
***0.170
(0.034)
***0.143
(0.034)
***0.150
(0.040) Alumni giving rank
***0.078 (0.014)
***0.109 (0.026)
***0.142 (0.032)
0.115 (0.064)
**0.104 (0.033)
*0.127 (0.056)
Alumni giving rate
*0.319 (0.130)
**0.643 (0.241)
- -
0.479 (0.472)
- -
0.639 (0.428)
Institutional endowment (log)
-0.038 (0.258)
-0.272 (0.597)
0.004 (0.942)
0.073 (0.518)
-0.012 (0.701)
0.280 (0.056)
% receiving federal grant
- -
- -
- -
- -
- -
- -
% receiving Pell Grant
- -
- -
- -
- -
- -
- -
% receiving other federal aid
-0.034 (0.042)
-0.044 (0.136)
-0.053 (0.128)
-0.019 (0.086)
-0.140 (0.108)
0.016 (0.095)
% receiving state aid
-0.010 (0.021)
0.035 (0.048)
-0.050 (0.078)
-0.052 (0.046)
*-0.210 (0.084)
*-0.107 (0.048)
% receiving institutional aid
0.018 (0.023)
*0.107 (0.049)
-0.065 (0.079)
-0.011 (0.057)
0.043 (0.085)
-0.005 (0.070)
Total price, in-district on-campus (log)
- -
- -
- -
- -
- -
- -
Total price, in-state, on-campus (log)
- -
- -
- -
- -
- -
- -
Total price, out-of-state, on-campus (log)
0.090 (2.682)
*-16.419 (6.767)
14.956 (9.931)
-3.992 (6.495)
-2.320 (7.813)
6.615 (6.380)
Constant 38.203 (27.462)
436.783 (77.377)
94.169 (108.619)
188.173 (71.146)
200.056 (87.468)
44.228 (65.394)
Observations 920 301 187 141 164 127 Adjusted R-squared
0.964 0.962 0.864 0.908 0.890 0.931
Notes: Robust standard errors in parentheses, *** p<0.001, * p<0.01, * p<0.05 After performing VIF analyses and removing multicollinear variables from each model, several USN and college affordability metrics were predictive of USN ranking. Among all ranked institutions (N=920), retention rank, reputation score, faculty resources rank, percentage of classes with over fifty students, selectivity rank, educational expenses, and alumni giving rank were strongly predictive of USN ranking (p < 0.001). Related to college affordability, only the USN metric capturing Pell grant graduation rates was predictive of ranking (p < 0.05).
However, across all other ranking groups, Pell grant graduation rate was highly predictive of USN ranking, along with other USN metrics such as reputation score, faculty resources rank, selectivity rank, and

- 18 -
educational expenses. These findings echo prior research which has suggested that student selectivity metrics (Webster, 2001) and reputation scores (Bastedo & Bowman, 2010) may be overly influential or problematic in USN rankings, as these scores are calculated subjectively by surveying peer administrators and not based on empirical data or measurable institutional characteristics. However, data in this study indicates that several USN ranking metrics may be predictive of rank for some institutions but not others. One traditional measure of educational quality has been retention rate, or the rate at which first-year students remain at an institution for their second year. Retention rate was not predictive of ranking among Regional North and Midwest universities, while retention rate strongly predicted ranking among National, Regional North, and Regional South universities. The same phenomenon occurred with students-per-class metrics (predictive of ranking for National universities) and alumni giving rates (predictive of ranking for National universities). This finding suggests that several USN ranking metrics may better predict ranking of National universities than Regional universities, controlling for sector, institutional wealth (endowment), and college affordability metrics.
Specific to college affordability metrics, data suggest total price for out-of-state students living on-campus was predictive of ranking among National universities (coef: -16.419), indicating that better-ranked, elite institutions likely charge much more than lower-ranked institutions after controlling for all USN ranking metrics and other college affordability metrics. However, the percentage of students receiving institutional aid was also predictive of ranking among National universities (coef: 0.107), indicating that lower-ranked, less-elite National universities may provide more institutional aid than higher-ranked National universities. Here, these two findings indicate that some college affordability metrics may predict USN ranking among National universities, but these affordability metrics indicate that the better-ranked and more elite an institution is, the more they charge in total price and the less they give in institutional aid. These findings represent new contributions to the literature, as prior studies only investigated how high-ability students use USN rankings to inform their college choice (Griffith & Rask, 2007) and how institutions attempt to improve their rank (Bastedo & Bowman, 2010; Bowman & Bastedo, 2009).
Analyzing other college affordability metrics, other federal aid and institutional aid was not predictive of ranking among any Regional university group, with total price charged to out-of-state students living on-campus not predictive of ranking among any Regional university group

- 19 -
either. However, the percentage of students receiving state aid among Regional Midwest (coef: -0.210, p < 0.05) and West universities (coef: -0.107, p < 0.05) was predictive of USN ranking. The negative coefficients indicate that Midwest and Western states—home to Regional Midwest and West universities—awarded more state aid to students at highly-ranked, more elite universities than lower-ranked, less elite universities in those states. Controlling for all USN metrics and many college affordability metrics, data in this study suggest USN ranking may not be related to many college affordability metrics. Similarly, if college affordability metrics are predictive USN ranking, these affordability metrics are not favorable for prospective and current students, especially those who may not be academically competitive enough for the highest ranked institutions in the National universities category. Low levels of institutional aid and high total prices were related to better rankings among National universities. Meanwhile state aid—a metric of which universities themselves have no control—predicts better USN ranking only among Regional Midwest and West universities.
As a result, prospective students may be using the USN rankings system to inform where they apply and enroll in postsecondary education (Altbach, 2012; Bowman & Bastedo, 2009; Griffith & Rask, 2007; Meredith, 2004; Monks & Ehrenberg, 1999; Morse, 2008; Owings-Edwards, 2005; Sauder & Lancaster, 2006; Taylor et al., 2019). However, little empirical evidence exists to suggest the USN rankings have anything to do with college affordability, and if they do, the USN ranking does not reward college affordability as measured by total price or aid reception.
Limitations
As with any study analyzing USN rankings or any ranking system in general, limitations arise when institutions are relied on to report accurate data, a limitation recently addressed by the higher education community (Jaschik, 2018, 2019). Moreover, this study is delimited by the institutions included in the data collection and data analysis, as this study did not gather liberal arts colleges data, understanding that many liberal arts colleges do not report complete data to either USN or the National Center for Education Statistics. However, national universities and regional universities reported complete 2018 USN data, in addition to complete data reported to IPEDS in 2016-2017 regarding college affordability metrics. Additionally, this study only captures one year of USN rankings and IPEDS data, partially owed to the time-consuming process of imputing USN data and the changing nature of the USN ranking algorithm from year to year (Morse, Brooks, & Mason, 2018).

- 20 -
As a result, future studies could focus on liberal arts colleges and datasets spanning longer periods of time to better understand how college affordability does or does not affect the USN rankings and other pertinent student outcomes, such as student debt upon graduating and future wages, also recommended by prior research (Owings-Edwards, 2005). In addition, both qualitative and quantitative researchers could investigate student impressions of postsecondary ranking systems and how students view college and university competition, building upon prior work into competition in higher education (Brankovic, 2018; Hazelkorn, 2007, 2009).
DISCUSSION AND CONCLUSIONS
As the first study of its kind to assess college affordability as a predictor of a commonly used, well-researched, highly influential college and university rankings system, this study makes several important contributions to the literature. First, answering this study’s first research question, data suggest USN ranking is only slightly correlated with college affordability metrics (Table 2). When these metrics do correlate with ranking, they are often correlated with higher total prices or a lower percentage of students receiving aid. Although a high ranking in the Regional West universities group was correlated with lower total prices (-0.699), many other college affordability metrics are not correlated with better-ranked USN colleges and universities. For instance, many of the most elite, well-resources colleges and universities in the world were ranked in the USN National universities group in 2016-2017, including Harvard University, Stanford University, the Massachusetts Institute of Technology, and the University of California at Los Angeles. However, the highest-ranked, most elite institutions in this USN ranking group were highly correlated with low percentages of students receiving federal or Pell grants and higher total prices. Although many students applying to these elite institutions may come from wealthy, privileged backgrounds and do not require Pell grants to afford the costs of college, data in this study suggest the most elite institutions in the United States may also be the most unaffordable for many students from middle- or low-income backgrounds. This finding—that the best ranked institutions may be the most unaffordable—is troubling, given the pressure prospective students face to not only gain entry to the best institution but also be cognizant of their ability to afford that institution. Here, the USN rankings may be influencing prospective
- 21 -
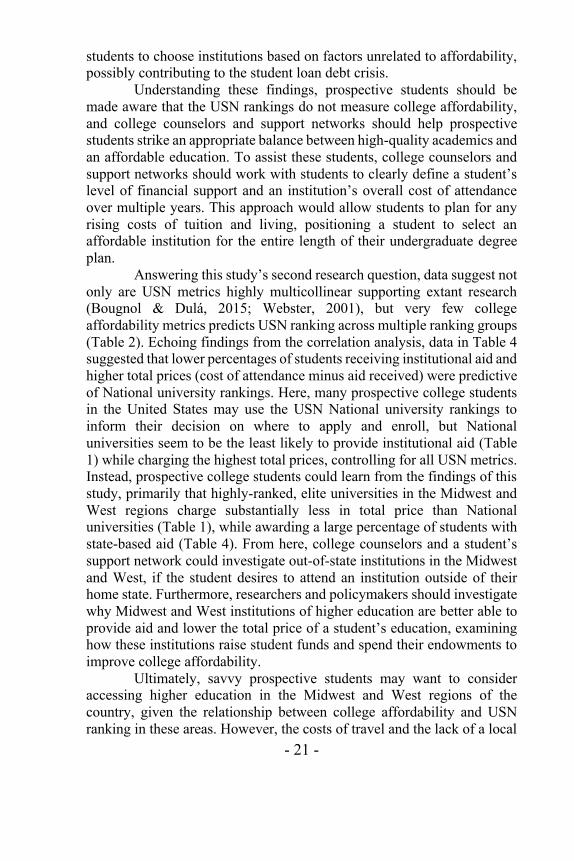
students to choose institutions based on factors unrelated to affordability, possibly contributing to the student loan debt crisis.
Understanding these findings, prospective students should be made aware that the USN rankings do not measure college affordability, and college counselors and support networks should help prospective students strike an appropriate balance between high-quality academics and an affordable education. To assist these students, college counselors and support networks should work with students to clearly define a student’s level of financial support and an institution’s overall cost of attendance over multiple years. This approach would allow students to plan for any rising costs of tuition and living, positioning a student to select an affordable institution for the entire length of their undergraduate degree plan. Answering this study’s second research question, data suggest not only are USN metrics highly multicollinear supporting extant research (Bougnol & Dulá, 2015; Webster, 2001), but very few college affordability metrics predicts USN ranking across multiple ranking groups (Table 2). Echoing findings from the correlation analysis, data in Table 4 suggested that lower percentages of students receiving institutional aid and higher total prices (cost of attendance minus aid received) were predictive of National university rankings. Here, many prospective college students in the United States may use the USN National university rankings to inform their decision on where to apply and enroll, but National universities seem to be the least likely to provide institutional aid (Table 1) while charging the highest total prices, controlling for all USN metrics. Instead, prospective college students could learn from the findings of this study, primarily that highly-ranked, elite universities in the Midwest and West regions charge substantially less in total price than National universities (Table 1), while awarding a large percentage of students with state-based aid (Table 4). From here, college counselors and a student’s support network could investigate out-of-state institutions in the Midwest and West, if the student desires to attend an institution outside of their home state. Furthermore, researchers and policymakers should investigate why Midwest and West institutions of higher education are better able to provide aid and lower the total price of a student’s education, examining how these institutions raise student funds and spend their endowments to improve college affordability.
Ultimately, savvy prospective students may want to consider accessing higher education in the Midwest and West regions of the country, given the relationship between college affordability and USN ranking in these areas. However, the costs of travel and the lack of a local

- 22 -
support system for an out-of-state undergraduate may serve as deterrents for students to choose an institution of higher education far from home. As a result, prospective students from more expensive USN regions may be unfairly marginalized from local institutions of higher education. Future research could explore how both in-state and out-of-state students view the affordability of in-state and out-of-state institutions and whether this perception influences their future college enrollment plans. Additionally, researchers could advocate for students to use alternative forms of rankings that do emphasize college affordability, such as the College Consensus (2019) and Niche (2019) ranking systems, in conjunction with better established ranking systems, such as U.S. News & World Report. Striking a balance between ranking systems that measure educational quality and college affordability would likely result in prospective students feeling better informed and more confident that they can not only access the institution of their choosing but afford it, too.
However, the USN rankings are important in that this ranking system has been well researched and captures many institutional quality metrics, such as graduation rates and faculty support. However, prospective students could better understand their college choice by balancing important USN institutional quality metrics—such as retention rates—with college affordability metrics—such as total price or aid awarded—to make the most fiscally responsible decision possible. As a result, prospective students could be better informed about their institution of choice and their own financial future, contributing to a more equitable system which works toward decreasing student loan debt and increasing college access across the United States.
REFERENCES
Alsmadi, I., & Taylor, Z. W. (2018). Examining university ranking metrics: Articulating issues of size and web dependency. ICCBD '18 Proceedings of the 2018 International Conference on Computing and Big Data, pp. 73-77. https://doi.org/10.1145/3277104.3277111
Altbach, P. G. (2012). The globalization of college and university rankings. Change: The Magazine of Higher Learning, 44(1), 26-31. https://doi.org/10.1080/00091383.2012.636001
Bastedo, M. N., & Bowman, N. A. (2010). U.S. News & World Report college rankings: Modeling institutional effects on organizational reputation. American Journal of Education, 116(2), 163-183. https://doi.org/10.1086/649437

- 23 -
Best Value Schools. (2019). The 25 most affordable universities in America 2019. Retrieved from https://www.bestvalueschools.com/most-affordable-universities-america/
Bougnol, M.-L., & Dulá, J. H. (2015). Technical pitfalls in university rankings. Higher Education, 69(5), 859-866. https://doi.org/10.1007/s10734-014-9809-y
Bowman, N. A., & Bastedo, M. N. (2009). Getting on the front page: Organizational reputation, status signals, and the impact of U.S. News and World Report on student decisions. Research in Higher Education, 50(5), 415-436. https://doi.org/10.1007/s11162-009-9129-8
Brankovic, J. (2018). The status games they play: Unpacking the dynamics of organisational status competition in higher education. Higher Education, 75(4), 695-709. https://doi.org/10.1007/s10734-017-0169-2
Chapman, D.W. (1981). A model of student college choice. The Journal of Higher Education, 52(5), 490-505. https://doi.org/10.1080/00221546.1981.11778120
College Consensus. (2019). 100 most affordable colleges & universities. Retrieved from https://www.collegeconsensus.com/rankings/most-affordable-schools/
Ehrenberg, R. G. (2002). Reaching for the brass ring: The U.S. News & World Report rankings and competition. The Review of Higher Education, 26(2), 145-162. https://doi.org/10.1353/rhe.2002.0032
Friedman, Z. (2019). Student loan debt statistics in 2019: A $1.5 trillion crisis. Retrieved from https://www.forbes.com/sites/zackfriedman/2019/02/25/student-loan-debt-statistics-2019/#12ac0a9a133f
Gnolek, S. L., Falciano, V. T., & Kuncl, R. W. (2014). Modeling change and variation in U.S. News & World Report college rankings: What would it really take to be in the top 20? Research in Higher Education, 55(8), 761-779. https://doi.org/10.1007/s11162-014-9336-9
Grewal, R., Dearden, J. A., & Glilien, G. L. (2008). The university rankings game: Modeling the competition among universities for ranking. The American Statistician, 62(3), 232-237. https://doi.org/10.1198/000313008X332124
Griffith, A., & Rask, K. (2007). The influence of the US News and World Report collegiate rankings on the matriculation decision of high-ability students: 1995–2004. Economics of Education Review, 26(2), 244-255. https://doi.org/10.1016/j.econedurev.2005.11.002
Hazelkorn, E. (2007). The impact of league tables and ranking systems on higher education decision making. Higher Education Management and Policy, 19(2), 1-24. http://dx.doi.org/10.1787/hemp-v19-art12-en
Hazelkorn, E. (2009). Impact of global rankings on higher education research and production of knowledge. Unesco Forum on Higher Education, Research and Knowledge, (18), 1-14. https://doi.org/10.21427/D7BG9J

- 24 -
Jaschik, S. (2018). 8 more colleges submitted incorrect data for rankings. Retrieved from https://www.insidehighered.com/admissions/article/2018/08/27/eight-more-colleges-identified-submitting-incorrect-data-us-news
Jaschik, S. (2019). Oklahoma gave false data for years to 'U.S. News,' loses ranking. Retrieved from https://www.insidehighered.com/admissions/article/2019/05/28/university-oklahoma-stripped-us-news-ranking-supplying-false
McDonough, P.M. (1997). Choosing colleges: How social class and schools structure opportunity. Albany, NY: SUNY Press.
Meredith, M. (2004). Why do universities compete in the ratings game? An empirical analysis of the effects of the U.S. News and World Report college rankings. Research in Higher Education, 45(5), 443-461. https://doi.org/10.1023/B:RIHE.0000032324.46716.f4
Monks, J., & Ehrenberg, R. G. (1999). U.S. News & World Report's college rankings: Why they do matter. Change: The Magazine of Higher Learning, 31(6), 42-51. https://doi.org/10.1080/00091389909604232
Morse, R., Brooks, E., & Mason, M. (2018). How U.S. News calculated the 2019 best college rankings. Retrieved from https://www.usnews.com/education/best-colleges/articles/how-us-news-calculated-the-rankings
Morse, R. J. (2008). The real and perceived influence of the US News ranking. Higher Education in Europe, 33(2-3), 349-356. https://doi.org/10.1080/03797720802254262
National Center for Education Statistics. (2019). Integrated postsecondary educational data system: Use the data. Retrieved from https://nces.ed.gov/ipeds/datacenter/login.aspx?gotoReportId=1
Niche. (2019). 2019 best value colleges in America. Retrieved from https://www.niche.com/colleges/search/best-value-colleges/
Owings-Edwards, S. (2005). The effect on wage of attending a US News and World Report best college. Journal of College Teaching and Learning, 2(10), 21-32. https://doi.org/10.19030/tlc.v2i10.1870
Patel, V. (2019). How rising college costs and student debt contribute to a social-mobility 'crisis'. Retrieved from https://www.chronicle.com/article/How-Rising-College-Costs-and/246619
Paulsen, M.B. (1990). College choice: Understanding student enrollment behavior. 1990 ASHE-ERIC Higher Education Reports. Retrieved from https://files.eric.ed.gov/fulltext/ED333855.pdf
Sauder, M., & Espeland, W. N. (2009). The discipline of rankings: Tight coupling and organizational change. American Sociological Review, 74(1), 63-82. https://doi.org/10.1177/000312240907400104
Sauder, M., & Lancaster, R. (2006). Do rankings matter? The effects of U.S. News & World Report rankings on the admissions process of law schools. Law
- 25 -
& Society Review, 40(1), 105-134. https://doi.org/10.1111/j.1540-5893.2006.00261.x
Taylor, Z. W., Childs, J., Bicak, I., & Alsmadi, I. (2019). Is bigger, better? Exploring U.S. News graduate education program rankings and internet characteristics. Interchange: A Quarterly Review of Education, 1-15. https://doi.org/10.1007/s10780-019-09366-0
U.S. Department of Education. (2018). College affordability and completion: Ensuring a pathway to opportunity. Retrieved from https://www.ed.gov/college
U.S News & World Report. (2018). 2018 U.S. News best colleges. Retrieved from https://www.usnews.com/best-colleges
Volkwein, J. F., & Sweitzer, K. V. (2006). Institutional prestige and reputation among research universities and liberal arts colleges. Research in Higher Education, 47(2), 129-148. https://doi.org/10.1007/s11162-005-8883-5
Webster, T. J. (2001). A principal component analysis of the U.S. News & World Report tier rankings of colleges and universities. Economics of Education Review, 20(3), 235-244. https://doi.org/10.1016/S0272-7757(99)00066-7
Z.W. TAYLOR is a PhD student at The University of Texas at Austin. He has published over 60 peer-reviewed articles focused on the linguistics and digital accessibility of higher education communication. Email: [email protected] IZZAT ALSMADI, PhD, is an Assistant Professor in the department of computing and cyber security at the Texas A&M, San Antonio. He has his master and PhD in Software Engineering from North Dakota State University in 2006 and 2008. He has more than 100 conference and journal publications. Email: [email protected]
Manuscript submitted: March 10, 2019 Manuscript revised: March 10, 2020
Accepted for publication: May 10, 2020