
Paleomagnetism in northwestern Bulgaria: geological implications of widespread remagnetization
14
Paleomagnetism in northwestern Bulgaria: geological implications of widespread remagnetization Neli Jordanova a, * , Bernard Henry b , Diana Jordanova a , Zivko Ivanov c , Dimo Dimov c , Franc ßoise Bergerat d a Geophysical Institute, Bulgarian Academy of Sciences, Acad. G. Bonchev Str., block 3, 1113 Sofia, Bulgaria b Pale ´omagne ´tism et Ge ´omagne ´tisme, UMR 7577 CNRS and IPGP, 4 avenue de Neptune, 94107 Saint-Maur cedex, France c Sofia University ‘‘St Kliment Ohridski’’, 15 Tzar Osvoboditel Blv., 1000 Sofia, Bulgaria d Laboratoire de Tectonique, ESA 7072 CNRS-UPMC, B 129, P. et M. Curie University, 4 place Jussieu, 75252 Paris cedex 05, France Received 27 September 2000; accepted 13 September 2001 Abstract Two different paleomagnetic directions have been obtained in several formations in northwestern Bulgaria. One of them, found only in Upper Permian – Lower Triassic red sandstones, is very likely a primary magnetization. A secondary magnetization of Eocene age appears as either pre-, syn- or post-folding depending on the site. The identification of the timing of remagnetization with respect to folding allows us to distinguish areas among the first deformed during Tertiary tectonics. Within each superimposed structural unit of the West Balkan, the deformation spread from south to north. The boundary between the Srednogorie and Balkan zones appears to be a major tectonic structure in Bulgaria. The Balkan likely underwent a clockwise rotation relative to stable Europe since the beginning of the main Middle Eocene orogenesis. D 2001 Elsevier Science B.V. All rights reserved. Keywords: Paleomagnetism; Bulgaria; Remagnetization; Triassic 1. Introduction Revealing the geodynamic history of southeastern Europe is important for a comprehensive understand- ing of the evolution of Peri-Tethys marginal structural units. To date, however, results from Bulgaria and Romania yield seemingly conflicting results. For ex- ample, northern Bulgaria has been considered in different studies either as an area that underwent no important rotation, or on the contrary, important counterclockwise rotation relative to stable Europe (Hsu ¨, 1977; Sengo ¨r, 1984; Surmont et al., 1991; Bergerat et al., 1998; Muttoni et al., 2000), while data obtained in western Romania (Banat – Apuseni mountains) indicate a strong clockwise rotation (Sur- mont et al., 1990; Patrascu et al., 1990, 1992). Obtaining reliable well-dated paleomagnetic direc- tions, constrained by stringent paleomagnetic tests, is key to resolving these discrepancies and under- standing the structure of the eastern Carpathians and its relation to the stable part of Europe. The location of the study area is shown as a black rectangle on the sketch map in the left corner of Fig. 1. 0040-1951/01/$ - see front matter D 2001 Elsevier Science B.V. All rights reserved. PII:S0040-1951(01)00220-7 * Corresponding author. E-mail address: [email protected] (N. Jordanova). www.elsevier.com/locate/tecto Tectonophysics 343 (2001) 79 – 92
Transcript of Paleomagnetism in northwestern Bulgaria: geological implications of widespread remagnetization

Paleomagnetism in northwestern Bulgaria: geological
implications of widespread remagnetization
Neli Jordanova a,*, Bernard Henry b, Diana Jordanova a, Zivko Ivanov c,Dimo Dimov c, Franc�oise Bergerat d
aGeophysical Institute, Bulgarian Academy of Sciences, Acad. G. Bonchev Str., block 3, 1113 Sofia, BulgariabPaleomagnetism et Geomagnetisme, UMR 7577 CNRS and IPGP, 4 avenue de Neptune, 94107 Saint-Maur cedex, France
cSofia University ‘‘St Kliment Ohridski’’, 15 Tzar Osvoboditel Blv., 1000 Sofia, BulgariadLaboratoire de Tectonique, ESA 7072 CNRS-UPMC, B 129, P. et M. Curie University, 4 place Jussieu, 75252 Paris cedex 05, France
Received 27 September 2000; accepted 13 September 2001
Abstract
Two different paleomagnetic directions have been obtained in several formations in northwestern Bulgaria. One of them,
found only in Upper Permian–Lower Triassic red sandstones, is very likely a primary magnetization. A secondary
magnetization of Eocene age appears as either pre-, syn- or post-folding depending on the site. The identification of the timing
of remagnetization with respect to folding allows us to distinguish areas among the first deformed during Tertiary tectonics.
Within each superimposed structural unit of the West Balkan, the deformation spread from south to north. The boundary
between the Srednogorie and Balkan zones appears to be a major tectonic structure in Bulgaria. The Balkan likely underwent a
clockwise rotation relative to stable Europe since the beginning of the main Middle Eocene orogenesis. D 2001 Elsevier
Science B.V. All rights reserved.
Keywords: Paleomagnetism; Bulgaria; Remagnetization; Triassic
1. Introduction
Revealing the geodynamic history of southeastern
Europe is important for a comprehensive understand-
ing of the evolution of Peri-Tethys marginal structural
units. To date, however, results from Bulgaria and
Romania yield seemingly conflicting results. For ex-
ample, northern Bulgaria has been considered in
different studies either as an area that underwent no
important rotation, or on the contrary, important
counterclockwise rotation relative to stable Europe
(Hsu, 1977; Sengor, 1984; Surmont et al., 1991;
Bergerat et al., 1998; Muttoni et al., 2000), while
data obtained in western Romania (Banat–Apuseni
mountains) indicate a strong clockwise rotation (Sur-
mont et al., 1990; Patrascu et al., 1990, 1992).
Obtaining reliable well-dated paleomagnetic direc-
tions, constrained by stringent paleomagnetic tests,
is key to resolving these discrepancies and under-
standing the structure of the eastern Carpathians and
its relation to the stable part of Europe. The location
of the study area is shown as a black rectangle on the
sketch map in the left corner of Fig. 1.
0040-1951/01/$ - see front matter D 2001 Elsevier Science B.V. All rights reserved.
PII: S0040-1951 (01 )00220 -7
* Corresponding author.
E-mail address: [email protected] (N. Jordanova).
www.elsevier.com/locate/tecto
Tectonophysics 343 (2001) 79–92

Previous paleomagnetic results obtained in north-
western Bulgaria (Nozharov et al., 1980; Kruczyk et
al., 1988; Surmont et al., 1991; Haubold and Maur-
itsch, 1998; Muttoni et al., 2000) yield relatively
scattered directions, perhaps due to the complicated
structural evolution in this area. It cannot be ruled out,
however, that this scatter is related to magnetic over-
printing, because many of the studies lacked rigorous
paleomagnetic tests. Because paleomagnetic data can
provide key tectonic information only as much as the
paleomagnetic results can be considered reliable, the
present work was aimed at obtaining from Balkan and
Pre-Balkan areas detailed data to which stringent tests
can be used to determine if remagnetization occurred
in this area.
2. Geological setting
The Moesian platform and west Balkan region
(Fig. 1) have similar early Mesozoic evolution (Iva-
nov, 1988a,b). In most cases, Permo-Triassic sedi-
ments cover transgressively and discordantly varie-
gated Variscan basement (Tronkov, 1973). The series
Fig. 1. Geological map with sampling sites (see site description in Table 1), simplified geological section (A–B) across West Balkan zone and
sketch map of the studied locality in Europe. Q, Quaternary; Ng, Neogene; Pg, Paleogene; K2, Upper Cretaceous; K1, Lower Cretaceous; J,
Jurassic; T, Triassic; Pz2 (C2-P), Permo-Carboniferous; g-Pz2, Upper Paleozoic intrusions; Pz1, Lower Paleozoic.
N. Jordanova et al. / Tectonophysics 343 (2001) 79–9280

Table 1
Site descriptions: location, age, number of samples (N ), mean direction (D, I) before and after dip correction and corresponding Fisher’s (1953)
parameters (k, a95) are given
Site Site (lat/long) Age N Before After intermediate and Total dip correction
no.D (�) I (�) k a95 (�) D (�) I (�) k a95 (�) D (�) I (�) k a95 (�)
ChRM A
17 Dolno Butchino
(42�5702700N, 23�0903900E)Lower Triassic 5 36.9 27.3 24 12.7 – – – – 26.9 16.1 24 12.7
22 Chiprovtzi monastery
(43�2405500N, 22�5505600E)Lower Triassic 6 11.6 37.4 25 11.5 – – – – 37.6 17.4 25 11.5
18 Gintzi
(43�0305300N, 23�0800200E)Lower Triassic 3 39.1 36.1 29 14.9 – – – – 39.1 36.1 29 14.9
12 Lakatnik
(43�0605400N, 23�2504200E)Lower Triassic 7 42.6 36.6 81 5.9 – – – – 34.4 22.5 81 5.9
14 Lakatnik
(43�0601800N, 23�2304000E)Lower Triassic 8 29.1 41.7 46 7.3 – – – – 28.0 32.8 46 7.3
15 Lakatnik
(43�0504200N, 23�2201800E)Lower Triassic 6 34.9 41.5 44 8.7 – – – – 31.8 36.9 44 8.7
20 2 km S of Meljane
(43�2101800N, 23�010E)Lower Triassic 4 38.7 42.9 28 13.3 – – – – 30.9 28.4 28 13.3
Mean 7
sites
33.4 38.0 68 6.4 – – – – 32.6 27.2 72 6.2
ChRM B
6 Glojene
(42�5903500N, 24�1202100E)Middle Triassic 7 19.7 59.2 199 3.8 19.2 59.0 199 3.8 10.4 57.0 199 3.8
7 Glojene
(42�5903500N, 24�1202100E)Middle Triassic 2 28.6 39.9 – – 18.9 55.6 – – 13.1 59.7 – –
19 1.7 km S of Gintzi
(43�0402000N, 23�0702600E)Middle–Upper
Triassic
5 331.0 56.8 17 15.1 2.6 48.7 50 8.9 346.6 58.1 28 11.3
1 Lakatnik
(43�0502000N, 23�2302800E)Middle–Upper
Triassic
8 20.0 62.2 414 2.4 15.6 59.2 414 2.4 9.9 53.5 414 2.4
2 Lakatnik
(43�0502000N, 23�2302800E)Middle–Upper
Triassic
7 31.3 61.3 167 4.1 21.6 57.0 167 4.1 20.7 56.5 167 4.1
3 Lakatnik
(43�0502000N, 23�2302800E)Middle–Upper
Triassic
6 14.2 56.3 96 5.8 22.2 56.9 96 5.8 4.4 54.4 96 5.8
11 Lakatnik
(43�0704000N, 23�270E)Middle–Upper
Triassic
7 63.9 71.9 215 3.6 25.9 55.7 215 3.6 21.7 53.4 215 3.6
13 Lakatnik
(43�0605400N, 23�2502000E)Middle Triassic 8 36.3 62.6 91 5.2 22.9 56.3 91 5.2 14.0 50.1 91 5.2
16 Lakatnik
(43�0504200N, 23�2202700E)Middle Triassic 5 22.8 49.5 103 6.2 27.6 54.9 103 6.2 20.4 46.2 103 6.2
30 Lopian
(42�5101900N, 24�0401600E)Middle Triassic 2 6.6 62.6 – – 6.7 62.7 – – 346.8 18.6 – –
21 Melljane
(43�2200500N, 23�0103000E)Middle Triassic 9 20.7 54.8 79 5.2 20.7 54.8 79 5.2 20.7 54.8 79 5.2
23 Pomejdin village
(43�2304000N, 22�590E)Middle Triassic 8 343.8 63.1 202 3.5 19.2 54.9 202 3.5 36.4 30.9 202 3.5
24 Lopuchan monastery
(43�2204600N, 23�0004500E)Middle Triassic 7 41.2 56.9 354 2.89 37.2 53.1 354 2.89 28.1 40.3 354 2.8
25 Lopuchan monastery
(43�2204600N, 23�0004500E)Middle Triassic 6 31.1 64.1 338 3.1 24.9 57.1 322 3.2 17.7 38.0 142 4.8
26 Tseljustnitza quarry
(43�2700800N, 23�0003100E)Middle Triassic 5 28.0 32.0 33 10.9 25.2 56.8 33 10.9 27.5 48.0 33 10.9
(continued on next page)
N. Jordanova et al. / Tectonophysics 343 (2001) 79–92 81

comprises terrigenious continental deposits (‘‘Bund-
sandstein’’) in the lower part, which gradually
change to shallow marine terrigenious–carbonate
sediments of Middle–Upper Triassic age having
transgressive characteristics. Jurassic sediments lay
unconformably on certain parts of Triassic rocks or
directly above the Variscan basement. This uncon-
formity is a result of late Triassic tectonic move-
ments (the so-called early Cimmerian phase), related
to intense extension occurring in the northern margin
of the Tethys, as manifested by flat lying listric-like
normal faults (Ivanov, in press). Jurassic units are
represented by epicontinental shallow marine sedi-
ments that grade into moderate deep-water facies. By
the Upper Jurassic, the basin had acquired a bathyal
character. In the western parts of the Pre-Balkan,
West Balkan and Moesian Platform, Upper Jurassic
Kimmeridgian–Tithonian deposits are carbonate
facies, while the sediments of the same age from
Central Balkan and Central Pre-Balkan are flysch
facies (Sapunov and Tchumachenko, 1983; Sapunov
et al., 1988). Nowhere in the three study areas is
there any stratigraphic or structural discordance, or
interruption observed between the Upper Jurassic
and Lower Cretaceous deposits. The lithology shows
that these deposits have well-expressed bathyal zona-
tion and were formed in an epicontinental basin.
After the Aptian, interruptions in the sedimentation
resulted from regional tectonics. All available data
suggest that this tectonic event mainly affected the
central Stara Planina, and central and eastern Pre-
Balkan regions. Insufficient evidence exists to ascer-
tain whether this event took place in the West Balkan
area as well (Ivanov, 1983). The Upper Cretaceous
deposits on the Moesian Platform and Pre-Balkan
area which are of shallow-marine, epicontinental,
neritic origin (Yolkichev, 1989), were transgressive
at various times during Lower Cretaceous and older
sections. Both Upper Cretaceous and Early Tertiary
sediments were deformed at the end of the middle
Eocene during ‘‘Illyrian’’ phase. As a result, the
central and eastern parts of the Pre- and Central
Balkan areas have been refolded. This late Alpine
event was intense in the West Balkan area as well
and represents the main structural phase there. It
resulted in the formation of deeply penetrating north-
west-trending shear zones. Northeast vergent thrust-
ing along these zones has displaced and overlapped
para-autochthonous slices of basement and sedimen-
tary cover (Ivanov, 1988b). These slices form a
Site Site (lat/long) Age N Before After intermediate and Total dip correction
no.D (�) I (�) k a95 (�) D (�) I (�) k a95 (�) D (�) I (�) k a95 (�)
29 Teteven
(42�5405200N, 24�190E)Middle–Upper
Triassic
6 11.3 56.2 722 2.1 22.0 55.7 722 2.1 352.6 54.3 722 2.1
28 Zgurigrad
(43�1102500N, 23�320E)Middle–Upper
Triassic
4 215.2 31.9 242 4.5 29.6 57.0 242 4.5 22.3 54.8 242 4.5
20 2 km S of Meljane
(43�2101800N, 23�010E)Middle–Upper
Triassic
3 41.2 73.4 39 12.9 19.2 57.2 39 12.9 18.1 58.2 39 12.9
5 Orechetz
(43�390N, 22�4105800E)Middle–Upper
Jurassic
4 354.2 52.0 226 4.7 14.5 48.6 226 4.7 9.9 50.0 226 4.7
4 Mitrovtzi
(43�2101800N, 23�010E)Upper Jurassic–
Lower Cretaceous
5 13.3 53.8 99 6.3 12.6 55.0 99 6.3 16.1 48.2 99 6.3
8 Glojene
(43�0002500N, 24�1104300E)Upper Jurassic 10 26.0 52.8 312 2.5 27.1 56.1 312 2.5 33.6 67.2 312 2.5
27 Warbovo
(43�3300600N, 22�400E)Upper Jurassic–
Lower Cretaceous
7 175.3 � 8.6 36 8.8 173.5 � 55.9 36 8.8 172.4 � 31.3 36 8.8
9 Lovetch
(43�040N, 24�440E)Lower Cretaceous 2 40.6 58.2 – – 27.7 53.3 – – 18.5 46.8 – –
10 Boaza
(42�5604800N, 25�5400200E)Upper Cretaceous 5 14.6 56.1 17 15.1 15.8 58.0 17 15.1 352.5 49.1 17 15.1
Mean 23
sites
18.9 64.1 14 7.7 20.8 56.0 238 1.9 13.9 50.8 35 4.9
Table 1 (continued )
N. Jordanova et al. / Tectonophysics 343 (2001) 79–9282
series of asymmetric anticlines (from SW to NE they
are: Berkovitza, Vratza, Mihailovgrad, and Belograd-
chik; Fig. 1) that reflect more intense folding in their
northern limbs (Ivanov, 1983).
3. Sampling
We performed preliminary sampling on rocks span-
ning a wide range of ages, locations, and structural
orientations in northwestern Bulgaria (Fig. 1). Results
reveal that the formations yielding the best results are of
Triassic age, leading us to focus subsequent sampling
on Upper Permian–Lower Triassic (‘‘Bundsandstein’’
red sandstone) and Middle–Upper Triassic (carbo-
nates) units. In total, 8 sites (58 samples) in Lower
Triassic, 19 sites (174 samples) in Middle–Upper
Triassic, 1 site (14 samples) in Middle Jurassic, 4 sites
(37 samples) in the Upper Jurassic, and 4 sites (34
samples) in the Lower Cretaceous rocks were obtained.
Intensity of natural remanent magnetization (NRM) of
the samples from 5 sites was too low to obtain reliable
results, so these localities were not included in the data
analysis (these include: 1 site in Lower Triassic, 1 site
in Middle–Upper Triassic, 1 site in Middle Jurassic,
and 2 sites in Lower Cretaceous rocks), leaving 31 sites
that were retained (Fig. 1, Table 1).
4. Rock magnetism
Selected samples from all localities have been
subjected to rock magnetic studies to obtain informa-
tion about the main ferromagnetic carriers, their
domain state, stability upon laboratory treatments,
etc. The intensity of NRM for the collection studied
varies widely (ranging from � 10�6 to 10�3 A/m)
even within the same formation. For example, Middle
Triassic limestones from sites 6 and 2 are character-
ized by relatively strong NRM values (2.5–8 mA/m),
while the same limestone from site 3 is weakly
magnetic (NRM varies between 0.1 and 1 mA/m).
Bundsandstein samples also show scattered NRM
intensities of the same order as the limestone samples.
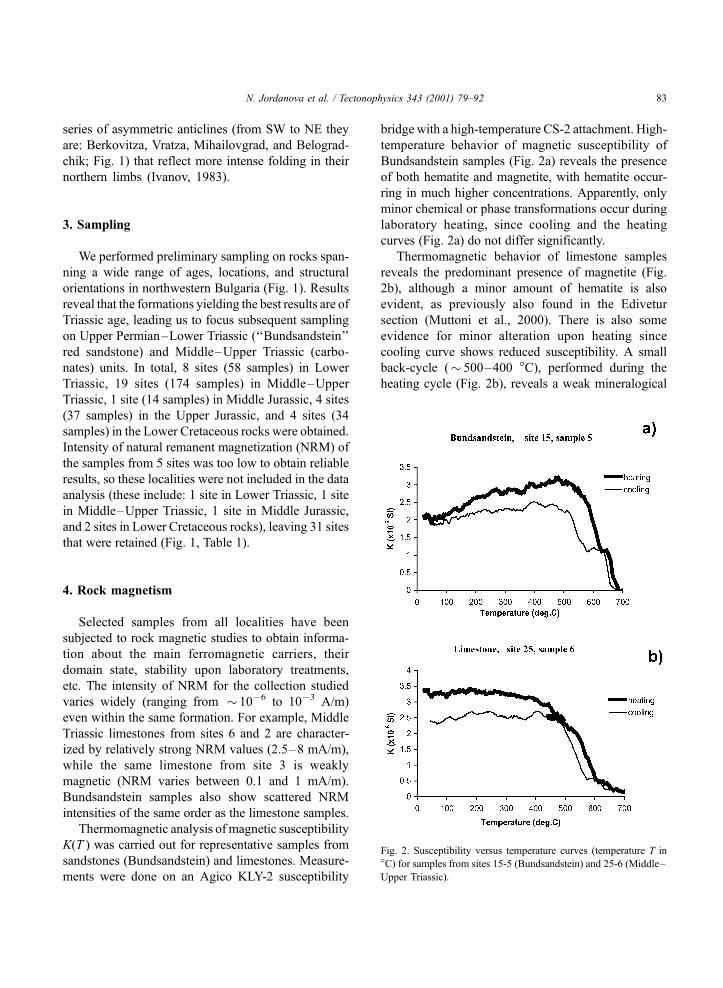
Thermomagnetic analysis of magnetic susceptibility
K(T ) was carried out for representative samples from
sandstones (Bundsandstein) and limestones. Measure-
ments were done on an Agico KLY-2 susceptibility
bridge with a high-temperature CS-2 attachment. High-
temperature behavior of magnetic susceptibility of
Bundsandstein samples (Fig. 2a) reveals the presence
of both hematite and magnetite, with hematite occur-
ring in much higher concentrations. Apparently, only
minor chemical or phase transformations occur during
laboratory heating, since cooling and the heating
curves (Fig. 2a) do not differ significantly.
Thermomagnetic behavior of limestone samples
reveals the predominant presence of magnetite (Fig.
2b), although a minor amount of hematite is also
evident, as previously also found in the Edivetur
section (Muttoni et al., 2000). There is also some
evidence for minor alteration upon heating since
cooling curve shows reduced susceptibility. A small
back-cycle (� 500–400 �C), performed during the
heating cycle (Fig. 2b), reveals a weak mineralogical
Fig. 2. Susceptibility versus temperature curves (temperature T in
�C) for samples from sites 15-5 (Bundsandstein) and 25-6 (Middle–
Upper Triassic).
N. Jordanova et al. / Tectonophysics 343 (2001) 79–92 83

alteration by a small decrease of the susceptibility
(therefore not related to formation of new magnetite).
The obtained magnetite Curie temperature therefore
corresponds to magnetite present before heating. In
contrast, results from stepwise room-temperature mea-
surements of magnetic susceptibility measured during
thermal demagnetization reveal that, after the 400-�Ctemperature step, susceptibility increased rapidly, sug-
gesting formation of new magnetite. These contra-
dictory observations are very likely related to the fact
that thermomagnetic curves were obtained in air on
rock crushed to a powder and room-temperature
susceptibility measurements were performed on stand-
ard specimens.
To obtain information about the coercivity and
grain size of the magnetic phases, hysteresis loops
were measured on bulk cylindrical samples, without
magnetic separation. The experimentally obtained
loops are affected by para-, dia- and ferrimagnetic
fractions. Correction for para- and diamagnetic influ-
ences was done using a linear approximation in the
region of the applied highest magnetic field (1 T).
Para- and diamagnetic contributions to the measured
hysteresis loops are very high for most of the samples
(Fig. 3). The remaining part of the magnetization after
correction is therefore sometimes very weak and the
‘‘ferrimagnetic’’ hysteresis loop strongly distorted. All
‘‘ferrimagnetic’’ loops for the ‘‘magnetically stron-
gest’’ samples are constricted (wasp waisted), and full
saturation is achieved above � 0.6 T (Fig. 3). The
hysteresis parameters and ratios Jrs/Js and Hcr/Hc were
also calculated for limestones (Fig. 4) pointing to the
presence of various magnetic grain sizes, ranging
from single domain (SD) and pseudo-single domain
(PSD) to multidomain (MD) size assuming only the
presence of magnetite (Day et al., 1977). Constriction
could be caused by the presence, together with mag-
netite, either of a superparamagnetic fraction or of
high-coercivity minerals such as hematite or goethite
(Roberts et al., 1995; Tauxe et al., 1996). Data falling
in the MD range of the Day plot (Fig. 4) are therefore
probably influenced also by a hematite contribution
[as evidenced also by the K(T) curves], which mainly
leads to higher Hcr and Jrs.
Fig. 3. Hysteresis loops (H in Tesla, J in A m2/kg) for limestones
from sites 8 and 4.
Fig. 4. Day plot showing Jrs/Js as a function of Hcr/Hc (Day et al.,
1977) for limestone samples.
N. Jordanova et al. / Tectonophysics 343 (2001) 79–9284

5. Paleomagnetism
5.1. Analysis procedures
Before any magnetic measurements, the specimens
were placed in a magnetically shielded space for over 2
weeks to reduce the viscous remanent magnetization
(VRM) acquired in situ and/or after sampling. The
intensity and the direction of the remanent magnet-
ization were measured at the Institut de Physique du
Globe de Paris (IPGP) Paris laboratory on 2 G cryo-
genic and JR-5 spinner magnetometers, and at the
IPGP Saint-Maur laboratory on a JR-4 spinner mag-
netometer. Detailed stepwise alternating magnetic field
(AF) and thermal demagnetization techniques, applied
to pilot specimens, reveal that thermal treatment was
more effective at isolating characteristic remanent
magnetizations (ChRM).
5.2. Data analysis
Thermal demagnetization of NRM for most of the
samples reveals the presence of two remanence com-
ponents. The first, corresponding to unblocking tem-
peratures below 300 �C, is close to the direction of the
present geomagnetic field, and is likely of viscous
origin. The ChRM of the Lower Triassic red sand-
stone, determined from thermal treatment up to 660
�C, is clearly mainly carried by hematite (Fig. 5a). For
all other samples, however, the maximum blocking
temperature of the ChRM varies between 400 and 580
�C (Fig. 5b). Two groups of magnetizations can be
distinguished according to their paleomagnetic direc-
tion. Group A (moderate inclination towards the
NNE, main carrier hematite) corresponds to Bund-
sandstein samples, while group B (mostly steeper
inclination, main carrier magnetite) is found at all
other sites. Six Bundsandstein samples, presenting
directions different from the other Bundsandstein
samples but similar to that of the group B samples,
were discarded.
5.3. ChRM of group A
The fold test result is not significant (at 95% confi-
dence) for group A (Fig. 6 and Table 1), because of
shallow and relatively similar dips in all Bundsandstein
sites. The polarity of the ChRM A is always normal,
except for one sample. In the site where both polarities
are obtained, the ChRM vectors are roughly antipar-
allel, showing that ChRM does not result from the
superposition of different magnetization components.
The paleomagnetic pole position (Fig. 7) calculated
from our data (148.1�E, 50.0�N, K = 142, A95 = 4.4�),lies close to the Lower–Middle Triassic poles (Van der
Voo, 1990; Edel and Duringer, 1997; Besse and
Courtillot, in press) of the European Apparent Polar
Wander Path (APWP), suggesting that the ChRM A
very likely reflects a primary magnetization: the lack
of paleomagnetic tests, however, does not allow us to
prove definitely the timing of magnetization acquis-
ition. Provided the direction is primary, it suggests,
when compared to the previous studies (e.g. Muttoni et
al., 2000), that northwestern Bulgaria did not undergo
significant rotation relative to stable Europe since at
least the Early Triassic. Owing to the window of
possible ages of deposition of the rocks with Bund-
sandstein facies (Upper Permian to Lower Triassic), a
clockwise rotation of the studied area cannot be
excluded.
Nozharov et al. (1980) report a mean paleomag-
netic direction (D = 26.1�, I= 39.3�) for Bundsand-
stein sites in northern Bulgaria that is close to our
ChRM A component, though slightly steeper in incli-
nation. This slight difference may be due to the
inclusion of some ChRM B data (as measured in the
six discarded samples in our sites) in their estimate of
the primary magnetization; their mean direction is in
fact located precisely between our A (D = 32.6�,I = 27.2�) and B directions (D = 20.8�, I = 56.0�).
5.4. ChRM of group B
All the directions of group B are of normal polarity
(an exception is site 27, Table 1). Although this site
was discarded from subsequent considerations, its
exclusion from the calculation of the group B mean
does not significantly change the results. One locality
of Middle–Upper Triassic age (site 26) is represented
by a conglomeratic facies, with limestone clasts within
a fine carbonated matrix. The magnetization direction
obtained for the clasts and the matrix coincides (neg-
ative conglomerate test), showing that the ChRM B is
a remagnetization. The presence of ChRM B in six
Bundsandstein samples also points out this remagne-
tization.
N. Jordanova et al. / Tectonophysics 343 (2001) 79–92 85

A fold test was also performed using the mean
ChRM B direction for each site (Table 1). Some of the
group B magnetizations, which were obtained from a
very highly deformed zone restricted to part of the
Middle–Upper Triassic site 7 (within a narrow fault
zone), were eliminated from the analysis because we
were not able to perform a reliable dip correction to
them (due to the presence of several-fold axes with
different dips). During progressive unfolding (Fig. 8),
the precision parameter k (Fisher, 1953) is maximum
value at 60% unfolding and the distribution of the
directions appears to be closest to Fisherian (mini-
mum r value, Henry and Le Goff, 1994) at 70%
unfolding. The ChRM B is therefore a syntectonic
magnetization that was acquired sometime between
the beginning of the first deformation and the end of
Fig. 5. Examples of orthogonal vector plots: projections on horizontal (full squares) and vertical (open squares) planes: (a) specimens 12-6A
(Bundsandstein) and (b) 13-8 (Middle–Lower Triassic); temperature in �C.
Fig. 6. ChRM A directions (squares) with 95% confidence zones for each site: stereographic projection, the full (empty) symbols corresponding
to the lower (upper) hemisphere before (a) and after (b) dip correction. Confidence zones in the lower hemisphere.
N. Jordanova et al. / Tectonophysics 343 (2001) 79–9286

the last deformation (i.e. possibly between two tec-
tonic phases). For such syntectonic magnetization,
involving widely distributed sites, the assumption that
all sites simultaneously share the same unfolding
percentage is unrealistic. Surmont et al. (1990) and
Shipunov (1997) proposed a different method, which
yields, at each site, the direction of the syntectonic
magnetization and the folding percentage. Their
method makes use of the fact that, during tilting, the
magnetization direction moves along a small circle
(great circle when the magnetization direction is
perpendicular to the fold axis). The intersection of
circles from different sites represents the unique
possible shared magnetization direction, and therefore
the syntectonic remagnetization. To determine this
intersection (Figs. 9 and 10), a least squares technique
was applied using the iterative method of Surmont et
al. (1990). This yielded a well-defined mean direction
for the remagnetization (D = 20.8�, I= 56.0�, k = 238,a95 = 1.9�) as well as the dip at the time of acquisition
of the remagnetization at each site (Fig. 11).
Despite the lack of significant paleomagnetic tests
(e.g. fold and conglomerate tests), some previous
paleomagnetic studies (Kruczyk et al., 1988; Surmont
et al., 1991) were interpreted as yielding primary mag-
netizations. Muttoni et al. (2000) argue for primary
magnetization for another Triassic section at Edivetur
(Belogradchik region) on the basis of paleomagnetic
pole position analysis. Their mean paleomagnetic
direction (D = 25.5�, I = 59.7� before dip correction,
Fig. 7. Paleomagnetic poles for stable Europe (small circles—Besse and Courtillot, 2001; large circles—Van der Voo, 1990; triangles—Edel
and Duringer, 1997) and poles corresponding (squares) to ChRMs A and B. Age in Ma or by geological period (muT—Middle Upper Triassic,
lmT—Lower–Middle Triassic, and uP—Upper Permian). The broad gray arcs of circle correspond to poles A and B assuming a rotation of the
study area.
N. Jordanova et al. / Tectonophysics 343 (2001) 79–92 87

Muttoni et al., 2000) and those from two Callovian
sites in the study of Kruczyk et al. (1988), however,
are very close to our remagnetization B direction,
suggesting they are not of primary origin. Unfortu-
nately, the paleomagnetic pole positions only crudely
constrain the age of magnetization acquisition. It is
possible, therefore, that the dominant reversed polarity
in the Edivetur sites (only six samples carry normal
polarity), which agrees with the dominant polarity
during the deposition of the series (Muttoni et al.,
2000), indicates that the magnetization in the Edivetur
sites, like that for the Callovian sites of Kruczyk et al.
(1988), is different from that of the other sites (note
that only two of the six normal directions could be
roughly correlated with other Triassic sections).
Application of the Surmont et al. (1990)–Shipunov
(1997) method, however, to all the other data of
Kruczyk et al. (1988) and Surmont et al. (1991) gives
a best intersection similar to that obtained with our
data, thus confirming that their ChRM is likely the
same as our syntectonic remagnetization B. The mean
direction obtained using all the usable data (from Kru-
czyk et al., 1988; Surmont et al., 1991; and our work) is
D = 22.3�, I = 56.5�, k = 254, a95 = 1.4�.The corresponding paleomagnetic pole (125.2�E,
72.0�N, K = 134, A95 = 1.9�) is compared with the
European APWP (Besse and Courtillot, in press) in
Fig. 7. It corresponds to about 165 Ma (Dogger)
poles. However, because the ChRM B has been found
also in Lower Cretaceous formations, such a Dogger
age is not possible. Therefore, we considered the
possibility that the area was subjected to vertical axis
rotations (Fig. 7). It appears that a Tertiary (Eocene)
age would be possible if we suppose that the study
area underwent a clockwise rotation of the order of
14� ± 6�. Such an Eocene age is also supported by the
fact that our paleomagnetic direction is very close to
that, unfortunately imprecise (D = 22.6�, I = 53.6�,a95 = 15.8�), obtained by Haubold et al. (1998) for
Paleogene rocks from the Moesian platform. An addi-
tional constraint on the age of the ChRM B is given
by the ‘‘syntectonic’’ character of the magnetization.
At the time of remagnetization, dips exceeded 20� atsome sites (Fig. 11), implying that remagnetization
accompanied relatively significant tectonic move-
ments. This eliminates Mesozoic ages for the mag-
netic overprinting. It is thus very probable that the
remagnetization occurred during the first stages of the
Illyrian deformation (end of Middle Eocene) rather
than during or after the possible so-called Laramian
phase at the end of the Early Paleocene, that is found
only locally in the Srednogorie area (Nachev, 1980).
The obtained near-zero values of tilting at the time of
remanence acquisition of the B component for sites 1,
2, 20, and 28 (Fig. 11) do not imply that it can be
Fig. 8. Variation of precision parameter k and of correlation co-
efficient r (Henry and Le Goff, 1994) during progressive unfolding
from � 25% to 125% for ChRM B.
Fig. 9. Small circles each including the possible orientation of the
mean ChRM B for each site (Surmont et al., 1990; Shipunov, 1997).
Stereographic projection in the lower hemisphere.
N. Jordanova et al. / Tectonophysics 343 (2001) 79–9288

primary because the sites referred are of Middle–
Upper Triassic age (Table 1), while the calculated pole
position corresponds to Dogger, accepting the hypoth-
esis for the absence of rotation.
The maximum blocking temperature of the ChRM
is too high to be related to a thermal event and the
remagnetization is therefore considered to be of
chemical origin. The fact that only normal polarity
was found does not necessarily indicate this remagne-
tization was acquired during a single period of normal
polarity during the Eocene. Because the remagnetiza-
tion is of chemical origin, thermal or alternating field
demagnetization in general cannot separate different
components of magnetization. Only the polarity asso-
ciated with the largest number of magnetic grains can
be obtained. Moreover, during grain growth, magnetic
moment is blocked as soon as the blocking volume is
reached, and up to relatively large MD sizes. Con-
sequently, the normal polarity of the ChRM B only
indicates that more than 50% of the grains reached
Fig. 10. ChRM B confidence zone for each site: stereographic projection in the lower hemisphere before (a) and after (b) dip correction, and at
optimal unfolding (c).
Fig. 11. Dip at the time of remagnetization at the different sites,
(vertical line—uncertainty has been estimated using bootstrap
method—Efron, 1982; Efron and Tibshirani, 1986; Henry, 2000)
compared to present dip (full ellipse). Negative values indicate dip in
the opposite direction of the present dip. Sites subdivided in two parts
(sites 25:25-1 and 25-2; sites 19:19-1 and 19-2) contain samples with
two different present dip values. For site descriptions, see Fig. 1.
N. Jordanova et al. / Tectonophysics 343 (2001) 79–92 89

their blocking volume during a period of normal po-
larity of the geomagnetic field. Thus, the duration of
the acquisition of the ChRM B could be longer than a
single normal polarity chron (all of which are rela-
tively short during the Eocene).
6. Geological implications
Clearly, this remagnetization, which is found over
a wide area, cannot be due to a local event. Two
phenomena (fluid migration—e.g. Sangster, 1986;
Symons et al., 1996—or illitization—e.g. Katz et
al., 1998) could be responsible for the crystallization
of magnetite or transformation of original minerals to
magnetite. The presence of the same remagnetization
at several stratigraphic levels and over a wide area
argues for fluid migration, since illitization probably
would not occur in all the places and at the same time.
It is suggested by the ChRM B that northwestern
Bulgaria underwent clockwise rotation relative to sta-
ple Europe since the beginning of the Middle Eocene
tectonics. Such a rotation is also compatible with the
pole position of the ChRM A. The study area therefore
should present an intermediate rotation between that
observed in the Banat–Apuseni area in Romania (Sur-
mont et al., 1990; Patrascu et al., 1990, 1992) and stable
Europe. Considering the structural map (Fig. 1), thrust
faults in the Balkan zones appear more important in the
western part than in the eastern, possibly indicating that
the Moesian platform was less (or not at all) affected by
the rotation observed in the Balkan zones.
The mean ChRM A directions for each site are
relatively similar arguing for lack of significant rela-
tive rotations, though owing to the relatively large
uncertainty of these directions (Table 1 and Fig. 6), we
cannot exclude the existence of small local move-
ments. The coherence of small circles (Fig. 9) from
ChRM B also suggests a lack of significant relative
rotations since Middle Eocene.
Similar magnetic overprints of normal polarity (be-
lieved to be either Tertiary or Late Cretaceous in age)
have also been recovered in the Srednogorie area in
the southern Bulgaria (Kruczyk et al., 1990). This
region was probably deformed after acquisition of the
remagnetization, since the observed inclinations are
relatively high (64�) with respect to the expected Late
Cretaceous inclination (approximately 50�). If the
ChRM is of Cretaceous age, the Srednogorie direction
must have been rotated by regional northward tilting
of about 15�. If the age is Tertiary, the Srednogorie
direction must have been affected by later northward
tilting of about 10� and counterclockwise rotation
(10–20�) relative to the Balkan area. In either case,
the boundary between Srednogorie and Balkan areas
appears therefore to be an important structure separat-
ing different tectonic domains.
At the time of the remagnetization, the dip (Fig. 11)
was for most of the sites shallow (and less steep than
the present dip) and towards the NNE (for the sites 26
and 19, the NW and NNE dips were in the direction
opposite to that of the present dips), although rela-
tively high dips towards NNE were determined in
some areas for the Eocene. This suggests that stronger
uplift occurred within the Srednogorie zone than
within the Moesian platform.
The fact, that the remagnetization was acquired
before complete folding at most of the sites (Fig. 11),
constrains the age of the remagnetization to the be-
ginning of the Illyrian phase. However, like in the
Betics (Villalain et al., 1994, 1996), some sites show
pre-, syn- or post-folding remagnetization (Fig. 11).
The degree of dip at the time of remagnetization
reveals the relative timing of deformation and remag-
netization. At sites just north of the thrust faults in the
West Balkan area (sites 4 and 30—Fig. 1), deforma-
tion had completed before remagnetization acquisi-
tion. In contrast, sites 28 and 5 (Fig. 1), located far
from such thrust faults, were not yet affected by
deformation by the time of magnetic overprinting.
At site 26, which is presently on the southern limb of
an anticline also just south of a thrust fault, the dip
was moderate at the time of remagnetization and in
the opposite direction, showing that this anticline very
likely had not yet formed by the time of remagnetiza-
tion. For most of the sites in the middle of the zone,
delimited by the thrust faults, the remagnetization was
acquired during an intermediate stage of folding. This
indicates therefore there was either diachronous
remagnetizations or diachronous foldings.
To assume diachronous remagnetization and the
same age for all the Illyrian folding implies that the
remagnetization began from the northern border in
each unit (before folding), and progressively reached
the southern part (during folding in the middle of
each unit and after folding at their southern borders).
N. Jordanova et al. / Tectonophysics 343 (2001) 79–9290

This would suggest that fluids migrated from the
low-lying Moesian platform towards the uplifted and
deformed Srednogorie zone. Such an assumption,
however, is un-realistic, because fluid migration,
due either to gravity effect (see, e.g., Garven and
Freeze, 1984a,b) or to tectonic compression (Oliver,
1986), would proceed from south to north. On the
other hand, synfolding remagnetization has been
obtained in the middle of several units: for example,
site 19 in the first unit from the south (Berkovitza
unit), 23 in the second unit, and 9 in the Central Pre-
Balkan (Fig. 1). To assume the same age for the
folding therefore implies the same age of remagneti-
zation in the middle of the different units, which are
not at the same latitude. The fact that remagnetization
was contemporaneous in these different units sug-
gests that fluid migration started roughly at the same
time in these units. This argues for a local origin of
the fluids (thus fluids expelled from deformed zones
between and within each unit—Oliver, 1986).
Because these units are not very large, any possible
differences in age of remagnetization within them are
likely small.
Folding therefore was not synchronous in the whole
area. Deformation began, in several areas, which later
became the southern border of each unit (i.e. the levels
just below the present discontinuities). It progressively
reached areas farther to the north. The last affected
levels are those just above the next discontinuity. The
evolution of the deformation in this area was very
different on either side of the present discontinuity.
Thus, the deformation started along more or less
parallel zones that possibly correspond to previous
(sedimentary or tectonic) discontinuities. Around each
‘‘discontinuity’’, the overlying southern part acted as a
rigid block, and the ‘‘folding’’ front advanced north-
ward in the underlying northern part. Progressively,
the whole unit was affected by the folding.
7. Conclusion
The characteristic component of magnetization
(ChRM A) observed in Upper Permian–Lower Tri-
assic sediments in northwestern Bulgaria is likely a
primary direction. The orientation of a secondary
component (ChRM B) is believed to reflect a clock-
wise rotation of this area relative to stable Europe after
the beginning of the main Middle Eocene tectonic
phase. The ChRM B provides a unique picture of the
geological structures at an intermediate stage of defor-
mation, and reveals that Eocene deformation began in
the south and proceeded northwards.
Acknowledgements
This work was supported by the Bulgarian
Academy of Sciences, the French CNRS, and the
Peri-Tethys program. We are very grateful to J. Glen
for discussion and help to improve the manuscript and
to reviewers R. Van der Voo and G. Muttoni for
constructive comments.
References
Bergerat, F., Martin, P., Dimov, D., 1998. The Moesian platform as
a key for understanding the geodynamical evolution of the Car-
patho–Balkan Alpine system. In: Crasquin-Soleau, S., Barrier,
E. (Eds.), Peri-Tethys Mem. 3: Stratigraphy and evolution of the
Peri-Tethyan platforms. Mem. Mus. Nation. Hist. Nat., Paris,
pp. 129–150.
Besse, J., Courtillot, V., 2001. Apparent and true polar wander and
the geometry of the geomagnetic field in the last 200 millions
years. J. Geophys. Res., in press.
Day, R., Fuller, M., Schmidt, V.A., 1977. Hysteresis properties of
titanomagnetites: grain size and compositional dependence.
Phys. Earth Planet. Int. 13, 260–267.
Edel, J.B., Duringer, P., 1997. The apparent polar wander path of the
European plate in Upper Triassic–Lower Jurassic times and the
Liassic intraplate fracturing of Pangaea: new paleomagnetic
constraints from NW France and SW Germany. Geophys. J.
Int. 128, 331–344.
Efron, B., 1982. The Jackknife, the Bootstrap and Other Resampling
Plans. SIAM, Philadelphia (Reg. Conf. Ser. App. Math. 38).
Efron, B., Tibshirani, R., 1986. Bootstrap methods for standard
errors, confidence intervals, and other measures of statistical
accuracy. Stat. Sci. I, 54–77.
Fisher, R.A., 1953. Dispersion on a sphere. Proc. R. Soc. London,
Ser. A 217, 295–305.
Garven, G., Freeze, A., 1984a. Theoretical analysis of the role of
groundwater flow in the genesis of stratabound ore deposits: 1.
Mathematical and numerical model. Am. J. Sci. 284, 1085–1124.
Garven, G., Freeze, A., 1984b. Theoretical analysis of the role of
groundwater flow in the genesis of stratabound ore deposits: 2.
Quantitative results. Am. J. Sci. 284, 1125–1174.
Haubold, H., Mauritsch, H.J., 1998. Paleomagnetism of Jurassic
sediments from the Fore-Balkan and the Strata Planina Ranges
(NW Bulgaria). Eur. Geophys. Soc. XXIII Gen. Assem., Nice,
Book of Abstracts, Ann. Geophys., suppl. I to vol. 16, p. C220.
N. Jordanova et al. / Tectonophysics 343 (2001) 79–92 91

Haubold, H., Mauritsch, H.J., Tzankov, T.Z., Kourtev, K., Nikolov,
G., 1998. Paleomagnetic characterization of the Bulgarian part
of the Moesian platform. Geol. Carpathica 49, 196–197.
Henry, B., 2000. Syntectonic remagnetization. Geol. Carpathica 51,
172.
Henry, B., Le Goff, M., 1994. A new tool for paleomagnetic inter-
pretation: the bivariate extension of the Fisher statistics. XIX
EGS Gen. Assem., Grenoble, Book of Abstracts, Ann. Geo-
phys., suppl. I to vol. 12, p. C123.
Hsu, K.J., 1977. Tectonic evolution of the Mediterranean basins.
The eastern Mediterranean. In: Nairn, A.E.M., Kanes, W.H.
(Eds.), The Ocean Basins and Margins, vol. 4A, pp. 29–75.
Ivanov, Z., 1983. Les Parties occidentales de la zone Strata Plani-
na–Prebalkan. Guide de l’excursion. Soc. Geol. de Bulg., Sofia,
pp. 26–34.
Ivanov, Z., 1988a. Aperc�u general sur l’evolution geologique et
structurale du massif des Rhodopes dans le cadre des Balkan-
ides. Bull. Soc. Geol. Fr., 8, IV, 2, 227–240.
Ivanov, Z., 1988b. Main features of the Balkanides outer zones
structure. Lineaments as a Connecting Structures Between Fold
Areas of Different Ages and its Metallogeny. Bulg. Acad. Sci.,
Sofia, pp. 49–81, Edd: Bojanov (in Russian).
Ivanov, Z., in press. Tectonics of Bulgaria. Sofia University (in
Bulgarian).
Katz, B., Elmore, R.D., Cogoini, M., Ferry, S., 1998. Widespread
chemical remagnetization: orogenic fluids or burial diagenesis
of clays? Geology 26, 603–606.
Kruczyk, J., Kadzialko-Hofmokl, M., Nozharov, P., Petkov, N.,
Nachev, I., 1988. Paleomagnetism of Jurassic sediments from
Balkan, Bulgaria. Acta Geophys. Pol. 36, 49–62.
Kruczyk, J., Kadzialko-Hofmokl, M., Nozharov, P., Petkov, N.,
Nachev, I., 1990. Paleomagnetic studies on sedimentary Jurassic
rocks from southern Bulgaria. Phys. Earth Planet. Int. 62, 82–
96.
Muttoni, G., Gaetani, M., Budurov, K., Zagorchev, I., Trifonova, E.,
Ivanova, D., Petrounova, L., Lowrie, W., 2000. Middle Triassic
paleomagnetic data from northern Bulgaria: constraints on Te-
thyan magnetostratigraphy and paleogeography. Palaeogeogr.,
Palaeoclimatol., Palaeoecol. 160, 223–237.
Nachev, I.K., 1980. Island arc model and alpine evolution of Bul-
garia. Rev. Bulg. Geol. Soc. XLI (3), 230–247.
Nozharov, P., Petkov, N., Yanev, S., Kropacek, V., Krs, M., Pruner,
P., 1980. A paleomagnetic and petromagnetic study of Upper-
Carboniferous, Permian and Triassic sediments, NW Bulgaria.
Stud. Geophys. Geod. 24, 252–284.
Oliver, J., 1986. Fluids expelled tectonically from orogenic belts:
their role in hydrocarbon migration and other geologic phenom-
ena. Geology 14, 99–102.
Patrascu, S., Bleahu,M., Panaiotu, C., 1990. Tectonic implications of
paleomagnetic research into Upper Cretaceous magmatic rocks
in the Apuseni Mountains, Romania. Tectonophysics 180,
309–322.
Patrascu, S., Bleahu, M., Panaiotu, C., Panaiotu, C.E., 1992. The
paleomagnetism of the Upper Cretaceous magmatic rocks in the
Banat area of South Carpathians: tectonic implications. Tecto-
nophysics 213, 341–352.
Roberts, A., Cui, Y., Verosub, K., 1995. Wasp-waisted hysteresis
loops: mineral magnetic characteristics and discrimination of
components in mixed magnetic systems. J. Geophys. Res. 100,
17909–17924.
Sangster, D.F., 1986. Age of mineralization in Mississippi Valley-
type (MVT) deposits: a critical requirement for genetic model-
ling. In: Andrew, J.C., et al. (Eds.), Geology and Genesis of
Mineral Deposits in Ireland, Dublin. Irish Association of Eco-
nomic Geologists, Dublin, pp. 625–633.
Sapunov, I., Tchumachenko, P., 1983. Coupe du Jurassique dans la
region de la ville de Teteven. Guide de l’excursion. Soc. Geol.
de Bulg., Sofia, pp. 51–55.
Sapunov, I., Tchumachenko, P., Mitov, A., 1988. Jurassic develop-
ment of Northwest Bulgaria. Geol. Balkanica 18 (1), 3–82.
Sengor, A.M.C., 1984. The Cimmeride Orogenic System and the
tectonics of Eurasia. Geol. Soc. Am., Spec. Pap. 195, 181–241.
Shipunov, S.V., 1997. Synfolding magnetization: detection testing
and geological applications. Geophys. J. Int. 130, 405–410.
Surmont, J., Sandulescu, M., Bordea, S., 1990. Mise en evidence d’
une reaimantation fini cretacee des series mesozoıques de l unite
de Bihor (Monts Apuseni, Roumanie) et de sa rotation horaire
ulterieure. Compt. Rend. Acad. Sci. Paris 310 (II), 213–219.
Surmont, J., Nikolov, T., Thierry, J., Peybernes, B., Sapunov, I.,
1991. Paleomagnetisme des formations sedimentaires jurassi-
ques et eocretacees des zones de Stara Planina–Prebalkan et
de Luda Kameija (Balkanides externes, Bulgarie). Bull. Soc.
Geol. Fr. 162, 57–68.
Symons, D.T.A., Sangster, D.F., Leach, D., 1996. Paleomagnetic
dating of Mississippi Valley-type Pb–Zn–Ba deposits. In:
Sangster, D.F. (Ed.), Carbonate Hosted Pb/Zn Deposits. Society
of Economic Geologists Special Volume 4.
Tauxe, L., Mullender, T., Pick, T., 1996. Potbellies, wasp-waists and
superparamagnetism in magnetic hysteresis. J. Geophys. Res.
101, 571–583.
Tronkov, D., 1973. Grundlage der Stratigraphie von Trias im Be-
logradcik—Antiklinorium (Nordwest-Bulgarien). Bull. Geol.
Inst., Ser. Stratigr. Lithol. 22, 73–98 (abstract in German).
Van der Voo, R., 1990. Phanerozoic paleomagnetic poles from
Europe and North America and comparisons with continental
reconstructions. Rev. Geophys. 28, 167–206.
Villalain, J.J., Osete, M.L., Vegas, R., Garcia-Duenas, V., Heller, F.,
1994. Widespread Neogene remagnetization in Jurassic lime-
stones of the South-Iberian palaeomargin (Western Betics, Gi-
braltar Arc). Phys. Earth Planet. Int. 85, 15–33.
Villalain, J.J., Osete, M.L., Vegas, R., Garcia-Duenas, V., Heller, F.,
1996. The Neogene remagnetization in the western Betics: a
brief comment on the reliability of palaeomagnetic directions.
In: Morris, A., Tarling, D.H. (Eds.), Palaeomagnetism and Tec-
tonics of the Mediterranean Region. Geol. Soc. Spec. Publ., vol.
105, pp. 33–41.
Yolkichev, N., 1989. Stratigraphy of Epicontinental Upper Creta-
ceous in Bulgaria. University Publ. House, Sofia, p. 184.
N. Jordanova et al. / Tectonophysics 343 (2001) 79–9292


![TOURISM | Greece - Bulgaria: People & Statistics [GR]](https://static.fdokumen.com/doc/165x107/6321d64d61d7e169b00c591b/tourism-greece-bulgaria-people-statistics-gr.jpg)