PALEOMAGNETISM OF ASH-FLOW TUFFS: MICROANALYTICAL RECOGNITION OF TRM COMPONENTS
13
JOURNAL OF GEOPHYSICAL RESEARCH, VOL. 85, NO. B3, PAGES 1487-1499, MARCH 10, 1980 PALEOMAGNETISM OF ASH-FLOW TUFFS: MICROANALYTICAL RECOGNITION OF TRM COMPONENTS 1 John Wm. Geissman Department of Geological Sciences, University of Michigan, Ann Arbor, Michigan 48109 Abstract. A microanalytical technique, employing a cryogenic magnetometer and progres- sive alternating field demagnetization, is de- scribed and used to investigate the natural remanent magnetization of individual components (groundmass, crystals, and lithic and pumice fragments) in seven ash-flow tuff lithologies and to determine if subblocking temperature flow- or compaction-related movements took place in the units on scales ranging from the volume of the individual microspecimen (1-2 mm in diameter) to that of a standard paleomagnetic core specimen. Closely grouped directions from microspecimens • o o of vitrophyre (eq5 s = 4.9 -12.4 ) and close correspondence of-these directions with their site mean directions determined from standard samples suggest that the magnetic components of these units have not been disturbed by move- ments at low temperatures. Microspecimens from devitrified portions of the cooling units are of significantly lower coercivity than vitrophyre material and yield directions either more scat- teredabout their site mean (e95greater than 15 ø) pr uniformly displaced in onedirection (up to 35 ø) away from the mean. Devitrification.may be as significant a contributor to the scatter of microspecimen directions as are postblocking temperature randomizing or systematic micro- tectonic movements. Vitrophyres near the base and extremities of ash-flow tuff cooling units are probably the most accurate indicators of the paleofield in each cooling unit. Introduction Over the years the paleomagnetic method has been applied to virtually every lithologic unit on the earth's surface and with general success in resolving statistically significant and mean- ingful magnetization components. Some lithol- ogies, however, by virtue of their mechanism of formation and subsequent acquisition of a natural remanent magnetization (NRM) (e.g., evaporites, conglomerates, and high-grade metamorphics) may perhaps be dubious recorders of the earth's paleofield. One such lithology is the ash-flow tuff, or ignimbrite, that originates by pyroclastic flow and that consists predominantly of pumice and glass shards but may also contain crystals and lithic fragments [Sparks et al., 1973]. Some ash-flow tuffs have yielded laterally and vertically consistent paleomagnetic data, sugges- ting that they carry a stable NRM of thermorem- anent magnetization (TRM) origin [Gromm6 et al., 1972; Best et al., 1973; Reynolds, 1977]. Often, though, the data from clearly igneous units are of poor statistical quality, or they show unex- pected directions [Gose, 1971; Gromm• et al., 1972; Reynolds, 1977]. Gose states, In light of PARALLEL ooF low• I ('"' I/ I ß k: RANDOM Fig. 1. Hypothetical example of parallel and random orientations of thermoremanent magnetization components in a core-sized portion of an ash-flow tuff cooling unit. Column is after Sparks et al. [1973]. 1Now at Department of Geology, University of Toronto, Toronto, Ontario, Canada M5S 1A1. Copyright 1980 by the American Geophysical Union. Paper number 9B1686. 0148-0227 / 80/009B-1686501.00 1487
-
Upload
independent -
Category
Documents
-
view
0 -
download
0
Transcript of PALEOMAGNETISM OF ASH-FLOW TUFFS: MICROANALYTICAL RECOGNITION OF TRM COMPONENTS

JOURNAL OF GEOPHYSICAL RESEARCH, VOL. 85, NO. B3, PAGES 1487-1499, MARCH 10, 1980
PALEOMAGNETISM OF ASH-FLOW TUFFS:
MICROANALYTICAL RECOGNITION OF TRM COMPONENTS
1 John Wm. Geissman
Department of Geological Sciences, University of Michigan, Ann Arbor, Michigan 48109
Abstract. A microanalytical technique, employing a cryogenic magnetometer and progres- sive alternating field demagnetization, is de- scribed and used to investigate the natural remanent magnetization of individual components (groundmass, crystals, and lithic and pumice fragments) in seven ash-flow tuff lithologies and to determine if subblocking temperature flow- or compaction-related movements took place in the units on scales ranging from the volume of the individual microspecimen (1-2 mm in diameter) to that of a standard paleomagnetic core specimen. Closely grouped directions from microspecimens
• o o of vitrophyre (eq5 s = 4.9 -12.4 ) and close correspondence of-these directions with their site mean directions determined from standard
samples suggest that the magnetic components of these units have not been disturbed by move- ments at low temperatures. Microspecimens from devitrified portions of the cooling units are of significantly lower coercivity than vitrophyre material and yield directions either more scat-
tered about their site mean (e95 greater than 15 ø) pr uniformly displaced in one direction (up to 35 ø) away from the mean. Devitrification.may be as significant a contributor to the scatter of microspecimen directions as are postblocking temperature randomizing or systematic micro- tectonic movements. Vitrophyres near the base and extremities of ash-flow tuff cooling units
are probably the most accurate indicators of the paleofield in each cooling unit.
Introduction
Over the years the paleomagnetic method has been applied to virtually every lithologic unit on the earth's surface and with general success in resolving statistically significant and mean- ingful magnetization components. Some lithol- ogies, however, by virtue of their mechanism of formation and subsequent acquisition of a natural remanent magnetization (NRM) (e.g., evaporites, conglomerates, and high-grade metamorphics) may perhaps be dubious recorders of the earth's paleofield.
One such lithology is the ash-flow tuff, or ignimbrite, that originates by pyroclastic flow and that consists predominantly of pumice and glass shards but may also contain crystals and lithic fragments [Sparks et al., 1973]. Some ash-flow tuffs have yielded laterally and vertically consistent paleomagnetic data, sugges- ting that they carry a stable NRM of thermorem- anent magnetization (TRM) origin [Gromm6 et al., 1972; Best et al., 1973; Reynolds, 1977]. Often, though, the data from clearly igneous units are of poor statistical quality, or they show unex- pected directions [Gose, 1971; Gromm• et al., 1972; Reynolds, 1977]. Gose states, In light of
PARALLEL
oo F low• I ('"'
I/ I
ß k:
RANDOM
Fig. 1. Hypothetical example of parallel and random orientations of thermoremanent magnetization components in a core-sized portion of an ash-flow tuff cooling unit. Column is after Sparks et al. [1973].
1Now at Department of Geology, University of Toronto, Toronto, Ontario, Canada M5S 1A1.
Copyright 1980 by the American Geophysical Union.
Paper number 9B1686. 0148-0227 / 80/009B-1686501.00
1487

1488 Geissman' AFT Paleomagnetism
COUM. SMPU.
z
ANDESITE
• • 7/•• • " • OF LINCOLN
• r • TUFF AND • BRECCIA OF
. .•½• GALLAGHER ½ ' ' •- PASS --, •.....'. ,•
• • MINE TUFF
•, o . . . o. SlNGATSE TUFF • 244 ,
. •, , , , ß /
, '• • • , • i I ß • , . .
, • ,
•'-• "• '-' •-'-• / o
• ' - - m 0 •190B ß > -• ..............
z • •190A
[ o Z , -_ ,o -0 • ;•'_O _ • i BASAL .... :•'v ,v •.•,.• TERTIARY
; •• D E P 0 S I m S
Fig. 2. Generalized stratigraphic column of the Yerington ash-flow tuff sequence, after Proffett and Proffett [1976], showing the location of each sample examined (asterisk and sampling site number).
the variations observed ... it is debatable how
accurately these rocks reflect the geomagnetic field direction at the time of their deposition. Complicated deuteric processes involving chemi- cal remagnetization and larger-scale, often inde- terminable, flow-related processes have been in- voked to explain much of the data from ash-flow tuffs [e.g., Nairn et al., 1975; Beck et al., 1977; Reynolds, 1977; Hoblitt and Kellogg, 1979].
An additional explanation for some of the paleomagnetic results from ash-flow tuffs may lie in their mode of emplacement. Pyroclastic material may be rapidly deposited in one or sev-
N
•- IO •O x n ß ß
/I / • • I OOx,.
/ o N o/;/
s o
Fñg. 3. Orthogonal demagnetñzation diagrams of the successive endpoints of the magnetization vector of chips from samples of the ¾erington ash-flow tuffs. Zn these and all ensuing or- thogonal demagnetization diagrams, open (solid) symbols refer to projections on the vertical (horñzontal) plane and, unless stated otherwñse, are plotted with respect to bedding coordinates. Demagnetizing fñelds along selected paths are in SZ units. Bold demagnetization paths refer to standard core specimens. In all stereo- graphic projections, open (solid) symbols always refer to directions on the upper (lower) hemi- sphere and, unless stated otherwñse, have been corrected for apparent structure. The large square and solid cone of 95Z confidence refer to the site mean direction whñle the small square (s) and dashed cone(s) refer to the sample mean direction(s), as explained in the text. (a) auild Mine Member vitrophyre at site 140; ?lag is plagioclase crystal, am is groundmass glass, and Opx is orthopyroxene crystal. (b) auñld Mine Member vñtrophyre at site 207.
eral events. Emplacement velocities range from about 16 km/h [Boyd, 1961] to over 160 km/h [Scott, 1968]. Welding is often successful in erasing any evidence that multiple flows formed units now apparently uniform and hundreds of meters in thickness. The distribution, internal geometry, and deformation features and nature of the contacts between individual ash-flow tuff
units are strongly influenced by predepositional topography. It is conceivable that all these effects may result in small-scale flow- and

Geissman' AFT Paleomagnetism 1489
E
-o
D
Fig. 3. (continued)
compaction-related movements of portions of the tuff after acquisition of a complete or partial TRM. The magnetization •f portions of ash-flow tuff cooling units may then be complex and there- fore difficult to interpret.
In this paper a microanalytical technique of NRMmeasurement is used to determine whether
small-scale tectonic processes may alter the NRM directions of ash-flow tuffs and thus preclude recognition of TRMdirections. The fundamental tenet behind this study is twofold in nature and is illustrated in Figure 1. If a group of micro- specimens from a standard paleomagnetic core yields directions of good statistical quality and cluster about the site-mean direction, it is
after TRM acquisition. The TRM of the individual components of the ash-flow tuffs are then ran- domized to some degree, and the bulk NRM of the specimens may be meaningless.
We are only concerned with the possibility that postblocking temperature deformation of volumes smaller than the size of a standard
paleomagnetic specimen has occurred in ash-flow tuff units. The timing of larger-scale deforma- tions with respect to TRM acquisition has al- ready been investigated using conventional methods, and it has been shown that postblock- ing temperature movements may indeed occur [e.g., Hoblitt and Kellogg, 1979; H. W. Smedes and W. F. Hanna, manuscript in preparation, 1980].
reasonable to assert that no movement of the unit, Reynolds [1977], on the other hand, found no minimally on the scale of the volume examined, occurred after TRM acquisition. In such cases the TRM of the individual components of the ash-flow tuff, schematically shown by arrows in Figure 1, would be essentially parallel. The TRM in standard paleomagnetic samples may then be recoverable. If, on the other hand, micro- specimens yield directiofis of poor grouping and/or significantly different from the bulk specimen and site-mean direction, then flow- and compaction-related movements, on a scale smaller than that of the standard core, may have occurred
difference in the magnetization directions from lineated and nonlineated tuffs in the Yellow-
stone area and suggested that large-scale de- formations producing the lineations occurred at temperatures above the TRM acquisition.
The technique has been applied to a sequence of Oligocene ash-flow tuff units exposed near Yerington, western Nevada, and described by Proffett and Proffett [1976]. In the Yerington area a study of pre- and post-Oligocene deforma- tion has yielded paleomagnetic data from the tuffs that are often quite dispersed on the

1490 Geissman' AFT Paleomagnetism
TABLE 1. Mean Site, Sample, and Chip Magnetization Data From the Nine Ash-Flow Tuff Sites Examined
b
N/N a Direction a 95 k o Declination Inclination
Site mean (5/5 samples) Sample mean (3/3 specimens) Specimen mean (10/13 chips)
Site mean (4/4 samples) Sample mean (5/5 specimens) Specimen mean (6/6 chips)
Site mean (7/7 samples) Sample A mean (2/2 specimens) Specimen A mean (4/4 chips) Sample B mean (6/6 specimens) Specimen B mean (4/4 chips)
Site mean (6/6 samples) Sample A mean (5/5 specimens) Specimen A mean (8/8 chips) Sample B mean (5/5 specimens) Specimen B mean (5/5 chips)
Site mean (2/3 samples) Sample mean (3/3 specimens) Specimen mean (5/6 chips)
Site mean (21/21 samples) Vitrophyre (site A) Sample A mean (4/4 specimens) Specimen A mean (9/9 chips) Sample B mean (4/4 specimens) Specimen B mean (7/7 chips) Devitrified (site B) Sample mean (2/2 specimens) Specimen mean (8/8 chips)
Site mean (6/6samples) Sample A mean (2/2 specimens) Specimen A mean (5/5 chips) Sample B mean (4/4 specimens) Specimen B mean (3/5 chips)
Site mean (5/5 samples) Sample mean (2/2 specimens) Specimen mean (6/6 chips)
Site 134
316.3 6.1 7.7 30.2 322.0 2.3 4.6 699.5 331.2 1.1 12.1 17.0
Site 140
340.5 35.7 4.7 85.6 342.0 36.2 7.6 101.6 353.8 40.8 7.3 84.9
Site 207
259.9 62.5 3.1 104.4 260.3 53.5 12.8 52.2 273.1 72.4 11.7 62.8
259.5 62.7 2.2 927.5 239.6 66.1 23.1 16.8
Site 303
255.0 57.5 8.1 14.8
249.0 47.1 12.9 36.0 256.0 53.0 15.1 14.5
256.7 46.6 9.2 69.6 228.0 -6.5 10.9 40.9
Site 234
251.0 69.0 11.4 21.1 247.0 63.0 42.2 9.6 292.7 49.9 26.2 9.5
Site 190
15.6 39.4 4.6 14.7
346.2 45.1 12.8 52.6
3.5 61.8 26.4 4.8
22.2 46.7 13.4 48.3 356.5 50.0 14.5 18.3
11.1 41.5 4.4 445.0
9.9 46.3 6.5 65.4 Site 244
334.7 65.7 6.7 35.4 332.5 52.7 3.5 679.2 317.9 33.8 15.3 25.9 342.0 54.9 9.0 105.1
16.7 22.1 44.0 8.3 Site 250
118.2 53.2 5.1 100.9
112.8 53.5 5.3 305.4 119.5 59.4 5.2 167.7
Ratio of accepted to measured samples, specimens, or chips. Mean direction, in degrees, after correction for bedding, except at site 250, where the value is in situ.
c
dSemiangle of the cone of 95% confidence about the mean direction, in degrees. Fisher precision parameter.
site and formation levels [Geissman et al., 1978, 1979, and manuscript in preparation, 1980]. In addition, the data on the formation level, even after correcting for observed structure, are not in agreement with a mid-Oligocene to Late Oligocene predictor field direction. It was thought that p•stblocking temperature, small- scale movements within the tuffs may be responsi- ble for some of the scatter and discrepancies in the data at the formation level. Because of the
extensive geologic and conventional paleomagne- tic control, the ash-flow tuffs at Yerington were selected for microanalytical study.
Methodology
Our microanalytical technique differs signifi- cantly from that described by Wu et al. [1974] and hence will be described in some detail.
Standard (2.54-cm diameter x 2.54-cm length) specimen cores taken from one or more indepen- dantly oriented hand samples are'polished on their upper surface for reflected light examina- tion of their magnetic mineralogy. The core is then cut parallel to this surface, about three quarters of the way through, leaving a thin slab adhering to the specimen core. A Beuhler

Geissman: AFT Paleomagnetism 1491
N
(b)
o 50 IOO
Peak Alternating Field, in mT Fig. 4. (a) Stereographic projection of chip directions from a sample of Guild Mine Member vitrophyre at site 134; Plag is plagioclase crystal, Mmg is magnetite pheno- cryst-bearing groundmass glass, and Gm is groundmass. Directional behaviors of se- lected chips are plotted. (b) Normalized intensity versus peak alternating field for behavior of chips whose directional paths are plotted in Figure 4a.
Isomet low-speed saw, equipped with a diamond- impregnated, oil-cooled brass blade, was em- ployed. With practice, the thickness of the slab may be consistently kept as thin as 300-500 •m. While attached to the specimen core, the slab is scribed with orthogonal specimen co- ordinate lines using a suitable fine marder. The slab is then broken from the core and examined
with reflected or transmitted light in order to select areas for measurement. Microspecimens, herein called chips, are broken from the slab, preserving a portion of the grid lines, and then glued with rubber cement onto a cylindrical plexiglass holder. The chips are handled with polyethylene (or any other nonmagnetic sub- stance) forceps to avoid inducing an isothermal remanent magnetization. The holder is roughly the size of a standard specimen core. Its upper surface has been scribed with orthogonal coordinates to facilitate alignment of the chip. The holder with chip is then mounted in a standard SCT cryogenic magnetometer for measure- ment. Thus progressive alternating field de- magnetization treatments may be conveniently performed on lithologically and petrologically characterized microspecimens having a minimum area of about 1 mm2 and an orientation error of less than 5 ø ß
Response of the chips to progressive alternat- ing field demagnetization is displayed in most cases by plotting the magnetization vector, with respect to bedding coordinates, using ortho- gonal demagnetization diagrams [Zijderveld, 1967]. In instances where the data points on horizontal and vertical projections overlap, two separate projections are shown. The horizontal axis varies from diagram to diagram in order to best portray the demagnetization be- havior of the chips. For clarification the magnetization direction used for each chip, usu- ally the endpoint of the demagnetization path, is indicated by a star alongside the data point for each path on the horizontal and ver- tical projections. This direction is also plot- ted on the accompanying stereographic projection. For comparative purposes, mean directions and their associated cones of 95% confidence are also
plotted: one is the site-mean direction, based upon standard-sized samples, ahd the other is the mean direction of several specimen cores from the sample or samples from which the chips came. The Oligocene field of Beck et al. [1977], extrapola- ted for Yerington coordinates, is also plotted on each projection as a plus sign. On selected de- magnetization paths, peak demagnetizing fields, in SI units (milliteslas) are indicated beside

1492 Geissman' AFT Paleommgnetism
N
San o
SITE 505
,%////
o
o / o 6
D
E
Fig. 5. Orthogonal demagnetization diagrams of chips from samples of the Yerington ash-flow tuffs. (a) Devitrified middle portion of the Guild Mine Member at site 303 (two samples distinguished by solid and hatched lines in the demagnetization paths and by circles and triangles, respectively, in the stereographic projection); San is sanidine crystal, Gm is groundmass. (b) Uppermost portion of the Guild Mine Member at site 234. Triangles in stereographic projection are (secondary) directions removed from six chips in demagnetization.
data points. Intensities are not given along the axes, since the moments of the chips may vary by over a magnitude and several paths have been either magnified or reduced in order to display the results in one diagram.
In cases where the dispersion of chip direc- tions is emphasized or where composite vector diagrams for all chips examined from a site would be very difficult to interpret, chip directions are simply displayed on a stereonet. Directional and intensity variations of selected chips are shown on the stereographic projection and in an accompanying normalized intensity decay plot, re- spectively.
Sample Description.
A columnar section of the Yerington sequence, described and named by Proffett and Proffett [1976], including the approximate location of the samples investigated, is shown in Figure 2.
Three ash-flow tuff cooling units compose the majority of the section. The Guild Mine Member of the Mickey Pass Tuff is a compound [Smith, 1960] cooling unit; the Weed Heights Member of the Mickey Pass Tuff and the Singatse Tuff are simple [Smith, 1960] cooling units. These are separated by rhyolitic sediments, poorly welded tuffs, and stream and lacustrine deposits. On the basis of extensive mapping, the Yerington volcanics were emplaced into a broad NW-SE trending river valley developed in Early Tertiary time. Pre-eruption topographic relief is infer- red to have been mild in the central portions of the area, but was 600 m or more on the NE and SW edges of the valley. Extensive Late Cenozoic Basin and Range type faulting and E-W extension along curved, concave upward, east dipping normal faults [Proffett, 1977] has exposed the Tertiary section in a number of steeply west dipping blocks. Structural attitudes in the ash-flow
tuffs may readily be determined from orientations
Geissman' AFT Paleomagnetism 1493
N
b
E
0 5
D
SITE 2;54
Fig. 5. (continued)
of elongate, collapsed pumice-clasts (eutaxitic structure), flow textures, alignment of crystal phases, weathering surfaces, and crude columnar jointing perpendicular to bedding surfaces. In the region where pre-eruption topographic relief was insignificant, these structures closely conform to attitudes of intervening sedimentary beds, while on the flanks of the valley the at- titudes may conform more closely to the irregular topography. Internal deformation during and after subsequent emplacement of the ash-flow tuff cooling units may have occurred on the flanks of the valley.
Results
The results are presented according to strati- graphic location (Figure 2). Statistical data from the chips, specimens from the sample or samples from which the chips were taken, and the samples from the entire site are compiled in Table 1 for comparative purposes. The ratio of the number of chips, core specimens, or samples accepted for statistical purposes to the total analyzed is given as a ratio N/No in Table 1.
Guild Mine Member, Mickey Paps Tuff
The Guild Mine Member of the Mickey Pass Tuff is composed of three mappable units, a thick near-basal to basal vitrophyre, m moderately welded devitrified middle unit, and a crystal-
and pumice-fragment-rich, poorly welded upper zone (Figure 2). The vitrophyre consists of approximately 35% crystal and lithic fragments and 65% black glass. Its crystal population con- sists primarily of plagioclase and orthopyroxene. The crystal population is smaller in the massive, devitrified portion of the unit but decreases significantly near the top of the cooling unit, where crystal and pumice fragments, commonly 5 mm or more in length, make up over half of the rock.
Figure 3a displays results from six chips from a single-specimen core of vitrophyre at site 140. Response by the chips to af demagne- tization is in all cases excellent; after re- moval of a low-coercivity component of magneti- zation a univectorial decay to the origin is observed (the characteristic magnetization). The different components of the rock exhibit con- trasting coercivities, yet the grouping of chip characteristic directions agrees well with the mean of the bulk specimens. As examples of the intensities recorded, a chip consisting entirely of, and labeled as, groundmass (Gm) has an initial value of 1.12 x 10⁻⁵ emu (approximately 1.12 x 10⁻² emu/cm3 or 11.2 A m-l), and the plagioclase crystal (Plag) has an NRM intensity of 0.03 x 10⁻⁵ emu.
A second example from the same vitrophyre, at site 207, is shown in Figure 3b. All chips ex- amined are either groundmass glass or mixtures of groundmass and crystals. There is an excel-
1494 Geissman: AFT Paleomagnetism
Results from the devitrified interior of the
Guild Mine Member, at site 303, are shown in Figure 5a. Chips from specimens of two samples, distinguished by plain and hatched demagnetiza- tion curves, have been analyzed. The dispersion of chip directions from each of the samples is similar to the dispersion at the site level. However, the chip directions from one sample (triangles) are displaced from both the site mean direction and the two mean directions de-
termined from core specimens from each of the two samples. The sanidine crystals examined re- spond well to demagnetization; their character- istic directions do not differ from those of
other material.
The rhyolitic upper portion of the Guild Mine unit was investigated at site 234. NRM in- tensities of millimeter-sized chips were too low (less than 1.0 x 10 -7 emu) for subsequent af demagnetization treatments to be meaningful, and consequently, the size of the chips was in- creased to approximately 10 mm 3 or so. NRM direc- tions from all chips from the sample investigated are of northeast to east declination and positive inclination. Upon demagnetization, each chip displays a trend to west-northwest directions, a response similar to that of standard specimen cores, but only in a few instances does a crude univectorial decay to the origin follow (Figure 5b). The (secondary) directions removed in demagnetization (triangles, Figure 5b) are of northeast declination and moderate positive inclination with respect to bedding coordinates and of northeast declination and shallow to
moderate positive inclination in in situ coordi- nates and thus are clearly not present field
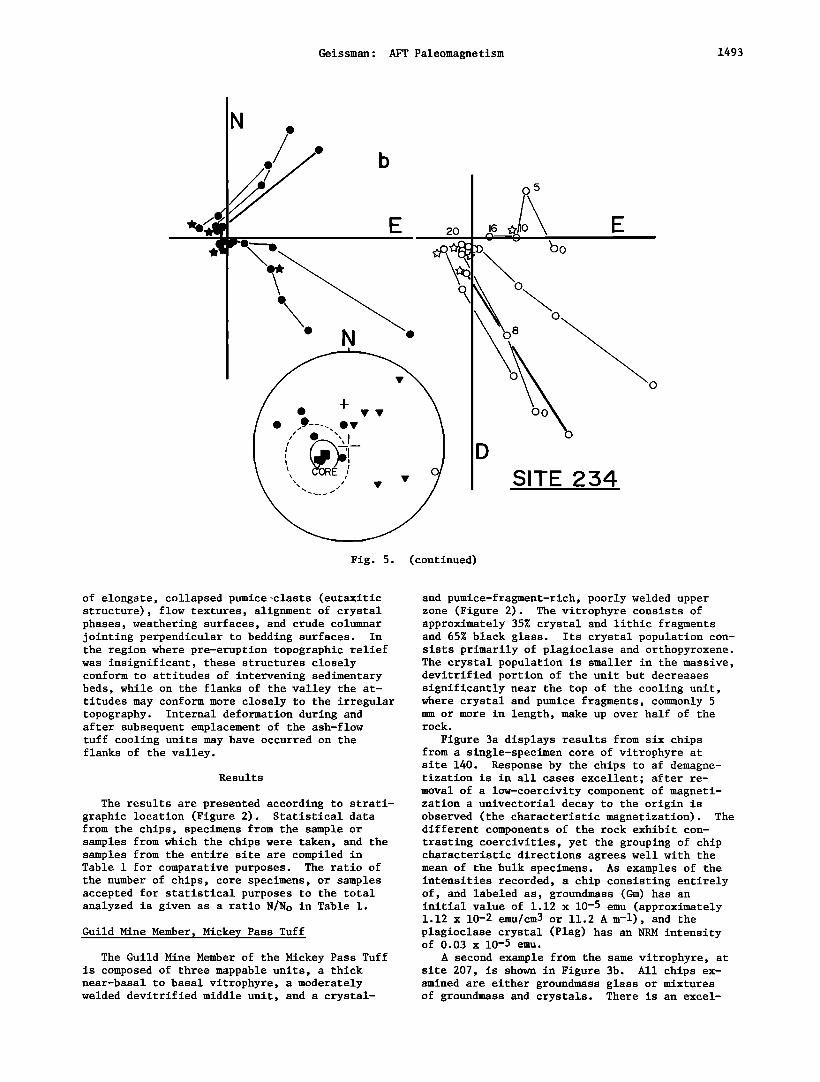
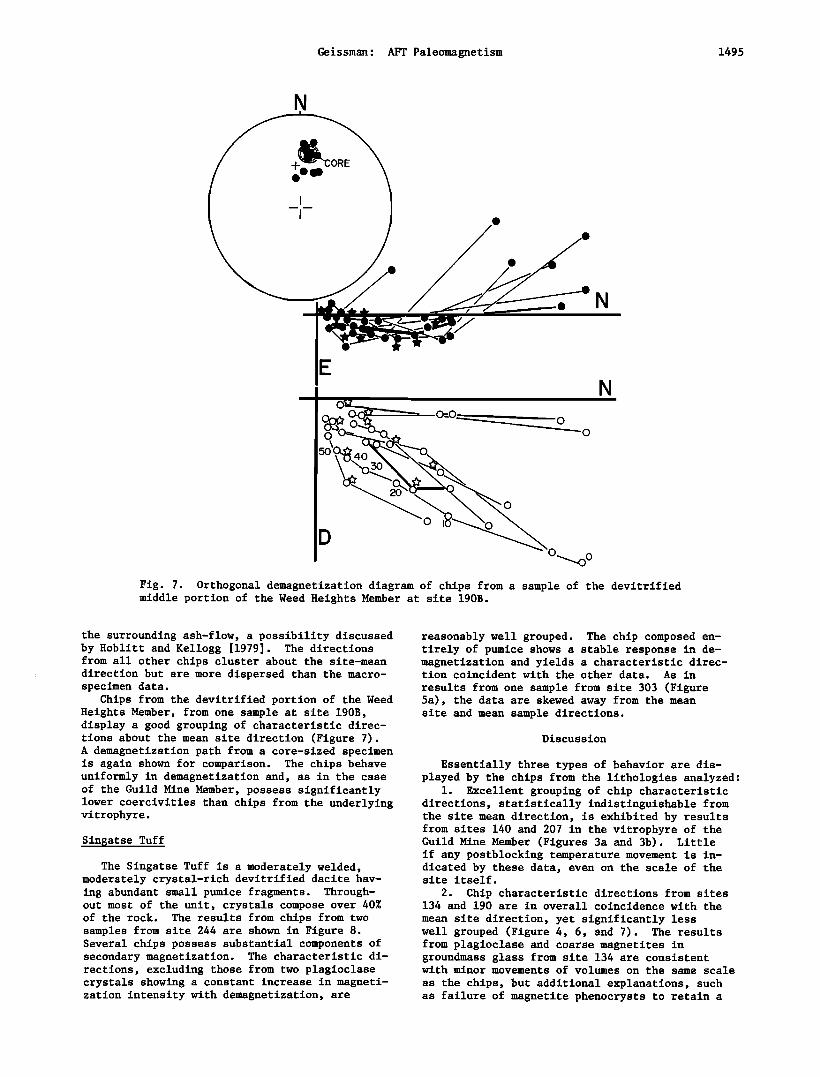
Peak Alternating Field, in mT
Fig. 6. (a) Stereographic projection of chip directions from two samples of Guild Mine Member vitrophyre at site 190A (directions dis- tinguished by circles and triangles); lithic is
50 IOO directions. Stable endpoints of the high-coer- civity magnetization component for several of the individual chips are difficult to resolve, in part because of their low intensities after re- moval of the secondary component. Five of the six chip directions chosen, generally at the final demagnetization step, are close to the site and sample mean directions. In addition, the
lithic fragment. Directional behavior of selec- secondary directions from the chips are similar ted chips is plotted. (b) Normalized intensity versus peak demagnetizing field for behavior of chips whose directional paths are plotted in Figure 6a.
lent grouping of the chip characteristic direc- tions and coincidence with the site direction.
Groundmass glass again displays high coercivities and stable behavior in demagnetization.
At site 134, in the Guild Mine vitrophyre, similar, generally well-grouped results are ob- tained from chips composed of only groundmass glass (Gm) (Figure 4). In addition, groundmass glass chips containing magnetite phenocrysts (Mag) were purposely investigated and were found to have more random NRMdirections (Figure 4a) and significantly lower coercivities (Figure 4b) than groundmass glass chips. Response to af demagnetization is irregular, and in concert with the lower coercivities, resolution of a univec- torial decay to the origin of the magnetization is precluded. The plagioclase crystal examined did not show an ultimate decay to the origin, possibly because its low intensity precluded ac- curate resolution of a decay.
to those from specimens from sample 234B.
Weed Heights Member• Mickey pass Tuf.f
The Weed Heights Member of the Mickey Pass Tuff consists of a basal, crystal- and lithic- fragment-rich perlitic vitrophyre and a moder- ately welded, devitrified crystal-rich upper zone. The vitrophyre contains up to 25% crystal and 3% lithic fragments. The middle part of the unit is characterized by having 15% or more pum- ice fragments, usually smaller than 2 cm in diameter.
Data from two vitrophyre samples at site 190A are shown in Figure 6. Dense shards of crystal- poor glass within the vitrophyre exhibit excel- lent univectorial response to af demagnetization. Their characteristic directions are quite similar to those from chips composed of partially de- vitrified perlitic groundmass glass, forming the majority of the results. A chip from a 0.16-cm 2 lithic fragment in the vitrophyre, identified in the stereographic projection (lithic), displays a univectorial response in demagnetization and a deviatory direction. This may indicate incom- plete thermal remagnetization of the clast by
Geissman' AFT Paleomagnetism 1495
N
ß
ß
ß ß
N
•x, o3o • Zo•O.-----• •
D
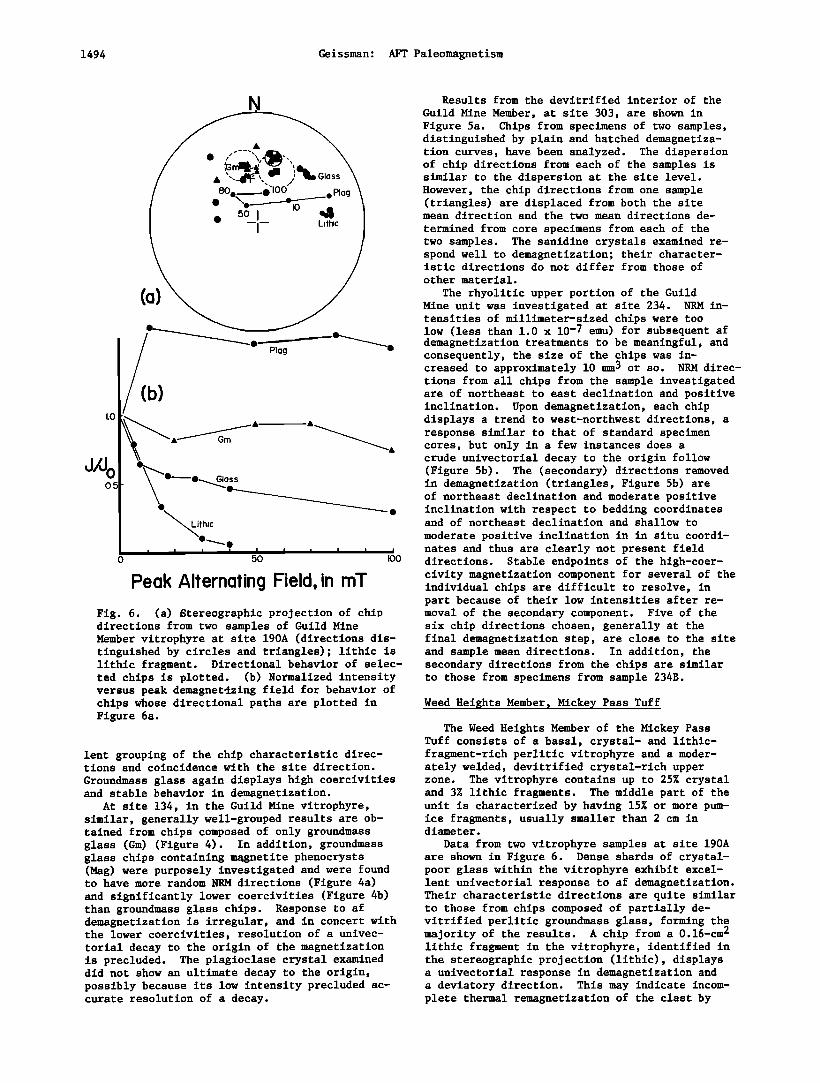
Fig. 7. Orthogonal demagnetization diagram of chips from a sample of the devitrified middle portion of the Weed Heights Member at site 190B.
the surrounding ash-flow, a possibility discussed by Hoblitt and Kellogg [1979]. The directions from all other chips cluster about the site-mean direction but are more dispersed than the macro- specimen data.
Chips from the devitrified portion of the Weed Heights Member, from one sample at site 190B, display a good grouping of characteristic direc- tions about the mean site direction (Figure 7). A demagnetization path from a core-sized specimen is again shown for comparison. The chips behave uniformly in demagnetization and, as in the case of the Guild Mine Member, possess significantly lower coercivities than chips from the underlying vitrophyre.
Singatse Tuff
The Singatse Tuff is a moderately welded, moderately crystal-rich devitrified dacite hav- ing abundant small pumice fragments. Through- out most of the unit, crystals compose over 40% of the rock. The results from chips from two samples from site 244 are shown in Figure 8. Several chips possess substantial components of secondary magnetization. The characteristic di- rections, excluding those from two plagioclase crystals showing a constant increase in magneti- zation intensity with demagnetization, are
reasonably well grouped. The chip composed en- tirely of pumice shows a stable response in de- magnetization and yields a characteristic direc- tion coincident with the other data. As in
results from one sample from site 303 (Figure 5a), the data are skewed away from the mean site and mean sample directions.
Discussion
Essentially three types of behavior are dis- played by the chips from the lithologies analyzed:
1. Excellent grouping of chip characteristic directions, statistically indistinguishable from the site mean direction, is exhibited by results from sites 140 and 207 in the vitrophyre of the Guild Mine Member (Figures 3a and 3b). Little if any postblocking temperature movement is in- dicated by these data, even on the scale of the site itself.
2. Chip characteristic directions from sites 134 and 190 are in overall coincidence with the
mean site direction, yet significantly less well grouped (Figure 4, 6, and 7). The results from plagioclase and coarse magnetites in groundmass glass from site 134 are consistent with minor movements of volumes on the same scale
as the chips, but additional explanations, such as failure of magnetite phenocrysts to retain a

1496 Geissman: AFT Paleomagnetism
N
I &,• Plag ,.ol/ (b)
Pumice
o o ,50 ioo
Peak Alternating Fielcl,inm'l' Fig. 8. (a) Stereographic projection of chip
TRM or the inability of a true magnetization di- rection to be resolved from a weakly magnetized feldspar crystal, must be considered. First, magnetite phenocrysts in the basal vitrophyre of the cooling units contain ubiquitous ilmenite lamellae oriented along {111} cleavage planes, formed in response to high-temperature oxidation [Buddington and Lindsley, 1964]. The high co- ercivity of the magnetization in the vitrophyres is not, however, a result of this oxidation pro- cess, which has formed pseudo-single-domain [Dunlop, 1973] or single-domain [N•el, 1949] regions with the magnetite crystals, as has been proposed for other lithologies [e.g., Strangway et al., 1968; Larson et al., 1969; McClay, 1974]. Alternating field demagnetization and hysteresis tests indicate that the glass chips without mag- netite phenocrysts have significantly higher
ing temperatures greater than 580oc are either nonexistant or too low in intensity. The high coercivity component within the glassy groundmass probably resides in single-domain or pseudo- single-domain magnetites, a conclusion also reached by Reynolds [1977], and thus the remanence in the magnetite phenocrysts may be difficult to interpret. Magnetite phenocrysts themselves are often well rounded, and the glass surrounding them complexely deformed and suggestive of move- ment of the particles, but as will be discussed shortly, this movement must have ceased prior to acquisition of a TRM.
With respect to silicate crystals, careful petrographic scrutiny is essential in the inter- pretation of any magnetic data suggestive of post- blocking temperature rotations. For instance, the remanence in the plagioclase crystals from one of the samples at site 244 in the Singatse Tuff probably resides in free iron oxide particles, but their behavior in af demagnetization and con- sequently any directions from them are indeed difficult to interpret. The contribution of the remanence of the silicate crystal population to the total remanence of the ash-flow tuff unit is
negligible, and thus it is the magnetization of the groundmass material that is of primary concern.
3. Fairly good groupings of chip characteris- tic directions are observed, yet displacements of directions from one or both samples occur from both the site mean and the sample mean directions, as shown by data from sites 303 and 244 (Figures 5a and 8). Postblocking temperature movements, systematic throughout at least the areas of the slabs investigated, are possible.
Data from chips from the densely welded vitro- directions from two samples of Singatse Tuff at phyre portions of the ash-flow t•zff units in- site 244 (directions distinguished by triangles vestigated indicate that postblocking temperature and circles); Gm is groundmass and Plag is movements have not affected site-mean directions plagioclase crystal. Directional behavior of in this lithology. The data indicate that the selected chips is also plotted. (b) Normalized TRM is essentially uniform throughout the volume intensity versus peak demagnetizing field for of the site, a conclusion in agreement with es- behavior of chips whose directional paths are timates of minimum welding temperatures for plotted in Figure 8a. rhyolitic glasses. Boyd [1961] experimentally
determined minimum temperatures of welding in glasses having varying water contents using dif- ferent total pressure and time conditions and suggested that the minimum temperature that welding in tuffs may take place is of the order of 600øC. Movement in the vitrophyres apparently had ceased before any portion of the TRM compo- nent in magnetite was blocked in decreasing temperatures.
More dispersed characteristic directions from the devitrified portions of the cooling units may in part originate from partial remagnetization by low-temperature oxidation processes rather than from postblocking temperature movements. Reynolds [1977] found that the devitrified zone of the Yellowstone Huckleberry Ridge Tuff did not display a univectorial decay to the origin of a magnetization component over any range of fields used for demagnetization, while the outer and lower glassy margins of the cooling unit con-
coercivities than those with magnetite phenocrysts. tained stable magnetizations. Nairn et al. Also, the high coercivity of the groundmass glass [1975], however, reported the least dispersed re- does not appear to be attributable to hematite, sults from the devitrified interiors of the ash- because the vitrophyre displays a Curie tempera- flow tuff sheets examined. Devitrification of ture between 540 ø and 560øC in thermomagnetic ash-flow tuff units occurs over a wide range of analysis, and during progressive thermal demag- temperatures and is prompted by the influx of netization, magnetization components having block- groundwater and hydrothermal solutions [Friedman

Geissman' AFT Paleomagnetism 1497
N
E 9O
** E
IrE 250
,o o ß
ø o o
D
Fig. 9. Orthogonal demagnetization diagram, plotted with respect to field coordinates, of chips from one sample of the Guild Mine Member at site 250. Solid lines are for glassy material, and hatched lines are for devitrified material.
and Smith, 1964; Lipman, 1965] leading to the growth of secondary magnetic phases [e.g., Reynolds, 1977]. In several areas the Guild Mine vitrophyre contains abundant clots or veins of incipient devitrification, and these areas offer a test of the effects of the devitrifica-
tion process on the characteristic directions.
only in additional specimens from the site 234 samples utilized for microanalysis.
The devitrified portions of the ash-flow tuff units are moderately to densely welded, and Proffett and Proffett [1976] suggest that more than half of each cooling unit was originally in a glassy state. It is difficult to imagine that
In Figure 9 are shown results from a single-speci- small-scale, random rotations occurred during men core, from site 250, containing both devitri- fied and glassy material. Magnetization direc- tions in both vitrophyre and devitrified material are similar, if not identical. In this instance the devitrification process has not altered the characteristic directions from the unit but has
substantially reduced the coercivities of the material. Median destructive fields for the
vitrophyre are over 100 mT but range from 20 to 40 mT in the devitrified material. This phenom- enon has been observed in conventional analysis of the ash-flow tuff units throughout the dis- trict: the primary, fine-grained, high-coercivity magnetite particles within the groundmass glass are partially to completely leached and/or oxi- dized during secondary hydration and devitrifica- tion of the originally glassy ash-flow tuff. In polished thin sections, hematite and limonite are present in the devitrified groundmass, and coarser magnetite phenocrysts are partially to completely oxidized. The decreased coercivity of the devitrified lithologies is the result of the formation of new minerals, carrying a chemical remanent magnetization (CRM), at the expense of primary, stable oxides in the groundmass glass. CRM acquired in devitrification is recognized both as a high blocking temperature (greater than 580øC) component and as occasional low-coercivity secondary magnetizations residing in magnetite
devitrification, at temperatures below minimum welding temperatures and thus below blocking temperatures as well. In the poorly welded, de- vitrified upper portions of each cooling unit, small-scale movements are indeed feasible at
temperatures below the blocking of the majority of the remanence, but these have not been con- clusively demonstrated.
Results displaying the third type of behavior listed above are difficult to interpret but are at least suggestive of the possibility of post- blocking temperature movements. Systematically deviating chip directions are not simply an arti- fact of a poorly determined site mean, nor do they originate from a sample whose specimen di- rections are anomalous in comparison to the over- all site mean. Anomalous, well-grouped chip di- rections from a small volume of a standard paleo- magnetic specimen may indeed indicate that uni- form, postblocking temperature disruptions occur- red in at least small volumes of the tuff. Site
244 is located relatively high in the Singatse Tuff section; site 303, although within 50 m of the base of the Guild Mine unit, is located on the extreme fringe of the Early Tertiary valley proposed by Proffett and Proffett. Furthermore, textural evidence at site 303 indicates that
this devitrified material has been much less
welded than corresponding devitrified material (J. W. Geissman et al., manuscript in preparation, having a similar stratigraphic position with 1980). Low-coercivity secondary magnetizations respect to the base of the Guild Mine unit within were detected consistently by conventional means the Early Tertiary valley. If chips display

1498 Geissman' AFT Paleomagnetism
well-grouped directions deviating from the mean port of and cooperation in this project. Curie sample and mean site direction, one would expect temperature measurements were made during a stay that further investigations of chips from that at the Rock Magnetism Laboratory in the sample should disclose results deviating in the Department of Geology and Geophysics at the opposite sense and thus average out the chip di- University of Minnesota, courtesy of Subir rections into coincidence with the mean sample Banerjee. Eric J. Essene and Rob Van der Voo value. While such results have not been detected, provided in-house reviews. they could convincingly show that the standard NRM data from certain tuffs reflect a complicated series of microtectonic processes and may or may not (fortuitously) reflect the geomagnetic field.
Conclusions
The directions and af demagnetization behavior of oriented millimeter-sized components in ash- flow tuffs have been examined. Dispersion of directions and behavior of the chips in demagne- tization vary with the ash-flow tuff unit and type of chip examined. Comparison of directions from chips with those for entire samples suggests that postblocking temperature movements of vol- umes ranging from that of the individual chip to perhaps up to approximately 10 vol % of the indi- vidual specimen core may have occurred in some devitrified portions of two cooling units. Sys- tematic movements of up to 35 ø away from the sample mean have been detected. Data from vitro- phyre units suggest that compaction and flowage- related movements ceased at temperatures in ex- cess of the highest blocking temperatures of the magnetic materials. Devitrification of origi- nally glassy material has altered the magnetic properties of the ash-flow tuff units via the destruction of a portion of the original, very stable TRM as well as by the formation of CRM components. In near-basal, strongly welded material the devitrification process alone does not appear to be directly responsible for dis- persions in characteristic directions. Higher in the ash-flow tuff cooling units, devitrification and postblocking temperature movements may effec- tuate significant changes in the dispersion of originally TRM directions.
Postblocking temperature rotations cannot ac- count for all discrepancies in the paleomagnetic data from ash-flow tuff units. However, a microanalytical technique of NRMmeasurement may be used to recognize such rotations and to con- firm the credibility of the NRM of these units based upon standard paleomagnetic samples. As in conclusions from previous paleomagnetic stud- ies of ash-flow tuff units, the near-basal, high- ly welded vitrophyre portions of each cooling unit appear to contain the most stable magneti- zations. Ash-flow tuffs compose a significant percentage of the Middle to Late Cenozoic igneous rock record of the North American continent. If
accurate geomagnetic pole information is to be extracted from these units, sampling should be concentrated in the highly welded vitrophyre zones, deposited on horizontal or near-horizon- tal topography. In the Yerington District, mag- netization directions in these zones apparently have not been appreciably disturbed by post- blocking temperature, small-scale flow, and com- paction-related processes.
Acknowledgements. I thank the General Mining Division of The Anaconda Company for their sup-
References
Beck, M. E., Jr., S. D. Sheriff, J. F. Diehl, E. A. Hailwood, and P. W. Lipman, Further paleomagnetic results from the San Juan Volcanic Field of Southern Colorado, Earth Planet. Sci. Lett.; 37, 124-130, 1977.
Best, M. G., R. T. Shuey, C. F. Gaskey, and S. K. Grant, Stratigraphic relations of members of the Needles Range Formation at type localities in southwest Utah, Geol. Soc. Amer. Bull., 8•4, 3269-3278, 1973.
Boyd, F. R., Welded tuffs and flows in the rhyolite plateau of Yellowstone Park, Wyoming, Geol. Soc. Amer. Bull., 72, 387-426, 1961.
Buddington, A. F. and D. H. Lindsley, Iron-ti- tanium oxide minerals and synthetic equivalents, J. Petrol., •, 310-357, 1964.
Dunlop, D. J., Thermoremanent magnetization in submicroscopic magnetite, J. Geoph¾s.. Res., 78, 7602-7613, 1973.
Friedman, I., and R. L. Smith, The hydration and devitrification of natural glass (abstract), Eos Trans. AGU, 45, 122, 1964.
Geissman, J. W., K. L. Howard, R. Van der Voo, and W. C. Kelly, A paleomagnetic study of pre- Oligocene deformation in the Yerington (porphy- ry copper) district, W. Nevada (abstract), Eos Trans. AGU, 59, 271, 1978.
Geissman, J. W., R. Van der Voo, W. C. Kelly, and K. L. Howard, Further paleomagnetic results bearing on pre-Tertiary deformation in the Yerington (porphyry copper) district, western Nevada (abstract), Eos Trans. AGU, 60, 239-240, 1979.
Gose, W. A., Paleomagnetic studies of Miocene ignimbrites from Nevada, Geophy s J. Roy. Astron. Soc., 20, 241-252, 1971.
Gromm•, C. S., E. H. McKee, and M. C. Blake, Paleomagnetic correlations and K-Ar dating of Middle Tertiary ash-flow sheets in the East Great Basin, Nevada and Utah, Geol. Soc. Amer. Bull., 83, 1619-1638, 1972.
Hoblitt, R. P., and K. S. Kellogg, Emplacement temperatures of unsorted and unstratified de- posits of volcanic rock debris as determined by paleomagnetic techniques, Geol. Soc. Amer. Bull., 90, 633-642, 1979.
Larson, E., M. Ozima, M. Ozima, T. Nagata, and D. W. Strangway, Stability of remanent magne- tization of igneous rocks, Geophys. J. Roy. Astron. Soc., 19, 263-275, 1969.
McClay, K. R., Single-domain magnetite in the Jimberlana norite, western Australia, Earth Planet. Sci. Lett., 21, 367-376, 1974.
Nairn, A. E. M., P. D. Rowley, and J. J. Anderson, Paleomagnetism of selected Tertiary volcanic units, southwest Utah, Geol. Soc. Amer. .S•c. Pap., 160, 63-74, 1975.
Niel, L., Theorie due trainage magnetique des ferromagnetiques aux grains fins avec applica- tions aux terres cuites, Ann. Geophys., •, 99- 136, 1949.

Geissman- AFT Paleomagnetism 1499
Proffett, J. M., Jr., Cenozoic geology of the Yerington district, Nevada, and implications for the nature and origin of Basin and Range faulting, Geol. Soc. Amer. Bull., 88, 247-266, 1977.
Proffett, J. M., Jr., and B. H. Proffett, Stratigraphy of the Tertiary ash-flow tuffs in the Yerington district, Nevada, Rep. •7, Nev. Bur. of Mines and Geol., Reno, 1976.
Reynolds, R. L., Paleomagnetism of the welded tuffs of the Yellowstone group, J. G•ophys. Res.., 82, 3677-3693, 1977.
Scott, R. B., The Tertiary geology and ignimbrite petrology of the Grant R•ge, East-Central Nevada, Ph.D.. thesis, Rice Univ., Houston, Tex., 1968.
Smith, R. L., Zones and zonal variations in wel- ded ash-flows, U.S. Geol. Surv. Prof. Pap., 354-F, 1960.
Sparks, R. S. J., S. Self, and G. P. L. Walker, Products of ignimbrite eruptions , Geology, 1, 115-118, 1973.
Strangway, D. W., E. E. Larson, and M. Goldstein, A possible cause of high magnetic stability in volcanic rocks J Geoph s Res 73, 3787-379• 1968.
Wu, Y. T., M. Fuller, and V. A. Schmidt, Micro- analysis of N.R.M. in a granodiorite intrusion, Earth Planet. Sci. Lett.., 2_•5, 275-285, 1974.
ZiJderveld, J. D. A., A.C. demagnetization of rocks: Analysis of results, in Methods in Paleo- magnetism, edited by D. W. Coilin,on, K. M. Creer, and S. K. Runcorn , pp. 254-2•, Elsevier, New York, 1967.
(Received March 1, 1979; revised October 31, 1979;
accepted November 6, 1979.)