Tectonics and metallogenesis of Proterozoic rocks of the Reading Prong
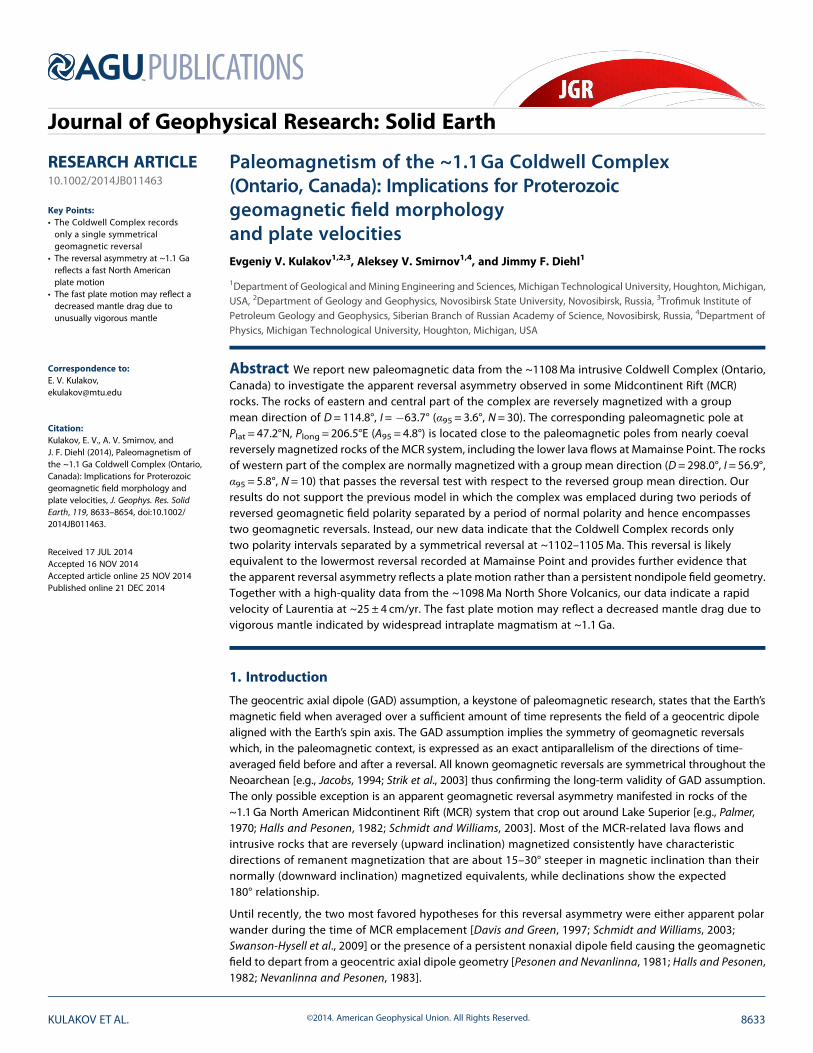
Paleomagnetism of the ~1.1Ga Coldwell Complex(Ontario, Canada): Implications for Proterozoicgeomagnetic field morphologyand plate velocitiesEvgeniy V. Kulakov1,2,3, Aleksey V. Smirnov1,4, and Jimmy F. Diehl1
1Department of Geological and Mining Engineering and Sciences, Michigan Technological University, Houghton, Michigan,USA, 2Department of Geology and Geophysics, Novosibirsk State University, Novosibirsk, Russia, 3Trofimuk Institute ofPetroleum Geology and Geophysics, Siberian Branch of Russian Academy of Science, Novosibirsk, Russia, 4Department ofPhysics, Michigan Technological University, Houghton, Michigan, USA
Abstract We report new paleomagnetic data from the ~1108Ma intrusive Coldwell Complex (Ontario,Canada) to investigate the apparent reversal asymmetry observed in some Midcontinent Rift (MCR)rocks. The rocks of eastern and central part of the complex are reversely magnetized with a groupmean direction of D= 114.8°, I = �63.7° (α95 = 3.6°, N = 30). The corresponding paleomagnetic pole atPlat = 47.2°N, Plong = 206.5°E (A95 = 4.8°) is located close to the paleomagnetic poles from nearly coevalreversely magnetized rocks of the MCR system, including the lower lava flows at Mamainse Point. The rocksof western part of the complex are normally magnetized with a group mean direction (D = 298.0°, I = 56.9°,α95 = 5.8°, N = 10) that passes the reversal test with respect to the reversed group mean direction. Ourresults do not support the previous model in which the complex was emplaced during two periods ofreversed geomagnetic field polarity separated by a period of normal polarity and hence encompassestwo geomagnetic reversals. Instead, our new data indicate that the Coldwell Complex records onlytwo polarity intervals separated by a symmetrical reversal at ~1102–1105Ma. This reversal is likelyequivalent to the lowermost reversal recorded at Mamainse Point and provides further evidence thatthe apparent reversal asymmetry reflects a plate motion rather than a persistent nondipole field geometry.Together with a high-quality data from the ~1098Ma North Shore Volcanics, our data indicate a rapidvelocity of Laurentia at ~25 ± 4 cm/yr. The fast plate motion may reflect a decreased mantle drag due tovigorous mantle indicated by widespread intraplate magmatism at ~1.1 Ga.
1. Introduction
The geocentric axial dipole (GAD) assumption, a keystone of paleomagnetic research, states that the Earth’smagnetic field when averaged over a sufficient amount of time represents the field of a geocentric dipolealigned with the Earth’s spin axis. The GAD assumption implies the symmetry of geomagnetic reversalswhich, in the paleomagnetic context, is expressed as an exact antiparallelism of the directions of time-averaged field before and after a reversal. All known geomagnetic reversals are symmetrical throughout theNeoarchean [e.g., Jacobs, 1994; Strik et al., 2003] thus confirming the long-term validity of GAD assumption.The only possible exception is an apparent geomagnetic reversal asymmetry manifested in rocks of the~1.1 Ga North American Midcontinent Rift (MCR) system that crop out around Lake Superior [e.g., Palmer,1970; Halls and Pesonen, 1982; Schmidt and Williams, 2003]. Most of the MCR-related lava flows andintrusive rocks that are reversely (upward inclination) magnetized consistently have characteristicdirections of remanent magnetization that are about 15–30° steeper in magnetic inclination than theirnormally (downward inclination) magnetized equivalents, while declinations show the expected180° relationship.
Until recently, the two most favored hypotheses for this reversal asymmetry were either apparent polarwander during the time of MCR emplacement [Davis and Green, 1997; Schmidt and Williams, 2003;Swanson-Hysell et al., 2009] or the presence of a persistent nonaxial dipole field causing the geomagneticfield to depart from a geocentric axial dipole geometry [Pesonen and Nevanlinna, 1981; Halls and Pesonen,1982; Nevanlinna and Pesonen, 1983].
KULAKOV ET AL. ©2014. American Geophysical Union. All Rights Reserved. 8633
PUBLICATIONSJournal of Geophysical Research: Solid Earth
RESEARCH ARTICLE10.1002/2014JB011463
Key Points:• The Coldwell Complex recordsonly a single symmetricalgeomagnetic reversal
• The reversal asymmetry at ~1.1 Gareflects a fast North Americanplate motion
• The fast plate motion may reflect adecreased mantle drag due tounusually vigorous mantle
Correspondence to:E. V. Kulakov,[email protected]
Citation:Kulakov, E. V., A. V. Smirnov, andJ. F. Diehl (2014), Paleomagnetism ofthe ~1.1 Ga Coldwell Complex (Ontario,Canada): Implications for Proterozoicgeomagnetic field morphology andplate velocities, J. Geophys. Res. SolidEarth, 119, 8633–8654, doi:10.1002/2014JB011463.
Received 17 JUL 2014Accepted 16 NOV 2014Accepted article online 25 NOV 2014Published online 21 DEC 2014

Unfortunately, direct testing of the reversal asymmetry is impossible because of the lack of known MCRsequences that record transitional field directions between the two stable asymmetric directions. However,there are two MCR locations that presumably record multiple reversals which makes them crucial forevaluating the reversal asymmetry: the Mamainse Point volcanics [Palmer, 1970; Robertson and Fahrig, 1971;Robertson, 1973; Swanson-Hysell et al., 2009] and the intrusive Coldwell Complex [Lewchuk and Symons, 1990],both located in Ontario, Canada.
The basaltic flows of the Mamainse Point sequence record four polarity intervals: lower reversed (MR1),lower normal (MN1), upper reversed (MR2), and upper normal (MN2) [e.g., Robertson, 1973]. A recentpaleomagnetic investigation [Swanson-Hysell et al., 2009] showed a gradual shallowing of inclination fromthe base to the top of the sequence reflecting a North America plate motion toward the equator. The authorsobtained positive reversal tests for all three Mamainse Point reversals and concluded that the reversalasymmetry is a result of an apparent polar wander that appears because other MCR sequences do notcontain any record of the MN1 and MR2 polarity zones. We note, however, that these reversal tests werebased on a limited number of paleomagnetic site mean directions, most likely insufficient to average out thepaleosecular variation of geomagnetic field. Most notably, the test for the lowermost (oldest) MR1→MN1reversal utilized only six directions, one of which was based on only two specimens. If this site mean direction isexcluded, the reversal test becomes indeterminate. Therefore, a possibility of reversal asymmetry remains,warranting additional tests, especially for the MR1→MN1 reversal.
The paleomagnetism of the Coldwell Complex was previously investigated by Lewchuk and Symons [1990]who argued that the complex was emplaced in threemagmatic episodes during two periods of reversed fieldpolarity (CR1 and CR2) separated by a period of normal polarity (CN), hence recording two geomagneticreversals (CR1→CN and CN→CR2). Based on their interpretation of paleomagnetic data, the authorsconcluded that both reversals were symmetrical. They also proposed a model in which the central part ofthe complex represented the latest magmatic episode that followed the emplacement of the normallymagnetized rocks of the western part, a proposition that contradicts the earlier complex emplacementmodels based on the geological field relationships [e.g., Mitchell and Platt, 1978]. However, as we discussbelow, on closer examination, the data presented by Lewchuk and Symons [1990] do not provide anunambiguous answer with respect to the reversal asymmetry and to the relative age of magmatic episodes.This ambiguity motivated our paleomagnetic reinvestigation of the Coldwell Complex presented in thispaper. Below, we report our new paleomagnetic data and discuss their implications for the reversalasymmetry as well as for the geological evolution of the complex.
Figure 1. Location of the Coldwell Complex (CC) and other selected rock sequences of the Midcontinent Rift system: MP,Mamainse Point lava flows; OV, Osler Volcanics; NSV, North Shore Volcanics; MC, Mellen Complex; PMG, Powder MillGroup; PLV; Portage Lake Volcanics; LST, Lake Shore Traps; and BMD, Baraga-Marquette dikes.
Journal of Geophysical Research: Solid Earth 10.1002/2014JB011463
KULAKOV ET AL. ©2014. American Geophysical Union. All Rights Reserved. 8634

2. Geology, Age, and Paleomagnetism of the Coldwell Complex
The multiphase alkaline Coldwell Complex occupies more than 350 km2 on the north shore of Lake Superiornear the town of Marathon (Ontario, Canada) (Figure 1) [e.g., Sage, 1991; Sutcliffe, 1991]. The complex isa subcircular composite intrusion approximately 25 km in diameter that intrudes Archean supracrustal andgranitic rocks of the Schreiber-White Lake subprovince of the Superior province in Canada [e.g., Puskas, 1970;Mitchell and Platt, 1978, 1982; Mitchell et al., 1993].
The eastern part of the complex consists of two main phases, massive gabbro along the eastern rim andthe more abundant ferroaugite syenite [e.g., Currie, 1980] (Figure 2). The central part of the complex ischemically different from its eastern part and is composed primarily of biotite gabbros and nephelinesyenites cut by several diabase dikes [e.g.,Mitchell and Platt, 1982]. A few minor exposures of pillow basaltsare also found in this area. In addition, a sequence of flat-lying basaltic flows crops out in the Coubranand Geordie lakes area [Kulakov et al., 2012] (Figure 2). The western part of the complex is mainlycomposed of quartz syenites, syenites, and granites with large xenoliths of assimilated country rocks.Minor gabbro exposures are also present. The western rock units appear to be intrusive into most otherphases of the complex [Mitchell and Platt, 1978]. No postintrusion metamorphism of the Coldwell rockshas been reported. Postintrusive structures are limited to block faults with minor offsets associatedwith regional uplift [Mitchell and Platt, 1982].
Figure 2. Simplified geology of the Coldwell Complex after Puskas [1967], Platt and Mitchell [1982], and Currie [1980]. Opencircles show the locations of this study sampling sites.
Journal of Geophysical Research: Solid Earth 10.1002/2014JB011463
KULAKOV ET AL. ©2014. American Geophysical Union. All Rights Reserved. 8635

Early geological studies considered the Coldwell Complex as a single intrusion that underwent extensivefractional crystallization of magma [Lilley, 1964; Puskas, 1967]. However, subsequent geochemical,petrological, and field relationship analyses resulted in a model in which the complex was emplaced inthree magmatic episodes separated by quiescent periods as the magma source deepened and migratedto the western side of the complex [e.g., Currie, 1980; Mitchell et al., 1993; Lewchuk and Symons, 1990;Walker et al., 1993]. However, many details of the complex’s geological history such as the extent and orderof the intrusive episodes have been debated [e.g., Currie, 1980; Mitchell and Platt, 1978, 1982; Lewchukand Symons, 1990].
According to Currie [1980], the eastern gabbro and ferroaugite syenites represent the earliest intrusiveepisode (Episode I). In his model, all the remaining rocks of the central and western part were emplacedduring Episode II except for the granites and red syenites that were interpreted as metasomatized roof rock.The syenites on Pic Island were emplaced during the Episode III [Currie, 1980]. Alternatively, Mitchell andPlatt [1982] argued that the western gabbros were also emplaced during Episode I, while Episode II waslimited to the biotite gabbro and the nepheline syenite in the central part. In their model, the syenites, quartzsyenites, and granites of the western part were emplaced during Episode III.
Early geochronological studies of the complex resulted in a wide range of Rb-Sr and K-Ar ages from 1335to 1005Ma, but the emplacement age was generally considered to be between 1070 and 1040Ma [e.g., Belland Blenkinsop, 1980; Platt and Mitchell, 1982], thus implying that the Coldwell Complex magmatismoccurred late in the development of the rift, progressing from tholeiitic to alkaline with time [e.g., Mitchellet al., 1993]. On the other hand, Turek et al. [1985], based on a relatively imprecise U-Pb zircon date of1188 ± 56Ma from nepheline syenite of the central part, suggested that the complex was emplaced muchearlier and experienced a prolonged cooling period in excess of 150Ma. However, the validity of theage determination by Turek et al. [1985] has been contested [Thorpe, 1986].
More recently, in order to determine the emplacement ages of the intrusive centers, Heaman and Machado[1992] conducted a U-Pb zircon/baddeleyite geochronological study of the Coldwell Complex on two samplesof the eastern gabbro, two samples of syenite and nepheline syenite from the central part, and a sampleof granite from the western part. The gabbro samples yielded the most precise dates of 1108 ± 1Maand 1107 + 5/�1Ma. For the nepheline syenite, a discordia line defined a similar upper intercept age of1109 + 8/�4Ma. For the syenite sample, a discordia line was not well defined but the majority of zirconanalyses were consistent with the emplacement age of 1108Ma. The four analyzed zircon fractionsfrom the granite sample yielded 207Pb/206Pb ratios corresponding to model ages between 1103 and1090Ma but did not define a simple discordia line. Although Heaman and Machado [1992] assigned a1107 + 9/�5Ma age to this sample, their data do not rule out a possibility that this sample can be youngerby a few millions of years.
Notwithstanding the deficiencies of their U-Pb analyses, the authors concluded that most of the ColdwellComplex was emplaced into “cold” Archean crust at 1108 ± 1Ma and experienced a relatively rapid (< 3Ma)cooling history [Heaman and Machado, 1992]. This age is similar to the U-Pb ages obtained for severalother early MCR sequences, including the Logan Sills (1109 + 4/�2Ma), a rhyolite porphyry from the base ofthe Osler Volcanic group (1108 + 4/�2Ma) [Davis and Sutcliffe, 1985], and the 1107.3 ± 1.6Ma Powder Millbasalts [Davis and Green, 1997]. Overall, however, the precision of available geochronological data fromthe Coldwell Complex is not sufficient to reliably resolve its emplacement history.
In the absence of reliable radiometric ages, paleomagnetism can provide time constraints on the number andorder of intrusive episodes. The only published paleomagnetic investigation of the Coldwell Complex byLewchuk and Symons [1990] that also incorporated an unpublished paleomagnetic data set obtained in 1972 byWilliam A. Robertson identified three distinct directions (named A, B, and C) of the primary characteristicremanent magnetization (ChRM). The reversed polarity direction A with the mean of D =121.0°, I= �70.9°(α95 =3.3°,N =19) was exclusively observed from the eastern gabbro and ferroaugite syenite. The normal polaritydirection B with the mean of D =301.8°, I=60.1° (α95 =5.8°, N =11) was observed from the western gabbroand syenite. Finally, the reversed polarity direction C with themean ofD =119.1°, I=�54.3° (α95 =5.1°, N =9) wasobtained from the biotite gabbros, nepheline syenites, and syenites of the central part of the complex.
Because the reversed mean directions A and C were statistically different, Lewchuk and Symons [1990]concluded that the three ChRM directions corresponded to three separate intrusive episodes during two
Journal of Geophysical Research: Solid Earth 10.1002/2014JB011463
KULAKOV ET AL. ©2014. American Geophysical Union. All Rights Reserved. 8636

Table 1. Summary of Rock Magnetic Properties of the Coldwell Complex Samplesa
Site Lithology NRM Range (A/m) Hc (mT) Hcr (mT) Mrs/Ms
Center ACLD1 Rhyolite 0.018–0.355 4.77 14.22 0.058CLD3 E. gabbro 0.069–3.211 17.43 33.4 0.210CLD4 E. gabbro 0.074–28.80 7.99 18.44 0.071CLD5 E. gabbro 0.122–1.13 9.43 22.34 0.086CLD6 Aug. syenite 0.104–0.271 8.66 24.65 0.072NMG1 E. gabbro 0.305–45.88 6.38 18.2 0.057SL10 Aug. syenite 0.044–0.184 4.56 11.7 0.059SL14 Aug. syenite 0.0034–0.396 7.17 14.86 0.087SL15 Aug. syenite 0.146–0.643 6.78 16.25 0.072SL33 Basalt 2.305–21.58 14.31 22.59 0.183SL34 Aug. syenite 0.591–36.43 7.32 16.94 0.043SL5-6 E. gabbro 6.12–29.90 13.56 24.4 0.168SL7 E. gabbro 1.621–2.418 7.51 13.07 0.097SL7-8 E. gabbro 0.607–3.06 7.88 29.06 0.091CLD2b E. gabbro 0.0009–0.0019 16.6 23.18 0.252CLD9b Aug. syenite 0.405–0.757 11.43 19.32 0.237SL8b E. gabbro 5.95–10.11 1.39 4.24 0.013NMG2b E. gabbro 0.031–2.586 11.56 27.63 0.110NMG3b E. gabbro 0.36–1.98 3.38 13.25 0.036
Center BCCW1 W. gabbro 0.004–0.098 10.92 13.44 0.131CCW2 Pillowed lava 0.002–0.024 10.23 17.26 0.154CLD7 Mafic dyke 0.005–0.229 4.87 15.89 0.207SL13E Mafic dyke 0.977–13.25 9.92 19.21 0.112SL18 W. gabbro 4.748–30.06 4.93 9.38 0.101SL19 W. gabbro 0.314–2.00 5.05 10.46 0.051SL20 W. gabbro 0.604–59.47 7.33 12.43 0.124SL37 W. gabbro 1.326–33.72 3.44 6.93 0.047SL47 Pillowed lava 0.834–9.591 9.54 23.10 0.154SL49 W. gabbro 6.864–88.68 4.75 28.56 0.025MD1b Gabbro 0.564–7.24 4.51 8.94 0.058MD2b Gabbro 0.03–30.12 3.00 7.84 0.034MD3b Gabbro 6.32–70.01 5.83 13.52 0.019MD4b Gabbro 0.777–2.826 7.45 14.86 0.095SL26b Aug. syenite 0.0001–0.343 10.55 20.83 0.114SL48b Neph. syenite 0.061–1.993 9.43 23.14 0.097
Center CCLD11 Q-tz syenite 0.017–0.04 1.88 5.09 0.016GLG Gabbro 4.787–34.15 6.57 16.29 0.074GLS Q-tz syenite 0.097–0.438 4.36 10.12 0.051GLS1 Q-tz syenite 0.01–0.067 5.18 11.49 0.042CLD8 Neph.syenite 0.102–0.994 2.42 7.45 0.044SL11 Amph. syenite 0.026–1.11 3.94 8.01 0.051SL13 Amph. syenite 0.043–0.391 4.53 13.61 0.099SL14-13 Augite syenite 0.665–5.797 6.99 13.77 0.082SL21 Q-tz syenite 0.059–1.511 8.75 33.2 0.062SL25 Neph. syenite 0.066–0.196 2.18 5.72 0.023SL28 Amph. syenite 0.021–2.724 2.9 13.43 0.026SL32 Diabase lava 0.012–9.104 8.27 17.9 0.145SL41 Amph. syenite 0.025–1.362 2.47 7.13 0.023SL44 Neph. syenite 0.148–3.857 3.57 10.8 0.034SL45 Neph. syenite 0.184–1.59 4.89 16.11 0.053SL46 Neph. syenite 0.081–9.537 1.38 4.91 0.013CLD10b Q-tz syenite 0.012–0.412 10.43 36.4 0.096GLG2b Gabbro 4.291–18.15 7.32 17.26 0.061DM1b Amph. syenite 2.98–96.63 7.55 18.43 0.1045SL23b Q-tz syenite 0.038–0.261 5.58 26.44 0.059SL30b Amph. syenite 0.118–1.012 7.57 16.94 0.108
Journal of Geophysical Research: Solid Earth 10.1002/2014JB011463
KULAKOV ET AL. ©2014. American Geophysical Union. All Rights Reserved. 8637

periods of reversed geomagnetic field polarity (directions A and C) separated by a period of normal fieldpolarity (direction B), hence recording two geomagnetic reversals (CR1→CN1 and CN1→CR2). Despitethe fact that the components A and C mean directions are statistically different, both directions werecombined in constructing the reversal test versus the component B mean direction, which marginally passeswith a “C” classification [McFadden and Lowes, 1981; McFadden and McElhinny, 1990]. Based on this result,the authors concluded that the apparent reversal asymmetry is a result of plate motion rather than theeffect of a long-standing nondipole field. We note, however, that the mean direction for component B wasbased on only five sites, two of which have values of α95 greater than 15°. Eliminating these sites wouldleave only three normal directions, too few to perform a robust reversal test.
Based on their paleomagnetic data, the authors also proposed a model in which the eastern part of thecomplex (intrusive center A) was emplaced first, followed by the intrusion of the western gabbros andnepheline syenite at 1103 ± 5Ma (intrusive center B), and finally by the emplacement of the central part(intrusive center C) at 1095 ± 5Ma. In our paper, we will follow the same naming convention for the intrusivecenters [Lewchuk and Symons, 1990].
3. Results3.1. Sampling
For this study, we collected 504 core samples from 58 sites. Forty-two sites were sampled along theTrans-Canadian Highway 17, seven sites along the side roads north of town of Marathon (sites NMG1-NMG3,SL5-6, SL7, SL7-8, and SL8), four sites near town of Middleton (sites MD1-MD4), four sites north of NeysProvincial Park (sites GLG, GLG2, GLS, and GLS1), and one site taken south of the highway almost directlynorth from the Red Sucker Point Provincial Nature Reserve (site DM1) (Figure 2). All major lithologies of theColdwell Complex except for granites were sampled (Table 1). Our sites SL5-SL33 and CLD1-CLD6 generallyreplicate the sampling localities of Lewchuk and Symons [1990]. However, we did not find any traces of theoriginal sampling which could have been destroyed by widening the highway after 1990. Consequently, atmany sites our samples were taken from fresher road cut outcrops.
3.2. Rock Magnetism
Samples from all sites were examined for their rock magnetic properties (Table 1). Magnetic hysteresisparameters (coercivity, Hc; coercivity of remanence, Hcr; saturation remanence, Mrs; and saturationmagnetization, Ms) were measured using a Model 2900 Princeton Measurement Corporation AlternatingGradient Field Magnetometer. All measured magnetic hysteresis loops have a regular shape and indicate thepresence of a low-to-intermediate coercivity magnetic phase (Figures 3a–3c). Magnetic hysteresis data didnot reveal any signature of magnetically hard phases such as hematite. TheMrs/Ms and Hcr/Hc ratios suggest apseudo-single domain (PSD) and multidomain (MD) magnetic carrier in our samples (Figure 3d) [Day et al.,1977]. The relatively large scatter in the hysteresis data (Figure 3) likely reflects complex mineralogicalcompositions of the Coldwell Complex rocks (for example, the simultaneous presence of different iron oxidesand sulfides). No systematic differences in magnetic hysteresis parameters between different lithologies wereobserved; however, on average, mafic rocks (gabbros, diabase, and basalt) plot closer to the single-domainregion of the Day plot suggesting relatively smaller grain size of magnetic minerals.
Table 1. (continued)
Site Lithology NRM Range (A/m) Hc (mT) Hcr (mT) Mrs/Ms
SL31b Diabase Lava 0.011–0.632 10.86 18.6 0.156SL40b Q-tz syenite 0.031–0.781 3.72 9.51 0.039
aNRM, natural remanent magnetization; Hc, coercivity; Hcr, coercivity of remanence; Mrs, saturation remanence;and Ms, saturation magnetization.
bSites rejected from paleomagnetic mean calculation.
Journal of Geophysical Research: Solid Earth 10.1002/2014JB011463
KULAKOV ET AL. ©2014. American Geophysical Union. All Rights Reserved. 8638

Temperature dependences of low-field magnetic susceptibility, κ(T), were measured upon cycling thesamples from room temperature to 700°C (in argon) using an AGICO MFK-1FA magnetic susceptibility meterequipped with a high-temperature furnace and a cryostat. The κ(T) curves were also measured upon heatingfrom �192°C to room temperature before and after the high-temperature thermomagnetic runs. Severaltypes of thermomagnetic κ(T) curves were observed. Most gabbros from both eastern and western partof the complex yielded (nearly) reversible thermomagnetic curves, revealing the presence of a singlemagnetic phase with a Curie temperature between 570 and 585°C, suggesting magnetite or low-Tititanomagnetite as a magnetic remanence carrier (Figures 4a and 4b). A characteristic peak observedat �153°C, associated with the Verwey transition [Verwey, 1939], further indicates that the magnetite is nearlystoichiometric (Figures 4a and 4b). For some gabbro samples, the κ(T) curves also suggest the presence of amagnetic phase with Curie temperature at ~670°C, most likely hematite. These curves are slightly less reversiblemost likely due to reduction of hematite into a cubic ferromagnetic phase (similar to magnetite) uponheating, in argon.
Samples of ferroaugite syenite from the eastern part of the complex yielded irreversible κ(T) curves (Figure 4d).The Verwey transition seen on the low-temperature κ(T) curves measured before high-temperature runstogether with the observed Curie temperatures near 590°C indicates magnetite as the dominant magneticcarrier in these rocks. However, many of these samples also showed a inflection on the heating κ(T) legat ~330°C indicating the presence of another magnetic phase which we interpreted as monoclinic pyrrhotite.The κ(T ) irreversibility for ferroaugite syenite samples is likely caused by heating-induced conversion ofpyrrhotite into magnetite [e.g., Dekkers, 1990; Bina and Daly, 1994] which is supported by an ~50% increasein susceptibility at room temperature and stronger Verwey transitions observed after high-temperatureruns (Figure 4d).
Figure 3. Magnetic hysteresis properties measured from the Coldwell Complex rocks. (a–c) Typical magnetic hysteresisloops after paramagnetic slope correction. (d) Day plot [Day et al., 1977]; solid (open) symbols indicate samples fromsites that yielded (failed to provide) acceptable paleomagnetic data. Abbreviations are the following: SD, single domain;PSD, pseudo-single domain; MD, multidomain;Mrs, saturation remanence;Ms, saturationmagnetization; Hc, coercivity field;and Hcr, coercivity of remanence. Grey lines show SD-MD mixture models from Dunlop [2002].
Journal of Geophysical Research: Solid Earth 10.1002/2014JB011463
KULAKOV ET AL. ©2014. American Geophysical Union. All Rights Reserved. 8639

Amphibole syenites and quartz syenites from the central part of the complex yielded nearly reversible κ(T )curves (Figures 4c and 4f) similar to those of gabbros, also suggesting magnetite as the principal magneticcarrier. However, more pronounced Verwey transitions and less pronounced Hopkinson peaks in syenitesamples suggest larger multidomain magnetite [e.g., Dunlop, 1974] which is generally consistent withthemagnetic hysteresis data. Some κ(T ) curves showed a bump at ~300–350°C on the heating κ(T ) leg whichdisappeared on the cooling κ(T) leg. Such a behavior may represent temperature-induced unmixing ofhomogeneous titanomagnetite grains into a high-Ti and magnetite (low-Ti) phases [e.g., Smirnov et al., 2005]or be a result of relaxation of stress-related pinning of magnetic domain walls by heating [e.g., Kosterovand Prévot, 1998]. In addition, in many of these samples, a magnetic phase with Curie temperatures above600°C was observed (e.g., Figure 4f). We interpret this phase as hematite and/or titanohematite.
The heating κ(T ) leg measured from a sample of pillow lava (CCW2, Center B) (Figure 4e) indicates thepresence of two magnetic phases with Curie temperatures of ~590–600°C and ~700°C, but only the formerphase is observed on the cooling leg. The low-temperature κ(T ) curve of this sample measured beforethe high-temperature run has an inflection point at ~�160°C, suggesting that the ~590–600°C phase may becation-deficient (oxidized) magnetite. The other phase can be either hematite formed by conversion ofcation-deficient magnetite or maghemite, which is reduced to nearly magnetite composition by heating inargon. This interpretation is consistent with no significant change of magnetic susceptibility observed atroom temperature and a more pronounced Verwey transition peak on the low-temperature κ(T) curvemeasured after the high-temperature measurement (Figure 4e).
In addition to the rock magnetic investigation, we examined the opaque mineralogy of several representativesamples on polished samples using a Philips XL40 environmental scanning electron microscope equippedwith an energy dispersive spectra (EDS) detector. Backscattered electron imaging was used to identify oxidegrains. The composition of the oxide grains was determined by means of energy dispersive spectrometry. Thespectra were measured at a 15 kV accelerating voltage, which is optimal for excitation of the Fe K shell.
Most of the identified oxide minerals in both gabbros and syenites were relatively large (several hundreds ofmicrons to >1mm) grains, containing one or several subordinate sets of trellis- or sandwich-type lamellae[Haggerty, 1991] (Figures 5a, 5b, and 5d–5h). The EDS analyses showed that the bright areas separatedby lamellae in the oxide grains represent an iron oxide phase with a very low titanium content (Figure 5j).The composition of the darker phase (lamellae) are consistent with nearly ilmenite or ulvospinel composition
Figure 4. Typical dependence of low-field magnetic susceptibility (κ) versus temperature for Centers (a, d) A, (b, e) B, and(c, f) C. The arrows show the direction of temperature change during high-temperature runs (heating or cooling). The lithologiesshown are gabbro (Figures 4a and 4b), amphibole syenite (Figure 4c), augite syenite (Figure 4d), basalt (Figure 4e), andquartz syenite (Figure 4f).
Journal of Geophysical Research: Solid Earth 10.1002/2014JB011463
KULAKOV ET AL. ©2014. American Geophysical Union. All Rights Reserved. 8640

(Figure 5k). In some grains, ilmenite was partially (<5% of the total volume) replaced with sphene. We note thatan exact measurement of the iron and titanium content was not possible because of the relatively largeinteraction volume of the electron beam (~2μm). As a result, the EDS for both Fe-rich and Ti-rich phases mayinclude a “contamination signal” from the surrounding and/or underlying regions of the opposite phase. Inaddition to the heterophase Fe-Ti oxides, some samples contained homogeneous grains (Figures 5a, 5c, and 5i).The EDS analyses indicate an iron sulfide composition of these grains (Figure 5l) consistent with the presence ofpyrrhotite in ferroaugite syenites of Center A suggested by thermomagnetic analyses. Overall, rock magneticanalyses and interpretations are consistent with the results of electron microscopy.
3.3. Paleomagnetic Results
Magnetic remanence was measured with a 2G Enterprises 760-R superconducting rock magnetometerequipped with an alternating field (AF) demagnetizing unit. After measurement of a natural remanentmagnetization (NRM), thermal and AF demagnetization experiments were performed on sister specimensprepared from each core sample. Thermal demagnetization was performed in an inert (nitrogen) atmosphereusing an ASC TD-48SC thermal specimen demagnetizer. Progressive demagnetization (typically, 12–15 steps)
Figure 5. (a–i) Backscattered electron images of typical magnetic grains (lighter areas) of the representative ColdwellComplex samples from Centers (a–c) A, (d–f ) B, and (g–i) C. Site CLD4 (gabbro), the lightest area in the center and topcorrespond to an iron sulfide phase (Figure 5a); Site SL15 (augite syenite) (Figures 5b and 5c); Site SL18 (gabbro)(Figures 5d and 5e); Site SL48 (nepheline syenite) (Figure 5f ); Site GLG2 (gabbro) (Figure 5g); Site SL28 (amphibolesyenite) (Figures 5h and 5i). Typical energy dispersive spectra from the (j) low-Ti and (k) high-Ti phases, interpreted asmagnetite and ilmenite, respectively (see text). (l) Typical energy dispersive spectrum from an iron sulfide phase.
Journal of Geophysical Research: Solid Earth 10.1002/2014JB011463
KULAKOV ET AL. ©2014. American Geophysical Union. All Rights Reserved. 8641

was carried out until the magnetic intensity of the specimens fell below noise level or until the measuredremanence directions became erratic and unstable.
Nearly all measured samples manifested a two-component NRM (Figure 6). A low-coercivity/temperaturecomponent with variable directions was removed by heating to 250–300°C or by a 10–15 mT alternatingfield. The characteristic remanent magnetization (ChRM) component was identified by straight lineardemagnetization trajectory toward the origin on a vector endpoint diagram.
The ChRM was typically demagnetized (to less than 5% of its initial value) by 575–590°C or by 60–70 mT. TheChRM directions were calculated using principal component analysis [Kirschvink, 1980]. The best fit linewas used if it was defined by at least five consecutive demagnetization steps that trended toward the originand had a maximum angle of deviation less than 10°.
For the majority of samples, the ChRM directions based on AF and thermal demagnetization werestatistically indistinguishable and were averaged for further calculations (Tables 2). For 15 sites, onlyone of the demagnetization methods provided meaningful results (Table 2). The site mean and groupmean paleomagnetic directions were calculated using Fisher statistics [Fisher, 1953]. A site mean wasaccepted if the direction was obtained from three or more samples and the 95% confidence circle (α95)was not greater than 15°. Directional data from 40 sites met these acceptance criteria. For six of therejected sites, all measured specimens showed erratic demagnetization trajectories of NRM on the vectorendpoint diagram. Data from additional 11 sites were rejected due to a large scatter of the ChRM directionsof individual samples (i.e., α95> 15°) or an insufficient number of successful samples per site (N < 3)(Table 2). The remaining rejected site mean direction for site CLD9 indicated remagnetization by thepresent-day geomagnetic field (Table 2).
Figure 6. Examples of vector endpoint diagrams for the Coldwell Complex samples (open symbols are data pointsprojections on vertical plane; solid symbols are projections on horizontal plane). Lithologies shown are (a, b) gabbro, (c)augite syenite, (d) basalt, (e, f ) gabbro, (g) amphibole syenite, (h) quartz syenite, and (i) nepheline syenite.
Journal of Geophysical Research: Solid Earth 10.1002/2014JB011463
KULAKOV ET AL. ©2014. American Geophysical Union. All Rights Reserved. 8642

Table 2. Summary of Paleomagnetic Results From the Coldwell Complexa
Site ID λs, °N Φs, °E N(n) B(b) Method D (°) I (°) α95 (°) k λp, °N Φp, °E
Center ACLD1 48.713 �86.322 3(7) AF + T 116.0 �61.5 7.4 187 46.2 200.6CLD3 48.719 �86.673 8(9) AF + T 125.7 �73.8 8.6 37 57.5 224.3CLD4 48.727 �86.328 14(17) AF + T 103.7 �66.4 4.4 76 42.0 214.4CLD5 48.729 �86.329 7(11) AF + T 116.9 �73.3 4.4 76 52.9 224.1CLD6 48.742 �86.334 9(10) AF + T 106.3 �67.2 8.5 34 44.0 214.5NMG1 48.847 �86.484 9(10) AF + T 99.1 �51.9 12.3 32 29.5 200.4SL10 48.768 �86.374 5(6) AF + T 118.5 �70.7 6.4 114 52.8 217.2SL14 48.780 �86.420 6(11) AF + T 125.5 �49.2 11.0 32 45.1 179.7SL15 48.773 �86.393 5(12) T 118.4 �68.5 11.0 43 51.7 212.2SL33 48.785 �86.428 8(9) AF + T 118.6 �66.7 3.9 174 50.9 208.3SL34 48.726 �86.327 4(7) AF + T 138.5 �75.6 9.1 73 63.4 231.1SL5-6 48.732 �86.330 8(8) AF + T 98.0 �63.5 6.7 61 36.7 213.0SL7 48.756 �86.310 5(6) AF + T 113.7 �68.8 6.6 110 49.2 214.6SL7-8 48.755 �86.311 4(6) AF 127.4 �62.4 11.0 52 54.0 196.0
Mean 14(19) 115.1 �66.1 4.4 82 48.9 209.8A95 = 6.0 K = 45
CLD2b 48.708 �86.303 0 (13) AF + T - - - -CLD9b 48.768 �86.373 3(12) AF + T 351.6 63.4 13.6 55SL8b 48.754 �86.310 0(7) AF + T - - - -NMG2b 48.800 �86.314 8(8) AF + T 129.4 �48.1 35.2 2.7NMG3b 48.787 �86.316 7(8) AF + T 171.6 �44.0 58.4 1.7
Center BCCW1 48.814 �86.673 5(11) T 267.0 53.2 14.3 23 22.9 209.0CCW2 48.817 �86.684 8(11) AF + T 293.3 51.0 5.9 77 38.1 190.1CLD7 48.770 �86.549 4(12) AF 318.0 57.3 9.3 73 58.1 179.6SL13Ec 48.796 �86.453 8(8) T 303.5 62.6 4.8 120 51.6 198.3SL18 48.799 �86.651 6(8) AF + T 299.2 49.8 6.0 107 41.3 184.8SL19 48.796 �86.646 5(7) AF + T 295.5 58.5 10.0 46 44.1 196.7SL20 48.800 �86.636 6(8) AF + T 308.2 59.3 14.0 21 52.8 189.9SL37 48.802 �86.626 6(8) T 321.3 54.4 4.9 154 58.5 171.9SL47 48.817 �86.682 7(8) AF 287.7 58.7 10.8 28 39.2 201.5SL49 48.797 �86.651 6(8) AF 289.6 55.1 5.2 142 38.2 196.5
Mean w/o SL13E 9(15) 297.5 56.3 6.4 66Mean 10(16) 298.0 56.9 5.8 70 44.9 193.2
A95 = 8.0 K = 37MD1b 48.798 �86.654 8(8) AF + T 3.5 0.2 62.8 1.5MD2b 48.797 �86.656 12(15) AF + T 313.3 8.4 43.3 1.6MD3b 48.795 �86.658 9(12) AF + T 54.2 �43.5 53.2 1.7MD4b 48.792 �86.661 3(12) AF + T 349.0 12.2 84.5 1.7SL26b 48.807 �86.662 0(12) AF + T - - - -SL48b 48.798 �86.640 4(8) AF + T 316.3 27.9 27.7 9
Center CCLD11 48.784 �86.596 4(7) AF 129.4 �49.2 7.7 107 47.9 176.7GLS 48.824 �86.485 5(5) AF + T 92.1 �57.2 14.9 23 28.7 209.3GLG 48.821 �86.485 4(6) AF + T 131.5 �43.8 8.4 90 46.0 229.8GLS2 48.824 �86.485 3(4) AF 110.2 �49.6 7.9 162 35.3 191.2CLD8 48.765 �86.525 3(6) AF 131.2 �64.5 6.3 258.7 44.0 214.5SL11 48.792 �86.487 5(10) AF + T 77.1 �68.9 4.8 205 30.4 229.9SL13 48.793 �86.463 6(6) AF + T 120.4 �60.5 4.4 191 48.4 196.7SL14-13 48.779 �86.420 8(9) AF + T 89.8 �69.1 3.1 284 36.6 224.5SL21 48.789 �86.611 6(8) AF + T 120.7 �57.5 7.0 77 46.8 192.2SL25 48.793 �86.501 4(6) AF 110.6 �57.0 1.7 2315 40.0 198.0SL28 48.802 �86.626 6(12) AF + T 118.6 �45.4 7.7 64 38.4 181.7SL32 48.795 �86.495 8(8) AF + T 99.4 �75.2 6.4 67 45.7 232.2SL41 48.797 �86.445 6(8) AF 132.2 �67.9 8.3 56 59.7 206.0SL44 48.764 �86.526 3(9) AF + T 114.0 �59.7 7.5 56 43.8 199.3SL45 48.772 �86.513 8(10) AF 108.5 �69.7 9.1 38 46.8 218.0SL46 48.795 �86.497 3(9) AF 114.1 �76.3 5.9 292 52.6 232.3
Journal of Geophysical Research: Solid Earth 10.1002/2014JB011463
KULAKOV ET AL. ©2014. American Geophysical Union. All Rights Reserved. 8643

The accepted site mean directions were grouped according to the classification of intrusive centersused by Lewchuk and Symons [1990]. Fourteen (out of 19 sampled) sites collected from rocks of Center A(eastern gabbro and ferrosyenite) yielded well-defined reversed ChRM directions with a group meandirection of D = 115.1°, I=�66.1° (α95 = 4.4°, k= 82) (Figure 7a and Table 2). The corresponding mean virtualgeomagnetic pole (VGP) is located at Plat = 48.9°N, Plong = 209.8°E (A95 = 6.0°, K = 45) (Pole CCA, Figure 8aand Table 2).
Nine of 15 sampled sites from Center B yielded well-defined normal polarity site mean directions with agroup mean of D = 297.5°, I = 56.3° (α95 = 6.4°, k = 66) (Table 2). In addition, site SL13E representing athin mafic dyke cutting through syenite in the central part of the complex resulted in a normal polarityChRM direction (D = 303.5°, I = 62.6°, α95 = 4.8°). Accordingly, the SL13E direction has been included incalculation of the group mean direction for Center B (D = 298.0°, I = 56.9°, α95 = 5.8°, k = 70, N = 10)(Figure 7b and Table 2). The corresponding mean VGP is located at Plat = 44.9°N, Plong = 193.2°E (A95 = 8.0°,K = 37) (Pole CCn, Figure 8b and Table 2).
We note that while the accepted site mean directions for Center B pass the test for Fisher distribution[Fisher et al., 1987], one of the sites (CCW1) has a more westerly declination and plots away from the rest ofsite mean directions (Figure 7b). This site has the largest α95 = 14.3°. If this direction is excluded, the newgroupmean does not significantly change (D = 301.7°, I = 56.8°, α95 = 5.0°, k= 108, N= 9) with the pole locatedat Plat = 47.2°N, Plong = 190.9°E (A95 = 6.7°, K = 60). Our preferred explanation is that the deviation of theCCW1 direction from the rest of the group is due to paleosecular variation. Therefore, in our further analysis,we use the group mean direction calculated from all 10 sites.
Sixteen site mean directions (of 23 sampled sites) of Center C yielded reversed polarity ChRM directionswith a group mean direction of D =114.6°, I= �61.6° (α95 = 5.8°, k = 42) (Figure 7c) and the correspondingmean VGP position located at Plat = 45.6°N, Plong = 203.7°E (A95 = 7.6°, K = 24) (Pole CCC, Figure 8a andTable 2). The group mean directions from Centers A and C are statistically indistinguishable (the group meandirection from Center C plots within the other direction α95 [e.g., Fisher et al., 1987]) and were combinedresulting in a group mean direction of D = 114.8°, I=�63.7° (α95 = 3.6°, k= 54, N=30) (Figure 7d and Table 2).The corresponding mean VGP position is located at Plat = 47.2°N, Plong = 206.5°E (A95 = 4.8°, K =31) (Pole CCr,Figure 8 and Table 2).
In order to evaluate the symmetry of normal and reversed group mean directions recorded by rocks of theColdwell Complex, we used the reversal test of McFadden and McElhinny [1990]. In this test, information
Table 2. (continued)
Site ID λs, °N Φs, °E N(n) B(b) Method D (°) I (°) α95 (°) k λp, °N Φp, °E
Mean 16(23) 114.6 �61.6 5.8 42 45.6 203.7A95 = 7.6 K = 24
GLG2b 48.824 �86.485 0(6) AF + T - - - -CLD10b 48.780 �86.581 6(8) AF + T 262.8 �66.7 58.8 1.8DM1b 48.789 �86.480 13(13) AF + T 208.3 �28.1 51.3 1.5SL23b 48.772 �86.556 2(8) AF + T - - - -SL30b 48.794 �86.489 0(7) AF + T - - - -SL31b 48.792 �86.491 2(8) AF + T - - - -SL40b 48.792 �86.468 0(8) AF + T - - - -
Centers A and C CombinedMean 30(42) 114.8 �63.7 3.6 54 47.2 206.5
A95 = 4.8 K = 31
aThe site latitude and longitude are λs and Φs, N is the number of samples used to calculate the site mean declination(D) and inclination (I); n is the number of measured samples per site; α95 and k are the 95% confidence circle and theconcentration parameter for paleomagnetic directions [Fisher, 1953]. B is the number of sites used for a between-sitegroup mean direction; b is the total number of sites sampled per magmatic episode. The column “Method” indicatesthe demagnetization method used to obtain the site mean directions: alternating field (AF), thermal (T), or combined(AF + T) (see text). The latitude and longitude of the virtual geomagnetic pole (VGP) are λp andΦp. A95 and K are the 95%confidence circle and the concentration parameter for VGP distribution.
bPaleomagnetic data not included into paleomagnetic analysis.cThis site is located within the central part of the Coldwell Complex (see text).
Journal of Geophysical Research: Solid Earth 10.1002/2014JB011463
KULAKOV ET AL. ©2014. American Geophysical Union. All Rights Reserved. 8644

about the angular dispersion of the two distributions being compared is used to calculate the criticalangle γc between the means of each set of observations at which the null hypothesis that the data share acommon mean would be rejected at 95% confidence. If the angle between the two means is less thanthe critical angle, the test is positive. McFadden and McElhinny [1990] proposed a simple classificationof a positive reversal test: classification A if γc ≤ 5°, B if 5°< γc ≤ 10°, C if 10°< γc ≤ 20°, and “Indeterminate”if γc > 20°.
Figure 7. (a–c) Paleomagnetic results from Centers A, B, and C of the Coldwell Compex, respectively. Equal area plots showthe accepted paleomagnetic site mean directions (grey circles) and their group mean direction with the 95% confidencecircle (α95). Filled and open circles correspond to normal and reversed polarity, respectively. (d) Combined site meandirections (grey circles) for Centers A and C and their group mean (open circle) with the 95% confidence circle. (e) Thegroupmeans for normal (Center B, solid circle) and reversed (Centers A and C, open circle) polarity direction obtained in thisstudy. The grey circle shows the direction exactly symmetrical to the reversed direction. (f ) Comparison of the results of thisstudy with the results by Lewchuk and Symons [1990]. Open and solid triangles show their group mean directions forCenters A and C and for Center B, respectively. The open and solid circles are the same as in Figure 7e.
Journal of Geophysical Research: Solid Earth 10.1002/2014JB011463
KULAKOV ET AL. ©2014. American Geophysical Union. All Rights Reserved. 8645

The reversed site mean directionscalculated for Centers A and C pass thereversal test with respect to the normalsite mean direction of Center B withclassification B (γc =9.3°) and A (γc=5.0°), respectively. The combineddirection from Centers A and C passesthe reversal test against the Center Bdirection with classification B (γc =7.0°).
4. Discussion4.1. Do the Coldwell Complex RocksFaithfully Record the Earth’sMagnetic Field Direction?
The results of our rock magneticanalyses do not reveal any obviouscorrelation of the magneticcharacteristics of our samples withtheir ability to preserve primarypaleomagnetic directions or with thequality of paleomagnetic data(Figures 3 and 4 and Table 1).However, we note that eight of 18sites that failed to yield acceptablepaleomagnetic data were collectedfrom natural outcrops affected byweathering, while all the successfulsites were sampled from fresh roadcut exposures.
The primary origin of characteristicremanent magnetization of theaccepted sites is supported by thepositive reversal tests between thenormal and reversed directions and bythe statistical similarity of ChRM
directions recorded by different lithologies within each intrusive center. Furthermore, the positive reversaltests suggest that the group mean paleomagnetic directions for each center are not significantly biasedby insufficient sampling of the paleosecular variation.
To further evaluate whether our paleomagnetic data represent the time-averaged geomagnetic field, wecalculated the angular dispersion (S) of virtual geomagnetic poles (VGP) for each center:
S2 ¼ 1N � 1
XN
i¼1
Δ2i ;
where N is the number of individual VGPs and Δi is the angle between the ith VGP and the group mean pole.The dispersion values were corrected for within-site dispersion (Sw) related to intrinsic variation andexperimental uncertainty using:
S2b ¼ S2 � S2w=n;
where Sb is the true (between-site) dispersion and n is the average number of samples per site [Doell, 1970].
The confidence interval of Sb were estimated using the N-1 jackknife method [Efron, 1982]. The calculatedvalues, Sb_A =13.2 ± 5.2° (N=14), Sb_B = 12.1 ± 5.5° (N= 10), and Sb_C = 15.9 ± 3.6° (N= 16) are in a good
Figure 8. (a) Group mean virtual geomagnetic poles for Centers A (CCA)and C (CCC) of the Coldwell Complex (open circles) and their 95%confidence circles (A95). Star shows the paleomagnetic pole (CCr)calculated from combined site mean directions of Centers A and C(see text). (b) Selected paleomagnetic and mean VGP poles from theMidcontinent Rift sequences (see text). The open/solid symbolscorrespond to the reversed/normal polarity of paleomagnetic directions.The open and closed stars show the CCr pole and the mean VGP pole(CCn) from the normally magnetized rocks of Center B (this study).Diamond shows the mean VGP pole calculated for the lower reversedsection (MPlr), the lower normal section (MPLn), the upper reversedsection (MPUr), and the upper normal (MPUn) section of the MamainsePoint lava flow sequence [Swanson-Hysell et al., 2009]. The other polesare from the Powder Mill basalts (PM) [Palmer and Halls, 1986], the Lowerand Upper Osler Volcanics (OSr and OSn) [Halls, 1974], the Lower NorthShore Volcanics (NS) [Halls and Pesonen, 1982], the Marquette dikeswarm (MQ) [Pesonen and Halls, 1979], the Portage Lake Volcanics (PLV)[Halls and Pesonen, 1982], the Lake Shore Traps (LST) [Kulakov et al.,2013], and the Michipicoten Island flows (MI) [Palmer and Davis, 1987].
Journal of Geophysical Research: Solid Earth 10.1002/2014JB011463
KULAKOV ET AL. ©2014. American Geophysical Union. All Rights Reserved. 8646

agreement with the VGP angular dispersion (9.0°–14.6°) reported from other Keweenawan rock sequences[e.g., Halls and Pesonen, 1982] and are statistically similar to the mean value of S ≈ 14.0° (for paleolatitudeof 45°) calculated for the 1.0–2.2 Ga interval [Smirnov et al., 2011]. We note that if site CCW1 is excluded,then the angular dispersion for Center B is lowered: Sb_B = 9.1 ± 4.8° (N = 9). Given the relatively smallnumber of site mean directions (N = 10), the data set from Center B may not entirely represent thetime-averaged field.
We note that some of the site mean directions used to calculate S may represent the same vector ofgeomagnetic field (if the corresponding sites cooled through their magnetization blocking temperatureswithin a few years from each other). Although such a scenario is unlikely taking into account relativelyslow cooling of the complex, if true, our estimates would represent the lower limit of S. On the other hand,there is no evidence of extensive faulting and/or significant relative block rotations which could haveresulted in an artificial increase of S. Overall, we feel that the general similarity of our angular dispersionestimates to those obtained from other MCR rocks indicates that our paleomagnetic data adequatelyrepresent the paleosecular variation of geomagnetic field.
As for most large-scale intrusions, it is difficult to gauge the structural attitude of the Coldwell Complexrock units which naturally raises the question whether our paleomagnetic results could have been affectedby potential large-scale relative movements between the different rock units or rotation of the entirecomplex. However, significant interblock movements can be ruled out by the positive reversal tests as well asby the statistical similarity of the paleomagnetic directions obtained from different lithological units. Thepossibility of a significant tilting of the entire complex can also be ruled out as the basaltic lava flows ofthe Giordie-Coubran Lake are basically flat lying [Kulakov et al., 2012]. Large-scale tilt or rotation is alsoinconsistent with the observed similarity of the Coldwell Complex paleomagnetic directions with thedirections from other MCR rock units (see section 4.3). Overall, based on the observations described above,we feel confident that the obtained ChRM directions faithfully represent the Earth’s magnetic field that existedduring the initial cooling of the complex.
4.2. Comparison With the Results by Lewchuk and Symons [1990]
The groupmean direction for Center B reported in this paper is similar to the direction reported by Lewchuk andSymons [1990] (Figure 7f and Table 3). In contrast, the groupmean directions for Centers A and C obtained in theprior study have significantly steeper and shallower inclinations, respectively, when compared to our groupmean directions for these centers or to their combined direction (Figure 7f and Table 3).
This difference, we suggest, is probably the direct result of the laboratory techniques used by the two studies todetermine a sample’s ChRM. Specifically, Lewchuk and Symons [1990] chose two pilot samples from each site in
Table 3. Comparison of Paleomagnetic Results of This Study With the Results by Lewchuk and Symons [1990]a
N D (°) I (°) k α95 (°) Φp (°E) λp, (°N) A95 (°) or δp/δm (°)
Center A This study 14 115.1 �66.1 89 4.4 209.8 48.9 6.0LS90 only 11 117.8 �71.1 132 4.0 218.2 52.6 6.1/7.0Robertson 8 125.3 �70.6 7.6 6.4 215.1 56.2 9.6/11.1LS90 + R 19 121.0 �70.9 104 3.3 217.0 54.2 5.0/5.7
Center B This study 10 298.0 56.9 70 5.8 193.2 44.9 8.0LS90 only 5 313.3 65.3 47.3 11.3 198.5 59.6 14.8/18.3Robertson 6 264.5 55.2 193.5 5.9 41.4 6.0 8.4LS90 + R 11 301.8 60.1 49 5.8 195.1 49.1 7.5/10.0
Center C This study 16 114.5 �61.6 48 5.8 203.7 45.6 7.6LS90 only 9 119.1 �54.3 101 5.1 189.6 43.3 5.0/7.1Robertson 6 114.6 �70.5 91 7.1 217.7 50.6 11.0LS90 + R 15 117.9 �60.7 50.3 5.4 202.7b 45.3b 45b
aN, number of sites; D and I are magnetic declination and inclination, respectively; α95 and k are the 95% confidencecircle and the concentration parameter for paleomagnetic directions [Fisher, 1953]; λp and Φp are the latitude andlongitude of the mean virtual geomagnetic pole (VGP). A95 and K are the 95% confidence circle and the concentrationparameter for VGP distribution. LS90, Lewchuk and Symons [1990 data]; R, W. A. Robertson’s unpublished data (cited inLewchuk and Symons [1990]).
bDue to absence of the precise coordinates of sampling sites in the prior studies, the pole was calculated as a mean ofLS90 and R mean paleopoles.
Journal of Geophysical Research: Solid Earth 10.1002/2014JB011463
KULAKOV ET AL. ©2014. American Geophysical Union. All Rights Reserved. 8647

their study to be completely demagnetized using either AF or thermal methods, and from that data they chosethree to four demagnetization steps to demagnetize the rest of the samples from that particular site. A similardemagnetization strategy was used by W. A. Robertson whose unpublished data for the Coldwell Complex wasincluded in the Lewchuk and Symons’ paper [Lewchuk and Symons, 1990, Table 2]. This methodology was aperfectly acceptable technique at the time when the authors submitted their manuscript for publication.However, our experience with the rocks from the Coldwell Complex (based in part on Lewchuk and Symons’paper) is that each sample from a given site must be completely demagnetized to adequately define thesample’s ChRM before calculating a site mean. This is the experimental approach most paleomagneticlaboratories are currently using. Therefore, we propose that the “semiblanket” demagnetization approachby Lewchuk and Symons [1990] based on pilot sample behavior may have resulted in an unremovednormal polarity secondary overprints. If correct, this would cause reversely magnetized rocks to havesteeper negative inclinations and normally magnetized rock to shallower positive inclinations in a fashionfirst proposed by Palmer [1970] for the cause of asymmetrical reversals observed in Keweenawan rocks.Inspection of Table 3 supports the above hypothesis as it shows that our means for the reverselymagnetized Centers A and C rocks are shallower than the combined means for the same centers publishedby Lewchuk and Symons [1990]. Additionally, partial removal of a secondary overprint may also explainthe large α95 observed for some sites in the prior study. Furthermore, Lewchuk and Symons [1990] useChRMs calculated from all specimens cut from an oriented core or hand sample as independentlyoriented samples. By doing so, they artificially reduce the size of the 95% confidence circle (α95) of thesite. In addition, counting all the specimen directions independently may have increased the statisticalweight to nonrepresentative directions, thus biasing the calculated group mean directions.
We further note that Lewchuk and Symons [1990] reported a normal polarity direction B (D = 300°, I = 57°)from their site (“13”) designated as quartz syenite in the central part of the complex, while we obtainedan almost antipodal direction (D =120.4°, I= �60.5°) from the same location (our site SL13). The reasonfor this discrepancy is unknown, but it is worth noting that both sites (13 and SL13) are in a close proximity toour site SL13E (a mafic dike that cuts through the syenite) that yielded a normal polarity direction (D = 303.5°,I = 62.6°). So the Lewchuk and Symons’ site 13 may be equivalent to our site SL13E and if so should havebeen included to the group mean calculation for component B. However, in the prior study, this directionwas inverted to the reversed polarity and included in the population of reversely magnetized site meanswith direction C.
4.3. Implications for the Coldwell Complex Evolution
Lewchuk and Symons [1990] used the asymmetry between their directions A and C to propose a model inwhich the eastern part of the complex (Center A) was emplaced first during a reversed polarity period,followed by emplacement of the western part (Center B) during a normal polarity period, and finally byemplacement of the central part (Center C) during the next (younger) reversed polarity period. We note thatthis model differs from the prior models based on geological data that suggested a monotonic westwardage progression of the intrusive centers [e.g., Mitchell and Platt, 1977 Mitchell and Platt, 1978; Currie, 1980;Mitchell et al., 1993; Walker et al., 1993]. In particular, their model is inconsistent with the observation that thewestern rock units appear to be intrusive into most other phases of the complex [Mitchell and Platt, 1978].
The statistical similarity of the group mean directions for Centers A and C established in our study does notsupport the Lewchuk and Symons [1990] model but instead indicates that both centers were emplaced in asingle or several magmatic pulses within the same period of a reversed geomagnetic polarity around~1108Ma. This interpretation is supported by the proximity of the paleomagnetic pole calculated from thecombined reversedmean direction to the pole positions calculated from other reversely magnetized volcanicsequences representing the early stage of MCR development including the 1107.3 ± 1.6Ma Powder Millbasalts [Palmer and Halls, 1986], the 1107 + 4/�2Ma Lower Osler Volcanics [Halls, 1974], and the 1107.9± 1.8Ma Lower North Shore Volcanics [Books, 1972; Palmer, 1970; Halls and Pesonen, 1982] (Figure 8). Theconcordance of our paleopole to the poles for rocks of similar age found elsewhere around Lake Superiorprovides an additional support that the Coldwell Complex did not experience significant tilt or rotationafter its emplacement. We note that a paleomagnetic pole calculated for the 1108± 1Ma intrusive center A(Plat = 54.2°N, Plong = 217.0°E, A95 = 5.4°) by Lewchuk and Symons [1990] plots farther away from the group ofthe early MCR poles (Table 4).
Journal of Geophysical Research: Solid Earth 10.1002/2014JB011463
KULAKOV ET AL. ©2014. American Geophysical Union. All Rights Reserved. 8648

Our new paleomagnetic pole (CCr) merits almost perfect six points on the seven-point paleomagneticreliability classification scale [Van der Voo, 1990]. The CCr pole also plots close to the mean paleomagneticpole determined from the lower reversed Mamainse Point section (Figure 8) providing a time constraint onits age (~1108Ma). Despite the positive reversal test, we note that the 95% confidence circle of thecombined (A + C) group mean direction (inverted to the normal polarity) does not include the group meandirection for Center B, and vice versa (Figure 7e). The difference between the directions is entirely ininclination and may reflect the equatorward motion of the North American Plate. However, as discussedabove, Center B direction is only based on 10 site mean directions and may not entirely average outthe secular variation. For this reason we prefer not to calculate the combined pole based on all 40 normaland reversed accepted paleomagnetic directions.
The mean pole calculated from Center B sites (D =298.0°, I =56.9°, α95 = 5.8°, k= 70, N= 10) plots southwestfrom the group of “reversed” poles on the North American apparent polar wander path (pole CCn, Figure 8)and is statistically similar to the mean VGP pole calculated for the lower normally magnetized section ofthe Mamainse Point sequence (pole MPLn, Figure 8). At the same time, our CCn pole plots north from thegroup of normal polarity poles that includes the ~1095Ma Osler volcanics, the ~1096Ma Portage LakeVolcanics, and the upper normally magnetized section of the Mamainse Point sequence (MPUn). Thisgroup of poles is “separated” from the older CCn and MPLn poles by the pole from the upper reversedpolarity interval of the Mamainse Point volcanics (MPUr) [Swanson-Hysell et al., 2009] and recently dated at~1100.3 ± 0.4Ma [Swanson-Hysell et al., 2014] (Figure 8). Furthermore, normally magnetized rocks of theMellen Complex [Books, 1972] have been radiometrically dated at 1102.0 ± 2.8Ma [Zartman et al., 1997].We therefore conclude that the rocks of Center B were emplaced during the same period of normal polarityas the lower normally magnetized section of the Mamainse Point sequence (Figure 9). Therefore, the rocks ofColdwell Complex record a single reversal from a reversed to normal polarity which is equivalent to the
Table 4. Summary of Paleomagnetic and Geochronology Data for the Selected Rock Units Associated With the North American Midcontinent Rift, Shownin Figure 8a
Rock Unit (Polarity) Plat (°N) Plong (°E) A95 (°) N Paleomagnetic Study Age (Ma) Geochronology Study
Coldwell Complex (R) Center A 48.9 209.8 6.0 14 This study 1108 ± 1 Heaman and Machado [1992]Coldwell Complex (N) Center B 44.9 193.2 8.0 10 This study n/aColdwell Complex (R) Center C 45.6 203.7 7.6 16 This study n/aColdwell Complex (R) CentersA and C
47.2 206.7 4.8 30 This study 1108 ± 1 Heaman and Machado [1992]
Coldwell Complex (R) CentersA, B, and C
46.8 203.1 4.2 40 This study n/a
Mamainse Point (R) Lowerreversed 1
47.5 226.7 8.0 14 Swanson-Hysell et al. [2009] n/a
Mamainse Point (R) Lowerreversed 2
37.5 206.7 5.1 12 Swanson-Hysell et al. [2009] n/a
Mamainse Point (N) Lowernormal
38.0 190.8 9.7 11 Swanson-Hysell et al. [2009] n/a
Mamainse Point (R) Upperreversed 1
34.7 189.2 8.0 11 Swanson-Hysell et al. [2009] n/a
Mamainse Point (N)Upper normal
33.8 192.0 2.9 21 Swanson-Hysell et al. [2009] n/a
Powder Mill Group (R)(Siemens Creek Formation)
45.8 214.0 9.2 10 Palmer and Halls [1986] 1107.3 ± 1.6 Davis and Green [1997]
Lower North ShoreVolcanics (R)
49.8 197.8 10.4 3 Halls and Pesonen [1982] 1107.9 ± 1.8 Davis and Green [1997]
North Shore Volcanics (N) 35.8 181.7 3.0 45 Tauxe and Kodama [2009] 1098.4 ± 1.9, 1099.3 ± 0.3 Davis and Green [1997] andPaces and Miller [1993]
Osler Volcanics (R) 43.1 194.5 5.9 25 Halls [1974] 1107.5 +4/�2, 1105.3 ± 2.1 Davis and Green [1997] andDavis and Sutcliffe [1985]
Osler Volcanics (N) 33.9 177.9 8.1 5 Halls [1974] n/aPortage Lake Volcanics (N) 26.5 181.2 7.9 4 Halls and Pesonen [1982] 1094 ± 1.5, 1096 ± 1.8 Davis and Paces [1990]Lake Shore Traps (N) 23.1 186.4 4.0 31 Kulakov et al. [2013] 1087 ± 1.6 Davis and Paces [1990]
aPlat and Plong are the latitude and longitude of the paleomagnetic pole, A95 is the 95% confidence circle, and N is the number of sites; n/a = not applicable.
Journal of Geophysical Research: Solid Earth 10.1002/2014JB011463
KULAKOV ET AL. ©2014. American Geophysical Union. All Rights Reserved. 8649

lowermost R→N polarity reversal recorded bythe Mamainse Point lavas. Assuming that thenext N→ R reversal occurred before 1100Maas suggested by the age of MPUr pole, ourpaleomagnetic data suggest that the ColdwellComplex was emplaced within an 5–8 Maperiod, which is longer than an estimate byHeaman and Machado [1992] but shorter than15–20 Ma proposed by Lewchuk and Symons[1990].
Unfortunately, out attempts to obtainradiometric ages from the normallymagnetized rocks of the Coldwell Complexwere unsuccessful (K. Chamberlain, personalcommunication via e-mail, 2014). There isalso no radiometric age available for the lowernormal Mamainse Point section. The minimumage of 1105.3±2.1Ma was assigned to reverselymagnetized lavas of Osler Volcanics based onthe reversely magnetized Agate Point Rhyolite[Davis and Green, 1997]. Based on availableradiometric dates, we conclude that the rocks ofCenter B were emplaced between ~1105 and~1100Ma which is in a good agreement withthe period of normal polarity of geomagneticfield between 1105±2 and 1102±2Masuggested by Davis and Green [1997].
Our paleomagnetic data further confirm the model of westward migration of the magma source during theevolution of the Coldwell Complex [e.g., Currie, 1980; Mitchell et al., 1993]. Emplacement of the easterngabbro and ferroaugite syenites during the first magmatic pulse was followed by intrusion of the remainingrocks of the central and western part. The last magmatic pulse resulted in emplacement of rocks located atthe western part of the complex that were magnetized during the interval of normal polarity.
4.4. Implications for the Apparent Reversal Asymmetry and North American Plate Motion
Our new paleomagnetic data indicate that the rocks of Coldwell Complex record a single geomagneticreversal that is equivalent to the lower reversed-to-normal reversal recorded in the Mamainse Point sequence[Palmer, 1970; Robertson and Fahrig, 1971; Swanson-Hysell et al., 2009] (Figure 9). Although Swanson-Hysellet al. [2009] reported a positive reversal test with classification C [McFadden and McElhinny, 1990] for thisMR1→MN1 reversal, the test was based on a limited number of paleomagnetic site mean directions (N=6),insufficient to average out the paleosecular variation of geomagnetic field. Moreover, if one of the sitemean directions based on only two specimens is excluded, the reversal test becomes indeterminate.
The robust positive reversal test based on a large number of sites presented in this study removes thisuncertainty indicating that the reversal was indeed symmetrical. Therefore, our paleomagnetic dataprovide an additional support to the conclusions reached in prior investigations [e.g., Davis and Green,1997; Swanson-Hysell et al., 2009] that the apparent reversal asymmetry is an artifact due to missingpaleomagnetic record of an equatorward plate motion in most MCR sequences. On a broader scale, ourresults support the validity of the geocentric axial dipole assumption for the ~1.1 Ga.
Swanson-Hysell et al. [2009] calculated a superfast rate of 33.6 ± 3.5 cm/yr for the North American apparentpolar wander (APW) using the paleomagnetic pole from the Coldwell Complex’s Center A [Lewchuk andSymons, 1990] and the paleomagnetic pole for the ~1098Ma normally magnetized flows of the North ShoreVolcanics [Palmer, 1970; Books, 1968]. However, both poles are based on older data sets obtained usingoutdated techniques.
Figure 9. Simplified stratigraphic columns comparing geomagneticreversals recorded by rocks of the Coldwell Complex and MamainsePoint (see text).
Journal of Geophysical Research: Solid Earth 10.1002/2014JB011463
KULAKOV ET AL. ©2014. American Geophysical Union. All Rights Reserved. 8650

We calculated the APW rate based on our new paleomagnetic pole for the Coldwell Complex reverselymagnetized rocks (this study) and the paleopole calculated from the high-quality data from the North ShoreVolcanics [Tauxe and Kodama, 2009]. The new estimate at 24.6 ± 3.8 cm/yr (2.21 ± 0.34°/Myr) is similar tothe rate of latitudinal drift of 24.5 ± 3.8 cm/yr calculated from the same data sets. The statistical similaritybetween the polar wander and latitudinal motion rates indicates that North America experienced latitudinalmotion drifting southward with no rotational or longitudinal component in the motion. Although thenew estimate is significantly lower than the value from Swanson-Hysell et al. [2009], it still exceeds anypresent-day plate motion rate. However, researchers have long recognized that the present-day velocitiesmay be strongly biased by the peculiarities of present-day plate geometries [Solomon et al., 1977] and donot represent an absolute “speed” limit for plates [e.g., Gordon et al., 1979; Tarduno et al., 1986, 1990;Meert et al.,1993]. Our new estimate of the plate velocity for North America at ~1.1Ga is within the ~15–30 cm/yr rangedocumented for a paleo-Pacific oceanic plate in the Cretaceous [Tarduno et al., 1986, 1990] and is not sodifferent from the peak velocity (~18 cm/yr) found for the Indian Plate at ~65–67Ma [e.g., Klootwijk et al., 1992;Cande et al., 2010].
Tarduno et al. [1990] proposed that the ultrafast paleo-Pacific plate motion could have been caused by thesubduction of old, dense crust along an exceptionally long relative to plate size subducting boundary (i.e., aplate geometry that is not seen in the modern time). Tarduno et al. [1990] and [Tarduno and Myers, 1994]also suggested that such high velocities might be added by a large-scale reduction of asthenospheric viscositydue to the unusually vigorous mantle plume volcanism in the Pacific basin during the mid-Cretaceous [e.g.,Larson, 1991]. The effect of mantle plume activity on the plate velocities has been recently revisited byCande and Stegman [2011] who proposed a causative link between the impingement of Reunion plumehead and the fast velocity of the Indian Plate between 67 and 52Ma.
Could one or both of these mechanisms be responsible for the fast plate motion of North America at ~1.1Ga?The strong slab-pull mechanism is unlikely because Laurentia had been an overriding plate for the mosttime of its convergence along the Grenville front. Although the polarity of subduction could have changedjust before the collision with Amazonia at ~1090Ma, the crust being subducted was thin and warm [Hynes andRivers, 2010, and references therein] and hence could not provide a sufficiently strong pull for such alarge plate.
We note, however, that the period of the fast plate motion of North America between ~1108 and 1098Macoincides in time with large-scale intraplate magmatism which, in addition to the ~1110–1087MaMidcontinent Rift, led to formation of the 1100–1080Ma Southwest U.S. Diabase Province [Hammond,1990] and the mafic intrusions in Saskatchewan, ~1400 km northwest of the Midcontinent Rift, with a U-Pbbaddeleyite age of 1109 ± 2Ma [French et al., 2002]. These magmatic events likely originate from mantleplume activity [e.g., Hutchinson et al., 1990; Nicholson and Shirey, 1990]. Nearly coeval with the Laurentianmagmatism is the 1112–1103Ma Umkondo magmatic event represented by sills, dykes, and bimodalvolcanics in the Kalahari Craton [Hanson et al., 2004]. Although the Umkondo and Keweenawan magmatismwere separated by a convergent boundary at that time, they could originate from a single deep-sourced largeplume [Hanson et al., 2004]. These widespread magmatic events indicate an unusually vigorous mantlebeneath Laurentia. We therefore speculate that the fast plate motion may reflect the attendant reduction ofasthenospheric drag beneath the plate similar to the mechanism proposed for the mid-Cretaceous Pacificplates by Tarduno and Myers [1994].
We note that in contrast to an oceanic plate, the motion of a continental plate such as Laurentia couldhave been affected by an additional drag caused by the continental root [e.g., Forsyth and Uyeda, 1975].However, prolonged periods of fast plate velocity (in excess of 18 cm/yr) during the Proterozoic were inferredfor Laurentia and Gondwana from paleomagnetic analyses [Meert et al., 1993]. Our velocity estimate forLaurentia is even higher and provides an additional support to the suggestion that long-term fluctuations inmantle dynamics could alter the balance of forces driving platemotions and allow continental plates to movewith the velocities approaching those of the oceanic plates [Meert et al., 1993].
As an alternative explanation for the fast equatorward plate motion of Laurentia, a true polar wander(TPW) event was proposed [e.g., Evans, 2003]. However, while the observed motion is in principleconsistent with this hypothesis, the existence of such a TPW event has not been yet confirmed on aglobal scale.
Journal of Geophysical Research: Solid Earth 10.1002/2014JB011463
KULAKOV ET AL. ©2014. American Geophysical Union. All Rights Reserved. 8651

5. Conclusions
Our new paleomagnetic data from the Coldwell Complex indicate that the complex records only a singlegeomagnetic R→N reversal that is equivalent to the lowermost reversal recorded in the Mamainse Point lavaflow sequence. The existence of two reversals suggested in a prior study [Lewchuk and Symons, 1990] islikely an artifact due to the deficiencies in their paleomagnetic analyses. The robust positive reversal testobtained in this study indicates that the reversal was symmetrical, hence providing support to the NorthAmerican Plate motion as the cause of the apparent reversal asymmetry observed in some MCR rocks anddiscounting the possibility of a long-term nondipolar field at that time. Overall, our results indicate that thegeometry and stability of the geomagnetic field at ~1.1Ga were similar to their Phanerozoic counterparts.
Our paleomagnetic results do not support the complex’s emplacement model suggested by Lewchuk andSymons [1990] but instead is consistent with earlier models in which the intrusive centers are progressivelyyounger as a result of westward migration of the magma source. The combination of paleomagneticand radiometric data from other MCR sequences suggests that the entire complex was emplaced within5–8Ma which is consistent with prior geochemical and geochronological investigations [e.g., Heamanand Machado, 1992]. The new paleomagnetic pole implies an unusually fast plate motion between~1108Ma and 1098Ma, however, at a lower rate than previously suggested by Swanson-Hysell et al. [2009]. Thefast motion of Laurentia may reflect a decreased mantle drag due to unusually vigorous mantle indicated bywidespread intraplate magmatic events. Our results indicate that continental plates can move with thevelocities approaching those of the oceanic plates.
ReferencesBell, K., and J. Blenkinsop (1980), Ages and initial
87Sr-
86Sr ratios from alkalic complexes of Ontario, Ont. Geol. Surv. Misc. Pap., 93, 16–23.
Bina, M., and L. Daly (1994), Mineralogical change and self-reversed magnetizations in pyrrhotite resulting from partial oxidation:Geophysical implications, Phys. Earth Planet. Inter., 85, 83–99.
Books, K. (1968), Magnetization of the lowermost Keweenawan lava flows in the Lake Superior area, U.S. Geol. Surv. Prof. Pap., 600-D, D248–D254.Books, K. (1972), Paleomagnetism of some Lake Superior Keweenawan rocks, U.S. Geol. Surv. Prof. Pap., P0760.Cande, S. C., and D. R. Stegman (2011), Indian and African plate motions driven by the push force of the Reunion plume, Nature, 475, 47–52.Cande, S. C., P. Patriat, and J. Dyment (2010), Motion between the Indian, Antarctica and African plates in the early Cenozoic, Geophys. J. Int.,
183, 127–149.Currie, K. L. (1980), A contribution to the petrology of the Coldwell alkaline complex, northern Ontario, Geol. Surv. Can. Bul., 287.Davis, D., and J. C. Green (1997), Geochronology of the North American Midcontinent rift in western Lake Superior and implications for its
geodynamic evolution, Can. J. Earth Sci., 34, 476–488.Davis, D. W., and J. B. Paces (1990), Time resolution of geologic events on the Keweenaw Peninsula and implications for development of the
Midcontinent rift system, Earth Planet. Sci. Lett., 97, 54–64.Davis, D., and R. Sutcliffe (1985), U-Pb ages from the Nipigon plate and northern Lake Superior, Geol. Soc. Am. Bull., 96, 1572–1579.Day, R., M. Fuller, and V. A. Schmidt (1977), Hysteresis properties of titanomagnetites: Grain size and compositional dependence, Phys. Earth
Planet. Inter., 13, 260–267.Dekkers, M. J. (1990), Magnetic monitoring of pyrrhotite alteration during thermal demagnetization, Geophys. Res. Lett., 17, 779–782,
doi:10.1029/GL017i006p00779.Doell, R. R. (1970), Paleomagnetic secular variation study of lavas from the Massif Central, France, Earth Planet. Sci. Lett., 8, 352–362.Dunlop, D. J. (1974), Thermal enhancement of magnetic susceptibility, J. Geophys., 40, 439–451.Dunlop, D. J. (2002), Theory and application of the Day plot (Mrs/Ms versus Hcr/Hc): 1. Theoretical curves and tests using titanomagnetite
data, J. Geophys. Res., 107, 2056, doi:10.1029/2001JB000486.Efron, B. (1982), The jackknife, the bootstrap, and other resampling plans, CBMS-NSF CBMS-NSF Reg. Conf. Ser. App. Math., Philadelphia,
Penn., 38, 93 pp.Evans, D. A. D. (2003), True polar wander and supercontinents, Tectonophysics, 362, 303–320.Fisher, N. I., T. Lewis, and B. J. J. Embleton (1987), Statistical Analysis of Spherical Data, Cambridge Univ. Press, New York.Fisher, R. A. (1953), Dispersion on a sphere, Proc. R. Soc. London, Ser. A, 217, 295–305.Forsyth, D. W., and S. Uyeda (1975), On the relative importance of driving forces of plate motion, Geophys. J. R. Astron. Soc., 43, 163–200.French, J. E., L. M. Heaman, and T. Chacko (2002), Feasibility of chemical U-Th-total Pb baddeleyite dating by electron microprobe,
Chem. Geol., 188, 85–104.Gordon, R. G., M. O. McWilliams, and A. Cox (1979), Pre-tertiary velocities of the continents: A lower bound from paleomagnetic data,
J. Geophys. Res., 84, 5480–5486, doi:10.1029/JB084iB10p05480.Haggerty, S. E. (1991), Oxide textures—A mini-atlas, Rev. Miner., 25, 129–219.Halls, H. C. (1974), A paleomagnetic reversal in the Osler Volcanic Group, Northern Lake Superior, Can. J. Earth Sci., 11, 1200–1207.Halls, H. C., and L. J. Pesonen (1982), Paleomagnetism of Keweenawan rocks, in Geology and Tectonics of the Lake Superior Basin, Geol. Soc. Am
Mem., vol. 156, edited by R. J. Wold and W. J. Hinze, pp. 173–203, Geol. Soc. Am., Boulder, Colo.Hammond, J. G. (1990), Middle Proterozoic diabase intrusions in the southwestern U.S.A. as indicators of limited extensional
tectonism, in Mid-Proterozoic Laurentia-Baltica, edited by C. F. Gower, T. Rivers, and B. Ryan, Geol. Assoc. of Canada Spec. Pap., 38,517–531, Toronto, Canada.
Hanson, R. E., J. L. Crowley, S. A. Bowring, J. Ramezani, W. A. Gose, I. W. D. Dalziel, J. A. Pancake, E. K. Seidel, T. G. Blenkinsop, andJ. Mukwakwami (2004), Coeval large-scale magmatism in the Kalahari and Laurentian cratons during Rodinia assembly, Science, 304,1126–1129.
AcknowledgmentsPresented data are available by requestform the corresponding author. Wethank Dorothy Campbell and John Scott(Ontario Geological Survey) and DavidGood (Stillwater Inc.) for their guidanceand help during field work. We alsothank Elisa Piispa, Kari Anderson, AshleyKern, Nadja Cintron Franqui, JoshuaRichardson, and Matthew Laird for theirhelp in the field and laboratory.Comments by Xixi Zhao, Vladimir Pavlov,and one anonymous reviewer greatlyimproved the quality of our manuscript.And last, a special thanks to DavidSymons for making his original fieldnotes and maps available to us.This project was supported by the grantEAR-1045406 from the National ScienceFoundation (NSF). Participation byAshley Kern and Nadja Cintron Franquiwas partially supported by two ResearchExperience for Undergraduates (REU)supplements from NSF.
Journal of Geophysical Research: Solid Earth 10.1002/2014JB011463
KULAKOV ET AL. ©2014. American Geophysical Union. All Rights Reserved. 8652

Heaman, L. M., and N. Machado (1992), Timing and origin of Midcontinent rift alkaline magmatism, North America: Evidence from theColdwell Complex, Contrib. Mineral. Petrol., 110, 289–303.
Hutchinson, D. R., R. S. White, W. F. Cannon, and K. J. Schulz (1990), Keweenaw hot spot: Geophysical evidence for a 1.1 Ga mantle plumebeneath the Midcontinent rift system, J. Geophys. Res., 95, 10,869–10,884, doi:10.1029/JB095iB07p10869.
Hynes, A., and T. Rivers (2010), Protracted continental collision—Evidence from the Grenville Orogen, Can. J. Earth Sci., 47, 591–620.Jacobs, J. A. (1994), Reversals of the Earth’s Magnetic Field, Cambridge Univ. Press, Cambridge, U. K.Kirschvink, J. L. (1980), The least-squares line and plane and the analysis of palaeomagnetic data, Geophys. J. Int., 62, 699–718.Klootwijk, C. T., J. S. Gee, J. W. Peirce, and G. M. Smith (1992), An early India-Asia contact: Paleomagnetic constraints from Ninetyeast Ridge,
ODP Leg 121, Geology, 20, 395–398.Kosterov, A. A., andM. Prévot (1998), Possible mechanisms causing failure of Thellier palaeointensity experiments in some basalts, Geophys. J.
Int., 134, 554–572.Kulakov, E. V., A. V. Smirnov, T. J. Bornhorst, R. Cundari, and P. N. Hollings (2012), Paleomagnetism and geochemistry of the Geordie Lake and
Silver Mountain basalts: Implications for the Midcontinent Rift evolution, Abstract GP21A-1130 presented at 2012 Fall Meeting, AGU, SanFrancisco, Calif.
Kulakov, E. V., A. V. Smirnov, and J. F. Diehl (2013), Paleomagnetism of ~1.09 Ga Lake Shore Traps (Keweenaw Peninsula, Michigan):New results and implications, Can. J. Earth Sci., 50, 1085–1096.
Larson, R. L. (1991), Latest pulse of Earth: Evidence for a mid-Cretaceous superplume, Geology, 19, 547–550.Lewchuk, M. T., and D. T. A. Symons (1990), Paleomagnetism of the Late Precambrian Coldwell Complex, Ontario, Canada, Tectonophysics,
184, 73–86.Lilley, F. E. M. (1964), An analysis of the magnetic features of the Port Coldwell intrusive, unpublished MSc thesis, I69 pp., Univ. of Western
Ontario, London.McFadden, P. L., and F. J. Lowes (1981), The discrimination of mean directions drawn from Fisher distributions, Geophys. J. R. Astron. Soc., 67,
19–33.McFadden, P. L., and M. McElhinny (1990), Classification of the reversal test in palaeomagnetism, Geophys. J. Int., 103, 725–729.Meert, J. G., R. Van der Voo, C. M. A. Powell, Z.-X. Li, M. W. McElhinny, Z. Chen, and D. T. A. Symons (1993), A plate tectonic speed limit?, Nature,
363, 216–217.Mitchell, R. H., and R. G. Platt (1977), Field guide to the Coldwell alkaline complex, 23rd Annual Meeting, p. 34, Institute on Lake Superior
Geology, Thunder Bay, Ontario, Canada.Mitchell, R. H., and R. G. Platt (1978), Mafic mineralogy of ferroaugite syenite from the Coldwell Alkaline Complex, Ontario, Canada, J. Petrol.,
19, 627–651.Mitchell, R. H., and R. G. Platt (1982), Mineralogy and petrology of nepheline syenites from the Coldwell Alkaline Complex, Ontario, J. Petrol.,
23, 186–214.Mitchell, R. H., R. G. Platt, J. Lukosius-Sanders, M. Artist-Downey, and S. Moogk-Pickard (1993), Petrology of syenites from centre III of the
Coldwell alkaline complex, northwestern Ontario, Canada, Can. J. Earth Sci, 30, 145–158.Nevanlinna, H., and L. J. Pesonen (1983), Late Precambrian Keweenawan asymmetric polarities as analyzed by axial offset dipole geomag-
netic models, J. Geophys. Res., 88, 645–658, doi:10.1029/JB088iB01p00645.Nicholson, S. W., and S. B. Shirey (1990), Midcontinent rift volcanism in the Lake Superior region: Sr, Nd, and Pb isotopic evidence for a mantle
plume origin, J. Geophys. Res., 95, 10,851–10,868, doi:10.1029/JB095iB07p10851.Paces, J. B., and J. D. Miller (1993), Precise U-Pb ages of Duluth Complex and related mafic intrusions, northeastern Minnesota:
Geochronological insights to physical, petrogenetic, paleomagnetic, and tectonomagmatic processes associated with the 1.1 GaMidcontinent Rift System, J. Geophys. Res., 98, 13,997–14,013, doi:10.1029/93JB01159.
Palmer, H. C. (1970), Paleomagnetism and correlation of some Middle Keweenawan rocks, Lake Superior, Can. J. Earth Sci., 7, 1410–1436.Palmer, H. C., and D. W. Davis (1987), Paleomagnetism and U-Pb geochronology of volcanic rocks from Michipicoten Island, Lake Superior,
Canada. Precise calibration of the Keweenawan polar wander track, Precambrian Res., 37, 157–171.Palmer, H. C., and H. C. Halls (1986), Paleomagnetism of the Powder Mill Group, Michigan and Wisconsin: A reassessment of the Logan Loop,
J. Geophys. Res., 91, 11,571–11,580, doi:10.1029/JB091iB11p11571.Pesonen, L. J., and H. C. Halls (1979), The paleomagnetism of Keweenawan dikes from Baraga and Marquette Counties, Northern Michigan,
Can. J. Earth Sci., 16, 2136–2149.Pesonen, L. J., and H. Nevanlinna (1981), Late Precambrian Keweenawan asymmetric reversals, Nature, 294, 436–439.Platt, R., and R. Mitchell (1982), Rb-Sr geochronology of the Coldwell complex, northwestern Ontario, Canada, Can. J. Earth Sci., 19,
1796–1801.Puskas, F. P. (1967), Port Coldwell area, District of Thunder Bay. Ont. Dep. Mines, Prelim. Map., P114, 2 in =1 mi.Puskas, F. P. (1970), The Port Coldwell Alkali Complex, Inst. L. Sup.Geol., 16, 1–17.Robertson, W. A. (1973), Pole positions from the Mamainse Point Lavas and their Bearing on a Keweenawan pole path, Can. J. Earth Sci., 10, 1541–1555.Robertson, W. A., and W. F. Fahrig (1971), The great Logan paleomagnetic loop—The polar wandering path from Canadian shield rocks
during the Neohelikian era, Can. J. Earth Sci., 8, 1355–1372.Sage, R. P. (1991), Alkalic rock, carbonatite and kimberlite complexes of Ontario, Superior Province, in Geology of Ontario, Ont. Geol. Surv.
Spec. Pap., 4, 683–709, Toronto, Canada.Schmidt, P. W., and G. E. Williams (2003), Reversal asymmetry in Mesoproterozoic overprinting of the 1.88-Ga Gunflint Formation, Ontario,
Canada: Non-dipole effects or apparent polar wander?, Tectonophysics, 377, 7–32.Smirnov, A. V., D. G. Bauch, and J. A. Tarduno (2005), Temperature dependence of magnetic susceptibility as a potential indicator of fine-scale
oxyexsolution in igneous rocks, Eos Trans. AGU, 86(52), Fall Meet. Suppl., Abstract GP13A-0040.Smirnov, A. V., J. A. Tarduno, and D. A. D. Evans (2011), Evolving core conditions ca. 2 billion years ago detected by paleosecular variation,
Phys. Earth Planet. Inter., 187, 225–231.Solomon, S. C., N. H. Sleep, and D. M. Jurdy (1977), Mechanical models for absolute plate motions in the early Tertiary, J. Geophys. Res., 82,
203–212, doi:10.1029/JB082i002p00203.Strik, G., T. S. Blake, T. E. Zegers, S. H. White, and C. G. Langereis, (2003), Palaeomagnetism of flood basalts in the Pilbara Craton, Western
Australia: Late Archaean continental drift and the oldest known reversal of the geomagnetic field, J. Geophys. Res., 108(B12), 2551,doi:10.1029/2003JB002475.
Sutcliffe, R. H. (1991), Proterozoic geology of the Lake Superior area, in Geology of Ontario, Ont. Geol. Surv. Spec., 4, 627–660, Toronto, Canada.Swanson-Hysell, N. L., A. C. Maloof, B. P. Weiss, and D. A. D. Evans (2009), No asymmetry in geomagnetic reversals recorded by 1.1-billion-
year-old Keweenawan basalt, Nat. Geosci., 2, 713–717.
Journal of Geophysical Research: Solid Earth 10.1002/2014JB011463
KULAKOV ET AL. ©2014. American Geophysical Union. All Rights Reserved. 8653

Swanson-Hysell, N. L., S. D. Burgess, A. C. Maloof, and S. A. Bowring (2014), Magmatic activity and plate motion during the latent stage ofMidcontinent Rift development, Geology, 42, 475, doi:10.1130/G35271.1.
Tarduno, J. A., and M. Myers (1994), A primary magnetization fingerprint from the Cretaceous Laytonville Limestone: Further evidence forrapid plate velocities, J. Geophys. Res., 99, 21,691–21,703, doi:10.1029/94JB01939.
Tarduno, J. A., M. McWilliams, W. V. Sliter, H. E. Cook, M. C. Blake Jr., and I. Premoli-Silva (1986), Southern Hemisphere origin of the CretaceousLaytonville Limestone of California, Science, 231, 1425–1428.
Tarduno, J. A., M. McWilliams, and N. Sleep (1990), Fast instantaneous oceanic plate velocities recorded by the Cretaceous LaytonvilleLimestone: Paleomagnetic analysis and kinematic implications, J. Geophys. Res., 95, 15,503–15,527, doi:10.1029/JB095iB10p15503.
Tauxe, L., and K. P. Kodama (2009), Paleosecular variation models for ancient times: Clues from Keweenawan lava flows, Phys. Earth Planet.Inter., 177, 31–45.
Thorpe, R. I. (1986), U-Pb geochronology of the Coldwell Complex, northwestern Ontario, Canada: Discussion, Can. J. Earth Sci., 23, 125–127.Turek, A., P. W. Smith, and D. T. A. Symons (1985), U-Pb geochronology of the Coldwell Complex, northwestern Ontario, Canada, Can. J. Earth
Sci., 22, 621–626.Van der Voo, R. (1990), The reliability of paleomagnetic data, Tectonophysics, 184, 1–9.Verwey, E. J. W. (1939), Electron conduction of magnetite (Fe3O4) and its transition point at low temperatures, Nature, 144, 327–328.Walker, E. C., R. H. Sutcliffe, C. S. J. Shaw, G. T. Shore, and R. S. Penczak (1993), Precambrian geology of the Coldwell Alkaline Complex, Ont.
Geol. Surv., Open File Rep., 5868, 30 pp.Zartman, R. E., S. W. Nicholson, W. F. Cannon, and G. B. Morey (1997), U-Th-Pb zircon ages of some Keweenawan Supergroup rocks from the
south shore of Lake Superior, Can. J. Earth Sci., 34, 549–561.
Journal of Geophysical Research: Solid Earth 10.1002/2014JB011463
KULAKOV ET AL. ©2014. American Geophysical Union. All Rights Reserved. 8654
Copyright © 2022 FDOKUMEN