Palaeomagnetic configuration of continents during the Proterozoic
36
Palaeomagnetic configuration of continents during the Proterozoic L.J. Pesonen a, * , S.-A ˚ . Elming b , S. Mertanen c , S. Pisarevsky d , M.S. D’Agrella-Filho e , J.G. Meert f , P.W. Schmidt g , N. Abrahamsen h , G. Bylund i a Division of Geophysics, Department of Physical Sciences, University of Helsinki, POB 64 (Gustaf Ha ¨llstro ¨min katu 2), FIN-00014 Helsinki, Finland b Department of Applied Geophysics, Lulea ˚ University of Technology, S-95187 Lulea ˚, Sweden c Geological Survey of Finland, FIN-02151 Espoo, Finland d Tectonics Special Research Centre, The University of Western Australia, Crawley 6009 WA, Australia e Institute of Astronomy, Geophysics and Atmospheric Sciences, University of Sa ˜o Paulo, Sa ˜o Paulo, Brazil f Department of Geological Sciences, University of Florida, Gainesville, FL 32611, USA g CSIRO, Department of Exploration and Mining, North Ryde, NSW, Australia h Department of Earth Sciences, University of Aarhus, 8200 Aarhus, Denmark i Department of Geology, University of Lund, S-223 62 Lund, Sweden Received 15 April 2002; received in revised form 19 March 2003; accepted 5 June 2003 Abstract Palaeomagnetic data are used to study the configurations of continents during the Proterozoic. Applying stringent reliability criteria, the positions of the continents at 12 times in the 2.45- to 1.00-Ga period have been constructed. The continents lie predominantly in low to intermediate latitudes. The sedimentological indicators of palaeoclimate are generally consistent with the palaeomagnetic latitudes, with the exception of the Early Proterozoic, when low latitude glaciations took place on several continents. The Proterozoic continental configurations are generally in agreement with current geological models of the evolution of the continents. The data suggest that three large continental landmasses existed during the Proterozoic. The oldest one is the Neoarchaean Kenorland, which comprised at least Laurentia, Baltica, Australia and the Kalahari craton. The protracted breakup of Kenorland during the 2.45- to 2.10-Ga interval is manifested by mafic dykes and sedimentary rift-basins on many continents. The second ‘supercontinental’ landmass is Hudsonland (also known as Columbia). On the basis of purely palaeomagnetic data, this supercontinent consisted of Laurentia, Baltica, Ukraine, Amazonia and Australia and perhaps also Siberia, North China and Kalahari. Hudsonland existed from 1.83 to ca. 1.50 – 1.25 Ga. The youngest assembly is the Neoproterozoic supercontinent of Rodinia, which was formed by continent – continent collisions during f1.10 – 1.00 Ga and which involved most of the continents. A new model for its assembly and configuration is presented, which suggests that multiple Grenvillian age collisions 0040-1951/$ - see front matter D 2003 Elsevier B.V. All rights reserved. doi:10.1016/S0040-1951(03)00343-3 * Corresponding author. Tel.: +358-9-19151017; fax: +358-9-19151000. E-mail address: [email protected] (L.J. Pesonen). www.elsevier.com/locate/tecto Tectonophysics 375 (2003) 289– 324
Transcript of Palaeomagnetic configuration of continents during the Proterozoic

www.elsevier.com/locate/tecto
Tectonophysics 375 (2003) 289–324
Palaeomagnetic configuration of continents during the Proterozoic
L.J. Pesonena,*, S.-A. Elmingb, S. Mertanenc, S. Pisarevskyd,M.S. D’Agrella-Filhoe, J.G. Meertf, P.W. Schmidtg,
N. Abrahamsenh, G. Bylundi
aDivision of Geophysics, Department of Physical Sciences, University of Helsinki, POB 64 (Gustaf Hallstromin katu 2),
FIN-00014 Helsinki, FinlandbDepartment of Applied Geophysics, Lulea University of Technology, S-95187 Lulea, Sweden
cGeological Survey of Finland, FIN-02151 Espoo, FinlanddTectonics Special Research Centre, The University of Western Australia, Crawley 6009 WA, Australia
e Institute of Astronomy, Geophysics and Atmospheric Sciences, University of Sao Paulo, Sao Paulo, BrazilfDepartment of Geological Sciences, University of Florida, Gainesville, FL 32611, USA
gCSIRO, Department of Exploration and Mining, North Ryde, NSW, AustraliahDepartment of Earth Sciences, University of Aarhus, 8200 Aarhus, Denmark
iDepartment of Geology, University of Lund, S-223 62 Lund, Sweden
Received 15 April 2002; received in revised form 19 March 2003; accepted 5 June 2003
Abstract
Palaeomagnetic data are used to study the configurations of continents during the Proterozoic. Applying stringent reliability
criteria, the positions of the continents at 12 times in the 2.45- to 1.00-Ga period have been constructed. The continents lie
predominantly in low to intermediate latitudes. The sedimentological indicators of palaeoclimate are generally consistent with
the palaeomagnetic latitudes, with the exception of the Early Proterozoic, when low latitude glaciations took place on several
continents.
The Proterozoic continental configurations are generally in agreement with current geological models of the evolution of the
continents. The data suggest that three large continental landmasses existed during the Proterozoic. The oldest one is the
Neoarchaean Kenorland, which comprised at least Laurentia, Baltica, Australia and the Kalahari craton. The protracted breakup
of Kenorland during the 2.45- to 2.10-Ga interval is manifested by mafic dykes and sedimentary rift-basins on many continents.
The second ‘supercontinental’ landmass is Hudsonland (also known as Columbia). On the basis of purely palaeomagnetic data,
this supercontinent consisted of Laurentia, Baltica, Ukraine, Amazonia and Australia and perhaps also Siberia, North China and
Kalahari. Hudsonland existed from 1.83 to ca. 1.50–1.25 Ga. The youngest assembly is the Neoproterozoic supercontinent of
Rodinia, which was formed by continent–continent collisions during f1.10–1.00 Ga and which involved most of the
continents. A new model for its assembly and configuration is presented, which suggests that multiple Grenvillian age collisions
0040-1951/$ - see front matter D 2003 Elsevier B.V. All rights reserved.
doi:10.1016/S0040-1951(03)00343-3
* Corresponding author. Tel.: +358-9-19151017; fax: +358-9-19151000.
E-mail address: [email protected] (L.J. Pesonen).

L.J. Pesonen et al. / Tectonophysics 375 (2003) 289–324290
took place during 1.10–1.00 Ga. The configurations of Kenorland, Hudsonland and Rodinia depart from each other and also
from the Pangaea assembly. The tectonic styles of their amalgamation are also different reflecting probable changes in sizes and
thicknesses of the cratonic blocks as well as changes in the thermal conditions of the mantle through time.
D 2003 Elsevier B.V. All rights reserved.
Keywords: Palaeomagnetism; Proterozoic; Supercontinent; Mantle plume; Kenorland; Hudsonland; Columbia; Rodinia; Palaeolatitude;
Palaeogeography; Accretion; Mafic dykes
1. Introduction look for pre-Rodinian supercontinents (e.g., Piper,
The importance of supercontinents in our under-
standing of the geological evolution of the Earth has
been discussed in some depth (e.g., Dalziel, 1995;
Rogers, 1996; Aspler and Chiarenzelli, 1998; Piper,
2000; Rogers and Santosh, 2002, and references
therein). Geological processes linked to the super-
continent formation include mantle superplume
events (e.g.,Condie et al., 2001), low latitude glaci-
ations and either the ‘‘Snowball Earth’’ or ‘high-
obliquity’ concepts (e.g., Kirschvink, 1992; Williams
and Schmidt, 1997; Hoffman and Schrag, 2002),
carbon isotope excursions (e.g., Bekker et al.,
2001), fragmentation of continental dyke swarms
(Ernst and Buchan, 2001), truncations of tectonic
belts and major rifts (e.g., Brookfield, 1993; Dalziel,
1999), matching of orogenic belts (e.g., Hoffman,
1991), true polar wander (e.g., Kirschvink et al.,
1997; Evans, 1998; Meert, 1999; Evans, 2003) and
peaked age distributions of geological events (Con-
die, 1998; Meert, 2003).
Three supercontinent assemblies (Pangaea 350–
165 Ma, Gondwanaland 550–400 Ma, Rodinia
f1050–750 Ma) have existed during or since the
Neoproterozoic (e.g., Bond et al., 1984; McMenamin
and McMenamin, 1990; Dalziel, 1995, and references
therein). The two younger assemblies have been
constructed by sea floor magnetic data (Pangaea),
and by palaeomagnetic and biostratigraphic results,
supported by geology (Gondwanaland). A current
debate concerns the relative positions of the conti-
nents in Rodinia, and the timing of its assembly and
breakup (e.g., Piper, 2000; Buchan et al., 2001;
Pisarevsky and Natapov, 2003; Meert and Torsvik,
2003).
The consequences of supercontinents on geolog-
ical evolution of the Earth have led some people to
1976; Williams et al., 1991; Rogers, 1996; Zegers
et al., 1998). Archaean landmasses, such as Ur,
Vaalbara, Zimvaalbara, Kenorland, and Palaeo-Mes-
oproterozoic assemblies like Arctica, Atlantica,
Nena and Columbia have been proposed mainly
on geological grounds (e.g., Cheney, 1996; Aspler
and Chiarenzelli, 1998; Rogers and Santosh, 2002,
and references therein). Palaeomagnetism, coupled
with precise isotope age data, is the only method
which provides direct knowledge of ancient lati-
tudes of continents. Nevertheless, its role in many
previous reconstructions (e.g., Rogers and Santosh,
2002) has been limited perhaps because of poor age
control or large scatter of poles, or because the
dated poles are not coeval (e.g., Buchan et al.,
2000; Meert, 2002).
In this paper, we use good quality palaeomagnetic
data, combined with isotope ages and geological
information, to define the positions of the continents
during 2.45–1.00 Ga. Palaeomagnetically defined
latitudes are tested with sedimentological indicators
of palaeoclimate. Some of the continental configura-
tions and the tectonic styles of their amalgamations
presented here are in contrast with our previous
interpretations — mainly due to the addition of newer,
more reliable, data (Pesonen et al., 2000, 2001a,b,c;
Elming et al., 2001a,b; Mertanen and Pesonen, 2000,
2003; Mertanen et al., 2001).
2. Sources of data
Fig. 1 shows 16 cratons from which reliable
palaeomagnetic data are available. Other cratons,
provinces or microcontinents, such as Rio de La
Plata, Seychelles, Madagascar, Rockall Bank, Bare-
ntia, Sahara, Oaxaquia, etc., which contain Protero-
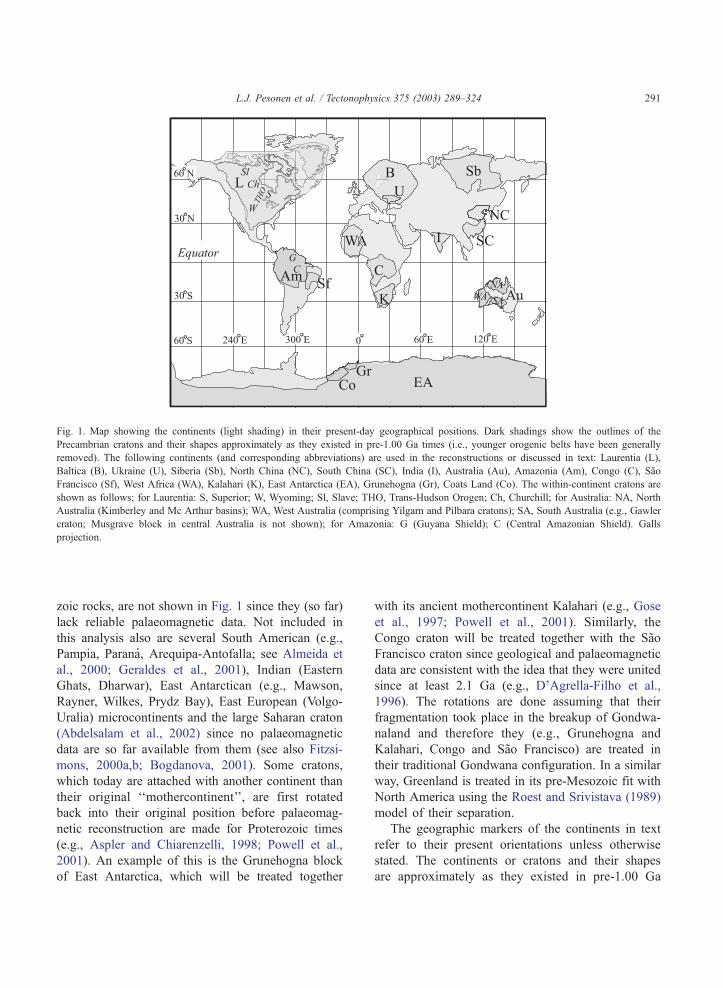
Fig. 1. Map showing the continents (light shading) in their present-day geographical positions. Dark shadings show the outlines of the
Precambrian cratons and their shapes approximately as they existed in pre-1.00 Ga times (i.e., younger orogenic belts have been generally
removed). The following continents (and corresponding abbreviations) are used in the reconstructions or discussed in text: Laurentia (L),
Baltica (B), Ukraine (U), Siberia (Sb), North China (NC), South China (SC), India (I), Australia (Au), Amazonia (Am), Congo (C), Sao
Francisco (Sf), West Africa (WA), Kalahari (K), East Antarctica (EA), Grunehogna (Gr), Coats Land (Co). The within-continent cratons are
shown as follows; for Laurentia: S, Superior; W, Wyoming; Sl, Slave; THO, Trans-Hudson Orogen; Ch, Churchill; for Australia: NA, North
Australia (Kimberley and Mc Arthur basins); WA, West Australia (comprising Yilgarn and Pilbara cratons); SA, South Australia (e.g., Gawler
craton; Musgrave block in central Australia is not shown); for Amazonia: G (Guyana Shield); C (Central Amazonian Shield). Galls
projection.
L.J. Pesonen et al. / Tectonophysics 375 (2003) 289–324 291
zoic rocks, are not shown in Fig. 1 since they (so far)
lack reliable palaeomagnetic data. Not included in
this analysis also are several South American (e.g.,
Pampia, Parana, Arequipa-Antofalla; see Almeida et
al., 2000; Geraldes et al., 2001), Indian (Eastern
Ghats, Dharwar), East Antarctican (e.g., Mawson,
Rayner, Wilkes, Prydz Bay), East European (Volgo-
Uralia) microcontinents and the large Saharan craton
(Abdelsalam et al., 2002) since no palaeomagnetic
data are so far available from them (see also Fitzsi-
mons, 2000a,b; Bogdanova, 2001). Some cratons,
which today are attached with another continent than
their original ‘‘mothercontinent’’, are first rotated
back into their original position before palaeomag-
netic reconstruction are made for Proterozoic times
(e.g., Aspler and Chiarenzelli, 1998; Powell et al.,
2001). An example of this is the Grunehogna block
of East Antarctica, which will be treated together
with its ancient mothercontinent Kalahari (e.g., Gose
et al., 1997; Powell et al., 2001). Similarly, the
Congo craton will be treated together with the Sao
Francisco craton since geological and palaeomagnetic
data are consistent with the idea that they were united
since at least 2.1 Ga (e.g., D’Agrella-Filho et al.,
1996). The rotations are done assuming that their
fragmentation took place in the breakup of Gondwa-
naland and therefore they (e.g., Grunehogna and
Kalahari, Congo and Sao Francisco) are treated in
their traditional Gondwana configuration. In a similar
way, Greenland is treated in its pre-Mesozoic fit with
North America using the Roest and Srivistava (1989)
model of their separation.
The geographic markers of the continents in text
refer to their present orientations unless otherwise
stated. The continents or cratons and their shapes
are approximately as they existed in pre-1.00 Ga

L.J. Pesonen et al. / Tectonophysics 375 (2003) 289–324292
times (i.e., younger orogenic belts have generally
been removed). However, this palinspastic technique
is not always possible. Most data (ca. 70%) were
taken from the Global Palaeomagnetic Data Base
(GPDB; McElhinny and Lock, 1996; http://www.dra-
gon.ngu), and the rest were compiled from the liter-
ature (see Abrahamsen et al., 2001).
3. Procedure for reconstructions
In making continental reconstructions we used the
following procedure:
(1) All palaeopoles for the 2.45- to 1.00-Ga period
were compiled with respect to their source cratons
(Table 1, Fig. 1).
(2) Applying stringent reliability criteria as a filter,
we selected the most reliable poles for further anal-
ysis. Fourteen key poles (Buchan et al., 2000),
eighteen class A poles (Pesonen et al., 1989) and
sixty-eight class B and C poles (Pesonen et al., 1989)
were deemed most useful. The drawback of accepting
a few less reliable C poles for the analysis is that the
reconstructions with such poles (e.g., 1.70, 1.50 Ga)
are considered less reliable than those which are
based on key or A and B poles only (e.g., 1.25,
1.10 Ga).
(3) The continents were plotted in their ancient
latitudes and azimuthal orientations as defined by the
poles using the GMAP program (Torsvik and Sme-
thurst, 1999).
(4) Geological features, such as orogenic belts,
rifts, major lineaments, mafic dyke swarms, large
igneous provinces, ophiolite occurrences, and lithos-
tratigraphic data were plotted on the continents to
see if meaningful geological correlations or match-
ings at certain times can be identified. If geologi-
cally sound configurations of the continents were
found, we kept them together to indicate that they
were part of a large landmass, (e.g., Hudsonland;
Fig. 6), or part of a supercontinent (Rodinia; Fig.
14). If we did not find an acceptable geological
correlation, we kept the continents separated. Our
approach differs from some previous palaeomagnetic
approaches (e.g., Weil et al., 1998; Idnurm and
Giddings, 1995; Meert and Torsvik, 2003) in that
we did not draw the APW paths for continents.
Instead, we used the individual poles for making the
reconstructions, following the method of Buchan et
al. (2000). This is because the time-successive poles
of the cratons have large age gaps resulting in poor
APWP definition. The only exception is the Lau-
rentian APWP during Keweenawan times (1.14–
1.00 Ga) that is sufficiently well defined to allow
the APWP to be used (Weil et al., 1998; Buchan et
al., 2001; Powell et al., 2001; Meert and Torsvik,
2003; see dalso Chapter 7.10). Due to large age gaps
in the time-successive poles, the polarity ambiguity
becomes important and therefore both polarity
options must be studied (see Fig. 3; Buchan et al.,
2000).
Continents have grown by amalgamation of cra-
tons or tectonic blocks (e.g., Cavanaugh and Seyfert,
1977; Pesonen et al., 1989). Laurentia provides a
good example of continental growth via accretion.
Most of its palaeomagnetic poles are derived from
rocks within the Superior Province and only a few
are derived from other provinces like Churchill,
Slave, Coronation Geosyncline or the Trans-Hudson
Orogen (THO) (Fig. 1, Table 1). For post-1.77 Ga,
Laurentia is probably consolidated (Symons et al.,
2000; Buchan et al., 2000) since there is an overall
agreement of poles from several provinces at this
time. However, prior to 1.77 Ga, the situation is
more complex. For example, the 1.83 Ga data from
Laurentia show two distinct groups of directions
(Table 1). Group A (case A) has moderate shallow,
and Group C (case C) very steep inclinations, res-
pectively (case B is a modification of A, see Table
1). Since moderate inclinations are observed in
coeval data from three provinces of Laurentia
(Churchill, Coronation and THO), we interpret this
case to represent the consolidated Laurentia at mode-
rate latitudes ( a). Case C, with steep inclinations, is
derived from THO data only and forces Laurentia to
high latitudes (Fig. 7b; Meert, 2002). The second
possibility is that there was a large (Manikewan)
ocean between THO and the remaining Laurentia at
1.83 Ga (Symons and MacKay, 1999). A third
possibility, which we favour, is that the steep inclina-
tions from THO are not primary (see also Buchan et
al., 2000).
For other continents, the data are too scarce to
examine their tectonic coherence during the Protero-
zoic (see e.g., Onstott and Hargraves, 1981;
D’Agrella-Filho et al., 1996; Nomade et al., 2001;

Table 1
Paleomagnetic poles used for reconstructions
Craton Formation DR, IR (j) Plat (jN) Plong (jE) A95 (j) Age (Ma) References
Reconstruction at 2.45 Ga
B Russian Karelian
dykes,
D’ comp.
312, � 15 10.0 256.0 – 2446F 5/4 Mertanen et al., 1999
L Matachewan dykes 208, � 31 � 42.0 238.0 3.0 2446–2473 Bates and Halls, 1990
Au (WA) Widgiemooltha
dykes
69, 68 � 9.0 157.0 8.0 2418–2420 Evans, 1968;
Nemchin and
Pidgeon, 1998
K Ongeluk lavas 264, � 25 1.0 281.0 5.0 2442 Evans et al., 1997;
Bekker et al., 2001
Reconstruction at 2.00 Ga
L Minto dykes 300, 46 38.0 174.0 10.0 1998F 21 Buchan et al., 1998
U Gabbro monzonite 33, 34 51.0 156.0 8.0 19991–20011 Elming et al., 2001a;
Skobelev et al., 1991
U Gabbro diabase 45, 52 53.0 127.0 13.0 20007 Elming et al., 2001a
U Mean Ukraine 38, 44 53.0 142.0 – 2000 this work
Am Oyapok tonalites 304, � 53 28.0 166.0 14.0 2036F 142 Nomade et al., 2001
Am Encrucijada pluton 323, � 4 53.0 202.0 4.0 2064F 874,
1958F 455Onstott et al., 1984b;
Nomade et al., 2001
Am Mean Amazonia 315, � 33 42.0 181.0 – 2019 this work
C-SF Uaua dykes 24, 67 24.0 331.0 4.0 1983F 314,
2200F 234D’Agrella-Filho and
Pacca, 1998;
Bastos Leal
et al., 1994
WA Liberia M 106, � 16 � 18.0 89.0 13.0 2050F 62 Onstott and
Dorbor, 1987
K Vredefort Ring 3, 62 22.0 27.0 16.0 20231,2 Hargraves, 1970
K Vredefort dykes 7, 57 27.0 31.0 7.0 20231,2 Pesonen et al., 2002
K Bushveld middle
complex
11, 63 20.0 33.0 5.0 2060F 21,4 Hattingh, 1989
K Bushveld upper
complex
10, 66 16.0 32.0 11.0 2061F 271,4 Hattingh, 1989, 1999
K Mean Kalahari 7, 62 21.0 31.0 6.0 2042 this work
Reconstruction at 1.88 Ga
B Vittangi gabbro 345, 33 43.0 228.0 5.0 1886F 141 Elming, 1985
B Kiuruvesi
gabbro–diorites
341, 31 41.0 231.0 4.0 1886F 51 Neuvonen et al., 1981
B Pohjanmaa
gabbro–diorites
335, 28 38.0 239.0 11.0 1879F 51 Pesonen and
Stigzelius, 1972
B Jalokoski gabbro 340, 35 43.0 234.0 7.0 1871F 41 Mertanen and
Pesonen, 1992
B Mean Baltica 341, 31 41.0 233.0 5.0 1881 this work
L Molson dykes,
B comp.
254, 59 27.0 219.0 4.0 1877 + 7/� 41 Halls and
Heaman, 2000
Reconstruction at 1.83 Ga
B Haukivesi dykes 348, 40 48.0 225.0 3.0 18401 Neuvonen et al., 1981
L (Case A,
Churchill)
Sparrow dykes 159, 60 12.0 291.0 8.0 1827F 41 McGlynn et al., 1974;
Bostock and
van Breemen, 1992
(continued on next page)
L.J. Pesonen et al. / Tectonophysics 375 (2003) 289–324 293
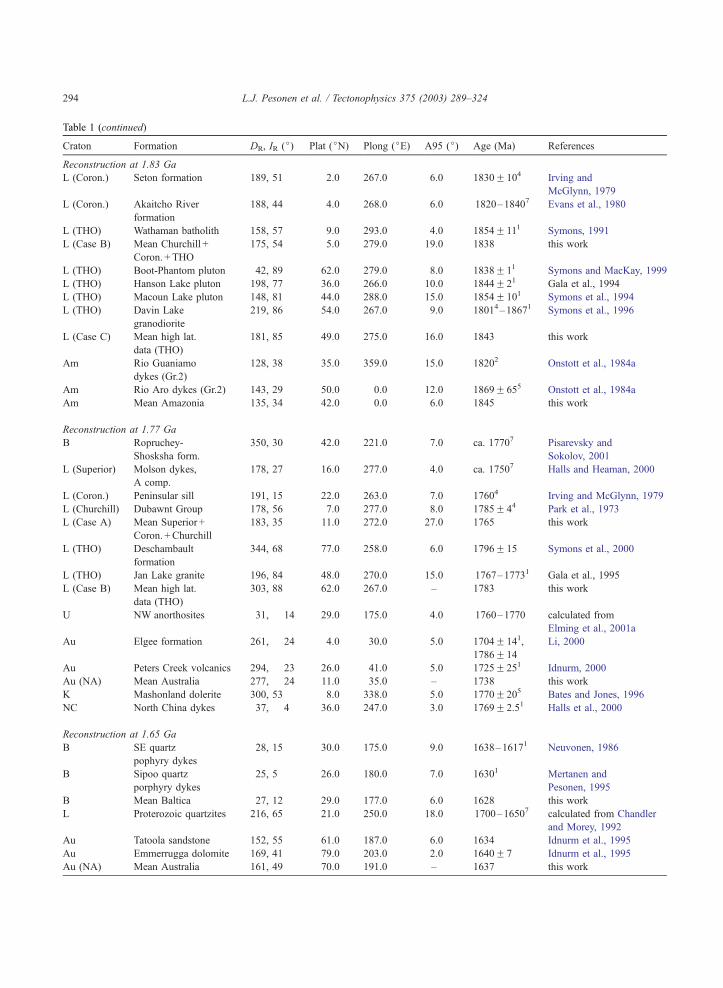
Craton Formation DR, IR (j) Plat (jN) Plong (jE) A95 (j) Age (Ma) References
Reconstruction at 1.83 Ga
L (Coron.) Seton formation 189, 51 2.0 267.0 6.0 1830F 104 Irving and
McGlynn, 1979
L (Coron.) Akaitcho River
formation
188, 44 � 4.0 268.0 6.0 1820–18407 Evans et al., 1980
L (THO) Wathaman batholith 158, 57 9.0 293.0 4.0 1854F 111 Symons, 1991
L (Case B) Mean Churchill +
Coron. + THO
175, 54 5.0 279.0 19.0 1838 this work
L (THO) Boot-Phantom pluton 42, 89 62.0 279.0 8.0 1838F 11 Symons and MacKay, 1999
L (THO) Hanson Lake pluton 198, 77 36.0 266.0 10.0 1844F 21 Gala et al., 1994
L (THO) Macoun Lake pluton 148, 81 44.0 288.0 15.0 1854F 101 Symons et al., 1994
L (THO) Davin Lake
granodiorite
219, 86 54.0 267.0 9.0 18014–18671 Symons et al., 1996
L (Case C) Mean high lat.
data (THO)
181, 85 49.0 275.0 16.0 1843 this work
Am Rio Guaniamo
dykes (Gr.2)
128, 38 � 35.0 359.0 15.0 18202 Onstott et al., 1984a
Am Rio Aro dykes (Gr.2) 143, 29 � 50.0 0.0 12.0 1869F 655 Onstott et al., 1984a
Am Mean Amazonia 135, 34 � 42.0 0.0 6.0 1845 this work
Reconstruction at 1.77 Ga
B Ropruchey-
Shosksha form.
350, 30 42.0 221.0 7.0 ca. 17707 Pisarevsky and
Sokolov, 2001
L (Superior) Molson dykes,
A comp.
178, 27 � 16.0 277.0 4.0 ca. 17507 Halls and Heaman, 2000
L (Coron.) Peninsular sill 191, 15 � 22.0 263.0 7.0 17604 Irving and McGlynn, 1979
L (Churchill) Dubawnt Group 178, 56 7.0 277.0 8.0 1785F 44 Park et al., 1973
L (Case A) Mean Superior +
Coron. + Churchill
183, 35 � 11.0 272.0 27.0 1765 this work
L (THO) Deschambault
formation
344, 68 77.0 258.0 6.0 1796F 15 Symons et al., 2000
L (THO) Jan Lake granite 196, 84 48.0 270.0 15.0 1767–17731 Gala et al., 1995
L (Case B) Mean high lat.
data (THO)
303, 88 62.0 267.0 – 1783 this work
U NW anorthosites 31, � 14 29.0 175.0 4.0 1760–1770 calculated from
Elming et al., 2001a
Au Elgee formation 261, � 24 � 4.0 30.0 5.0 1704F 141,
1786F 14
Li, 2000
Au Peters Creek volcanics 294, � 23 26.0 41.0 5.0 1725F 251 Idnurm, 2000
Au (NA) Mean Australia 277, � 24 11.0 35.0 – 1738 this work
K Mashonland dolerite 300, 53 8.0 338.0 5.0 1770F 205 Bates and Jones, 1996
NC North China dykes 37, � 4 36.0 247.0 3.0 1769F 2.51 Halls et al., 2000
Reconstruction at 1.65 Ga
B SE quartz
pophyry dykes
28, 15 30.0 175.0 9.0 1638–16171 Neuvonen, 1986
B Sipoo quartz
porphyry dykes
25, 5 26.0 180.0 7.0 16301 Mertanen and
Pesonen, 1995
B Mean Baltica 27, 12 29.0 177.0 6.0 1628 this work
L Proterozoic quartzites 216, 65 21.0 250.0 18.0 1700–16507 calculated from Chandler
and Morey, 1992
Au Tatoola sandstone 152, 55 � 61.0 187.0 6.0 1634 Idnurm et al., 1995
Au Emmerrugga dolomite 169, 41 � 79.0 203.0 2.0 1640F 7 Idnurm et al., 1995
Au (NA) Mean Australia 161, 49 � 70.0 191.0 – 1637 this work
Table 1 (continued)
L.J. Pesonen et al. / Tectonophysics 375 (2003) 289–324294

Craton Formation DR, IR (j) Plat (jN) Plong (jE) A95 (j) Age (Ma) References
Reconstruction at 1.65 Ga
Am Rio Aro basic
dolerites (Gr.1)
320, � 3 50.0 203.0 9.0 16403,5 Onstott et al., 1984a
Am Roraima dolerites
(Gr.1)
335, 22 63.0 231.0 9.0 16403,5 Hargraves, 1968
Am La Escalera basic
dykes (Gr.1)
328, 22 56.0 226.0 12.0 16403,5 Onstott et al., 1984a
Am Mean Amazonia 330, 17 59.0 222.0 8.0 1640 this work
Reconstruction at 1.50 Ga
B Rodo dykes 5, 30 42.0 202.0 10.0 15137 Moakhar and Elming,
1998; Andersson, 1997
B Mardsjo gabbro 42, 28 33.0 157.0 7.0 15241 Moakhar and Elming,
1998; Andersson, 1997
B Mean Ragunda
formation
28, 50 52.0 167.0 7.0 15051 Piper, 1979;
Andersson, 1997
B Gavle granite 35, 28 35.0 165.0 10.0 15001 Piper, 1980;
Andersson, 1997
B Halleforsnas dyke 36, 13 27.0 167.0 7.0 1518F 384 Piper, 1980
B Mean Baltica 30, 31 39.0 171.0 16.0 1512 this work
L St. Francois Mtn 234, 9 � 13.0 219.0 7.0 1476F l61 Meert and Stuckey, 2002
Au (NA) Mt Isa block
intrusions IM
185, 49 � 79.0 111.0 8.0 1550–1500 Tanaka and Idnurm, 1994
Sb Kuonamka dykes 52, � 25 6.0 234.0 20.0 1503F 51 Ernst et al., 2000
Reconstruction at 1.25 Ga
B Vaasa dolerites 45, � 23 7.0 164.0 4.0 1268F 131 Neuvonen, 1966
B Satakunta dolerites 52, � 27 2.0 158.0 4.0 1264F 121 Neuvonen, 1965
B Market dolerites 67, � 32 � 6.0 146.0 9.0 1265F 61 Neuvonen and
Grundstrom, 1969
B Mean Baltica 52, � 24 4.0 158.0 4.0 1265 this work
L Sudbury dykes 262, 2 � 3.0 192.0 3.0 1235 + 7/–31 Schwarz and Buchan,
1982; Dudas
et al., 1994
L Mackenzie dykes 268, 12 4.0 190.0 5.0 1267 + 7/–31 Buchan and Halls,
1990; LeCheminant
and Heaman, 1989
L Mean Laurentia 265, 8 1.0 191.0 – 1251 this work
Am Nova Floreste 303, � 56 26.0 163.0 6.0 1200 Tohver et al., 2002
C-SF Late Kibaran
intrusives
107, 3 � 17.0 113.0 8.0 1236F 242 Meert et al., 1994
C-SF Late Kibaran
intrusives (rot.)
139, 37 � 47.0 78.0 8.0 1236 this work
Reconstruction at 1.15 Ga
L Abitibi dykes 278, 65 43.0 208.0 – 1141F1 Ernst and Buchan,
1993; Krogh
et al., 1987
L (Greenl.) Giant gabbro dykes 261, 71 42.0 226.0 9.0 1163F 2 Piper, 1977;
Buchan et al., 2001
L (Greenl.) Giant gabbro
dykes (rot.)
270, 70 44.0 219.0 9.0 1163F 2 this work
L Mean Laurentia 274, 68 44.0 214.0 – 1156 this work
Table 1 (continued)
(continued on next page)
L.J. Pesonen et al. / Tectonophysics 375 (2003) 289–324 295
Craton Formation DR, IR (j) Plat (jN) Plong (jE) A95 (j) Age (Ma) References
Reconstruction at 1.15 Ga
Au (NA) Lake view dolerite 340, 84 � 10.0 131.0 17.0 1140 Duff and
Embleton, 1976
K Premier kimberlite 203, � 34 � 41.0 235.0 7.0 1165F 10 Powell et al., 2001
Grunehogna Ahlmanryggen 244, 1 � 9.0 240.0 6.0 1183F 333 Peters, 1990
Grunehogna Ahlmanryggen (rot.) 210, 66 � 64.0 225.0 6.0 1183F 333 this work
Grunehogna Ritscherflya
Supergroup
236, � 6 � 8.0 232.0 4.0 1130F 10 Powell et al., 2001
Grunehogna Ritscherflya
Supergroup (rot.)
202, 62 � 61.0 209.0 4.0 1130F 10 Powell and Li, 1994
K Mean Kalahari-
Grunehogna
197, 34 � 56.0 225.0 23.0 1159 this work
Reconstruction at 1.10 Ga
B Bamble intrusions 7, � 34 7.0 201.0 8.0 975–11203 Stearn and Piper, 1984
B Bamble-Kongsberg
amphibolites
0, � 54 � 8.0 208.0 6.0 975–11203 Poorter, 1975
B Nenset-Gumoy hyperite 352, � 40 3.0 215.0 8.0 10407 Stearn, 1979
B Mean Baltica 0, � 44 1.0 208.0 16.0 1093 this work
L Portage Lake volcanics 288, 38 27.0 181.0 2.0 1095F 31 Halls and Pesonen,
1982; Books, 1972
L Keweenawan
dykes, R +N
287, 61 44.0 197.0 11.0 1102 Green et al., 1987;
Powell et al., 2001
L Mean Laurentia 287, 51 36.0 188.0 – 1099 this work
Au (NA) IA dykes 306, 83 � 12.0 124.0 11.0 1116F 10 Duff and
Embleton, 1976
C-SF Olivenca basic
dykes R
301, 66 10.0 280.0 6.0 1078F 182,
1180–7703D’Agrella-Filho
et al., 1990
K Timbavati gabbros 190, � 1 � 63.0 227.0 3.0 1098F 30 Hargraves
et al., 1994
K Umkondo combined 185, 3 � 66.0 217.0 7.0 1100F 5 Jones and
Powell, 2001
K Post Waterberg
diabases
191, 4 � 65.0 231.0 5.0 1090F 15 Jones and
McElhinny, 1966
K Mean Kalahari 188, 2 � 65.0 225.0 5.0 1096 this work
Co Coats Land Nunatak 94, � 43 23.0 80.0 7.0 1112F 41 Gose et al., 1997
Reconstruction at 1.05 Ga
B Laanila-Ristijarvi
dykes
356, � 47 � 2.0 212.0 14.0 10376 Mertanen et al., 1996
L Nonesuch shale +
Freda sst.
278, 5 6.0 179.0 3.0 10507 Henry et al., 1977
Au (WA) Bangemall sills 337, 42 34.0 95.0 – 1070F 61 Wingate et al., 2002
SF Itaju do Colonia
dykes
280, 77 � 8.0 291.0 9.0 1010–10803 D’Agrella-Filho
et al., 1990
SF Salvador basic
dykes R
304, 71 7.0 287.0 13.0 1070 D’Agrella-Filho, 1992
C-SF Mean Congo-Sao
Francisco
294, 75 � 0.5 289.0 – 1058 this work
K Ntimbankulu
intrusion
129, � 26 � 27.0 147.0 13.0 1030–10607 Mare and Thomas, 1997
K Kalkpunt
formation
168, � 12 � 57.0 183.0 – 1065 Briden et al., 1979;
Onstott et al., 1986
Table 1 (continued)
L.J. Pesonen et al. / Tectonophysics 375 (2003) 289–324296
Table 1 (continued)
Craton Formation DR, IR (j) Plat (jN) Plong (jE) A95 (j) Age (Ma) References
Reconstruction at 1.05 Ga
K Mean Kalahari 149, � 20 � 43.0 160.0 – 1055 this work
Sb Malgina formation 72, � 59 � 25.0 231.0 3.0 1043F 148 Gallet et al., 2000;
Ovchinnikova et al., 2001
Reconstruction at 1.00 Ga
B Protogine zone
dolerites
356, � 57 � 12.0 211.0 7.0 980–1041 Pisarevsky and
Bylund, 1998
L Jacobsville sandstone 267, � 17 � 9.0 183.0 4.0 ca. 1000 Roy and
Robertson, 1978
L Grenville A comp. 286, � 62 � 29.0 149.0 15.0 ca. 1000 Berger et al., 1979
L Mean Laurentia 275, � 44 � 20.0 167.0 – 1000 this work
SF Ilheus basic dykes 237, 70 � 30.0 280.0 4.0 1011–10122 D’Agrella-Filho
et al., 1990
SF Olivenca basic
dykes N
260, 76 � 16.0 287.0 8.0 1010–1080 D’Agrella-Filho
et al., 1990
SF Salvador basic
dykes N
281, 83 � 10.0 301.0 15.0 1003–10212 D’Agrella-Filho, 1992;
D’Agrella-Filho
et al., 1998
C-SF Mean Congo-Sao
Francisco
253, 77 � 19.0 290.0 22.0 1020 this work
K W O’Kiep intrusion 121, � 53 � 9.0 159.0 8.0 1020F 304 Muller et al., 1978
K O’Kiep intrusions 124, � 46 � 15.0 155.0 16.0 1020F 304 Piper, 1975
K Central Namaqua
metamorphics
114, � 46 � 8.0 150.0 10.0 1050F 501,5,
1000F 202Onstott et al., 1986;
Renne et al., 1990
K Mean Kalahari 12, � 49 � 11.0 155.0 9.0 1023 this work
Sb Sette-Daban Sills 108, 11 � 4.0 177.0 2.0 1005F 4 Pavlov et al., 1992;
Rainbird et al., 1998
For cratons, see Figs. 1 and 2. B =Baltica, L=Laurentia (Coron. = Coronation Geosyncline, THO=Trans Hudson Orogen), Au =Australia (WA,
NA, SA=West, North and South Australia, respectively), K =Kalahari, U =Ukraine, Am=Amazonia, C-SF =Congo-Sao Francisco, WA=West
Africa, NC=North China, Sb = Siberia, Co =Coats Land. DR, IR refer to declination, inclination of a central reference location for each craton/
continent. Reference locations: Baltica: 64jN, 28jE, Laurentia: 60jN, 275jE, Ukraine: 47jN, 30jE, Australia: NA: 20jS, 135jE, WA: 27jS,120jE, SA: 30jS, 135jE, Amazonia: 0j, 295jE, Sao Francisco: 13jS, 315jE, Congo: 5jS, 23jE, Kalahari: 25jS, 25jE,Kalahari +Grunehogna: 50jS, 15jE, West Africa: 15jS, 355jE, Coats Land: 75jS, 340jE, Siberia: 60jN, 105jE, North China: 40jN,115jE. Plat, Plon are the latitude and longitude of the paleomagnetic pole. A95 is the 95% confidence circle of the pole (Irving, 1964). Rot
means that the pole has been rotated. In 1.15 Ga, reconstruction Grunehogna is rotated to Kalahari by an anticlockwise rotation of 56.28j about
a pole at 9.67j S, 328.77jE (Powell and Li, 1994). Ages (Ma), dating method = 1: U–Pb, 2: Ar–Ar, 3: K–Ar, 4: Rb–Sr (whole rock), 5: Rb–
Sr (mineral), 6: Sm–Nd, 7: geological age, 8: Pb–Pb.
L.J. Pesonen et al. / Tectonophysics 375 (2003) 289–324 297
Idnurm, 2000; Mertanen and Pesonen, submitted for
publication).
4. Age bins
Fig. 2 shows the age distribution of the accepted
poles. The following terminology is used. The age bin
is a median value of a narrow age band for which
poles are available from two or more continents. This
band is generally less than 60 Ma in width (i.e.,
binning age F30 Ma). The reconstructions are named
according to these bins (e.g., 2.45, 2.00 Ga, etc). Our
survey of the dated poles revealed that at certain bins
there are poles from two or more continents making
reconstructions feasible at these times. Twelve bins
were chosen and they are 2.45, 2.00, 1.88, 1.83, 1.77,
1.65, 1.50, 1.25, 1.15, 1.10, 1.05 and 1.00 Ga,
respectively (Fig. 2). These poles and their ages are
listed in Table 1 and the corresponding continental
reconstructions are shown in Figs. 4–16. In some
cases, the age estimates for the poles fall outside the
designated age bin and provide an additional degree
of freedom in our reconstructions. It arises from the

Fig. 2. The distribution of the ages of poles from each continent/craton. Star indicates a key-pole and closed circle denotes other reliable pole as
explained in text.
L.J. Pesonen et al. / Tectonophysics 375 (2003) 289–324298
drift of the continents during the age band and
amounts roughly to F5j (at maximum) depending
on the drift rate (Buchan et al., 2000). The main error
arises from the uncertainty in the pole and is
expressed by the 95% confidence circles of the mean
poles in Table 1.
Fig. 3. The principle of the palaeomagnetic technique for making
reconstructions (see also Buchan et al., 2000). A and B are
hypothetical continents plotted in correct latitudes and orientations
as based on palaeomagnetic poles. Only northern hemisphere option
for continent A is shown. Positions a–d show continent B in four
possible positions along a latitude circle defined by palaeomagnetic
data. cV and c are positions for B allowed by the errors in
palaeolatitudes. Positions e–h in the opposite hemisphere (with B
upside down) can also be used in seeking better geological
matchings between A and B. See text for details.
5. Reconstruction techniques
The principle of our palaeomagnetic technique for
making reconstructions is outlined in Fig. 3 (see also
Buchan et al., 2000). To simplify, only two hypothet-
ical continents, A and B, are shown. A palaeomag-
netic pole at time t places A and B in correct latitudes
(defined by the inclinations) and orientations (defined
by the declinations), respectively. Both hemispheres
are possible and only the ‘‘northern’’ one for continent
A is shown. Continent B (or A) can be moved into
any position along this latitude circle since the palae-
olongitude is undetermined due to axial symmetry of
the dipole field. This is analogous to the ‘closest
approach’ technique of Meert (2002). Four such
locations are drawn for B (positions a–d). One of
them (c) is in juxtaposition with A. The geological
features are then drawn on both continents to seek
L.J. Pesonen et al. / Tectonophysics 375 (2003) 289–324 299
possible continuations from A to B. If we found
acceptable geological matchings we kept A and B
together (position c). If not, we kept A and B
separated. Occasionally, in order to find the best
possible match, continent B is plotted in opposite
hemisphere (with inverted orientation) as shown by
positions e–h in Fig. 3. This is also allowed since we
do not know the true polarities for A and B.
Each pole has a palaeomagnetic uncertainty as
expressed by the values of the 95% confidence circles
in Table 1. These values range from 3j to 27j with an
average of 9.2j. A further error up toF5j (maximum)
is to be added due to the age uncertainty of the poles
as described previously (Chapter 2). These errors
together can lead roughly to ca. F5–15j uncertainty
in palaeolatitudes of the continents (up to 1500 km).
This is demonstrated schematically in Fig. 3, where
continent B is plotted at 15j higher (cV), or 15j lower
(c) latitude positions from its mean position (c).
The palaeomagnetic and geologic data show fur-
ther that at certain times (e.g., 2.00 Ga) the continents
have been separated. At some other times, there is
strong palaeomagnetic and geologic evidence that
large landmasses (not necessarily supercontinents)
existed, e.g., Kenorland 2.45–2.10 Ga and Hudson-
land 1.83–1.25 Ga, respectively. In one case, the
Neoproterozoic Rodinia, a supercontinent is strongly
supported by palaeomagnetic and geological data.
Fig. 4. The reconstruction of continents at 2.45 Ga. Data available
from Laurentia, Australia, Baltica and Kalahari (Table 1). Karelia
(Baltica), Superior (Laurentia) and West Australian (Australia) are
shown in dark shading. Dyke swarms are shown as sticks and they
are: Matachewan (Laurentia), Russian Karelian (Baltica) and
Widgiemooltha (West Australia), respectively. Orthogonal projec-
tion with 20j tilt.
6. Piercing points
Dalziel (1999 and references therein) has proposed
a set of piercing points in making continental recon-
structions. These include matching of conjugate rifts
or orogenic belts, correlating major lineaments, dyke
swarms, isotope age provinces, magmatic provinces
and lithostratigraphic data, etc. Other useful geologi-
cal piercings include the identification of source
provinces of detrital zircons, the study of the Sm–
Nd or Rb–Sr isotope systematics, and analysis of
thermal subsidence curves (Burrett and Berry, 2000;
Karlstrom et al., 2001; Sircombe, 2001).
In addition to these geological piercing points, we
used the following palaeomagnetic criteria in validat-
ing the reconstructions:
(i) The magnetic polarity had to be the same from
one continent to another during the lifetime of the
assembly. Since we do not know the ‘‘absolute’’
polarity during Proterozoic, we sought distinct polar-
ity patterns (e.g., long single polarity intervals) from
one continent to another (e.g., Pesonen and Neuvo-
nen, 1981; Pesonen, 1983; Buchan et al., 2000).
(ii) The drift rates, and the sense of drifts of the
cratons had to be comparable during the lifetime of
the assembly. The rates should not have exceed
markedly the Cenozoic rates (e.g., Meert et al., 1993).
(iii) The palaeomagnetic latitudes were compared
with those provided by sedimentological latitude
indicators (e.g., Pesonen et al., 1989; Pesonen,
1992; Elming et al., 1993).
7. Continental reconstructions during the
Proterozoic
7.1. Reconstruction at 2.45 Ga
Fig. 4 shows the positions of Laurentia, Baltica,
Australia and Kalahari at f2.45 Ga (Table 1).
Laurentia, Baltica and Kalahari lie near the equator

L.J. Pesonen et al. / Tectonophysics 375 (2003) 289–324300
whereas Australia (Yilgarn) is clearly at higher
(southern) latitudes. The Matachewan (Bates and
Halls, 1990) and Karelian (Mertanen et al., 1999)
dyke swarms become parallel in this configuration
suggesting that Laurentia (Superior) and Baltica
(Karelia) were united at 2.45 Ga. The Widgie-
mooltha dyke (f2.42 Ga) of the Yilgarn craton
has a similar trend as the Matachewan-Karelia
swarms in this assembly, but its distance to the latter
swarms is more than 40j in latitude, an observation
which does not support a close relationship between
Australia and Laurentia–Baltica at 2.45 Ga. So far
there is no information on 2.45-Ga-old dykes in
Greenland, which lies between the Superior-Karelia
unity and Yilgarn craton (Fig. 4).
The position of Kalahari is based on palaeomag-
netic data of the Ongeluk lavas of South Africa (age
2.49–2.39 Ga; Evans et al., 1997; Bekker et al.,
2001). Kalahari may have been attached with Baltica
in the west or with Laurentia in the east, respectively
(Fig. 4). Similar lithostratigraphic sequences are docu-
mented in Kalahari, Baltica and Laurentia during
2.45–2.20 Ga (Bekker et al., 2001), which support
their proximity. We place the Kalahari craton slightly
away from Baltica–Laurentia at 2.45 Ga since there
are no 2.45-Ga-old dykes or other geological features
in Kalahari to adjust its position more accurately.
Heaman (1997) has proposed that the 2.45-Ga
mafic formations reflect a mantle plume (see also
Ernst and Buchan, 2001), which could explain the
parallel trends of the Matachewan-Karelian swarms
and the associated intrusive activity in Wyoming and
Karelia, respectively. A mantle plume has also been
proposed for the origin of Ongeluk magmatism in
Kalahari (Eriksson and Reczko, 1998). Heaman
(1997) interprets the 2.45-Ga dyke activity as a global
event marking the onset of rifting of the Kenorland
supercontinent (as defined by Williams et al., 1991) of
which the Superior and Wyoming cratons were mem-
bers. Our data support this and suggest further that
other cratons (e.g., the Kaapvaal craton of Kalahari)
were also members of Kenorland. The palaeomagnetic
data are too scarce to say whether Kenorland was a
true supercontinent, or merely an agglomeration of
few continents. Aspler and Chiarenzelli (1998) have
included also Siberia in Kenorland. They also discuss
Zimvaalbara, a second large landmass at 2.45 Ga as
the presumed southern companion of Kenorland.
Their Zimvaalbara is composed of the Zimbabwe,
Kaapvaal and Pilbara cratons. However, our palae-
omagnetic data show that the Kaapvaal craton was
likely a part of Kenorland at 2.45 Ga. We do note
further that it is possible that the Yilgarn craton of
Australia, located in high southerly latitudes (Fig. 4),
was a member of Zimvaalbara in Early Proterozoic.
Between 2.40 and 2.22 Ga, the Superior, Karelia
and Kalahari cratons experienced one to three succes-
sive glaciations (Marmo and Ojakangas, 1984; Sturt et
al., 1994; Williams and Schmidt, 1997; Bekker et al.,
2001). It is noteworthy that the glaciogenic sequences
also contain paleoweathering zones (regoliths or
palaeosols), lying generally on top of the glaciated
layers. These Early Proterozoic supracrustal strata
with glaciogenic and palaeoweathering layers are
lithostratigraphically similar to Neoproterozoic strata
that also contain glaciogenic layers and palaeowea-
thering zones (e.g., Evans, 2000). Moreover, in both
cases (Early Proterozoic and Neoproterozoic), the
palaeomagnetic data point to low, and even equatorial,
latitudes (V45j) during glaciations (e.g., Williams
and Schmidt, 1997; Evans, 2000; Evans et al.,
1997). Taking Laurentia as an example, it maintained
a low latitude position from 2.45 to 2.00 Ga (Figs. 4
and 5) during the time when the glaciations took place
(e.g., Williams and Schmidt, 1997; Buchan et al.,
1998). For the other continents we do not have
reliable palaeomagnetic data to show their latitudinal
positions during the Early Proterozoic glaciations.
Tentatively, Baltica appears to be at low to interme-
diate latitudes during 2.45–2.15 Ga (Neuvonen et al.,
1997; Mertanen et al., submitted for publication).
Various models have been presented to explain the
late Neoproterozoic low-latitude glaciations. These
include (i) the ‘‘Snowball Earth’’ hypothesis (Kirsch-
vink, 1992; Hoffman and Schrag, 2002), (ii) the
concept of a large Earth’s obliquity (Williams,
1993), (iii) the non-dipole model of the geomagnetic
field (Kent and Smethurst, 1998; Van der Voo and
Torsvik, 2001) and (iv) the remagnetisation explana-
tion (Meert and Van der Voo, 1994). These explan-
ations are also possible for the Early Proterozoic
glaciations. If models (iii) and (iv) turn out to be
valid, our palaeomagnetic reconstructions would be in
error. The sedimentary indicators of palaeolatitudes
during Early Proterozoic are controversial since the
low latitudes are supported by palaeoweathering

Fig. 5. The reconstruction of continents at 2.00 Ga. Data available
from Laurentia, Congo/Sao Francisco, Amazonia, West Africa,
Kalahari and Ukraine. The shaded areas in the West Africa craton
represent mainly Eburnean cratonized areas (the Man block to the
right and the Reguibat block to the left, Trompette, 1994) and in the
Amazonia craton they represent the Guyana Shield (to the right) and
the Guapore Shield (to the left), respectively (see e.g. Bettencourt et
al., 1999). Note the low to intermediate latitudinal locations of the
continents. For explanation, see Fig. 4.
L.J. Pesonen et al. / Tectonophysics 375 (2003) 289–324 301
observations during 2.40–2.2 0 Ga. The occurrence of
both glacial deposits and paleoweathering zones with-
out an obvious hiatus suggests that rapid climatic
changes took place during the 2.40–2.22 Ga interval
(Sturt et al., 1994; Bekker et al., 2001). Further
palaeomagnetic studies of the 2.40 -to 2.20-Ga old
units, coupled with U–Pb isotope determinations, are
required to explain the apparent development of low-
latitude, low-elevation continental glaciations.
The timing of breakup of Kenorland is not known
precisely. Evidence of rifting at ca. 2.45 Ga in Kenor-
land come from the igneous activity (e.g., dykes) and
concomitant developments of sedimentary basins in
Laurentia, Kalahari andKarelia (Heaman, 1997; Aspler
and Chiarenzelli, 1998; Bekker et al., 2001). At ca.
2.20–2.10 Ga, Baltica and Laurentia experienced an-
other rifting episode as evidenced by passive margin
sediments and widespread mafic dyke activity (e.g.,
Vuollo et al., 1995). It is possible that the rifting at 2.20–
2.10 Ga led to breakup of Kenorland and separation
of Laurentia and Baltica. The rifting has been linked to
the observed global peak in the B13C-curve at 2.15 Ga
(e.g., Karhu and Holland, 1996; Bekker et al., 2001).
7.2. Reconstruction at 2.00 Ga
Palaeomagnetic data for 2.00 Ga come from Lau-
rentia, Kalahari, West Africa, Congo/Sao Francisco,
Amazonia and Ukraine (Fig. 5; Table 1). These
continents occupy low (Laurentia, Amazonia, West
Africa and Ukraine) to moderate (Congo/Sao Fran-
cisco, Kalahari) latitudes. The 2.00 Ga configuration
of the continents resembles (but is not the same) the
present plate tectonic framework where most of the
continents are separated. From 2.45 to 2.00 Ga,
Laurentia drifted into low northerly latitudes and
rotated more than 100j anticlockwise. This rotation
is not a consequence of the polarity ambiguity since
the result is based on sequential and precisely (U–Pb)
dated palaeopoles of mafic dykes from Laurentia
ranging in age from 2.45 to 1.97 Ga (Buchan et al.,
2000). Unfortunately, there are no reliable data from
Baltica during this period to constrain its drift history
(but see Pisarevsky and Sokolov, 1999). The position
of Baltica at 1.93 Ga (Mertanen and Pesonen, 1994) is
different from that at 2.45 Ga, suggesting that it also
underwent a period of considerable drift and rotation
during this interval.
Tentative palaeomagnetic data from Baltica also
support the low to intermediate latitudinal positions of
Baltica during 2.20–1.97 Ga (Neuvonen et al., 1997;
Pisarevsky and Sokolov, 1999). Sedimentological
(palaeoclimatological) latitude indicators, such as
stromatolites, black shales, shungites, phosphate
deposits and evaporities in Baltica of the age of ca.
2.2–2.0 Ga are consistent with Baltica remaining at
low latitudes during 2.45–2.0 Ga (Perttunen, 1970;
Aikas, 1989; Lager and Loberg, 1990; Loukola-Rus-
keeniemi and Heino, 1996; Melezhik et al., 1999).
At 2.00 Ga, the Amazonian, Congo/Sao Francis-
can, West African, Ukrainian and Kalahari cratons are
plotted separately from each other because there are
no obvious geologic reasons for putting them together.
However, several cratons experienced tectonic acitiv-
ity also at that time. The Trans-Amazonian orogen in
South America took place at 2.20–2.00 Ga (Hart-
mann, 2002). Coeval orogenic belts also exist in West
Africa (Ledru et al., 1994). Nomade et al. (2001)
argue that part of Amazonia (the Guyana Shield) and
West Africa, which are geologically similar, may have
been in juxtaposition at 2.00 Ga based on palaeo-
magnetic evidence from the two cratons. This is

L.J. Pesonen et al. / Tectonophysics 375 (2003) 289–324302
allowed by present palaeomagnetic data (Fig. 5) since
both cratons lie at low southerly latitudes and can be
assembled together.
7.3. Reconstruction at 1.88 Ga
The period of 1.90–1.80 Ga is well known geo-
logically. Large amounts of juvenile crust were added
to the continents, and black shales, banded iron
formations (BIFs) and shallow marine phosphates
were deposited indicating warm climatic conditions
(Condie, 1998; Condie et al., 2001). These deposits
may point to the existence of a supercontinent at low
latitudes (Condie, 2002), or to an association of
continents with a mantle superplume (Condie et al.,
2001; Rogers and Santosh, 2002).
Unfortunately, at 1.88 Ga, reliable poles are avail-
able only from Baltica and Laurentia to test these
ideas (Fig. 6). Laurentia appears to have been rotated
ca. 45j clockwise from its 2.00 Ga position (Figs. 5
and 6). However, the 1.88-Ga position of Laurentia is
based on a controversial Molson dykes B-pole of
Fig. 6. The reconstruction of continents at 1.88 Ga. Data available
from Laurentia and Baltica (see also Buchan et al., 2000). Baltica is
shown in two possible positions. The ca. 1.90–1.80 Ga orogenic
belts in Laurentia are shown with darker shading and they are: N,
Nagssugtoqidian; T, Torngat; THO, Trans-Hudson Orogen; P,
Penokean; W, Woopmay; K, Ketilidian. The corresponding belts
in Baltica are: K-L, Kola-Lapland; S, Svecofennian. For explan-
ation, see Fig. 4 and text.
Halls and Heaman (2000; see also Zhang et al.,
1994; Halls and Hanes, 1999). The corresponding
pole from Baltica (mean of several ca. 1.88 Ga
gabbros), and hence Baltica’s position, is well estab-
lished, but the age of the pole is uncertain since the
magnetisation ages of the slowly cooling plutons may
be 10–20 Ma younger than their crystallization age of
1.88 Ga (see Buchan et al., 2000; Mertanen and
Pesonen, submitted for publication). However, we
note that Laurentia and Baltica form a large landmass
at low to intermediate latitudes consistent with occur-
rences of evaporites and phosphates in both continents
indicating warm palaeoclimates during deposition
(Aikas, 1989; Elming et al., 1993; Condie et al.,
2001 and references therein).
Two models are offered to explain the Laurentia–
Baltica unity and the tectonic belts that were formed
when they collided during 1.90–1.80 Ga (Fig. 6). In
model 1, Baltica is placed south of Greenland and in
model 2 at the NE corner of Greenland. The first
alternative is similar to models by Park (1991),
Patchett and Arndt (1986), Gorbatschev and Bogda-
nova (1993) and Bridgwater et al. (1990) within the
uncertainties involved. Others (e.g., Hoffman, 1989;
Gower, 1990; Poorter, 1981) place Baltica along the
eastern margin of Greenland, but in ca. 60j anticlock-
wise position relative to Laurentia.
The first model provides the following scenario to
explain the ca. 1.90–1.80 Ga orogenic belts in Lau-
rentia–Baltica. After rifting at ca. 2.15 Ga ago, both
continents drifted independently untilf1.93 Ga. Sub-
sequently, Laurentia collided with Baltica from the
north causing the Nagssugtoqidian and Torngat oro-
gens in Laurentia and the Kola-Lapland orogen in
Baltica (Fig. 6; e.g., Park, 1994; Pesonen et al.,
2001a,b). The plate tectonic processes causing these
collisional belts are poorly known. It is likely that in
addition to the collision between Laurentia and Baltica,
there was additional assembly of the individual cratons
within Laurentia (e.g., Slave and Rae/Hearne) and in
Baltica (Kola and Karelia). The complexity of these
collisions is manifested by the anastomosing network
of 1.93–1.88 Ga orogenic belts separating the Arch-
aean cratons (Fig. 6). Park (1991) and Buchan et al.
(2000) discuss inmore detail how the oblique pattern of
these belts are formed during these collisions.
In addition to the above-mentioned belts, a colli-
sion with a third unknown continent may be respon-

Fig. 7. The reconstruction of continents at 1.83 Ga. Data available
from Laurentia, Baltica and Amazonia. The 1.90–1.80 Ga
Svecofennian–Hudsonian orogenic belts in Laurentia and Baltica
shown in dark are the same as in Fig. 6. The coeval Ventuari–
Tapajos belt in Amazonia is added. (a) Laurentia is represented by
the pole of Sparrow dykes from the Superior province (case A in
Table 1). Amazonia is shown in two possible positions (1 and 2)
depending of the polarity choice of the 1.83-Ga Amazonian pole.
Previously (e.g., Pesonen et al., 2001a,b), the position (2) was used.
Position (1) is consistent with current geological thinking (e.g.,
Geraldes et al., 2001). It allows Amazonia to be contiguous with
Laurentia–Baltica in the Hudsonland assembly as discussed in text.
(b) Laurentia is represented by a group of poles (case C) with steep
inclinations from the Trans-Hudson Orogen (THO). For explan-
ation, see Fig. 4.
L.J. Pesonen et al. / Tectonophysics 375 (2003) 289–324 303
sible for at least some of the 1.93–1.88 Ga orogenic
belts (see Park, 1994). Candidates for this ‘third con-
tinent’ include North China, Australia or Siberia. Each
of these have 1.93–1.88 Ga orogenic belts; the Trans-
North China Orogen in China, the Capricorn orogen in
Australia and the Stanovoy block in Siberia (e.g.; Halls
et al., 2000; Zhao et al., 2000; Wilde et al., 2002).
7.4. Reconstruction at 1.83 Ga—the assembly of
Hudsonland
Palaeomagnetic data for 1.83 Ga reconstruction
come from Laurentia, Baltica and Amazonia (Table
1, Fig. 7). The position of Baltica is based on a well-
defined pole from the Haukivesi lamprophyres of
Finland (Neuvonen et al., 1981). The choice of the
corresponding pole for Laurentia is more difficult
since Laurentia may not have been consolidated yet
(see above). For this reason, two cases (A, Fig. 7a; C,
Fig. 7b) for Laurentia are presented (case B in Table 1
is a modification of A). In case A (intermediate
inclinations), Laurentia is consolidated and repre-
sented by the 1.83-Ga Sparrow dyke pole from
Churchill Province (McGlynn et al., 1974). This pole
places Laurentia at intermediate latitudes (Fig. 7a).
Table 1 shows that this position is supported by data
from two other provinces, the Coronation Geosyn-
cline and the Trans-Hudson orogenic belt (THO).
Case C places Laurentia at high polar latitudes (Fig.
7b). This position is defined by data from THO only
(e.g., Symons and MacKay, 1999; see Table 1). Meert
(2002) used this latter option to test possible models
of Columbia supercontinent assembly. We favour case
A for two reasons. First, rigorous field tests are
lacking from the THO to show that the magnetisations
are primary although the high inclination data are
derived from numerous studies over a wide geograph-
ic area. Second, although Proterozoic glaciations are
not necessarily indicative of high latitudes, there is no
palaeoclimatological evidence for nearly polar lati-
tudes of Laurentia at 1.83 Ga.
A comparison of Figs. 6 and 7a shows that from 1.88
to 1.83 Ga, Laurentia has remained nearly in the same
latitude but it experienced a large and rapid f80jclockwise rotation. Baltica has drifted slightly north-
wards without significant rotation before docking with
Laurentia. If the collision of Laurentia and Baltica
occurred nearer to 1.88 Ga, then the palaeomagnetic
Fig. 8. The reconstruction of continents at 1.77 Ga. Data available
from Laurentia, Baltica, Congo/Sao Francisco, North China, Ukraine
and Kalahari. Laurentia is represented by poles from the Superior
craton (case A in Table 1). The new orogenic belts (shown in black),
which are formed after the Svecofennian–Hudsonian belts (shown
in grey) in Figs. 6 and 7, are: Y, Yavapai (Laurentia); T, TIB (Trans
Scandinavian Igneous Belt, Baltica); A, Arunta (Australia). See also
Karlstrom et al. (2001). For explanation, see Fig. 4.
L.J. Pesonen et al. / Tectonophysics 375 (2003) 289–324304
data indicate relative rotations and latitudinal shifts
during docking (e.g., Wilson, 1990; Nironen, 1997).
The position of Amazonia at 1.83 Ga is problematic.
Two possibilities (positions 1 and 2 in Fig. 7a) are
shown depending on the polarity choice for Amazonia.
Previously (e.g., Pesonen et al., 2000; Pesonen et al.,
2001a,b; Elming et al., 2001a; Pesonen and Mertanen,
2002), Amazonia has been placed in the same latitude
as Baltica (position 2). This lead us to propose that the
Svecofennian orogenic belt in Baltica (1.88–1.86 Ga)
and the coeval Ventuari-Tapajos belt in Amazonia, and
also the successively younger belts like the TIB I belt in
Baltica and the Rio Negro-Juruena belt in Amazonia,
were caused by a prolonged collision of Baltica with
Amazonia during ca. 1.88–1.50 Ga. In spite of this
earlier assertion, we note that the current geological
data (e.g. Geraldes et al., 2001) from Amazonia cannot
confirm the assumption and the sense of subduction is
similar in both continents making the link more diffi-
cult to argue on geologic grounds. Therefore, we now
suggest that the position 1, where Amazonia is in the
southern hemisphere (and upside down from position
2) and, within error limits, in a laterally contiguous
position with Laurentia–Baltica, is better thanmodel 2.
According to present (model 1) reconstruction, Ama-
zonia is not facing Baltica in the same latitude but is
contiguous with Baltica. Current geological thinking
(e.g., Bettencourt et al., 1996; Tassinari et al., 2000;
Ahall and Larson, 2000; Geraldes et al., 2001) also
favour the idea that the coeval belts in Laurentia,
Baltica and Amazonia are accretional and formed
during Cordilleran-type subduction and arc accretion
fromwest onto a convergent margin because these belts
become successively younger towards west in all three
continents. Moreover, this model allows also the sub-
sequently younger orogenic belts, such as the Gothian/
Kongsbergian (in Baltica), Labradorian/Mazatzal (in
Laurentia) and the Rondonia-San Ignacio (in Amazo-
nia) belts, to be formed in accretions from west of this
laterally contiguous landmass.
The assembly of Laurentia, Baltica and possibly
Amazonia at 1.83 Ga (model 2) marks the onset of
Hudsonland development (after Williams et al., 1991).
This large continent probably involved other conti-
nents, too, such as Australia, Siberia and North China,
although palaeomagnetic data are still lacking from
them at 1.83 Ga. A similar large continental assembly
(but not identical) called Columbia has also been
proposed for this period (Rogers and Santosh,
2002; Meert, 2002) although our palaeomagnetic data
show that these Columbia configurations differ from
Hudsonland.
7.5. Reconstruction at 1.77 Ga
Reliable palaeomagnetic data at 1.77 Ga come
from Laurentia, Baltica, North China, Australia,
Ukraine and Kalahari (Fig. 8). These continents,
belonging to Hudsonland, remain at low to interme-
diate latitudes during 1.83–1.77 Ga. The position of
Baltica is based on the key pole from the Shoksha
sediments and Ropruchey sill of Russian Karelia
(Fedotova et al., 1999; Pisarevsky and Sokolov,
2001). Laurentia is represented by two data sets, but
only the low inclination case (case A in Table 1; see
previous discussion) is studied here.
The pre-1.77 Ga palaeomagnetic data from
Ukraine differ from coeval data from Baltica suggest-
ing that the two continents were separated before 1.77
Ga (e.g., Elming et al., 2001a,b; Bogdanova, 2001).
Fig. 8 shows that at 1.77 Ga Ukraine is slightly

L.J. Pesonen et al. / Tectonophysics 375 (2003) 289–324 305
separated from Baltica and probably on its way to
dock with Baltica from the south. The docking takes
place sometime between 1.77-1.70 Ga (Elming et al.,
2001a,b; Bogdanova, 2001).
The 1.77 Ga configuration of Baltica and Laurentia
differs from that at 1.83 Ga, suggesting a ca. 25jlatitudinal movement and minor anticlockwise rota-
tion of Laurentia relative to Baltica during 1.83–1.77
Ga. Most likely, however, this difference reflects poor
palaeomagnetic data of Laurentia rather than real
movements (Table 1). It is possible that the long-
lasting accretion to the western margin of the com-
bined Laurentia–Baltica landmass was not a singular
event but also included some relative movements
along transform faults between the accreting blocks
(Wilson, 1990; Nironen, 1997). It is also possible that
the docking of Ukraine with Baltica triggered minor
block rotations within Baltica (Bogdanova, 2001). If
the data from Laurentia turn out to be valid, the
difference of the Laurentia–Baltica configurations
between 1.83 and 1.77 Ga implies that they were
separated at 1.77 Ga. We consider this unlikely since
the geologically similar TIB 1 (in Baltica) and Yava-
pai/Ketilidian (in Laurentia) belts (e.g., Karlstrom et
al., 2001; Ahall and Larson, 2000) become laterally
contiguous when reconstructed according to palae-
omagnetic data of the age of 1.83 and 1.25 Ga.
The configuration of Laurentia, Baltica and North
China in the Hudsonland configuration at 1.77 Ga is
similar with that of Halls et al. (2000). However,
Meert (2002) places Laurentia at high southerly lat-
itudes and the position of Baltica is antipodal to the
reconstruction given here. We do note that this ‘alter-
native position’ was not necessarily advocated strong-
ly in that paper as the author was merely trying to
show a closest approach to Laurentia. It is worthwhile
to note that Australia may also be part of Hudsonland
at 1.77 Ga (Fig. 8). Idnurm and Giddings (1995) show
a reconstruction between Australia and Laurentia
during 1.70–1.60 Ga ago, which differs from our
model. The model of Idnurm and Giddings (1995)
places Australia close to the SWEAT configuration of
Moores (1991), whereas our data suggest that Aus-
tralia is not compatible with either the SWEAT or
AUSWUS configuration. Karlstrom et al. (2001)
stress that geological data of the 1.80- to 1.40-Ga
belts from Laurentia–Baltica landmass continue into
eastern Australia in their reconstruction, which is
palaeomagnetically possible within the uncertainties
involved. (Fig. 8). We shifted Australia slightly off
from Laurentia–Baltica assembly (see also Brook-
field, 1993; Blewett et al., 1998; Idnurm and Gid-
dings, 1995; Li, 2000; Burrett and Berry, 2000;
Karlstrom et al., 2001).
Unfortunately, no palaeomagnetic data from Ama-
zonia are available at 1.77Ga to test whether it remained
in its 1.83 Ga position relative to other Hudsonland
continents (e.g., Laurentia, Baltica) to this time.
Geological data, such as mafic dykes and rapa-
kivi–anorthosite occurrences, can be used to test the
1.77-Ga configuration. There are several genetic mod-
els to explain the episodic rapakivi–anorthosite mag-
matic pulses. For example, the rapakivi magmatism
has been explained in terms of their relationship to
supercontinents (Ramo and Haapala, 1995; Hoffman,
1989; Bettencourt et al., 1999); as representing the
distal expressions of the long lasting accretional
margins of continents (Ahall and Larson, 2000); or
caused by collisional orogenies between cratons (e.g.,
collision of Ukraine with Baltica; Bogdanova, 2001).
Whatever the correct explanation for rapakivi magma-
tism, the occurrence of coeval rapakivi magmatism
during the Proterozoic suggests that the continents
have been close to each other.
Four pulses of rapakivi magmatism are known
during the Proterozoic and these are: 1.80–1.77,
1.69–1.65, 1.58–1.53, 1.43–1.39 and the early Neo-
proterozoic pulse, respectively (e.g., Ramo and Haa-
pala, 1995; Bettencourt et al., 1999; Dall’Agnol et al.,
1999). From the above pulses, the 1.80- to 1.77-Ga-
old rapakivi–anorthosites are known in Ukraine,
South Greenland, North China and North Australia
(Ramo and Haapala, 1995) implying that these con-
tinents may have been close to each other at this time.
This idea gains some support from palaeomagnetism
(Fig. 8) since all these four cratons are at nearly same
equatorial latitudes. We return to the role of rapakivi
magmatism later in analysing the Hudsonland config-
uration of continents in more detail.
7.6. Reconstruction at 1.65 Ga
Current geological models for Laurentia, Amazo-
nia and Baltica favour that the post-1.83 Ga orogenic
belts, such as Yavapai/Mazatzal and Labradorian belts
in Laurentia, the TIB II and Gothian/Kongsbergian

L.J. Pesonen et al. / Tectonophysics 375 (2003) 289–324306
belts in Baltica and the Rio Negro Juruena and
Rondonia-San Ignacio belts in Amazonia are formed
along the convergent continental margin by prolonged
subduction and arc accretions onto this long contigu-
ous landmass comprising Laurentia, Baltica and Ama-
zonia. Palaeomagnetic data can be used to test these
ideas at 1.65 Ga.
For the 1.65 Ga reconstruction, palaeomagnetic
data are available from Laurentia, Baltica, Australia
and Amazonia (Fig. 9, Table 1). The Baltica pole is
derived from quartz porphyre dykes in southern Fin-
land and is considered as key pole. The Laurentian
Fig. 9. The reconstruction of continents at 1.65 Ga. Data available from La
successively after the belts shown in Fig. 8 are: Y-M, Yavapai-Mazatzal;
Negro-Juruena (Amazonia). (a) The positions of Amazonia and Baltica a
Models (a) and (b) are based on palaeomagnetic data of Table 1. (c) Curr
Geraldes et al., 2001), which is in contrast with presently available palae
pole is a mean pole derived from Proterozoic quartzite
bodies from the Mid-Continent region with poorly
defined ages between 1.70 and 1.60 Ga (Chandler and
Morey, 1992; see also Kean and Mercer, 1986). The
Amazonian pole is a mean of three dyke swarms and
is also poorly dated at ca. 1.64 Ga. The Australian
pole is an average of two sedimentary formations and
is reasonably well dated at ca. 1.65 Ga (Idnurm,
2000). These data allow us to consider three possible
models for the continents at 1.65 Ga (Fig. 9a–c).
The first model (Fig. 9a) is based strictly on the
available palaoemagnetic data of Table 1 and follows
urentia, Baltica, Amazonia and Australia. The orogenic belts formed
Lb, Labradorian (both in Laurentia); G, Gothian (Baltica); R-J, Rio
s shown in Pesonen et al. (2001a). (b) An alternative model of (a).
ently favoured geological model (see, e.g., Ahall and Larson, 2000;
omagnetic data as discussed in text. For explanation, see Fig. 4.

Fig. 10. The reconstruction of continents at 1.50 Ga. Data available
from Laurentia, Baltica, Siberia and Australia. Rapakivi granites of
the age of 1.60–1.50 Ga are marked as black dots. For explanation,
see Fig. 4.
L.J. Pesonen et al. / Tectonophysics 375 (2003) 289–324 307
our previous interpretation regarding the position of
Amazonia relative to Laurentia–Baltica (e.g., Pesonen
et al., 2001a,b and references therein). In this model,
Amazonia and Baltica are in the same low northerly
latitudes close to each other. According to the previ-
ous model at 1.83 Ga (Fig. 7a), the Gothian/Kongs-
bergian and Rio Negro-Juruena belts were formed by
collision of Amazonia with Baltica. This continent–
continent collision model is now discounted for two
reasons. First, these belts are accretional and not
collisional, involving juvenile magma production in
both continents. Second, these successive orogenic
belts show a westward younging and are therefore less
likely to have formed by a simple collisional model
between Amazonia and Baltica.
In model 2 (Fig. 9b), Baltica and Amazonia are in
the same equatorial latitude but now Amazonia has
been inverted using the opposite polarity for the palae-
omagnetic data. Thus, although both Baltica and Ama-
zonia experience subduction and arc accretion, these
processes represent the closure of two distinct oceans.
The coeval Gothian-Labradorian and the Rio Negro-
Juruena belts are thus formed by two separate events.
Fig. 9c shows model 3, which is based on geological
reasoning (e.g., Sadowski and Bettencourt, 1996; Bet-
tencourt et al., 1996; Ahall and Larson, 2000; Geraldes
et al., 2001; Sadowski, 2002). Amazonia is in a
laterally contiguous position with the Laurentia–Bal-
tica landmass following the 1.83-Gamodel 1 in Fig. 7a.
However, a strict interpretation of the palaeomagnetic
data at 1.65 Ga does not support this model since it
would require Baltica to be shifted 15j to north and
Amazonia 15j to south, respectively, which exceeds
the errors in Table 1. We do note that neither the poles,
nor their ages, are particularly well constrained for this
time period and therefore this model cannot be rejected
a priori.
The proposed configuration of Hudsonland at 1.65
Ga (Fig. 9c) is different from Columbia superconti-
nent models by Rogers and Santosh (2002) and by
Meert (2002). For example, our data places Amazonia
in close connection with Baltica–Laurentia landmass
at this time and not with West Africa and Kalahari as
in Rogers and Santosh (2002).
One of the major peaks of rapakivi–anorthosite
pulses took place during 1.58–1.53 Ga (Ramo and
Haapala, 1995; Bettencourt et al., 1999; Dall’Agnol et
al., 1999). The coeval occurrences of bimodal rapakivi
granites and mafic dyke swarms in Baltica, Amazonia
and also in South Australia during ca. 1.58–1.53 Ga
further support the close connection between these
continents in the Hudsonland configuration (Ahall and
Larson, 2000). This rapakivi activity is consistent with
a hot spot underlying the Baltica–Amazonia–Aus-
tralia landmass (Pesonen et al., 1989; Moakhar and
Elming, 1998). Another possibility is that the coeval
rapakivi–anorthosite magmatism is a distal response
in the foreland for the prolonged accretions that took
place in the continental margin of Baltica–Amazonia
as described previously (Ahall and Larson, 2000).
The position of Australia in the 1.65 Ga reconstruc-
tion is located in the nortwestern side of Laurentia,
fairly close to the SWEATmodel ofMoores (1991) (see
also Ross et al., 1992; Blewett et al., 1998; Idnurm and
Giddings, 1995; Thorkelson et al., 2001). Palaeomag-
netic data allow Australia to be shifted on the other side
of Laurentia as well, which then would bring the 1.7- to
1.6-Ga Arunta belt into close association with the
Labradorian/Gothian and Rio Negro-Juruena belts
(Figs. 8 and 9).
7.7. Reconstruction at 1.50 Ga
Palaeomagnetic data at 1.50 Ga come from Lau-
rentia, Baltica, Australia and Siberia (Fig. 10). The

L.J. Pesonen et al. / Tectonophysics 375 (2003) 289–324308
assembly of Laurentia–Baltica at 1.50 Ga differs from
the 1.83 Ga configurations. This could indicate inde-
pendent drift of Baltica and Laurentia from 1.83 to
1.50 Ga (e.g., Pesonen and Neuvonen, 1981). The
poles of Baltica for the 1.50 Ga, however, show large
scatter (Table 1; Moakhar and Elming, 1998). More-
over, the Baltica mean pole (age 1.52 Ga) for this
reconstruction is 40 My older than the corresponding
Laurentian pole (St. Francois Mountains pole, Table
1; Meert and Stuckey, 2002) which may explain part
of the discrepancy. Taking into account the age
difference and the large uncertainties in the poles, at
present, we cannot verify if Laurentia and Baltica
were indeed joined at 1.50 Ga (see also Ahall and
Connelly, 1998; Buchan et al., 2000).
The position of Australia in Fig. 10 on the western
coast of Laurentia is consistent with the AUSWUS
configuration of Karlstrom et al. (2001) for 1.6–1.3
Ga. The close connection of Australia and Laurentia
at 1.50 Ga is therefore possible as discussed by
Karlstrom et al. (2001) and is based on continuation
of geological belts from Laurentia to Australia in this
reconstruction. The palaeomagnetic data thus suggest
that Australia was also part of Hudsonland. The
occurrence of ca. 1.60–1.50 Ga rapakivi intrusions
in Australia further support the idea that Australia was
in close connection with Laurentia–Baltica and Ama-
zonia at 1.50 Ga. However, it is important to note that
the paleomagnetic data alone do not constrain the
AUSWUS configuration as the only possibility (see
Meert and Torsvik, 2003).
Palaeomagnetic data allow Siberia to be in contact
with northern Laurentia at 1.50 Ga. This position is
similar to that by Hoffman (1991) and is based on
preliminary palaeomagnetic data of Ernst et al. (2000).
They point out that the errors in pole positions and
ages are so large that it is impossible to totally rule out
other reconstructions, including that favoured by
Sears and Price (2000; see also Meert and Stuckey,
2002) where Siberia is on the western coast of
Laurentia. One of the major unanswered questions
with regard to this proposed connection is the exact
timing of the Siberia–Laurentia collision.
A recent criticism of the various Siberia–Laurentia
connections was noted by Pisarevsky et al. (2003) and
Pisarevsky and Natapov (2003). These papers note
that almost all the Meso-Neoproterozoic margins in
Siberia are oceanic margins (either active or passive)
and therefore a close connection between Siberia and
Laurentia is not strongly supported by their relative
tectonic settings.
The exact timing of Hudsonland (or Columbia)
breakup is often related to the emplacement of
ca.1.52–1.38 Ga rapakivi–anorthosite magmas (Rog-
ers and Santosh, 2002). This magmatism is well
documented in Laurentia, SW Baltica and Amazonia
(e.g., Dall’Agnol et al., 1999; Ahall et al., 2000;
Rogers and Santosh, 2002). Another possibility is that
the breakup occurred much later (ca. 1.25 Ga) when a
number of rift basins, graben formation and dyke
intrusions occur globally (see below).
Laurentia and Baltica remained probably in low
latitudes from 1.50 to 1.25 Ga (Buchan et al., 2000).
Preliminary comparisons of palaeomagnetic poles
from the ca. 1.4-Ga-old red beds of the Sibley
Peninsula (Laurentia) and Satakunta-Ulvo (Baltica)
(e.g., Pesonen and Neuvonen, 1981; Pesonen et al.,
1991; Elming et al., 1993) support the 1.50- and 1.25-
Ga reconstructions within the uncertainties involved.
Buchan et al. (2000) mention that the palaeomagnetic
data from the ca. 1.3-Ga-old Nairn anorthosite of
Laurentia suggest that it remained at low latitudes
during ca. 1.40–1.30 Ga, also consistent with low-
latitude position of Laurentia at that time.
7.8. Reconstructions at 1.25 Ga
Fig. 11a shows the 1.25-Ga assembly of Laurentia,
Amazonia, Baltica and Congo/Sao Francisco (Table 1).
These continents are located at low to intermediate
latitudes at 1.25 Ga. This configuration of Laurentia–
Baltica is similar to that of Poorter (1981), Gower
(1990), Park (1992) and Karlstrom et al. (2001) at ca.
1.3 Ga. Amazonia is here placed in a contiguous
position with Laurentia–Baltica following the models
of Hudsonland in Figs. 7–9. New palaeomagnetic data
from Tohver et al. (2001, 2002) place Amazonia further
south and west off the Llano uplift region of Texas.
The relative position of Baltica–Laurentia at this
time is roughly the same as during 1.83 Ga, although
it has rotated as a unity by 80j anticlockwise and
drifted southwards. This configuration is independent
of the polarity ambiguity since the data of 1.25-Ga
mafic dykes from both continents are of single polar-
ity (Pesonen and Neuvonen, 1981; Buchan et al.,
2000).
Fig. 11. The reconstruction of continents at 1.25 Ga. Data available
fromLaurentia, Baltica, Congo/Sao Francisco andAmazonia. The ca.
1.25 Ga dyke swarms in Laurentia (Mackenzie) and Baltica (Jotnian)
are shown as black sticks. The thick arrows shows the drift direction of
Congo/Sao Francisco and Baltica with respect to their position in the
next configuration at 1.15 Ga (Fig. 13). For explanation, see Fig. 4.
L.J. Pesonen et al. / Tectonophysics 375 (2003) 289–324 309
The 1.25-Ga assembly of Baltica–Laurentia is
supported by geological data. We have previously
(Buchan et al., 2000; Pesonen and Mertanen, 2002)
shown that the 1.71- to 1.65-Ga-old Labradorian–
Gothian belts will be aligned in this configuration.
The rift-related post-Jotnian dykes and sills in central
Baltica are probably associated with the huge Mack-
enzie rifting and mafic dyke event in NE Laurentia.
Fig. 12. The arrows show the axes of directions of the maximum susce
Greenland and Baltica, in (a) present-day coordinates and (b) when restore
Zig-Zag basalts (Greenland); S, Satakunta-Ulvo sills (Baltica) (see Elming
Ernst and Buchan (2001) have proposed that the fan-
shaped Mackenzie dyke swarm could be a signature
of a mantle plume occurring at 1.25 Ga in NW
Laurentia. Elming and Mattson (2001) have shown
that the Central Scandinavian dolerite activity is more
widespread in Baltica than previously thought extend-
ing now into northwestern Sweden, towards Green-
land (Figs. 11 and 12). The trends of dykes in Baltica
(Jotnian dykes; Bylund and Pesonen, 1987) and
Laurentia (Mackenzie dykes; Ernst and Buchan,
2001) become contiguous in this reconstruction (Fig.
11), although the former is distinctly less abundant
than the latter (in Baltica the dolerites appear mainly
as sills).
Elming and Mattson (2001) have shown that the
lineation of the anisotropy of susceptibility (AMS),
which is a measure of the magma flow direction, of
the sills in Sweden and those in NE Greenland (the
Midsommerso sill and Zig-Zag basalts; Marcussen
and Abrahamsen, 1983) have different orientations
in present-day configuration but becomes parallel
when stored to the 1.25-Ga configuration (Fig. 12).
These sills in Baltica and Laurentia have tholeiitic
compositions and intra-continental origin, thus sup-
porting a joint Laurentia–Baltica assembly at that
time. The tensional regime reflected by the sill intru-
sions indicates that rifting between Laurentia and
Baltica probably began at 1.25 Ga. This rifting is
envisaged in several rift-related grabens in these
continents, e.g., the Satakunta-Ulvo graben with red
sandstones and mafic dyke intrusions in Finland and
Sweden, the coeval Sibley red bed sequence and the
ptibility (AMS) in the 1.25-Ga-old diabase sills and basalts from
d to the 1.25-Ga reconstruction of Fig. 11. The symbols denote: Z,
and Mattson, 2001).
L.J. Pesonen et al. / Tectonophysics 375 (2003) 289–324310
Mackenzie-Sudbury dyke swarm in Canada. We pro-
pose that this rifting is a signature of the breakup of
the Hudsonland landmass at 1.25 Ga and may have
been enhanced by a mantle plume in the center of
Hudsonland (Ernst and Buchan, 2001). In this respect,
it is worthwhile to note that the 1.25-Ga dyke activity
is a global one and is well documented in several
continents (e.g., Kibaran intrusives in Congo, Western
Gardar dykes in South Greenland, Midsommerso
dolerites in North Greenland, Mount Isa dykes in
Australia, Westfold Hills dykes in Antarctica, Wutai-
Talhang dykes in S. China and the Gnowangerup
dykes in India; see Ernst et al., 1996; Rogers and
Santosh, 2002). Unfortunately, palaeomagnetic data
from dykes are only available from Laurentia–Baltica
to see if the dykes support the mantle plume model.
7.9. Reconstruction at 1.15 Ga
Only three continents, Laurentia, Australia and
Kalahari yielded reliable data for the 1.15-Ga recon-
struction (Fig. 13, Table 1). The rapid southward drift
of Laurentia is defined by the sequence of 1.14–1.00
Ga palaeomagnetic data (e.g., Halls and Pesonen,
1982; Buchan et al., 2001; Weil et al., 1998; Powell
Fig. 13. The reconstruction of continents at 1.15 Ga. Data available
from Laurentia, Australia, Kalahari and Grunehogna. The arrow
indicates the onset of the rapid southward movement of Laurentia
during the Keweenawan times, just before the assembly of
continents into Rodinia. For explanation, see Fig. 4.
and Li, 1994; Meert and Torsvik, 2003). We position
Australia closer to the AUSWUSmodel of Karlstrom et
al. (2001) for this time period; however, recent palae-
omagnetic data from the Bangemall Basin in western
Australia suggest that neither AUSWUS nor SWEAT
may be valid for this time period (Wingate et al., 2002).
7.10. Reconstruction at 1.10 Ga—the onset of
Rodinia
After 1.25 Ga, Baltica separated from Laurentia and
started its journey to southern hemisphere. This sepa-
ration marks the opening of the hypothetical Congo
Sea between Laurentia and Baltica (e.g., Pesonen et
al., 2001a,b; Fig. 14). The southerly drift of Baltica
between 1.25 and 1.10 Ga is associated with a ca. 80jclockwise rotation and ca. 15j southward movement.
This rotation, suggested by Poorter (1975), Patchett
and Bylund (1977) and Pesonen and Neuvonen
(1981), is based on palaeomagnetic data from the
Sveconorwegian Province. The agreement of dyke
poles from Northern Baltica (Laanila-Ristijarvi dykes,
and the Kautokeino-Karasjokk dykes; see Mertanen et
al., 1996) with the poles from the Sveconorwegian
terrane of SW Baltica is in contrast with Romer (1996)
who interprets the Sveconorwegian APW track by
local tectonism in the Sveconorwegian province.
Moreover, the shape of the Grenvillian and Sveconor-
wegian APW tracks (see e.g., Powell et al., 2001) are
strikingly similar, which is unlikely to be the case if
local block movements have taken place.
Figs. 11 and 14 show that, unlike Baltica, the
orientation of Laurentia remains constant from 1.25
to 1.10 Ga, with only latitudinal drift taking place,
supporting the independent drift of Laurentia and
Baltica during 1.25–1.10 Ga. Congo/Sao Francisco
also began to drift to southern hemisphere at ca. 1.25
Ga, (Fig. 11), while Amazonia started to move north-
west towards Laurentia (Fig. 11).
At about 1.10 Ga, several continents amalgamated
together (Fig. 14). This time records the ‘‘first phase’’
of Rodinia collisions and occur at 1.10 Ga, con-
strained by palaeomagnetic data from Laurentia, Bal-
tica, Congo/Sao Francisco, Kalahari-Grunehogna,
Coats Land and Australia. Although no reliable
1.10- to 1.00-Ga-old data from Amazonia are yet
available, we have tentatively placed Amazonia along
the southern margin of Laurentia in Hoffman’s (1991)
Fig. 14. The reconstruction of continents at 1.10 Ga denoting the
assembly time of Rodinia. Data are available from Laurentia,
Baltica, Congo/Sao Francisco, Australia, Kalahari, Grunehogna and
Coats Land. The East Antarctica and India are plotted in their
Gondwana reconstruction. Amazonia is plotted as dashed lines since
no palaeomagnetic data are available. The Grenvillian age collision
belts formed during the assembly of Rodinia are shown with dark
shading and they are: G, Grenville belt (Laurentia); Sn, Sveco-
norwegian belt (Baltica); Ki, Kibaran belt and Ir, Irumide belt (both
in Congo); S, Sunsas belt (Amazonia); NN, Natal-Namaqua belt
(Kalahari) and A-F, Albany-Fraser belt (Australia). For explanation,
see Fig. 4.
L.J. Pesonen et al. / Tectonophysics 375 (2003) 289–324 311
Rodinia configuration. Recent palaeomagnetic data
from Amazonia during 1.60–1.00 Ga (D’Agrella-
Filho et al., 2001a,b) support this interpretation al-
though the new data of Tohver et al. (2002) would
require significant shear motion along the Laurentian
margin to reach the Hoffman configuration. We have
maintained the position of Australia in a position
intermediate between the SWEAT and AUSWUS
configurations and note that neither may be accurate
(see also Meert and Torsvik, 2003).
Fig. 14 depicts several continent–continent colli-
sions at 1.10 Ga. The Congo/Sao Francisco craton
collides with Baltica causing the ‘‘early’’ Grenvil-
lian–Sveconorwegian orogenic belts in these conti-
nents. This is a new tectonic model for the assembly
of Rodinia since previously Congo/Sao Francisco
craton has been thought to collide with Laurentia or
with Amazonia (Weil et al., 1998; Hoffman, 1991;
Dalziel, 1997; see also Meert and Torsvik, 2003). For
the Congo/Sao Francisco craton, possible candidates
for the collisional belt include either the Kibaran (Ki)
or the Irumide (Ir) belts surrounding the Congo–
Tanzania craton (Fig. 14; e.g., Hoffman, 1991; Kroner
et al., 1997; Jacobs et al., 1998). In our model, at
about the same time when Baltica collides with
Congo/Sao Francisco, Laurentia collides with Ama-
zonia producing the early Grenvillian belt (G) in
southern Laurentia and the coeval Sunsas-Aguapei
(S) belt in Amazonia (Fig. 14). We note that all these
‘‘early’’ Grenvillian belts are marginal to the preceed-
ing 1.83–1.40 Ga belts in Laurentia, Baltica and
Amazonia (Fig. 8). A slightly different scenario to
describe the continent–continent collisions and the
formation of Rodinia is presented by Pisarevsky et al.
(2003).
South China and North China were not included
in our Fig. 12 since no palaeomagntic data are
available. The large East Gondwana landmass, com-
prising Australia, East Antarctica and India, was
located to the north of the western coast of Laurentia
(Fig. 14) with Australia at high northern latitudes.
Palaeomagnetic data are available only from Aus-
tralia (Table 1). The East Antarctic craton and India
are plotted together with Australia in their Gondwana
configuration since no palaeomagnetic data are avail-
able from these continents. Meert et al. (1995) and
Meert (2003) argue that East Gondwanaland was not
combined until late Neoproterozoic or even early
Cambrian (see also Fitzsimons, 2000b; Boger et al.,
2001; Powell and Pisarevsky, 2002). If this is true,
then these blocks should be treated as independent
blocks at 1.10 Ga rather than as we present them
here (see also Meert and Torsvik, 2003). Further
palaeomagnetic and age data are needed to solve this
problem.
Several other problems remain to be solved in this
Rodinia model. First, unlike the majority of the
orogenic belts, which are inboard in Rodinia (e.g.,
the Sunsas-Aguapei belt in Amazonia, Grenville belt
in Laurentia, the Sceconorwegian belt in Baltica and
the Albany-Fraser belt in Australia), the Musgrave
belt crosses Australia in its centre, which may imply
collisions between the Gawler and West Australian
cratons of Australia at ca. 1.20 Ga (e.g. Dawson et al.,
2003), which caused this intra-continent orogenic belt.
Also, the coastal Namaqua-Natal belt (NN, Fig. 14) in
Kalahari is facing oceanward in this Rodinia model

Fig. 15. The reconstruction of continents at 1.05 Ga showing the
Rodinia configuration. Data available from Laurentia, Baltica,
Congo/Sao Francisco, Siberia and Kalahari. The other continents
are plotted in their Gondwana reconstruction. Grunehogna is treated
together with Kalahari as explained in text and in Table 1. Siberia is
now located close to Laurentia and Australia and in inverted
position relative to its position in the 1.50 Ga configuration (Fig.
10). For explanation, see Fig. 4.
Fig. 16. The reconstruction of continents at 1.00 Ga. Data available
from Laurentia, Baltica, Congo/Sa o Francisco, Kalahari and
Siberia. See text for discussion. For explanation, see Fig. 4.
L.J. Pesonen et al. / Tectonophy312
and not inboard (Powell et al., 2001; Meert and
Torsvik, 2003). This position of Kalahari is well
constrained by matching the 1.10- to 1.00-Ga APWP
tracks of Laurentia (the Keweenawan track) and the
coeval track of Kalahari (e.g., Weil et al., 1998;
Buchan et al., 2001; Powell et al., 2001); however,
the exact segment of the path is subject to some
controversy (see Meert and Torsvik, 2003). The
outboard orientation of NN may imply that it is
unlikely to be explained by collisions of Kalahari
with Amazonia or with Laurentia, as has been sug-
gested (Dalziel et al., 2000). Our palaeomagnetic
reconstruction may indicate that Kalahari was proba-
bly colliding with India or with those microcontinents
of East Antarctica (Rayner, Prydz Bay, Maud), which
have Grenvillian-age belts. Further palaeomagnetic
data of these microcontinents are needed to better
constrain their relative position in the 1.10-Ga Rodinia
configuration and their possible association with
Kalahari (Fitzsimons, 2000a; Pisarevsky et al., 2003;
Meert and Torsvik, 2003).
7.11. Reconstructions at 1.05–1.0 Ga
Figs. 15 and 16 show the configuration of the
continents during 1.05–1.00 Ga, respectively. The
1.05-Ga time bin marks the final assembly of Rodinia
with possible minor adjustments taking place during
1.05–1.0 Ga. Data are available from Laurentia,
Baltica, Kalahari, Congo/Sao Francisco, Australia
(only for 1.05 Ga) and Siberia. The Congo Sea began
to close sometime after 1.10 Ga by the movement of
Laurentia/Amazonia landmass towards Congo/Sao
Francisco–Baltica landmass (e.g., Pesonen et al.,
2001a). These landmasses aggregated at ca. 1.05 Ga
producing the ‘‘late’’ Grenvillian collisions (Fig. 15).
This scenario predicts that late Grenvillian events
should have occurred in NW Baltica, in Barentia
(Svalbard) and in E Greenland due to the collision
of NE Laurentia with Baltica. Recent U–Pb age data
from East Geenland and from Svalbard reveal ‘‘late’’
Grenvillian ages, which in general support the model
of Fig. 15, although these ‘‘late’’ Grenvillian ages may
be somewhat younger (Peucat et al., 1989; Watt and
Thrane, 2001; Henriksen et al., 2000; Kalsbeek et al.,
2000). Similar late Grenvillian events should also be
observed in NW Congo and NWAmazonia, since the
model predicts that they collide at 1.05 Ga in their
sics 375 (2003) 289–324
Fig. 17. Latitudinal drifts of Laurentia, Baltica, Amazonia and Congo/Sao Francisco during 2.45–1.00 Ga. The drift rates are shown in Table 2.
L.J. Pesonen et al. / Tectonophysics 375 (2003) 289–324 313

L.J. Pesonen et al. / Tectonophysics 375 (2003) 289–324314
amalgamation into Rodinia. Although no palaeomag-
netic data are available from the East Gondwanaland
cratons, geologically many of them have suffered
multiple Grenvillian events during 1.10–0.90 Ga
(Clark et al., 2000; Li et al., 2001; but see also Hartz
and Torsvik, 2002). The known major Grenvillian belt
in SW Laurentia may continue from Laurentia across
central Australia (Albany–Fraser belt, Cape Smith Belt
and theMusgrave belt) and then around East Antarctica
to Kalahari (NN belt) and then to India (Eastern Ghats).
Fig. 15 shows that Australia is further south and
close to the AUSMEX fit of Wingate et al. (2002) at
1.05 Ga (see also Fitzsimmons, 2002). This could
signify that our previous reconstructions (Figs. 8–10)
were in error or that the assembly of Rodinia com-
menced with significant shear motion along the pres-
ent-day coast of western Laurentia.
The position of Siberia in our Rodinia configura-
tion is controversial. The position and orientation of
Siberia at ca. 1.05 Ga (Fig. 15) is very different from
that at 1.50 Ga (Fig. 10) indicating that at sometimes
during 1.50–1.10 Ga Siberia broke away from Lau-
rentia. The position of Siberia is also f90j counter-
clockwise from the reconstruction of Sears and Price
(2000). Siberia can be shifted closer to Australia along
the western margin of Laurentia, which would make
an Australia–Siberia–Laurentia connection possible.
Other people places Siberia adjacent to the northern
margin of Laurentia (e.g. Hoffman, 1991; Condie and
Rosen, 1994; Pelechaty, 1996; Frost et al., 1998;
Rainbird et al., 1998) but in a variety of orientations
Table 2
Drift rates of four cratons
Landmass Period (Ga) Laurentia
(cm year� 1)
Break up of Kenorland 2.45–2.00 + 1.1
2.00–1.88 + 1.2
1.88–1.83 + 0.1
Hudsonland 1.83–1.77 � 3.8
1.77–1.65 + 2.5
1.65–1.50 � 3.2
1.50–1.25 � 0.04
1.25–1.15 + 5.2
1.15–1.10 � 4.1
Rodinia 1.10–1.05 � 6.5
1.05–1.00 � 6.2
Drift rate = latitudinal drift rate. +(�) denotes drift from North to South (So
the time periods are 2.00–1.83, 1.83–1.65 and 1.65–1.25 Ga (see also F
(see Pisarevsky and Natapov, 2003; Pisarevsky et al.,
2003). We chose not to include Siberia as part of
Rodinia during this time interval since the geological
interpretations are controversial (e.g., Condie and
Rosen, 1994; Rainbird et al., 1998) and since Siberia
still lacks firm evidence of Grenvillian ages (Pisar-
evsky and Natapov, 2003).
Fig. 16 shows the Rodinia configuration at ca. 1.00
Ga based on palaeomagnetic data from Laurentia,
Congo/Sao Francisco, Baltica, Kalahari and Siberia
(Table 1). It is possible that some minor modifications
within Rodinia took place during 1.05–1.0 Ga period,
but considering the uncertainties in the pole positions
and their ages, we interpret the 1.00 Ga assembly to
be similar to that at 1.05 Ga, thus indicating that
Rodinia was fully amalgamated at ca. 1.05 Ga.
However, we note here that the positions of the East
Gondwana blocks in Figs. 15 and 16 lack still reliable
data and therefore this conclusion must be verified
with palaeomagnetic data from these blocks.
8. Testing the reconstructions
8.1. Comparisons of drift curves and drift rates
One way to test the validity of the palaeomagneti-
cally made reconstructions and proposed superconti-
nent models is to compare the drift patterns and drift
rates of the member continents. If a supercontinent
model is valid, the drift rates of the participating
Baltica
(cm year� 1)
Amazonia
(cm year� 1)
Congo-Sao-Fr.
(cm year� 1)
– – –
– –
+ 1.3 + 0.02 –
� 1.2 –
� 0.9 + 1.7 –
+ 0.8 –
� 1.3 � 1.3 –
– – –
– – –
� 0.5 – –2.9
� 2.1 – –0.8
uth to North). � indicates that no data are available. For Amazonia,
ig. 17).
L.J. Pesonen et al. / Tectonophysics 375 (2003) 289–324 315
continents should be similar during the lifetime of the
assembly. Due to the paucity of data, we have
attempted this only for Laurentia, Baltica, Amazonia
and Congo/Sao Francisco during 2.45–1.00 Ga. Fig.
17 portrays the temporal drift of these continents as
interpreted in this paper. During the 1.83- to 1.25-Ga
interval, the drift patterns of Laurentia, Amazonia and
Baltica show some similar general characteristics. In
spite of the many caveats noted throughout this paper,
the drift patterns are not totally at odds with the notion
of their inclusion in one or more supercontinents.
We also note that the calculated minimum drift
rates for these continents (Table 2) during the 2.45–
1.0 Ga interval are generally less than 3 cm year�1
and comparable to Cenozoic continental drift rates.
The one exception is during the Keweenawan inter-
val where rates may exceed 6 cm year�1 (Table 2).
These higher velocities during the Keweenawan–
Grenvillian interval have been noted by other authors
(e.g., Powell et al., 2001; Meert and Torsvik, 2003).
There are a number of possible explanations for
these enhanced drift rates including errors introduced
by persistent nondipolar fields (e.g., Pesonen and
Nevanlinna, 1981; Kent and Smethurst, 1998; Van
der Voo and Torsvik, 2001; but see also Ernst and
Buchan, 1993; Gallet and Pavlov, 1996); true polar
wander (Evans, 1998; Meert and Torsvik, 2003) or
enhanced mantle plume activity (Meert and Tamrat,
2003).
9. Conclusions
(1) Palaeomagnetic data suggest that continents
were located at low to intermediate latitudes for much
of the period from 2.45 to 1.00 Ga. Whether this
reflects a real bias, or a fundamental problem with the
axial geomagnetic dipole hypothesis, is debatable.
Sedimentological latitudinal indicators are generally
consistent with this concept with the exception of the
Early Proterozoic period where low-latitude continen-
tal glaciations have been noted.
(2) The data indicate the possibly three large land-
masses existed during the Proterozoic. The configu-
rations of Kenorland, Hudsonland and Rodinia depart
from each other and also from the Pangaea assembly.
The tectonic styles of their amalgamations are also
different reflecting changes in size and thickness of
the cratonic blocks, and in the thermal conditions of
the mantle with time. The oldest, a Neoarchaean
Kenorland, broke up during protracted (or episodic)
riftings ca. 2.45–2.15 Ga ago as manifested by mafic
dyke activity with possibly mantle plume origin and
developments of rift-related sedimentary basins.
(3) The Early Proterozoic Hudsonland was assem-
bled at ca. 1.83–1.77 Ga. The configuration of
Hudsonland is only tentatively known but comprises
of Laurentia, Baltica, Amazonia, Australia, Siberia
and North China. It is suggested that the core of the
Hudsonland is the laterally contiguous Laurentia–
Baltica–Amazonia landmass. Australia was probably
part of Hudsonland and in juxtaposition with the
western margin of Laurentia as suggested by Karl-
strom et al. (2001). Palaeomagnetic data show that the
configuration of Hudsonland differs from the pro-
posed supercontinent Columbia. A characteristic fea-
ture of Hudsonland is a long-lasting accretion
tectonism with new juvenile material added to its
convergent margin. These accretions resulted to pro-
gressively younging, oceanward stepping orogenic
belts in Laurentia, Baltica and Amazonia. The palae-
omagnetic data at 1.65 Ga are, however, in contrast
with this geological model, probably due to problems
in the ages of the poles. The breakup of Hudsonland
may be related to the extensional rapakivi–anorthosite
magmatism at ca. 1.5–1.3 Ga ago as seen in Ama-
zonia and Laurentia but more probably to a global
wide rifting at 1.25 Ga, as manifested by mafic dykes,
sedimentary basins, and graben formations.
(4) The Neoproterozoic supercontinent Rodinia
began to assemble at 1.10 Ga and was fully amal-
gamated at ca. 1.05–1.00 Ga. It consists of most of
the continents and is characterized by multiple
Grenvillian continent–continent collisions. These
belts are generally located inboard of the super-
continental boundaries with the exception of the
Namaqua-Natal Belt (Kalahari craton) and the Mus-
grave Belt of Australia. A new model for these
orogenic belts is proposed which involves multiple
Grenvillian age collisions. The early phase of Gren-
villian tectonism (1.10 Ga) may be related to the
collision of the Congo/Sao Francisco with Baltica,
and Amazonia with Laurentia. Subsequently, these
combined continents assemble into their Rodinia
configuration during a second, slightly younger set
of collisions (1.05–1.00 Ga).
L.J. Pesonen et al. / Tectonophysics 375 (2003) 289–324316
Acknowledgements
This paper is an output of the fourth Nordic
Palaeomagnetic Data Base Workshop, held in
Aarhus, Denmark, 1999 (Abrahamsen et al., 2001).
The workshop was financially supported by the
Danish Natural Science Research Council, the
Department of Earth Sciences in Aarhus and the
Norwegian Research Council. Reconstructions were
prepared using the GMAP for Windows program by
Trond Torsvik and Mark Smethurst (available on
http://www.ngu.dragon.no). We acknowledge helpful
discussions with Ian Dalziel, Rob Van der Voo,
Zheng Xiang Li, Mike Wingate and David Evans.
Chris Klootvijk and Karl-Inge Ahall are acknowl-
edged for their valuable criticism and numerous
constructive improvements. Some of the figures were
drawn by Milan Vnuk. Johanna Salminen and Fabio
Donadini helped in finishing the final manuscript.
We wish to dedicate this paper to the memory of
Chris Powell who worked tirelessly on these and
other fundamental problems of Precambrian geology.
Chris’ dedication and fascination with the big
tectonic picture will always inspire us. Tectonics
Special Research Centre Publication No. 225.
References
Abdelsalam, M.G., Liegeois, J.-P., Stern, R.J., 2002. The Saharan
Metacraton. J. Afr. Earth Sci. 34 (3–4), 119–136.
Abrahamsen, N., Pesonen, L.J., Van der Voo, R., 2001. Palaeomag-
netic databases: 4th Nordic Palaeomagnetic Workshop. Bull.
Geol. Soc. Den. 48, 91–94.
Ahall, K.-I., Connelly, J., 1998. Intermittent 1.53–1.13 Ga magma-
tism in western Baltica: age constraints and correlations within
postulated supercontinent. Precambrian Res. 92, 1–20.
Ahall, K.-I., Larson, S.A., 2000. Growth-related 1.85–1.55 Ga
magmatism in the Baltic Shield. Review addressing the tectonic
characteristics of Svecofennian, TIB 1-related and Gothian
events. Geol. Foren. Stockh. Forh. 122, 193–206.
Ahall, K.-I., Connelly, J.N., Brewer, T.S., 2000. Episodic rapakivi
magmatism due to distal orogenesis: correlation of 1.69–1.50
Ga orogenic and inboard, ‘anorogenic’ events in the Baltic
Shield. Geology 28, 823–826.
Aikas, O., 1989. Phosphate resources in early Proterozoic supra-
crustal rocks, Finland, with reference to the Baltic Shield. In:
Notholt, A.J.G., Sheldon, R.P., Davidson, D.F. (Eds.), Phos-
phate Deposits of the World. Phosphate Rock Resources, vol.
2. Cambridge Univ. Press, Cambridge, pp. 429–436.
Almeida, F.F.M., Brito Neves, B.B., Carneiro, C.D.R., 2000. The
origin and evolution of the South American platform. Earth-Sci.
Rev. 50, 77–111.
Andersson, U., 1997. The sub-Jotnian Stromsbro granite complex at
Gavle, Sweden. Geol. Foren. Stockh. Forh. 119, 159–167.
Aspler, L.B., Chiarenzelli, J.R., 1998. Two Neoarchaean supercon-
tinents? Evidence from the Paleoproterozoic. Sediment. Geol.
120, 75–104.
Bastos Leal, L.R., Teixeira, W., Piccirillo, E.M., Menezes Leal,
A.B., Girardi, V.A.V., 1994. Geocronologia Rb/Sr e K/Ar do
enxame de diques maficos de Uaua, Bahia (Brasil). Geochim.
Bras. 8 (1), 99–114.
Bates, M.P., Halls, H.C., 1990. Regional variation in magnetic
polarity of the Matachewan dyke swarm related to the Ka-
puskasing structural zone, Ontario. Can. J. Earth Sci. 27,
200–211.
Bates, M.P., Jones, D.L., 1996. A palaeomagnetic investigation of
the Mashonaland dolerites, North-east Zimbabwe. Geophys. J.
Int. 126, 513–524.
Bekker, A., Kaufman, A.J., Karhu, J.A., Beukes, N.J., Swart, Q.D.,
Coetzee, L.L., Eriksson, K.A., 2001. Chemostratigraphy of the
Paleoproterozoic Duitschland Formation, South Africa: implica-
tions for coupled climate change and carbon cycling. Am. J. Sci.
301, 261–285.
Bettencourt, J.S., Onstott, T.C., Jesus, T., Teixeira, W., 1996. Tec-
tonic interpretation of 40Ar/39Ar ages on country rocks from the
central sector of the Rio Negro-Juruena province, Southwest
Amazonia Craton. Int. Geol. Rev. 38, 42–56.
Bettencourt, J.S., Tosdal, R.M., Leite Jr., W.B., Payolla, B.L. 1999.
Mesoproterozoic rapakivi granites of the Rodonia Tin Province,
southwestern border of the Amazonian craton, Brazil: I. Recon-
naissance U–Pb geochronology and regional implications. Pre-
cambrian Res. 95, 41–67.
Berger, G.W., York, D., Dunlop, D.J., 1979. Calibration of Grenvil-
lian palaeopoles by 40Ar/39Ar dating. Nature 277, 46–48.
Blewett, R.S., Black, L.P., Sun, S.-S., Knutson, J., Hutton, L.J.,
Bain, J.H.C., 1998. U–Pb zircon and Sm–Nd geochronology
of the Mesoproterozoic of North Queensland: implications for a
Rodinian connection with the Belt supergroup of North Amer-
ica. Precambrian Res. 89, 101–127.
Boger, S.D., Wilson, C.J.L., Fanning, C.M., 2001. Early Paleozoic
tectonism with the East Antarctic craton: the final suture be-
tween east and west Gondwana. Geology 29, 463–466.
Bogdanova, S.V., 2001. AMCG-magmatism as an indicator of ma-
jor tectonic events in proterozoic Baltica. In: Sircombe, K., Li,
Z.X. (Eds.), From Basins to Mountains: Rodinia at the Turn
of Century. Geological Society of Australia Abstracts, vol. 65,
pp. 8–9.
Bond, G.C., Nickeson, P.A., Kominz, M.A., 1984. Breakup of a
supercontinent between 625 Ma and 555 Ma: new evidence and
implications for continental histories. Earth Planet. Sci. Lett. 70,
325–345.
Books, K.G., 1972. Paleomagnetism of some Lake Superior Ke-
weenawan rocks. U. S. Geol. Surv. Prof. Pap. 760 (42 pp.).
Bostock, H.H., van Breemen, O., 1992. The timing of emplace-
ment, and distribution of the Sparrow diabase dyke swarm.
District of Mackenzie, Northwest Territories. Radiogenic age
and isotopic studies, Report 6. Geol. Surv. Can., 49–55.
L.J. Pesonen et al. / Tectonophysics 375 (2003) 289–324 317
Briden, J.C., Duff, B.A., Kroener, A., 1979. Palaeomagnetism of
the Koras Group, northern Cape Province, South Africa. Pre-
cambrian Res. 10, 43–57.
Bridgwater, D., Austrheim, H., Hansen, B.T., Mengel, F., Pedersen,
S., Winter, J., 1990. The Proterozoic Nagssugtoqidian mobile
belt of southeast Greenland: a link between the eastern Canadian
and Baltic shields. Geosci. Can. 17, 305–310.
Brookfield, M.E., 1993. Neoproterozoic Laurentia –Australia fit.
Geology 21, 683–686.
Buchan, K.L., Halls, H.C., 1990. Palaeomagnetism of Protero-
zoic mafic dyke swarms of the Canadian Shield. In: Parker,
A.J., Rickwood, P.C., Tucker, D.H. (Eds.), Mafic Dykes and
Emplacement Mechanisms. A.A. Balkema, Rotterdam, pp.
209–230.
Buchan, K.L., Mortensen, J.K., Card, K.D., Percival, J.A., 1998.
Paleomagnetism and U–Pb geochronology of diabase dyke
swarms of Minto Block, Superior Province, Quebec, Canada.
Can. J. Earth Sci. 35, 1054–1110.
Buchan, K., Mertanen, S., Elming, S.-A., Park, R.G., Pesonen, L.J.,
Bylund, G., Abrahamsen, N., 2000. The drift of Laurentia and
Baltica in the Proterozoic: a comparison based on key paleo-
magnetic poles. Tectonophysics 319, 167–198.
Buchan, K., Ernst, R., Hamilton, M., Mertanen, S., Pesonen, L.J.,
Elming, S.-A., 2001. Rodinia: the evidence from integrated pa-
leomagnetism and U–Pb geochronology. Precambrian Res. 110,
9–32.
Burrett, C., Berry, R., 2000. Proterozoic Australia–Western United
States (AUSWUS) fit between Laurentia and Australia. Geology
28, 103–106.
Bylund, G., Pesonen, L.J., 1987. Paleomagnetism of Mafic Dykes
Swarms with a particular focus on Fennsocandia. In: Halls,
H.C., Fahrig, W. (Eds.), Mafic Dyke Swarms. Geological Asso-
ciation of Canada Special Paper, vol. 34, pp. 289–302.
Cavanaugh, M.D., Seyfert, C.K., 1977. Apparent polar wander
paths and the joining of the Superior and Slave provinces during
early Proterozoic times. Geology 5, 207–211.
Chandler, V.B., Morey, V.B., 1992. Paleomagnetism of the Early
Proterozoic Sioux Quarztite, Southwestern Minnesota—impli-
cations for Correlating Quarztizites of the Baraboo interval.
U.S. Geol. Surv. Bull. 1904-N (14 pp.).
Cheney, E.S., 1996. Sequence stratigraphy and plate tectonic sig-
nificance of the Transvaal succession of southern Africa and its
equivalent in Western Australia. Precambrian Res. 79, 3–24.
Clark, D.J., Hensen, B.J., Kinny, P.D., 2000. Geochronological
constraints for a two stage history of the Albany-Fraser orogen,
Western Australia. Precambrian Res. 102, 155–183.
Condie, K.C., 1998. Episodic continental growth and superconti-
nents; a mantle avalanche connection? Earth Planet. Sci. Lett.
163, 97–108.
Condie, K.C., 2002. Breakup of Palaeoproterozoic supercontinent.
Gondwana Res. 5, 41–43.
Condie, K.C., Rosen, O.M., 1994. Laurentia–Siberia connection
revisited. Geology 22, 168–170.
Condie, K.C., Des Marais, D.J., Abbot, D., 2001. Precambrian
superplumes and supercontinents: a record in black shales,
carbon isotopes, and paleoclimates? Precambrian Res. 106,
239–260.
D’Agrella-Filho, M.S., 1992. Paleomagnetismo de enxames de di-
ques maficos proterozoicos e rochas do embasamento do craton
do Sao Francisco. PhD Thesis. IAG, Sao Paulo University, Sao
Paulo, Brazil. 201 pp.
D’Agrella-Filho, M.S., Pacca, I.G., 1998. Paleomagnetism of Pale-
oproterozoic mafic dyke swarm from the Uaua region, north-
eastern Sao Francisco Craton, Brazil: tectonic implications.
J. South Am. Earth Sci. 11, 23–33.
D’Agrella-Filho, M.S., Pacca, I.G., Renne, P.R., Onstott, T.C., Teix-
eira, W., 1990. Paleomagnetism of Middle Proterozoic (1.01 to
1.08 Ga) mafic dykes in southeastern Bahia State-Sao Francisco
Craton, Brazil. Earth Planet. Sci. Lett. 101, 332–348.
D’Agrella-Filho, M.S., Feybesse, J.-L., Prian, J.-P., Dupuis, D.,
N’Dong, J., 1996. Palaeomagnetism of Precambrian rocks
from Gabon, Congo Craton, Africa. J. Afr. Earth Sci. 22 (1),
65–80.
D’Agrella-Filho, M.S., Trindade, R.I.F., Siqueira, R., Ponte-Neto,
C.F., Pacca, I.G., 1998. Paleomagnetic constraints on the Rodi-
nia supercontinent; implications for its Neoproterozoic break-up
and the formation of Gondwana. Int. Geol. Rev. 40, 171–188.
D’Agrella-Filho, M.S., Pacca, I.G., Siqueira, R., Elming, S.-A.,
Teixeira, W., Bettencourt, J.S., Geraldes, M.C., 2001a. Amazo-
nian Proterozoic Poles: implications to Rodinia paleogeography.
In: Sircombe, K., Li, Z.X. (Eds.), From Basins to Mountains:
Rodinia at the turn of Century. Geological Society of Australia
Abstracts, vol. 65, pp. 27–30.
D’Agrella-Filho, M.S., Cordani, U.G., de Brito Neves, B.B., Trini-
dade, R.I.F., Pacca, I.G., 2001b. Evidence from South America
on the formation and disruption of Rodinia. In: Sircombe, K.,
Li, Z.X. (Eds.), From Basins to Mountains: Rodinia at the Turn
of Century. Geological Society of Australia Abstracts, vol. 65,
pp. 31–34.
Dall’Agnol, R., Costi, H.T., Leite, A., Magalhanes, M., Teixeira,
N.P., 1999. Rapakivi granites from Brazil and adjacent areas.
Precambrian Res. 95, 9–39.
Dalziel, I.W.D., 1995. Earth before Pangea. Sci. Am. 272, 58–63.
Dalziel, I.W.D., 1997. Neoproterozoic-Paleozoic geography and
tectonics: review, hypothesis, environmental speculation. Geol.
Soc. Amer. Bull. 109, 16–42.
Dalziel, I.W.D., 1999. Global Paleotectonics: reconstructing a credi-
ble supercontinent, Nordic Palaeomagnetic Symposium. Aarhus
Geosci. 8, 37–40.
Dalziel, I.W.D., Mosher, S., Gahagan, L.M., 2000. Laurentia –
Kalahari collision and the assembly of Rodinia. J. Geol. 108,
499–513.
Dawson, G.C., Krapez, B., Fletcher, I.R., McNaughton, N.J., Ras-
mussen, B., 2003. 1.2 Ga thermal metamorphism in the Albany-
Fraser Orogen of Western Australia: consequence of collision or
regional heating by dyke swarms? J. Geol. Soc. (Lond.) 160,
29–37.
Dudas, F.O., Davidson, A., Bethune, K.M., 1994. Age of the Sud-
bury diabase dykes and their metamorphism in the Grenville
Province, Ontario. Radiogenic age and isotopic studies. Rep.
8. Geol. Surv. Can., Curr. Res. 1994F, 97–106.
Duff, B.A., Embleton, B.J.J., 1976. Palaeomagnetic directions in
Precambrian basic intrusives of the Mount Isa Province, Aus-
tralia. Earth Planet. Sci. Lett. 28, 418–426.
L.J. Pesonen et al. / Tectonophysics 375 (2003) 289–324318
Elming, S.-A., 1985. A palaeomagnetic study of Svecokarelian
basic rocks from northern Sweden. Geol. Foren. Stockh. Forh.
107, 17–35.
Elming, S.A., Mattson, H., 2001. Post-Jotnian basic intrusions in
the Fennoscandian shield, and the break up of Baltica and from
Laurentia: a paleomagnetic and AMS study. Precambrian Res.
108, 215–236.
Elming, S.-A., Pesonen, L.J., Leino, M.A.H., Khramov, A.N., Mi-
khailova, N.P., Krasnova, A.F., Mertanen, S., Bylund, G., Terho,
M., 1993. The drift of the Fennoscandian and Ukrainian shields
during the Precambrian: a palaeomagnetic analysis. Tectonophy-
sics 223, 177–198.
Elming, S.-A., Mikhailova, N.P., Kravchenko, S., 2001a. Palaeo-
magnetism of Proterozoic rocks from the Ukrainian Shield: new
tectonic reconstructions of the Ukrainian and Fennoscandian
Shields. Tectonophysics 339, 19–38.
Elming, S.-A., Pesonen, L.J., Mertanen, S., 2001b. Rodinia and
pre-Rodinia Continental Assemblies during the Proterozoic: a
Paleomagnetic Reconstruction. Abstracts of the Archean and
Proterozoic Plate Tectonics: Geological and geophysical re-
cords. EUROPROBE Meeting, St. Petersburg (Nov. 13, 2001),
p. 20.
Eriksson, P.G., Reczko, B.F.F., 1998. Contourites associated with
pelagic murdocks and distal detal-fed turbidites in the Lower
Proterozoic Timeball Hill Formation epeiric basin (Transvaal
Supergroup), South Africa. Sediment. Geol. 120, 319–335.
Ernst, R.E., Buchan, K.L., 1993. Paleomagnetism of the Abitibi
dike swarm, southern Superior Province, and implications for
the Logan Loop. Can. J. Earth Sci. 30, 1886–1897.
Ernst, R.E., Buchan, K.L., 2001. The use of mafic dike swarms in
identifying and locating mantle plumes. Spec. Pap. - Geol. Soc.
Am. 352, 247–265.
Ernst, R.E., Buchan, K.L., West, T.D., Palmer, H.C., 1996. Diabase
(dolerite) dyke swarms of the world: first edition. Geol. Surv.
Can. (Open File 3241, 104 pp.).
Ernst, R.E., Buchan, K.L., Hamilton, M.A., Okrugin, A.V., Tom-
shin, M.D., 2000. Integrated paleomagnetism and U–Pb geo-
chronology of mafic dikes of the Eastern Anabar shield
region, Siberia: implications for Mesoproterozoic paleolatitude
of Siberia and comparison with Laurentia. J. Geol. 108,
381–401.
Evans, M.E., 1968. Magnetization of dikes: a study of the paleo-
magnetism of the Widgiemooltha Dike Suite, Western Australia.
J. Geophys. Res. 73, 3261–3270.
Evans, D.A.D., 1998. True polar wander, a supercontinental legacy.
Earth Planet. Sci. Lett. 157, 1–8.
Evans, D.A.D., 2000. Stratigraphic, geochronological, and paleo-
magnetic constraints upon the Neoproterozoic climatic paradox.
Am. J. Sci. v.300, 347–433.
Evans, D.A.D., 2003. True polar wander and supercontinents. Tec-
tonophysics 362, 303–320.
Evans, M.E., Hoye, G.S., Bingham, D.K., 1980. The paleomagnet-
ism of the Great Slave Supergroup: the Akaitcho River Forma-
tion. Can. J. Earth Sci. 17, 1389–1395.
Evans, D.A.D., Beukes, N.J., Kirschvink, J.L., 1997. Low-latitude
glaciation in the Palaeoproterozoic era. Nature 386, 262–266.
Fedotova, M.A., Khramov, N.A., Pisakin, B.N., Priyatkin, A.A.,
1999. Early Proterozoic palaeomagnetism: new results from
the intrusives and related rocks of the Karelian, Belomorian
and Kola provinces, eastern Fennoscandian Shield. Geophys.
J. Int. 137, 691–712.
Fitzsimons, I.C.W., 2000a. A review of tectonic events in the East
Antarctic shield, and their implications for Gondwana and ear-
lier supercontinents. J. Afr. Earth Sci. 31, 3–23.
Fitzsimons, I.C.W., 2000b. Grenville-age basement provinces in
East Antarctica: evidence for three separate collisional orogens.
Geology 28, 879–882.
Fitzsimons, I.C.W., 2002. Comparison of detrital zircon ages in the
Pinjarra orogen (WA) and Maud province (Antarctica): evidence
for collision of western Australia with southern Africa at 1100
Ma. Geol. Soc. Aust. Abstracts vol. 67, 228.
Frost, B.R., Avchenko, O.V., Chamberlain, K.R., Frost, C.D.,
1998. Evidence for extensive Proterozoic remobilization of
the Aldan Shield and implications for Proterozoic plate tectonic
reconstructions of Siberia and Laurentia. Precambrian Res. 89,
1–23.
Gala, M.G., Symons, D.T.A., Palmer, H.C., 1994. Paleomagnetism
and geotectonic implications of the Hanson Lake Pluton, Han-
son Lake block, Trans Hudson oregon. In: Summary of Inves-
tigations 1994, Sask. Geol. Surv., Sask. Energ. Min. Misc. Rep.
94-4, 116–122.
Gala, M.G., Symons, D.T.A., Palmer, H.C., 1995. Paleomagnetism
of the Jan Lake granite, Trans Hudson oregon. In: Summary of
Investigations 1994, Sask. Geol. Surv., Sask. Energ. Min. Misc.
Rep. 95-4, 145–152.
Gallet, Y., Pavlov, V.E., 1996. Magnetostratigraphy of the Moyero
River section (north-western Siberia): constraints on geomag-
netic reversal frequency during the early Paleozoic. Geophys.
J. Int. 125, 95–105.
Gallet, Y., Pavlov, V.E., Semikhatov, M.A., Petrov, P.Y., 2000. Late
Mesoproterozoic magnetostratigraphic results from Siberia: pa-
leogeographic implications and magnetic field behavior. J. Geo-
phys. Res. 105, 16,481–16,500.
Geraldes, M.C., Van Schmus, W.R., Condie, K.C., Bell, S., Texeira,
W., Babinski, M., 2001. Proterozoic geologic evolution of the
SW part of the Amazonian craton in Mato Grosso state, Brazil.
Precambrian Res. 111, 91–128.
Gorbatschev, R., Bogdanova, S., 1993. Frontiers in the Baltic
Shield. Precambrian Res. 64, 3–21.
Gose, W.A., Helper, M.A., Connelly, J.N., Hutson, F.E., Dalziel,
I.W.D., 1997. Paleomagnetic data and U–Pb isotopic age
determinations from Coats Land, Antarctica: implications for
late Proterozoic plate reconstructions. J. Geophys. Res. 102,
7887–7902.
Gower, C.F., 1990. Mid-Proterozoic evolution of the eastern
Grenville Province, Canada. Geol. Foren. Stockh. Forh. 112,
127–139.
Green, J.C., Bornhorst, T.J., Chandler, V.W., Mudrey, M.D., Myers,
P.E., Pesonen, L.J., Wilband, J.T., 1987. Keweenawan dykes of
the Lake Superior region: evidence for evolution of the Middle
Proterozoic mid-continent rift in North America. In: Halls,
H.C., Fahrig, W.F. (Eds.), Mafic Dyke SwarmsGeol. Assoc.
Can. Spec., pp. 289–302.
Halls, H.C., Hanes, J.A., 1999. Paleomagnetism, anisotropy of
L.J. Pesonen et al. / Tectonophysics 375 (2003) 289–324 319
magnetic susceptibility, and argon-argon geochronology of the
Clearwater anorthosite, Saskatchewan, Canada. Tectonophysics
312, 235–248.
Halls, H.C., Heaman, L.M., 2000. The paleomagnetic significance
of new U–Pb age data from the Molson dyke swarm, Cauchon
Lake area, Manitoba. Can. J. Earth Sci. 37, 957–966.
Halls, H.C., Pesonen, L.J., 1982. Paleomagnetism of Keweenawan
rocks. In: Wold, R.J., Hinze, W.J. (Eds.), Geology and Tectonics
of the Lake Superior Basin. Geol. Soc. Am. Mem., vol. 156,
pp. 173–201.
Halls, H.C., Li, J., Davis, D., Hou, G., Zhang, B., Qian, X., 2000. A
precisely dated Proterozoic palaeomagnetic pole from the North
China craton, and its relevance to palaeocontinental reconstruc-
tion. Geophys. J. Int. 143, 185–203.
Hargraves, R.B., 1968. Paleomagnetism of the Roraima dolerites.
Geophys. J. R. Astron. Soc. 16, 147–160.
Hargraves, R.B., 1970. Palaeomagnetic evidence relevant to the
origin of the Vredefort Ring. J. Geol. 78, 253–263.
Hargraves, R.B., Hattingh, P.J., Onstott, T.C., 1994. Palaeomagnetic
results from the Timbavati gabbros in the Kruger National Park,
South Africa. S. Afr. J. Geol. 97, 114–118.
Hartmann, L.A., 2002. The mesoproterozoic supercontinent Atlan-
tica in the Brazilian Shield; review of geological and U–Pb
zircon and Sm–Nd isotopic evidence. In: Rogers, J.W., Santosh,
M. (Eds,), Mesoproterozoic Supercontinent. Gondwana Res.,
vol. 5, no. 1, pp. 157–163.
Hartz, E.H., Torsvik, T.H., 2002. Baltica upside down: a new plate
tectonic model for Rodinia and the Iapetus Ocean. Geology 30,
255–258.
Hattingh, P.J., 1989. The paleomagnetism of the upper zone of
Bushveld Complex. Tectonophysics 165, 131–142.
Hattingh, P.J., 1999. Palaeomagnetism and the Bushveld Complex
in Southern Africa; some enigmas. In: Radhakrishna, T., Piper,
J.D.A. (Eds.), The Indian Subcontinent and Gondwana; A Pa-
laeomagnetic and Rock Magnetic Perspective. Memoir-Geol.
Soc. India, vol. 44, pp. 1–7.
Heaman, L.M., 1997. Global mafic mafmatism at 2.45 Ga: remnants
of ancient large igneous province? Geology 25 (4), 299–302.
Henriksen, N., Higgins, A.K., Kalsbeek, F., Pulvertaft, T.C.R.,
2000. Greenland from Archaean to Quaternary. Geol. Greenl.
Surv. Bull. 185 (93 pp.).
Henry, S.G., Mauk, F.J., Van der Voo, R., 1977. Paleomagnetism of
the upper Keweenawan sediments: the Nonesuch shale and Fre-
da sandstone. Can. J. Earth Sci. 14, 1128–1138.
Hoffman, P.F., 1989. Precambrian geology and tectonic history of
North America. In: Bally, A.W., Palmer, A.R. (Eds.), The
Geology of North America—An Overview. The Geology of
North America, A. Geol., Soc. America, Boulder, CO, pp.
447–512.
Hoffman, P.F., 1991. Did the breakout of Laurentia turn Gondwana
inside out? Science 252, 1409–1412.
Hoffman, P.F., Schrag, D.P., 2002. The snowball Earth hypothesis:
testing the limits of global change. Terra Nova 14, 129–155.
Idnurm, M., 2000. Towards a high resolution late Palaeoprotero-
zoic–earliest Mesoproterozoic apparent polar wander path for
northern Australia. Aust. J. Earth Sci. 47, 405–429.
Idnurm, M., Giddings, J.W., 1995. Paleoproterozoic–Neoprotero-
zoic North America–Australia link: new evidence from paleo-
magnetism. Geology 23, 149–152.
Idnurm, M., Giddings, J.W., Plumb, K.A., 1995. Apparent polar
wander and reversal stratigraphy of the Palaeo-Mesoproterozoic
southeastern McArthur Basin, Australia. Precambrian Res. 72,
1–41.
Irving, E., 1964. Palaeomagnetism and its Application to Geolog-
ical and Geophysical Problems Wiley, New York. 399 pp.
Irving, E., McGlynn, J.C., 1979. Palaeomagnetism in the Corona-
tion Geosyncline and arrangement of continents in the middle
Proterozoic. Geophys. J. R. Astron. Soc. 58, 309–336.
Jacobs, J., Fanning, C.M., Henjes-Kunst, F., Olesch, M., Paech,
H.J., 1998. Continuation of the Mozambique Belt into East
Antarctica: Grenville-age metamorphism and polyphase Pan-
African high-grade events in central Dronning Maude Land. J.
Geol. 106, 385–406.
Jones, D.L., McElhinny, M.W., 1966. Paleomagnetic correlation of
basic intrusions in the Precambrian of southern Africa. J. Geo-
phys. Res. 71, 543–552.
Jones, D.I., Powell, C.McA., 2001. Palaeomagnetic results from the
Umkondo Large Igneous Province and their relevance to Rodi-
nia. Fourth International Dyke Conference, South Africa 26–29
June, 2001, Programme and Abstracts, 34.
Kalsbeek, F., Thrane, K., Nutman, A.P., Jepsen, H.F., 2000. Late
Mesoproterozoic to early Neoproterozoic history of the East
Greenland Caledonides: evidence for Grenvillian orogenesis?
J. Geol. Soc. (Lond.) 157, 1215–1225.
Karhu, J.A., Holland, H.D., 1996. Carbon isotopes and the rise of
atmospheric oxygen. Geology 24 (10), 867–870.
Karlstrom, K.E., Ahall, K.-I., Harlan, S.S., Williams, M.L., McLel-
land, J., Geissman, J.W., 2001. Long-lived (1.8–1.0 Ga) con-
vergent orogen in southern Laurentia, its extension to Australia
and Baltica, and implications for refining Rodinia. Precambrian
Res. 111, 5–30.
Kean, W.F., Mercer, D., 1986. Paleomagnetism of the Baraboo
Quartzite, of South Central Wisconsin. Geosci. Wis. 10, 46–53.
Kent, D.V., Smethurst, M.A., 1998. Shallow bias of paleomagnetic
inclinations in the Paleozoic and Precambrian. Earth Planet. Sci.
Lett. 160, 391–402.
Kirschvink, J.L., 1992. Late Proterozoic low-latitude global gla-
ciation: the Snowball Earth. In: Schopf, et al. (Eds.), The
Proterozoic Biosphere. Cambridge Univ. Press, Cambridge,
pp. 51–52.
Kirschvink, J.L., Ripperdan, R.L., Evans, D.A., 1997. Evidence for
a large-scale reorganization of Early Cambrian continental land-
masses by inertial interchange true polar wander. Science 277,
541–545.
Krogh, T.E., Corfu, F., Davis, D.W., Dunning, G.R., Heaman, L.M.,
Kamo, S.L., Machado, N., Greenough, J.D., Nakamura, E.,
1987. Precise U–Pb ages of diabase dykes and mafic to ultra-
mafic rocks using trace amounts of baddeleyite and zircon. In:
Halls, H.C., Fahrig, W.F. (Eds.), Mafic Dyke Swarms. Geol.
Ass. Can. Spec. Paper, vol. 34, pp. 147–152.
Kroner, A., Sacchi, R., Jaeckel, P., Costa, M., 1997. Kibaran mag-
matism and Pan-African granulite metamorphism in northern
Mozambique: single zircon ages and regional implications. J.
Afr. Earth Sci. 25, 467–484.
L.J. Pesonen et al. / Tectonophysics 375 (2003) 289–324320
Lager, I., Loberg, B., 1990. Sedimentologisk-bassanganalytisk
malmprospekteringsmetodik inom norrbotniska gronstenbalten.
The Swedish National Board for Technical Development, Re-
port, 86-03967. 132 pp.
LeCheminant, A.N., Heaman, L.M., 1989. Mackenzie igneous
events, Canada: middle Proterozoic hotspot magmatism associ-
ated with ocean opening. Earth Planet. Sci. Lett. 96, 38–48.
Ledru, P., Johan, V., Milesi, P., Tegyey, M., 1994. Markers of the
last stages of the Palaeoproterozoic collision: evidence for a 2
Ga continent involving circum_ South Atlantic provinces. Pre-
cambrian Res. 69, 169–191.
Li, Z.X., 2000. Palaeomagnetic evidence for unification of the
North and West Australian cratons by ca.1.7 Ga; new results
from the Kimberley Basin of northwestern Australia. Geophys.
J. Int. 142, 173–180.
Li, Z.X., Li, X.H., Zhou, H., Kinny, P.D., 2001. Grenville-age
Continental Collision in South China: New Shrimp Age Con-
straints and Implications to Rodinia Configuration. In: Sir-
combe, K., Li, Z.X. (Eds.), From Basins to Mountains: Ro-
dinia at the Turn of Century. Geological Society of Australia
Abstracts, vol. 65, pp. 78–79.
Loukola-Ruskeeniemi, K., Heino, T., 1996. Geochemistry and gen-
esis of the black shale-hosted Ni –Cu–Zn deposits at Talvi-
vaara, Finland. Econ. Geol. 91, 80–110.
Marcussen, C., Abrahamsen, N., 1983. Palaeomagnetism of the
Proterozoic Zig-Zag Dal basalt and the Midsommerso doler-
ites, eastern North Greenland. Geophys. J. R. Astron. Soc. 73,
367–387.
Mare, L.P., Thomas, R.J., 1997. Palaeomagnetism and aeromag-
netic modelling of the Mesoproterozoic Ntimbankulu Pluton,
KwaZulu-Natal, South Africa; mushroom-shaped diapir? J.
Afr. Earth Sci. 25, 519–537.
McElhinny, M.W., Lock, J., 1996. IAGA paleomagnetic databases
with Access. Surv. Geophys. 17, 575–591.
Marmo, J., Ojakangas, R., 1984. Lower Proterozoic glaciogenic de-
posits, eastern Finland. Geol. Soc. Amer. Bull. 95, 1055–1062.
McGlynn, J.C., Hanson, G.N., Irving, E., Park, J.K., 1974. Paleo-
magnetism and age of Nonacho Group sandstones and associ-
ated Sparrow dikes, District of Mackenzie. Can. J. Earth Sci. 11,
30–42.
McMenamin, M.A.S., McMenamin, D.L., 1990. The Emergence of
Animals; The Cambrian Breakthrough Columbia Univ. Press,
New York. 217 pp.
Meert, J.G., 1999. A paleomagnetic analysis of Cambrian true polar
wander. Earth Planet. Sci. Lett. 168, 131–144.
Meert, J.G., 2002. Paleomagnetic evidence for a Paleo-Mesoproter-
ozoic supercontinent Columbia. Gondwana Res. 5, 207–216.
Meert, J.G., 2003. A synopsis of events related to the assembly of
eastern Gondwana. Tectonophysics 362, 1–40.
Meert, J.G., Stuckey, W., 2002. Revisiting the Paleomagnetism of
the 1.476 Ga St. Francois Mountains Igneous Province, Missou-
ri. Tectonics 21 (2), 10.1029/2000TC001265.
Meert, J.G., Tamrat, E., 2003. The HOG hypothesis for explaining
rapid continental motion in the Neoproterozoic. In: Eriksson, E.
et al., (Eds.), Tempos and Events in Precambrian Time. Elsevier.
In press.
Meert, J.G., Torsvik, T.H., 2003. The making and unmaking of
a supercontinent: Rodinia revisited. Tectonophysics 375,
261–288 (this volume).
Meert, J.G., Van der Voo, R., 1994. The Neoproterozoic (1000–540
Ma) glacial intervals: no more snowball Earth? Earth Planet.
Sci. Lett. 123, 1–13.
Meert, J.G., Van der Voo, R., Powell, C.McA., Li, Z.X., Chen, Z.,
Symons, D.T.A., 1993. A plate tectonic speed limit? Nature 363,
216–217.
Meert, J.G., Hargraves, R.B., Van der Voo, R., Hall, C.M., Halliday,
A.N., 1994. Paleomagnetic and 40Ar/39Ar studies of Late Kibar-
an intrusives in Burundi, East Africa: implications for Late Pro-
terozoic supercontinents. J. Geol. 102, 621–637.
Meert, J.G., Van der Voo, R., Ayub, S., 1995. Paleomagnetic
investigation of the Gagwe lavas and Mbozi Complex, Tan-
zania and the assembly of Gondwana. Precambrian Res. 74,
225–244.
Melezhik, V.A., Fallick, A.E., Filippov, M.M., Larsen, O., 1999.
Karelian shungite- and indication of 2.0-Ga-old metamorphosed
oil-shale and generation of petroleum: geology, lithology and
geochemistry. Earth-Sci. Rev. 47, 1–40.
Mertanen, S., Pesonen, L.J., 1992. Palaeomagnetism of the Early to
Middle Proterozoic mafic intrusions in northern Finland. Inter-
national Symposium, IGCP Project 275—Deep Geology of the
Baltic (Fennoscandian) Shield and IGCP Project 257—Precam-
brian Dike Swarms, Petrozavodsk, pp. 57–59. Abstracts.
Mertanen, S., Pesonen, L.J., 1994. Preliminary results of the palae-
omagnetic and rock magnetic study of the Early Proterozoic
Tsuomasvarri ultramafic and gabbrodiorite intrusion, northern
Fennoscandia. Precambrian Res. 69, 25–50.
Mertanen, S., Pesonen, L.J., 1995. Palaeomagnetic and rock mag-
netic investigations of the Sipoo Subjotnian quartz porphyry and
diabase dykes, southern Fennoscandia. Phys. Earth Planet. Inter.
88, 145–175.
Mertanen, S., Pesonen, L.J., 2000. Fennoscandia as a part of a
supercontinent. In: Pesonen, L.J., Korja, A., Hjelt, S.-E. (Eds.),
Lithosphere 2000—ASymposium on the Structure, Composition
and Evolution of the Lithosphere in Finland. Programme and
Extended Abstracts. Report S-41. Institute of Seismology, Uni-
versity of Helsinki, 137–141.
Mertanen, S., Pesonen, L.J., 2003. Geological evolution and drift
history of the Fennoscandian Shield—paleomagnetic constraints
and evidences for supercontinents during the Precambrian. A
Special Volume. Geol. Finland (submitted for publication).
Mertanen, S., Pesonen, L.J., Huhma, H., 1996. Palaeomagnetism
and Sm–Nd ages of the Neoproterozoic diabase dykes in Laa-
nila and Kautokeino, northern Fennoscandia. In: Brewer, T.S.
(Ed.), Precambrian Crustal Evolution in the North Atlantic Re-
gion. Geol. Soc. Special Publ., vol. 112, pp. 331–358.
Mertanen, S., Halls, H.C., Vuollo, J.I., Pesonen, L.J., Stepanov,
V.S., 1999. Paleomagnetism of 2.44 Ga mafic dykes in Russian
Karelia, eastern Fennoscandian Shield-implications for conti-
nental reconstructions. Precambrian Res. 98, 197–221.
Mertanen, S., Pesonen, L.J., Elming, S.-A.M., 2001. Continental
assemblies during the proterozoic –paleomagnetic reconstruc-
tions. Abstracts of the EUROPROBE/SVEKALAPKO Meeting,
Lammi, XX–XX.12, p. XXX.
Mertanen, S., Paavola, J., Holtta, P., Pesonen, L.J., 2003. Paleo-

L.J. Pesonen et al. / Tectonophysics 375 (2003) 289–324 321
magnetism of the Varpaisjarvi dykes. IDC, vol. V. Special vol-
ume, submitted for publication.
Moakhar, M.O., Elming, S.-A., 1998. Palaeomagnetic investigations
of rapakivi granite complexes and associated rocks in central
Sweden. In: Moakhar, M.O. (Ed.), Rapakivi Granite and Basic
Dykes in the Fennoscandian Shield: a palaeomagnetic analysis.
PhD Thesis. Lulea University of Technology, Lulea, Sweden.
Moores, E.M., 1991. Southwest US–East Antarctic (SWEAT) con-
nection: a hypothesis. Geology 19, 425–428.
Muller, A., Maher, M.J., Saal, E.W., 1978. The significance of
natural remanent magnetization in geophysical exploration in
the Okiep Copper district. Spec. Publ. - Geol. Soc. S. Afr. N4,
385–401.
Nemchin, A.A., Pidgeon, R.T., 1998. Precise conventional and
SHRIMP baddeleyite U–Pb age for the Binneringe Dyke, near
Narrogin, Western Australia. Aust. J. Earth Sci. 45, 637–675.
Neuvonen, K.J., 1965. Palaeomagnetism of the dike systems in
Finland: I. Remanent magnetization of Jotnian olivine dolerites
in southwestern Finland. CR, Geol. Soc. Finl. 37, 153–168.
Neuvonen, K.J., 1966. Palaeomagnetism of the dike systems in
Finland: II. Remanent magnetization of dolerites in the Vaasa
archipelago. CR, Geol. Soc. Finl. 38, 275–281.
Neuvonen, K.J., 1986. On the direction of remanent magnetization
of the quartz porphyry dikes in SE Finland. Bull. Geol. Soc.
Finl. 58 (1), 195–201.
Neuvonen, K.J., Grundstrom, L., 1969. Paleomagnetism of the dike
systems in Finland, IV. Remanent magnetization of the dolerite
and related dikes in the ? Land archipelago. Geol. Surv. Finl.
Bull. 41, 57–63.
Neuvonen, K.J., Korsman, K., Kouvo, O., Paavola, J., 1981. Pale-
omagnetism and age relations of the rocks in the Main Sulphide
Ore Belt in central Finland. Bull. Geol. Soc. Finl. 53, 109–133.
Neuvonen, K.J., Pesonen, L.J., Pietarinen, H., 1997. Remanent
magnetization in the Archaean basement and cutting dykes in
Finland, Fennoscandian shield. In: Pesonen, L.J. (Ed.), The
Lithosphere of Finland—a Special Issue of the Finnish Litho-
sphere Programme. Geophysica, vol. 33 (No. 1), pp. 111–146.
Nironen, M., 1997. The Svecofennian Orogen: a tectonic model.
Precambrian Res. 86 (1–2), 21–44.
Nomade, S., Chen, Y., Feraud, G., Pouclet, A., Theveniaut, H.,
2001. First paleomagnetic and 40Ar/39Ar study of Paleoproter-
ozoic rocks from the French Guyna (Camopi and Oypok rivers),
northeastern Guyana Shield. Precambrian Res. 109, 230–256.
Onstott, T.C., Dorbor, J., 1987. 40Ar/ 39Ar and paleomagnetic re-
sults from Liberia and the Precambrian APW database for the
West African Shield. J. Afr. Earth Sci. 6, 537–552.
Onstott, T.C., Hargraves, R.B., 1981. Proterozoic transcurrent tec-
tonics: palaeomagnetic evidence from Venezuela and Africa.
Nature 289, 131–136.
Onstott, T.C., Hargraves, R.B., York, D., 1984. Dating of Precam-
brian diabase dikes of Venezuela using Paleomagnetic and40Ar/39Ar methods. Anais II Symposium Amazonico, Manaus,
Brazil, DNPM, vol. 2, pp. 513–518.
Onstott, T.C., Hargraves, R.B., York, D., Hall, C., 1984. Constraints
on the motions of South American and African shields during the
Proterozoic: I. 40Ar/39Ar and paleomagnetic correlations between
Venezuela and Liberia. Geol. Soc. Amer. Bull. 95, 1045–1054.
Onstott, T.C., Hargraves, R.B., Joubert, P., 1986. Constraints on
the evolution of the Namaqua Province: II. Reconnaissance
palaeomagnetic and 40Ar/39Ar results from the Namaqua
Province and the Kheis Belt. Trans. – Geol. Soc. S. Afr.
89, 143–170.
Ovchinnikova, G.V., Semikhatov, M.A., Vasil’eva, I.M., Gorokhov,
I.M., Kaurova, O.K., Podkovyrov, V.N., Gorokhovskii, B.M.,
2001. Pb–Pb age of limestones of the middle Riphean Malgina
Formation, the Uchur-Maya region of East Siberia. Stratigr.
Geol. Correl. 9, 490–502.
Park, A.F., 1991. Continental growth by accretion: a tectonostrati-
graphic terrane analysis of the evolution of western and central
Baltic Shield, 2.50–1.75 Ga. Geol. Soc. Amer. Bull. 103,
522–537.
Park, R.G., 1992. Plate kinematic history of Baltica during the
Middle to Late Proterozoic: a model. Geology 20, 725–728.
Park, R.G., 1994. Early Proterozoic tectonic overview of the north-
ern British Isles and neighbouring terrains in Laurentia and
Baltica. Precambrian Res. 68, 65–79.
Park, J.K., Irving, E., Donaldson, J.A., 1973. Paleomagnetism of
the Precambrian Dubawnt Group. Geol. Soc. Amer. Bull. 84,
859–870.
Patchett, P.J., Arndt, N.T., 1986. Nd isotopes and tectonics of 1.9–
1.7 Ga crustal genesis. Earth Planet. Sci. Lett. 78, 329–338.
Patchett, P.J., Bylund, G., 1977. Age of Grenville Belt magnetiza-
tion: Rb–Sr and paleomagnetic evidence from Swedish doler-
ites. Earth Planet. Sci. Lett. 35, 92–104.
Pavlov, V.E., Burakov, K.S., Tsel’movich, V.A., Zhuravlev, D.Z.,
1992. Paleomagnetism of sills of Uchur-Maya region and esti-
mation of geomagnetic field strength in Late Riphean. Phys.
Solid Earth (Izvestiya Earth Physics) 28, 29–72.
Pelechaty, S.M., 1996. Stratigraphic evidence for the Siberia–Lau-
rentia connection and Early Cambrian rifting. Geology 24,
719–722.
Perttunen, V., 1970. Banding of stromatolites. In: Runcorn, S.K.
(Ed.), Palaeogeophysics, London, pp. 25–30.
Pesonen, L.J., 1983. Geophysical correlation of rock formations—
the paleomagnetic method. In: Eskola, L. (Ed.), Geophysics for
Geologists. Report of Investigation, vol. 58. Geological Survey
of Finland, pp. 37–56. In Finnish.
Pesonen, L.J., 1992. Continental drift of the Fennoscandian Shield.
In: Koljonen, T. (Ed.), The Geochemical Atlas of Finland: Part
2. Till. Geological Survey of Finland, pp. 61–65.
Pesonen, L.J., Mertanen, S., 2002. Paleomagnetic configuration of
continents during the Proterozoic. In: Lahtinen, R., Korja, A.,
Arhe, K., Eklund, O., Hjelt, S.-E., Pesonen, L.J. (Eds.), Litho-
sphere 2002—Second Symposium on the Structure, Composi-
tion and Evolution of the Lithosphere in Finland. Programme
and Extended Abstracts. Report S-42. Institute of Seismology,
University of Helsinki, pp. 103–110.
Pesonen, L.J., Neuvonen, K.J., 1981. Paleomagnetism of the Baltic
shield-implications for Precambrian tectonics. In: Kroner, A.
(Ed.), Precambrian Plate Tectonics. Elsevier, Amsterdam, pp.
623–648.
Pesonen, L.J., Nevanlinna, H., 1981. Late Precambrian Keweena-
wan asymmetric reveals. Nature 294, 436–439.
Pesonen, L.J., Stigzelius, E., 1972. On petrophysical and paleomag-
L.J. Pesonen et al. / Tectonophysics 375 (2003) 289–324322
netic investigations of the gabbros of the Pohjanmaa region,
Middle-West Finland. Geol. Surv. Finl. Bull. 260, 1–27.
Pesonen, L.J., Torsvik, T.H., Elming, S.-A., Bylund, G., 1989.
Crustal evolution of Fennoscandial — palaeomagnetic con-
straints. Tectonophysics 162, 27–49.
Pesonen, L.J., Bylund, G., Torsvik, T.H., Elming, S.-A., Mertanen,
S., 1991. Catalogue of paleomagnetic directions and poles
from Fennoscandia: Archaean to Tertiary. Tectonophysics
195, 151–207.
Pesonen, L.J., Elming, S.-A., Pisarevsky, S., Mertanen, S., D’Agrel-
la- Filho, M., Meert, J., Schmidt, P., Bylund, G., 2000. A pre-
Rodinia supercontinent?—a paleomagnetic survey. XXV EGS-
Abstracts, Nice, 2000 CD-ROM.
Pesonen, L.J., Elming, S.-A., Mertanen, S., 2001a. Assemblies of
continents during the Proterozoic—A paleomagnetic Survey.
Abstracts of the AGU 2001 Spring Meeting, Boston, May
29–June 3, 2001 CD-ROM.
Pesonen, L.J., Mertanen, S., Elming, S.-A., 2001b. Reconstructions
of continents during the proterozoic—a way towards Rodinia.
In: Sircombe, K., Li, Z.X. (Eds.), From Basins to Mountains:
Rodinia at the Turn of centuryGeological Society of Australia
Abstracts, vol. 65, pp. 82–84.
Pesonen, L.J., Mertanen, S., Elming, S.-A., 2001c. Reconstructions
of continents during the proterozoic with a special focus on
Fennoscandia. In: Poutanen, M. (Ed.), Abstracts of the SRCM’
01, an IAG International Symposium on Recent Crustal Move-
ments, Helsinki, Finland, pp. 79–81.
Pesonen, L.J., Reimold, W.U., Gibson, R.L., 2002. Preliminary
paleomagnetic and rock magnetic data of the Vredefort struc-
ture, South Africa. Abstracts of the 33rd LPSC, Houston, March
4–8, 2002 CD-ROM.
Peters, M., 1990. Igneous rocks in western and central Neuschwa-
benland, Vestfjella andAhlmannryggen, Antarctica; Petrography,
Geochemistry, Geochronology, Paleomagnetism, Geotectonic
Implications. Polarstern-Abstr. 4, 78–80.
Peucat, et al., 1989. U–Pb, Sr, and Nd evidence for Grenvillian and
latest Proterozoic tectonothermal activity in Spitsbergen Cale-
donides. Arctic Ocean Lithos 22, 275–285.
Piper, J.D.A., 1975. The Palaeomagnetism of Precambrian Igneous
and Sedimentary Rocks of the Orange River Belt in South Afri-
ca and South West Africa. Geophys. J. R. Astron. Soc. 40 (3),
313–344.
Piper, J.D.A., 1976. Palaeomagnetic evidence for a Proterozoic
supercontinent. Philos. Trans. R. Soc. Lond., A 280, 469–490.
Piper, J.D.A., 1977. Palaeomagnetism of the giant dykes of Tugtu-
toq and Narssaq Gabbro, Gardar Igneous Province, South
Greenland. Bull. Geol. Soc. Den. 26, 85–94.
Piper, J.D.A., 1979. Palaeomagnetism of the Ragunda intrusion and
dolerite dykes, central Sweden. Geol. Foren. Stockh. Forh. 101,
139–148.
Piper, J.D.A., 1980. A palaeomagnetic study of Svecofennian basic
rocks; middle Proterozoic configuration of the Fennoscandian,
Laurentian and Siberian shields. Phys. Earth Planet. Inter. 23,
165–187.
Piper, J.D.A., 2000. The Neoproterozoic supercontinent: Rodinia or
Palaeopangaea? Earth Planet. Sci. Lett. 176, 131–146.
Pisarevsky, S.A., Bylund, G., 1998. Palaeomagnetism of a key
section of the Protogine Zone, southern Sweden. Geophys. J.
Int. 133, 185–200.
Pisarevsky, S.A., Sokolov, S.J., 1999. Palaeomagnetism of the Pa-
laeoproterozoic ultramafic intrusion near Lake Konchozero,
Southern Karelia, Russia. Precambrian Res. 93, 201–213.
Pisarevsky, S.A., Sokolov, S.J., 2001. The magnetostratigraphy and
a 1780 Ma palaeomagnetic pole from the red sandstones of
Vazhinka River section, Karelia, Russia. Geophys. J. Int. 146,
531–538.
Pisarevsky, S.A., Natapov, L.M., 2003. Siberia and Rodinia. Tech-
nophysics 375, 221–245 (this volume).
Pisarevsky, S.A., Wingate, M.T.D., Powell, C.McA., Johnson, S.,
Evans, D.A.D., 2003. Models of Rodinia assembly and frag-
mentation. Spec. Publ. – Geol. Soc. Lond., 206.
Poorter, R.P.E., 1975. Palaeomagnetism of Precambrian rocks from
southeast Norway and south Sweden. Phys. Earth Planet. Inter.
10, 74–87.
Poorter, R.P.E., 1981. Precambrian palaeomagnetism of Europe and
the position of the Balto-Russian plate relative to Laurentia. In:
Krner, A. (Ed.), Precambrian Plate Tectonics. Elsevier, Amster-
dam, pp. 599–622.
Powell, C.McA., Li, Z.X., 1994. Reconstruction of the Panthalassan
margin of Gondwanaland. In: Veevers, J.J., Powell, C.McA.
(Eds.), Permian-Triassic Pangean Basins and Foldbelts Along
the Panthalassan Margin of GondwanalandGeol. Soc. Am.
Mem., vol. 184, pp. 5–9.
Powell, C.McA., Pisarevsky, S.A., 2002. Late Neoproterozoic as-
sembly of East Gondwanaland. Geology 30, 3–6.
Powell, C.McA., Jones, D.L., Pisarevsky, S.A., Wingate, M.T.D.,
2001. Paleomagnetic constraints on the position of the Kalahari
craton in Rodinia. Precambrian Res. 110, 33–46.
Rainbird, R.H., Stern, R.A., Khudoley, A.K., Kropachev, A.P., Hea-
mon, L.M., Sukhorukov, V.I., 1998. U–Pb geochronology of
Riphean sandstone and gabbro from southeast Siberia and its
bearing on the Laurentia–Siberia connection. Earth Planet. Sci.
Lett. 164, 409–420.
Renne, P.R., Onstott, T.C., D’Agrella-Filho, M.S., Pacca, I.G., Teix-
eira, W., 1990. 40Ar/39Ar dating of 1.0–1.1 Ga magnetizations
from the Sao Francisco and Kalahari cratons: tectonic implica-
tions for Pan-African and Brasiliano mobile belts. Earth Planet.
Sci. Lett. 101, 349–366.
Roest, W.R., Srivistava, S.P., 1989. Sea-floor spreading in the Lab-
rador Sea: a new reconstruction. Geology 17, 1000–1003.
Rogers, J.J.W., 1996. A history of continents in the past three
billion years. J. Geol. 104, 91–907.
Rogers, J.J.W., Santosh, M., 2002. Configuration of Columbia, a
Mesoproterozoic supercontinent. Gondwana Res. 5, 5–22.
Romer, R.L., 1996. Contiguous Laurentia and Baltica before the
Grenvillian–Sveconorwegian orogeny? Terra Nova 8, 173–181.
Ross, G.M., Parrish, R.R., Winston, D., 1992. Provenance and U–
Pb geochronology of the Mesoproterozoic Belt Supergroup
(northwestern United States): implications for age of deposition
and pre-Panthalassa plate reconstructions. Earth Planet. Sci.
Lett. 113, 57–76.
Roy, J.L., Robertson,W.A., 1978. Paleomagnetism of the Jacobsville
Formation and the apparent polar path for the interval f1100 to
f670 m.y. for North America. J. Geophys. Res. 83, 1289–1304.
L.J. Pesonen et al. / Tectonophysics 375 (2003) 289–324 323
Ramo, O.T., Haapala, I., 1995. One hundred years of Rapakivi
Granite. Mineral. Petrol. 52, 129–185.
Sadowski, G.R., 2002. The Fit Between Amazonia, Baltica and
Laurentia During the Mesoproterozoic Assemblage of the
Supercontinent Rodinia. Gondwana Res. 5 (1), 101–107.
Sadowski, G.R., Bettencourt, J.S., 1996. Mesoproterozoic tectonic
correlations between eastern Laurentia and the western border of
the Amazon Craton. Precambrian Res. 76, 213–227.
Schwarz, E.J., Buchan, K.L., 1982. Uplift deduced from remanent
magnetization; Sudbury area since 1250 Ma ago. Earth Planet.
Sci. Lett. 58, 65–74.
Sears, J.W., Price, R.A., 2000. New look at the Siberian connection:
No SWEAT. Geology 28, 423–426.
Sircombe, K.N., 2001. Promise and peril: microanalysis, prove-
nance and reconstruction in Rodinia and beyond. In: Sircombe,
K., Li, Z.X. (Eds.), From Basins to Mountains: Rodinia at the
Turn of a Century. Geological Society of Australia Abstracts.
vol. 65, pp. 101–104.
Skobelev, V.N., Yakovlev, B.G., Gaily, S.A., 1991. Petrogenesis of
Nickel-bearing Gabbroid Intrusions of the Volhyn Megablock
of the Ukrainian Shield. Naukova Dumka (in Russian, 140 pp.).
Stearn, J.E.F., 1979. Palaeomagnetism of the Sveconorwegian rocks
of the Fennoscandian Shield. PhD thesis. University of Liver-
pool, England.
Stearn, J.E.F., Piper, J.D.A., 1984. Palaeomagnetism of the Sveco-
norwegian mobile belt of the Fennoscandian Shield. Precambri-
an Res. 23, 201–246.
Sturt, B.A., Melezhik, A., Ramsay, D.M., 1994. Early Proterozoic
regolith at Pasvik, NE Norway: Paleoenvironmental Implica-
tions for Baltic Shield. Terra Nova 6 (6), 618–633.
Symons, D.T.A., 1991. Paleomagnetism of the Proterozoic Watha-
man batholith and the suturing of the Trans-Hudson orogen in
Saskatchewan. Can. J. Earth Sci. 28, 1931–1938.
Symons, D.T.A., MacKay, C.D., 1999. Paleomagnetism of the
Boot-Phantom Pluton and the amalgamation of the juvenile
domains in the Paleoproterozoic Trans-Hudson Orogen, Canada.
In: Sinha, A.K. (Ed.), Proceedings of the International Confer-
ences on Basement Tectonics, vol. 13, pp. 313–331.
Symons, D.T.A., Lohnes, C.A., Lewchuk, M.T., 1994. Geotectonic
constraints from paleomagnetism of the Macoun Lake Grano-
diorite, Lynn Lake-La Longe Domain, Trans-Hudson Orogen
(Parts of NTS 64D-5 and -12). Sask. Geol. Surv. Misc. Rep.
94-4, 123–131.
Symons, D.T.A., Radigan, S.P., Lewchuk, M.T., 1996. Paleomag-
netism of the Davin Lake Granitoids, Rottenstone Domain,
Trans-Hudson Orogen (part of NTS 64D-12 and -13). Sask.
Geol. Surv. Misc. Rep. 96-4, 111–118.
Symons, D.T.A., Symons, T.B., Lewchuck, M.T., 2000. Paleomag-
netism of the Deschambault pegmatites, stillstand and hairpin at
the end of the Trans-Hudson Orogen orogeny, Canada. Phys.
Chem. Earth. 25, 479–487.
Tanaka, H., Idnurm, M., 1994. Paleomagnetism of Proterozoic
mafic intrusions and host rocks of the Mount Isa Inlier, Austral-
ia: Revisited. Precambrian Res. 69, 241–258.
Tassinari, C.C.G., Bettencourt, J.S., Geraldes, M.C., Macambira,
M.J.B., Lafon, J.M., 2000. The Amazonian craton. In: Cor-
diani, U.G., Milani, E.J., Thomaz Filho, A., Campos, D.A.
(Eds.), Tectonic Evolution of South America, Rio de Janeiro,
pp. 41–95.
Thorkelson, D., Mortensen, J.K., Davidson, G.J., Creaser, R.A.,
Perez, W.A., Abbot, G., 2001. Early Mesoproterozoic intrusive
breccias in Yukon, Canada: the role of hydrothermal systems in
reconstructions of North America and Australia. Precambrian
Res. 111, 31–55.
Tohver, E., van der Plujim, B., Scandolara, J., Rizzoto, G.J., 2001.
A reassessment of the tectonics and paleogeography of the
Grenville-aged Sunsas-Aguapei Belts, SW Amazon Craton:
New paleomagnetic and 40Ar/39Ar data. State of the Art of the
SW Amazonian Craton Geology Symposium, August 10–12,
Sao Paulo, Brazil.
Tohver, E., van der Pluijm, B.A., Van der Voo, R., Rizzoto, G.,
Scandolara, J.E., 2002. Paleogeography of the Amazon craton at
1.2 Ga: early Grenvillian collision with the Llano segment of
Laurentia. Earth Planet. Sci. Lett. 199, 185–200.
Torsvik, T.H., Smethurst, M.A., 1999. Plate tectonic modelling;
virtual reality with GMAP. In: Butler, J.C. (Ed.), Computers
and Geosciences, vol. 25 (4), pp. 395–402.
Trompette, R., 1994. Geology of Western Gondwana (2000–500
Ma) - Pan-African-Brasiliano aggregation of South America and
Africa. A.A. Balkema, Rotterdam. 350 pp.
Van der Voo, R., Torsvik, T.H., 2001. Evidence for Permian and
Mesozoic non-dipole fields provides an explanation for the
Pangea reconstruction problems. Earth Planet. Sci. Lett. 187,
71–81.
Vuollo, J.I., Nykanen, V.M., Liipo, J.P., Piirainen, T.A., 1995. Pa-
laeoproterozoic mafic dyke swarms in the Eastern Fennoscan-
dian shield, Finland: a review. In: Baer, G., Heimann, A. (Eds.),
Physics and Chemistry of Dykes. Balkema, Rotterdam, pp.
170–192.
Watt, G.R., Thrane, K., 2001. Early Neoproteozoic events in East
Greenland. Precambrian Res. 110, 165–184.
Weil, A.B., Van der Voo, R., Mac Niocaill, C., Meert, J.G., 1998.
The Proterozoic supercontinent Rodinia: paleomagnetically de-
rived reconstruction for 1100 to 800 Ma. Earth Planet. Sci. Lett.
154, 13–24.
Wilde, S.A., Zhao, G., Sun, M., 2002. Development of the North
China Craton during the late Archaean and its final amalgama-
tion at 1.8 Ga; some speculations on its position within a global
Palaeoproterozoic supercontinent. Gondwana Res. 5, 85–94.
Williams, G.E., 1993. History of the Earth’s obliquity. Earth-Sci.
Rev. 34, 1–45.
Williams, G.E., Schmidt, P.W., 1997. Paleomagnetism of the Pale-
oproterozoic Gowganda and Lorrain formations, Ontario: low
paleolatitude for Huronian glaciation. Earth Planet. Sci. Lett.
153, 157–169.
Williams, H., Hoffman, P., Lewry, J.F., Monger, J.W.H., Rivers, T.,
1991. Anatomy of North America: thematic geologic portrayals
of the continent. Tectonophysics 187, 117–134.
Wilson, J.F., 1990. A craton and its cracks: some of the behaviour
of the Zimbabwe block from the Archaean to the Mesozoic in
response to horizontal movements and the significance of some
of its mafic dyke fracture patterns. J. Afr. Earth Sci. 10 (3),
483–501.
Wingate, M.T.D., Pisarevsky, S.A., Evans, D.A.D., 2002. Rodinia

L.J. Pesonen et al. / Tectonophysics 375 (2003) 289–324324
connections between Australia and Laurentia: no SWEAT, no
AUSWUS?. Terra Nova 14, 121–128.
Zegers, T.E., de Witt, M.J., Dann, J., White, H., 1998. Vaalbara,
Earth’s oldest assembled continent? A combined structural, geo-
chronological, and palaeomagnetic test. TerraNova 10, 250–259.
Zhang, L., Li, Z.X., Powell, C.McA., 2000. Correclation of the
Neoproterozoic glacigenic sequences between China and Aus-
tralia. Abstracts, Geological Society of Australia 37, 483–484.
September.
Zhao, G., Cawood, P.A., Wilde, S.A., Sun, M., Lu, L., 2000. Meta-
morphism of basement rocks in the central zone of the North
China Craton: implications for Palaeoproterozoic tectonic evo-
lution. Precambrian Res. 103, 55–88.