Correlation Between Microstructure and Flow Behavior in Porous Sandstones
Upload
independentCategory
view
2download
0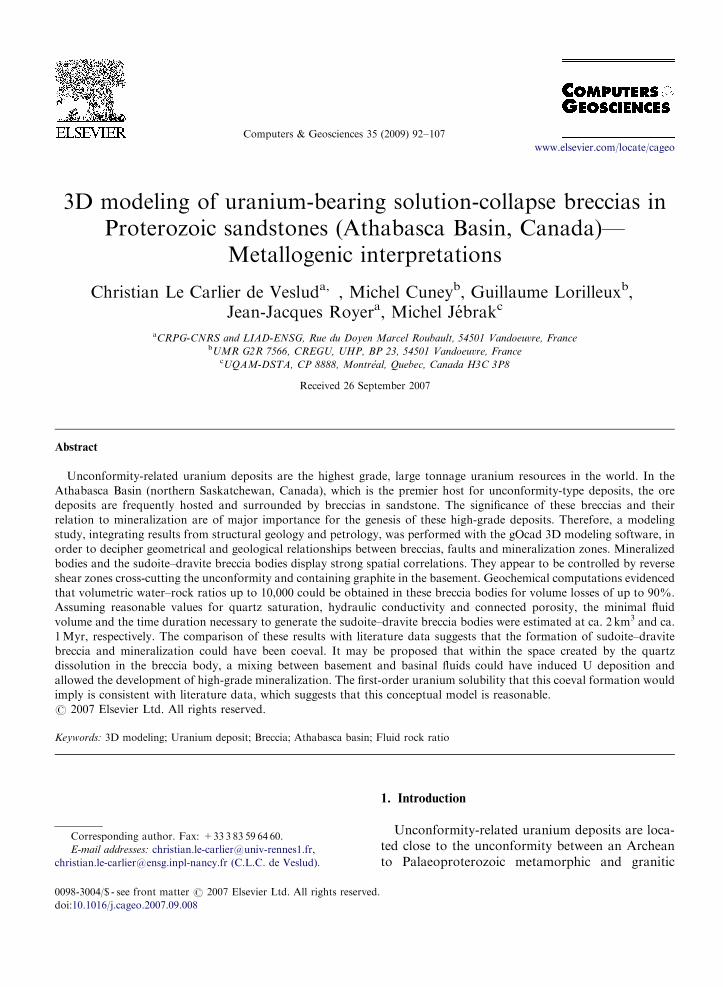
ARTICLE IN PRESS
0098-3004/$ - se
doi:10.1016/j.ca
�CorrespondE-mail addr
christian.le-carl
Computers & Geosciences 35 (2009) 92–107
www.elsevier.com/locate/cageo
3D modeling of uranium-bearing solution-collapse breccias inProterozoic sandstones (Athabasca Basin, Canada)—
Metallogenic interpretations
Christian Le Carlier de Vesluda,�, Michel Cuneyb, Guillaume Lorilleuxb,Jean-Jacques Royera, Michel Jebrakc
aCRPG-CNRS and LIAD-ENSG, Rue du Doyen Marcel Roubault, 54501 Vandoeuvre, FrancebUMR G2R 7566, CREGU, UHP, BP 23, 54501 Vandoeuvre, France
cUQAM-DSTA, CP 8888, Montreal, Quebec, Canada H3C 3P8
Received 26 September 2007
Abstract
Unconformity-related uranium deposits are the highest grade, large tonnage uranium resources in the world. In the
Athabasca Basin (northern Saskatchewan, Canada), which is the premier host for unconformity-type deposits, the ore
deposits are frequently hosted and surrounded by breccias in sandstone. The significance of these breccias and their
relation to mineralization are of major importance for the genesis of these high-grade deposits. Therefore, a modeling
study, integrating results from structural geology and petrology, was performed with the gOcad 3D modeling software, in
order to decipher geometrical and geological relationships between breccias, faults and mineralization zones. Mineralized
bodies and the sudoite–dravite breccia bodies display strong spatial correlations. They appear to be controlled by reverse
shear zones cross-cutting the unconformity and containing graphite in the basement. Geochemical computations evidenced
that volumetric water–rock ratios up to 10,000 could be obtained in these breccia bodies for volume losses of up to 90%.
Assuming reasonable values for quartz saturation, hydraulic conductivity and connected porosity, the minimal fluid
volume and the time duration necessary to generate the sudoite–dravite breccia bodies were estimated at ca. 2 km3 and ca.
1Myr, respectively. The comparison of these results with literature data suggests that the formation of sudoite–dravite
breccia and mineralization could have been coeval. It may be proposed that within the space created by the quartz
dissolution in the breccia body, a mixing between basement and basinal fluids could have induced U deposition and
allowed the development of high-grade mineralization. The first-order uranium solubility that this coeval formation would
imply is consistent with literature data, which suggests that this conceptual model is reasonable.
r 2007 Elsevier Ltd. All rights reserved.
Keywords: 3D modeling; Uranium deposit; Breccia; Athabasca basin; Fluid rock ratio
e front matter r 2007 Elsevier Ltd. All rights reserved
geo.2007.09.008
ing author. Fax: +33 3 83 59 64 60.
esses: [email protected],
[email protected] (C.L.C. de Veslud).
1. Introduction
Unconformity-related uranium deposits are loca-ted close to the unconformity between an Archeanto Palaeoproterozoic metamorphic and granitic
.

ARTICLE IN PRESS
Fig. 1. (a) Location of Athabasca basin in Canada and of Shea Creek deposit at the southwestern edge of the Basin. Other main uranium
deposits in the basin are also indicated: Cl L ¼ Cluff Lake, MA ¼McArthur, CL ¼ Cigar Lake, S ¼ Sue; (b) geological map of Anne
area, in Shea Creek exploration zone at �350m asl (unconformity level, modified from Lorilleux, 2002). Locations of cross-sections used
to build the 3D model are also indicated.
C.L.C. de Veslud et al. / Computers & Geosciences 35 (2009) 92–107 93
basement, and a Late Palaeo- to Mesoproterozoicsandstone cover. Such deposits have been discov-ered mainly in the 1970s, in the McArthur Basin inAustralia and in the Thelon and Athabasca Basinsin Canada. The Athabasca Basin, located in north-ern Saskatchewan (Fig. 1), is the premier host forsuch unconformity-type deposits. In this basin,sandstones host several disseminated to high-gradeuraninite deposits,1 such as the giant McArthur andCigar Lake deposits (Fig. 1). In the recentlydiscovered Shea Creek deposits (Fig. 1), high-gradeU3O8 concentrations (e.g. 10% over 10m, and up to50% over 3.5m have been reported).2 All together,
1http://uex-corporation.com/s/AthabascaBasin.asp2http://www.uex-corporation.com/
the deposits of the Athabasca Basin correspond toestimated reserves of about 1,250,000 pounds ofU3O8, corresponding to about 500,000 tons ofmetallic uranium (see footnote 3 and Wheatleyet al., 1996). Because of their extremely high grade,these deposits represent the most profitable uraniumresources in the world.
In the Athabasca Basin, unconformity-relateduranium ore deposits are generally located at theintersection of several fault directions cross-cuttingthe unconformity, the main ore-controlling struc-ture being a graphite-rich shear zone. The uraniumore deposits are also frequently hosted and
3http://uex-corporation.com/s/AthabascaBasin.asp

ARTICLE IN PRESSC.L.C. de Veslud et al. / Computers & Geosciences 35 (2009) 92–10794
surrounded by breccias in the sandstone within afew tens of meters. Such breccias have beenespecially well described in the Shea Creek deposit(Fig. 1, Rippert et al., 2000; Lorilleux et al., 2002),but also occur in other unconformity-relateduranium deposits such as the Sue deposit (Fig. 1,Lorilleux et al., 2003). The significance of thesebreccias, their relationships with faulting andmineralization processes still have to be betterevaluated. However, the study of such relationshipsis particularly difficult because of the complex 3Dinteractions between the geological structures, thedistribution of the breccias and of the mineraliza-tion, which cannot be represented appropriatelyonly using classical 2D mapping methods. Hence, a3D geometrical modeler where all geological datamay be integrated, insuring their coherency andallowing the calculation of complex volumes,considerably helps to improve the interpretations,and thus represents an optimal first-order tool toanswer these questions. The Shea Creek explorationarea has been selected as a case study because of theextensive development of breccias, their variety, forthe dense exploration drilling pattern (20–40mintervals between wells in the southern partcorresponding to the Anne deposit area) and theimportance of available structural data. The Annedeposit area extends over 600m from north tosouth, 200m in the east–west direction and about800m vertically. This volume has been modeled in3D with the gOcad software, to decipher thecomplex geometrical and geochemical relationshipsbetween faults, breccias and mineralized zones.
The purpose of this study is therefore two-fold:(1) to build a 3D model integrating all the geologicalstructures (faults, mineralized bodies, brecciabodies) and (2) to provide quantitative evaluationof the fluid flows involved in the formation of thebreccias and the uranium ore deposit in the Annearea.
2. Geological setting
The Athabasca Basin (Fig. 1) lies within thenorthern part of the Saskatchewan Province (Fig. 1).The sediments have been deposited during LatePalaeoproterozoic to Mesoproterozoic, at about1.7Ga (Ramaekers and Catuneanu, 2004) and areseparated from the underlying basement by a majorunconformity. The Athabasca Group is the majorpreserved unit of the basin located at its base(Ramaekers and Catuneanu, 2004). It is composed
of thick, unmetamorphosed flat-lying sequences offluviatile quartzose sandstones deposited in a proximalshelf environment (Ramaekers and Catuneanu, 2004).A maximum total thickness of 4–5km of sediments inthe basin has been proposed based on fluid inclusionsand diagenetic clay assemblages studies (Pagel, 1975;Hoeve et al., 1981; Halter, 1988).
The Shea Creek area is located in the western partof the Basin. Three main Palaeoproterozoic base-ment lithostratigraphic units have been identified: ametasedimentary unit (consisting of metapelites andgarnetites) in which graphite is mainly concentratedalong reverse faults, surrounded by two meta-igneous felsic gneiss units, one above and anotherbelow the metasedimentary package (Fig. 1). Theuneroded sandstone cover is about 750m thick.From bottom to top, six formations have beendistinguished in the sandstone in this locality(Ramaekers, 1990): Manitou Falls C (MFc), ManitouFalls D (MFd), Lazenby Lake (LzL), WolverinePoint A (WPa), Wolverine Point B (WPb) andLocker Lake (LL). The sandstones hosting thebreccias and the ore deposit mainly belong to theMFc Formation, which directly overlies the basementat Shea Creek. The high-grade uranium ore consistsof massive pitchblende veins or impregnationsoccurring 40m down into the basement, and 40mup into the sandstone above the unconformity. Theuranium depositions and/or remobilizations eventsin the Athabasca Basin have been initiated by atleast three main regional tectonic episodes between1.52 and 1.25Ga, at about 900Ma and around300Ma (Laine, 1985; Philippe et al., 1993; Fayekand Kyser, 1997; Lorilleux et al., 2002). The firsturanium deposition stage occurred during a diagen-esis event at a temperature of about 200–250 1C(Halter, 1988; Kotzer and Kyser, 1995; Derome et al.,2002).
3. 3D modeling
3.1. Available data
The Shea Creek area offers poor outcroppingconditions. The unconformity is relatively deep (atabout 750m) and all the geological structurescontrolling the mineralization and the brecciabodies cannot be tracked up to the surface. Noseismic data are available on the area. Thus, theonly data available are the borehole data, whichprovide accurate but local information on the distri-bution, nature and importance of the geological

ARTICLE IN PRESSC.L.C. de Veslud et al. / Computers & Geosciences 35 (2009) 92–107 95
structures. Unfortunately, the well data cannotprovide any information on the lateral continuityof geological structures. It is therefore necessary tointegrate different kinds of data, from hard but localdata (such as borehole information) to moreinterpretive data. Thus, five main kinds of datahave been used to build the 3D model:
1.
Th
A set of about 65 logs of drilling provided by theCOGEMA mining company. The drilling patternconsists of sub-parallel, N45-oriented lines ofwells. This pattern is dense in the SE part of thestudied area (20–40m intervals between wells,Fig. 1), thus allowing an accurate characterizationof geological structures. By contrast to the NW,the drilling pattern is wider, with up to 100mbetween wells. The boreholes provide geological(location and description of the different litholo-gical facies), petrological (description of alterationfacies) and logging data (e.g. radiometry). Geo-chemical data are available along most of theseboreholes, but unfortunately not for all.
2.
Electromagnetic surveys that trace conductivegeophysical anomalies linked to the graphiticgneiss units in the basement, and faults asso-ciated with these lithologies. This type of data isvery interesting because ore deposits are gener-ally associated with these two markers. Ofcourse, the geophysical data cannot be comparedwith the borehole data because of the largedifference of resolution between the two sets ofdata. It however provides interesting informationconcerning the general trend of structures.e synthesis of these data led to
3.
A typology of four types of faults recognizedfrom their orientation and their type of motion(Table 1). These faults represent Palaeoproter-ozoic basement faults reactivated during theMesoproterozoic that affect to a variable extentthe overlying sedimentary cover. This typologywas mainly deduced from borehole data, but alsofrom geophysical data.4.
4http://www.earthdecision.com/
A typology of the sandstone-hosted brecciaestablished and classified chronologically accord-ing to the type of matrix and degree of corrosionby fluids from detailed petrographic cores ana-lyses (Lorilleux et al., 2002). The two mainbreccia types considered in the present study arethe sudoite–dravite and Fe–chlorite brecciasbecause they represent by far the largest volumes
and they are the most closely related to themineralization processes (Table 2).
5.
Thirteen interpreted horizontal and verticalcross-sections, constructed from a detailed map-ping of structures and breccia bodies along thedrill cores (see location in Fig. 1, Lorilleux, 2001;Lorilleux et al., 2002 and works of COGEMAgeologists). They consist in two horizontal cross-sections, at �350m asl (level of the unconfor-mity, Fig. 1) and �390m asl, and 11 verticalcross-sections, roughly sub-parallel (one of themshown in Fig. 2), located in the areas where theborehole alignment and density are favorable. Itis interesting to note that a fault hierarchyconsistent with the fault typology is also pro-posed from these cross-sections. Due to itsspecific interest for the understanding of ore-forming processes, the area close to the uncon-formity has been especially detailed on all thesections, including the faults, the horizons, themineralized body and the breccia bodies.The construction of the 3D model was mainlybased on borehole data and interpretive cross-sections. Obviously, the lack of accurate data indepth may induce a wide range of interpretations. Inaddition, the irregular distribution and the N45trend of the well lines might have biased the data forthe structures, which are more or less parallel to thisdirection. However, the set of interpretive cross-sections constitutes a consistent synthesis of avail-able data. This synthesis suggests that the maingeological structures in the area are globallyoriented N135 and relatively continuous along thisdirection.
3.2. Construction of the 3D model
In a mining environment, typically available datainclude 3D drill core information, lithological,structural information, geochemical data and inter-pretive cross-sections. The data are generally moreor less regularly spaced, incomplete in the 3D spaceand, in addition, they do not present the same levelof uncertainty. Therefore, 3D geomodeling repre-sents a first-order tool for integrating different kindsof data and insuring consistency between data andmodels. In this study, the geometrical modeling wasperformed using the gOcad 3D modeler (Mallet,2002).4 This software is based on

ARTICLE IN PRESS
Table 1
Summary of main characteristics of four types of faults in Anne area, (Shea Creek exploration zone), after Lorilleux et al. (2002).
Displacement induced on these faults by reactivation posterior to deposition of Athabasca Group sediments (‘‘post-Athabasca’’) is also
indicated
Fault Type I Type II Type III Type IV
Importance Regional Local Regional Local
Azimuth N130–1501 N100–1101 N5–151 N50–601
Dip 20–401W 50–701N 50–701W 60–801S
Post-Athabasca
movement
Reverse Normal–sinistral Reverse Sinistral–reverse to
dextral–normal
Post-Athabasca
horizontal offset
0m 15–100m 0m 30m
Post-Athabasca
vertical offset
5–10m (35m for the
fault zone)
2–10m 10–20m 10m
Width in basement 3–5m 1–10m 3–5m 3–5m
Width in sandstone 10–25m 1–15m 20m 20m
Characteristics in
basement
Graphite rich and
parallel to the foliation
No graphite Graphite rich and
foliation drag folding
No graphite
Style Ductile–brittle with
brittle reactivations
Brittle Ductile–brittle with
brittle reactivations
Brittle
Table 2
Summary of main characteristics of two types of solution-collapse breccias in Anne area (Shea Creek exploration zone), after Lorilleux
et al. (2002)
Breccia type Sudoite—dravite
types I and II
Fe–chlorite intersection of types I, II
and IV
Main structural control (in order of
decreasing importance)
Geometry Shape Sheet Dome
Lateral extension 100m 70m
Vertical extension in
sandstones
35m 25m
Maximum thickness Few centimeters up
to several meters
Up to 10–15m
Distance from the
unconformity (m)
0-30 0-30
Volume (m3) 166,000 30,000
Texture Fragment shape Corroded Angular and corroded
Fragment composition Silicified sandstone Variably silicified sandstone
Matrix composition Chlorite–dravite Fe–chlorite+Fe–kaolinite, sulfides
% matrix 20–60% 20–70%
Dissolution intensity Volume loss (%) Up to 90 Up to 70
Water/rock ratio 6000–37,000 6000–30,000
Breccia maturity Medium to high Low to high
Mineralization U, Ni, Co U, Ni, Co
C.L.C. de Veslud et al. / Computers & Geosciences 35 (2009) 92–10796
1.
A discrete representation of objects throughregular (grid) or irregular (tessellation, Mallet,2002) meshes. In particular, the points, poly-gonal curves, triangulated surfaces and tetrahe-dralized solids used for building tessellations arerepresented in a unified model (Mallet, 2002).This representation is particularly suited for themodeling of complex 3D geological objects.For example, points and curves may representinput data (boreholes or cross-sections) whereas

ARTICLE IN PRESS
Fig. 2. Vertical cross-section A–B (see Fig. 1 for location) displaying relationships between different types of faults, sudoite–dravite
breccia body, unconformity and the ore deposit. Lithology legend is the same as for Fig. 1.
C.L.C. de Veslud et al. / Computers & Geosciences 35 (2009) 92–107 97
continuous or discontinuous triangulated sur-faces allow to model faulted horizons, multi-valued surfaces or closed orebodies.
2.
A representation of relationships (so called‘‘constraints’’) between geological objects.A geological surface (fault, horizon) that musthonor data points, or a horizon that must be incontact with an already built fault are twoexamples of constraints that may be defined(Fig. 3, see Mallet, 1997, 2002 for moreexamples of constraints available in the gOcadsoftware).The discrete smooth interpolation (DSI) pro-posed by Mallet (1992, 2002) is based on thesetwo representations. Given a discrete geologicalobject (e.g. a triangulated surface) which musthonor a set of data, the DSI method minimizes acost function, which is a weighted sum of (a) alocal geometrical roughness, defined at eachnode as the square difference between itsposition and the weighted average position ofits neighbors in the mesh and (b) the degree ofviolation of the constraints applied to thisobject. In other words, the nodes of the tri-angulated surface are moved in such way thatthe final surface is smooth (no abrupt variationand triangles as close as possible to equilateraltriangles) and as close as possible to data points.The uncertainty attached to the data to behonored may be taken into account with thisapproach. For example, for borehole data thatmust be honored strictly, only term (b) isconsidered whereas for seismic or interpretivedata, both (a) and (b) are considered. Ifnecessary, the density of the surface mesh maybe locally increased, according to the variabilityof the data (for example, by using curvatureanalysis or error estimates). Thanks to thesimplicial representation, the same algorithmmay be used to interpolate curves, surfaces andsolids.Globally, the construction of the 3D model(synthesized in Fig. 4) comprised two mainstages:
(i)
The first step consists of the introduction of datathat represent partial and local informationindicating the location of geological structures.The cross-sections were converted from DXF togOcad format and then georeferenced in UTMcoordinate system. The borehole data, already
ARTICLE IN PRESS
Fig. 3. Examples of constraints that may be imposed between a surface under construction and other objects. (a) A border of a fault is
constrained to remain in contact with an already built fault. (b) Shown in cross-section for the sake of clarity, a closed surface, such as an
ore body envelop, is constrained to honor data points. During interpolation process with DSI method, points of mesh of surface are
moved in such way that the final surface is smooth (no abrupt variation and triangles as close as possible to equilateral triangles) and as
close as possible to data points.
5h
htm
C.L.C. de Veslud et al. / Computers & Geosciences 35 (2009) 92–10798
in UTM coordinates, were converted fromASCII to gOcad format. At this point, minorinconsistencies between data, mainly concerningthe intersection between vertical and horizontalcross-sections, were corrected using local editingtools, assuming that vertical sections were moreaccurate than the horizontal ones.
(ii)
In the second stage, continuous or discontin-uous triangulated surfaces, which represent theboundaries of geological objects (e.g. faults,horizons, unconformity) were constructed.When the density of data is high, this construc-tion may be performed automatically thanks tointegrated workflows.5 However, due to limiteddata, a two-step process was used: (1) draftgeological objects were built piecewise betweenconsecutive cross-sections, using three methods(Fig. 5, see also Mallet, 2002) allowing thettp://www.earthdecision.com/products/basemodule_structural.
l
construction of different types of triangulatedsurfaces from their boundaries. For example,the ‘‘strip’’ algorithm was used to build faultsurfaces whereas the combination of both‘‘skin’’ and ‘‘pant’’ was necessary to model themore complex breccia body (Fig. 5b). (2) Thetriangulated surfaces were fitted to all availabledata, and their geometrical and geologicalrelationships (e.g. fault hierarchy) were insuredthrough the DSI method.
The construction of the surface model usingthe DSI method provides triangulated surfaceswith good-quality meshes (limiting numerical in-stabilities), which honor data and are geologicallyand geometrically consistent. Finally, this surfacemodel may be used to build a boundary representa-tion or b-rep of the model (defined as a ‘‘sealedgeological model’’ by Caumon et al., 2004), andthus to automatically partition the space intoregions.

ARTICLE IN PRESS
Fig. 4. Schematic workflow used in this study.
C.L.C. de Veslud et al. / Computers & Geosciences 35 (2009) 92–107 99
4. Results
A first-order 3D model of the Anne area wasbuilt, including a consistent fault network, thehorizons, the envelops of the mineralized bodyand of the two main types of breccia bodies.
The mineralized body (based on a cutoff of 0.1%)appears generally as a thin but elongated closedbody roughly oriented N150 (Fig. 6). Its thicknessvaries from few meters to a maximum of about20m, with an average value of 10m. The miner-alized body appears to be nested mainly above thebasement wedge caused by the reverse motion alongtype-I faults (Fig. 6), where the unconformitypresents the strongest altitude variation (cumulatedrelative uplift of ca. 25m). Above this reverselyfaulted zone, the stratigraphic limits between thedifferent sedimentary formations of the basin alsopresent a sink, progressively decreasing upwards.Several thin and finger-shaped extensions of themineralization are observed above or under theunconformity. These fingers have a width of only afew meters and do not extend more than 15m fromthe unconformity level. Their orientation is mainlycontrolled by type-I faults and parallel low-angle
dipping tension gashes (Figs. 2 and 6). This featureprovides evidence for control of the mineralizationby the fault network.
Both sudoite–dravite and Fe–chlorite breccias areobserved above the unconformity level. The sudoi-te–dravite breccia body displays strong spatialcorrelations with the mineralized body. The 3Dmodel highlights a major geometrical differencebetween these two breccia types. The sudoite–dra-vite breccias appear as a complex set of sub-parallelsheets, mainly controlled by type-I faults (Fig. 7).These sheets are rooted on the unconformityaltitude jump. They extend over several hundredsof meters along the unconformity, with a lateralextension varying from 50 to 100m. Their verticalextension is about 35m. In the studied area, a totalvolume of ca. 166,000m3 has been calculated fromthe 3D model. By contrast, the Fe–chlorite brecciadisplays a more compact dome shape (Fig. 8), whichseems to be less influenced by the faults. In fact, theFe–chlorite breccia is located at the intersection oftype-I, -III and -IV faults. Its length and width isabout 70m for a height of about 30m. The 3Dmodel indicates a total volume of ca. 30,000m3. Thedome shape (Fig. 8) is typical of collapse breccia

ARTICLE IN PRESS
From two open curves
("strip")
Z
N
E
Correlations between
consecutive sections
Cross sections
Sandstones
Basement
Unconformity
surface
From two series of closed curves
("pant")
From two closed curves
("skin")
Type I fault
surface
Fig. 5. (a) Basic construction tools used in gOcad for building geological triangulated surfaces from their boundaries. Surfaces have been
smoothed with DSI method (Mallet, 2002). (b) 3D view from SE showing some surfaces already built (two type-I faults) and polygonal
contour of sudoite–dravite breccia body that must be built from each cross-section to the next one using tools seen in (a).
C.L.C. de Veslud et al. / Computers & Geosciences 35 (2009) 92–107100

ARTICLE IN PRESS
300 m
400 m
600 m
Unconformity
Wells
Mineralized body
N
E
N
E
Mineralized body
-375
-370
-365
-360-355
-315
-320
-325
-330
z
z
-375
-370
-365
-315
-320
-325
-330
-335
Unconformity
Type I faults
Fig. 6. (a) 3D view from E of whole set of wells used to build model, unconformity surface and ore body. Model shows that ore body is
nested along inconformity altitude variation, (b) 3D view from SE of unconformity surface, ore body and only some type-I fault (for the
sake of clarity). Ore body displays finger-shaped extensions above or under unconformity, which are mainly controlled by type-I faults.
C.L.C. de Veslud et al. / Computers & Geosciences 35 (2009) 92–107 101

ARTICLE IN PRESS
E
N
E
N
Unconformity
Sudoite-dravite breccia body
150 m
200 m
300 m
Type-I faults
Unconformity
Type-IV fault
-375
-370
-365
-360-355
-315
-320
-325
-330
-350
-375
-370
-365
-360
-355
-315
-320
-325
-330
Type-I faults
Fig. 7. 3D views of sudoite–dravite breccia body (a) from SE and (b) from NE (Anne deposit area). 3D model appears as a unique tool for
imaging a complex 3D body. Sudoite–dravite breccias appear as a complex set of sub-parallel sheet rooted on unconformity altitude jump,
mainly controlled by type-I faults. In the studied area, 3D model indicates a total volume of ca. 166,000m3.
C.L.C. de Veslud et al. / Computers & Geosciences 35 (2009) 92–107102
bodies such as those occurring in Mississippi Valleytype deposits (Sass-Gustkiewicz, 1996), but in thislast example they result from massive carbonatedissolution.
Each type of faults (I, III and IV) presents specificdips and azimuths. However, the dip of type-I faultsvaries when they cross type-IV faults (Fig. 6). Thischange of dip mainly occurs above the mineralized

ARTICLE IN PRESS
Unconformity
Fe-chlorite breccia body
Type-I faults
Type-IV faults
Type-III faults
150 m
300 m
200 m
EN
-315
-320
-325
-330
-335
-345
-350
-355
-360
-365
-370
-375
-340
Fig. 8. 3D view from NE of Fe–chlorite breccia in Anne deposit area. This breccia has a more compact, dome shape, which seems to be
less influenced by faults than sudoite–dravite breccia (Fig. 5). This type of breccia is located at intersection of type-I, -III and -IV faults. 3D
model indicates a total volume of ca. 30,000m3.
C.L.C. de Veslud et al. / Computers & Geosciences 35 (2009) 92–107 103
zone, where the unconformity and the overlyinghorizons display the most significant altitude varia-tion. Such altitude variations are interpreted asproduced by the collapse of the breccias inducedby the extreme quartz dissolution observed inand around the mineralized bodies in the sudoite–dravite breccia (see below).
5. Application to the breccia genesis and uranium
mineralization process
The spatial correlation between breccias anduranium ore, and the presence of typical uncon-formity-type hydrothermal alteration minerals(Thomas et al., 1998) in the breccia cement suggestthat breccias and uranium mineralization werecoeval. At Shea Creek, the first and main uraniumdepositional event is associated with the develop-ment of sudoite–dravite breccias (Lorilleux et al.,2002). Therefore, this study is mainly focused onthis type of breccia. The geometrical relations in the3D model of type-I faults, mainly controlling the
sudoite–dravite breccias, suggest that during theregional tectonic events, graphite-rich basement-rooted reverse faults have been preferentiallyreactivated (Baudemont et al., 1993). The newfractures probably caused both buoyancy- andfluid pressure gradient-driven, basement-derived,silica-undersaturated, fluid circulation upward insandstones.
Accurate petrophysical, geochemical, mineralogi-cal and mass balance studies (details that are out ofthe scope of this paper may be found in Lorilleux,2001) were performed on 17 samples covering thedifferent types of breccias. They indicate that thebreccias associated with uranium deposits devel-oped in three steps: firstly hydraulic fracturing, thenquartz dissolution and finally collapse. This evolu-tion reflects increasing fluid–rock interactions ex-pressed by increasing matrix proportion resultingfrom quartz dissolution and mainly recrystallizationof clay minerals. The initial hydraulic fracturing wasfacilitated by an early pervasive silicification episodethat decreased the permeability of the sandstone.

ARTICLE IN PRESSC.L.C. de Veslud et al. / Computers & Geosciences 35 (2009) 92–107104
Mass balance computations based on Grant’smethod (1986), assuming that Zr was immobile,indicate that quartz dissolution led to importantvolume losses of up to 90% in the most maturesudoite–dravite breccia zones and about 65% inFe–chlorite-collapsed zones (Table 2).
The breccia formation appears to involve com-plex hydro-mechanical processes coupled with masstransfers. Modeling such processes would thus bevery difficult. However, the integration of all thesedata with the 3D model allows one to perform ongeometrically complex objects first-order geochem-ical computations that are of major importance forcharacterizing the formation of the breccias, and totest if the breccia formation and the mineralizationcould have been coeval. Firstly fluid/rock ratiosassociated with the sudoite–dravite breccia forma-tion may be calculated using the quartz solubilityand the amount of dissolved quartz, assuming asilica saturation t of 90%. A quartz solubility values of 10�2mol kg�1 in pure water at 250 1C and100MPa (Tester et al., 1994) was chosen torepresent the peak diagenetic conditions during thehydrothermal event. The mass percentage of dis-solved quartz MD
qtz is given by
MDqtz ¼M0
qtz �MAqtzVL. (1)
Thus, the mole number n of dissolved quartz is
n ¼ 1000ðMDqtz=100Þ=60. (2)
Finally, assuming a dissolution efficiency of100%, the volumetric water–rock ratio rwr isobtained from
rwr ¼ doðn=ðs:t=100ÞÞ, (3)
where M0qtz and MA
qtz are, respectively, the masspercentage of quartz in the protolith, in the alteredsample, VL the volume loss in % obtained frommass balance calculations and doE2.5 is the densityof the protolith (Lorilleux, 2001). This computationgives a minimum estimate for rwr because it assumesa dissolution efficiency of 100%, without any kineticeffect. The obtained fluid/rock ratios range from5000 to about 37,000 for the most mature samplescorresponding to the highest volume losses. Fluid/rock ratios of up to 10,000 have been alreadydocumented by Goddard and Evans (1995) for fluidflows in faulted zones. Such high fluid/rock ratiosindicate that huge volumes of hydrothermal fluidshave circulated within the breccias. A first-orderestimation of the volume of fluid and of the timenecessary for the formation of the breccias can be
made. Assuming an average volumetric fluid/rockratio rwr, the fluid volume Vw required to form abreccia volume Vb would be Vw ¼ rwrVb. For thewhole sudoite–dravite breccias, an average fluid/rock ratio rwr of about 10
4 and a total volume of ca.170,000m3 lead to a total volume of fluid of1.7 km3. The 3D model suggests that the geometryof the breccia may be simplified into a set of sub-parallel long sheets rooted in the unconformity thatare on average L long, w wide and h high. Such abreccia sheet would have a volume Vb given by:
Vb ¼ Lwh. (4)
Therefore, a volume Vw of fluid, passing througha porous surface (Lwf) corresponds to a theoreticalwater column height Hwc of
Hwc ¼ V w=ðLwfÞ ¼ ðrwrhÞ=f. (5)
Assuming an average fluid velocity of q in thefracture, the time duration T needed to form thebreccia sheet would be
T ¼ Hwc=q (6)
It is difficult to infer this porosity and subsequentpermeability of the breccias due to their develop-ment through time, with both a progressive increaseof the volume of the dissolution cavities that wouldhave enhanced the porosity, and at the same timemineral precipitation and breccia collapse thatwould have sealed off the system. An averageconnected porosity f for the brecciated sandstonesranging from 1% to 5% was considered forcalculation (Lorilleux, 2001). Regional-scale fluidvelocities of ca. 1–10myr�1 over several hundredsof kyr were obtained by Raffensperger and Garven,(1995a, b) from numerical models. However, due tothe presence of strongly fractured zones, fluidvelocities of ca. 100m yr�1 were also considered inour computations. The results obtained show thatthe minimum time for the formation of thesudoite–dravite breccia ranges from several tens ofkyr to several Myr (Table 3).
This long time of formation is consistent with the0.1–1Myr time estimated from numerical hydro-dynamic and hydrochemical modeling at basin scaleby Raffensperger and Garven (1995a, b) for theformation the large high-grade uranium mineraliza-tion of the Athabasca basin. This result alsoindicates that the formation of the sudoite–dravitebreccias and the mineralization could have beencoeval. At this point, it is possible to check thishypothesis. If the total volume of fluids of 1.7 km3

ARTICLE IN PRESS
Table 3
Time duration needed to form sudoite–dravite breccia body in
Anne area assuming an average fluid/rock ratio rwr ¼ 104 with
silica saturation close to 90%, a dissolution efficiency of 100%
and for several values of both porosity and fluid velocity in
fracture
Fluid velocity Porosity
1% 5%
1myr�1 25Myr 5Myr
10myr�1 2.5Myr 500 kyr
100myr�1 250 kyr 50 kyr
C.L.C. de Veslud et al. / Computers & Geosciences 35 (2009) 92–107 105
required to form the whole sudoite–dravite brecciabody is assumed to be also responsible for theformation of the uranium deposit, a first-ordersolubility of U in the fluid may be calculated.Assuming that 5,000–15,000 tons of U are present inthe zone (Lorilleux, 2001), and a depositionefficiency of 100%, 1.7 km3 of fluid implies asolubility of ca. 4–12 ppm. This order of magnitudeis in agreement with the uranium solubility valuesobtained from geochemical modeling by Komninouand Sverjensky (1996) for the thermodynamicconditions prevailing in unconformity-type uraniumdeposits (i.e. temperature of ca. 200–250 1C, pH of4.5–5). This agreement between the two types ofestimation suggests that a coeval formation ofsudoite–dravite breccias and uranium mineraliza-tion can be reasonably assumed. Although thecalculated solubility values must be considered asfirst-order estimates, these results indicate that thefluids responsible for unconformity-type uraniumdeposits must have had high oxygen fugacities(log f O2
between �28 and �25 according to Fig. 3of Komninou and Sverjensky, 1996) to transport anappreciable amount of uranium. Following Loril-leux (2001), it may also be proposed that the spacecreated by quartz dissolution within sudoite–dravitebreccia bodies was the site of mixing betweenreducing silica-undersaturated, basement-derivedfluids and the uranium-bearing oxidized fluids,and formed the trap for the uranium mineralization.
Although the results are based on conceptualmodels coupling an interpretive 3D model withsimplified mass balance computations, the calcu-lated values for both time duration to form thebreccia and uranium solubility are consistent withresults obtained independently on the same kind ofuranium deposit by Raffensperger and Garven
(1995a, b) and Komninou and Sverjensky (1996).Thus, the consistency of the values obtained by thedifferent approaches suggests that the conceptualmodel used in our computation is relevant for theAnne area. Conversely, strongly discordant resultswould have suggested a significant revision of the3D model and/or the fluid flow parameters used inthe estimations.
6. Conclusions
This study shows an application of 3D modelingby creating geologically relevant models of oredeposits, associated structures and alteration envel-opes. The integration of different types of geologicaldata (structural geology, geochemistry, lithology)on a 3D basis allow one first to test their internalcoherency. It also helps to understand geometricalconstraints and dependencies between all availabledata, thus improving the interpretations. In thepresent study, the comparison of mass balance datawith the 3D model enabled geochemical computa-tions on geometrically complex objects. It alsoallowed to constrain quantitatively the processesin relation with the formation of the breccias.Water–rock ratios up to 37,000 have been estimatedfor the formation of breccia bodies for volumelosses of up to 90%. Assuming reasonable values forquartz saturation, hydraulic conductivity and con-nected porosity, the minimal fluid volume and thetime duration necessary to generate the sudoite–dravite breccia bodies was estimated at ca. 2 km3
and ca. 1Myr, respectively. The results of thepresent study and literature data further suggestthat the formation of sudoite–dravite breccia anduranium mineralization could have been coeval.Uranium solubility values derived from this con-ceptual model are also comparable with previouslypublished estimates. The large open spaces createdby quartz dissolution in the breccia body havefocused the mixing between basement and basinalderived fluids, which may have induced uraniumdeposition and allowed the development of massive,extremely high-grade mineralization.
Acknowledgments
We would like to acknowledge COGEMA for itsfinancial, technical and geological support. D. Becelis thanked for his help in the construction of theGOcad model. The discussions with Patrice Bruneton,Jean Mondy and Jean-Claude Rippert have been

ARTICLE IN PRESSC.L.C. de Veslud et al. / Computers & Geosciences 35 (2009) 92–107106
very fruitful for the writing of the present paper.The two anonymous referees greatly helped toimprove the manuscript. The Earth DecisionCompany6 is also thanked for the access to thegOcad software.
References
Baudemont, D., Piquard, J.P., Ey, F., Zimmerman, J., 1993. The
Sue uranium deposits, Saskatchewan, Canada. Exploration
and Mining Geology 2, 179–202.
Caumon, G., Lepage, F., Sword, C., Mallet, J.L., 2004. Building
and editing a sealed geological model. Mathematical Geology
36 (4), 405–424.
Derome, D., Cuney, M.L., Cathelineau, M., Fabre, C., Lhomme, T.,
2002. Reconstitution of individual fluid inclusion composition
using microthermometry, Raman and laser induced break-
down spectroscopy. Application to the Shea Creek U deposit
(Saskatchewan, Canada) (poster). In: Proceedings of the
Geological Association of Canada, Mineralogical Association
of Canada Annual Meeting, Saskatoon, 27pp./http://gac.esd.
mun.ca/gac_2002/search_abs/sub_program.asp?sess=98&form=
10&abs_no=451S.
Fayek, M., Kyser, T.K., 1997. Characterization of multiple fluid-
flow events and rare-earth-element mobility associated with
formation of unconformity-type uranium deposits in the
Athabasca Basin, Saskatchewan. The Canadian Mineralogist
35, 627–658.
Goddard, J., Evans, J., 1995. Chemical changes and fluid–rock
interaction in faults of crystalline thrust sheets, northwestern
Wyoming, USA. Journal of Structural Geology 17 (4),
533–547.
Grant, J.A., 1986. The isocon diagram, a simple solution to
Gresens’ equation for metasomatic alteration. Economic
Geology 81, 1976–1982.
Halter, G., 1988. Zonalites des alterations dans l’environnement
des gisements d’uranium associes a la discordance du
Proterozoıque Moyen (Saskatchewan, Canada) (Zonality of
alterations in the environment of uranium deposits asso-
ciated to Middle Proterozoıc unconformity (Saskatchewan,
Canada)). Ph.D. Dissertation, Universite Louis Pasteur,
Strasbourg, 252pp.
Hoeve, J., Rawsthorn, K., Quirt, D., 1981. Uranium metalloge-
netic studies: clay mineral stratigraphy and diagenesis in the
Athabasca Group. Saskatchewan Research Council Publica-
tion 22, 76–89.
Komninou, A., Sverjensky, D.A., 1996. Geochemical modeling of
the formation of an unconformity-type uranium deposit.
Economic Geology 91, 590–606.
Kotzer, T.G., Kyser, T.K., 1995. Petrogenesis of the Proterozoic
Athabasca Basin, northern Saskatchewan, Canada, and its
relation to diagenesis, hydrothermal uranium mineralization
and paleohydrogeology. Chemical Geology 120, 45–89.
Laine, R., 1985. The Carswell uranium deposits—an example of
not so unique unconformity-related uranium mineralization.
In: Laine, R., Alonso, D., Svab, M. (Eds.), The Carswell
Structure Uranium Deposits, Saskatchewan, Geological
Association of Canada Special Paper 29, pp. 225–230.
6http://www.earthdecision.com/
Lorilleux, G., 2001. Les breches associees aux gisements
d’uranium de type discordance du bassin d’Athabasca
(Saskatchewan, Canada) (Breccias associated to unconfor-
mity-related uranium deposits in the Athabasca Basin
(Saskatchewan, Canada)). Ph.D. Dissertation, Institut
National Polytechnique de Lorraine (INPL), Nancy, 319pp.
Lorilleux, G., Jebrak, M., Cuney, M., Baudemont, D., 2002.
Polyphase hydrothermal breccias associated with unconfor-
mity-related uranium mineralization (Canada): from fractal
analysis to structural significance. Journal of Structural
Geology 24, 323–338.
Lorilleux, G., Cuney, M., Jebrak, M., Rippert, J.C., Portella, P.,
2003. Chemical brecciation processes in the Sue unconfor-
mity-type uranium deposits, Eastern Athabasca Basin
(Canada). Journal of Geochemical Exploration 80 (2–3),
241–258.
Mallet, J.L., 1992. Discrete smooth interpolation. Computer-
Aided Design 24 (4), 178–191.
Mallet, J.L., 1997. Discrete modeling for natural objects.
Mathematical Geology 29, 199–219.
Mallet, J.L., 2002. Geomodeling. Oxford University Press,
New York, 624pp.
Pagel, M., 1975. Determination des conditions physico-chimiques
de la silicification diagenetique des gres Athabasca (Canada)
au moyen des inclusions fluides (Determination of physico-
chemical conditions of Athabasca sandstones diagenetic
silicification (Canada) from fluid inclusions). Compte-rendu
de l’Academie des Sciences 280, 2301–2304.
Philippe, S., Lancelot, J.R., Clauer, N., Paquet, A., 1993.
Formation and evolution of the Cigar Lake uranuim deposit
based on U–Pb and K–Ar isotope systematics. Canadian
Journal of Earth Sciences 30, 720–730.
Raffensperger, J.P., Garven, G., 1995a. The formation of
unconformity-type uranium ore deposits; 1. Coupled ground-
water flow and heat transport modeling. American Journal of
Science 295, 581–636.
Raffensperger, J.P., Garven, G., 1995b. The formation of
unconformity-type uranium ore deposits; 2. Coupled hydro-
chemical modeling. American Journal of Science 295,
639–696.
Ramaekers, P., 1990. Geology of the Athabasca Group
(Helikian) in Northern Saskatchewan. Saskatchewan Energy
and Mines, Saskatchewan Geological Survey, Report 195,
49pp.
Ramaekers, P., Catuneanu, O., 2004. Development and se-
quences of the Athabasca basin, early Proterozoic, Saskatch-
ewan and Alberta, Canada. In: Eriksson, P.G., Altermann,
W., Nelson, D.R., Mueller, W.U., Catuneanu, O. (Eds.), The
Precambrian Earth: Tempos and Events, Developments in
Precambrian Geology. Elsevier Science, Amsterdam,
pp. 705–723.
Rippert, J.C., Koning, E., Robbins, J., Koch, R., Baudemont, D.,
2000. The Shea Creek Uranium Project, West Athabasca Basin,
Saskatchewan, Canada. In: Proceedings of GeoCanada2000,
The Millennium Geoscience Summit, GAC-MAC Joint Annual
Meeting, Abstract 570 (Conference CD), Calgary.
Sass-Gustkiewicz, M., 1996. Internal sediments as a key to
understanding the hydrothermal karst origin of the Upper
Silesian Zn–Pb ore deposits. Society of Economic Geologists
Special Publication 4, 171–181.
Tester, J.W., Worley, W.G., Robinson, B.A., Grigsby, C.O.,
Feerer, J.L., 1994. Correlating quartz dissolution kinetics in

ARTICLE IN PRESSC.L.C. de Veslud et al. / Computers & Geosciences 35 (2009) 92–107 107
pure water from 25 to 625 1C. Geochimica et Cosmochimica
Acta 58, 2407–2420.
Thomas, D.J., Matthews, R.B., Sopuck, V., 1998. Athabasca Basin
unconformity-type uranium deposits: A synopsis of the empirical
model and review of exploration and production trends. In:
Proceedings of the Canadian Institute of Mining, Metallurgy and
Petroleum meeting, Montreal, May 3–7 (CD-ROM).
Wheatley, K., Murphy, J., Leppin, M., Cutts, C., Climie, J.A.,
1996. Advances in genetic model and exploration techniques
on unconformity type uranium deposits in Athabasca basin.
In: Ashton, K.E., Harper, C.T. (Eds.), Proceedings of the
MinExpo ‘96 Symposium—Advances in Saskatchewan Geol-
ogy and Mineral Exploration: Saskatchewan Geological
Society, Special Publication No. 14, pp. 126–136.
Copyright © 2022 FDOKUMEN