Geochemistry of surface and subsurface waters in quartz-sandstones: significance for the geomorphic...
22
Geochemistry of surface and subsurface waters in quartz-sandstones: significance for the geomorphic evolution of tepui table mountains (Gran Sabana, Venezuela) Marco Mecchia a , Francesco Sauro a,b,⇑ , Leonardo Piccini a,c , Jo De Waele a,b , Laura Sanna d , Nicola Tisato e , Jesus Lira f , Freddy Vergara a,g a La Venta Geographic Explorations Association, Via Priamo Tron 35/F, 31100 Treviso, Italy b Department of Biological, Geological and Environmental Sciences, Italian Institute of Speleology, Bologna University, Via Zamboni 67, 40126 Bologna, Italy c Department of Earth Sciences, Florence University, Via La Pira 4, 50121 Florence, Italy d Institute of Biometeorology, National Research Council of Italy, Traversa La Crucca 3, 07100 Sassari, Italy e ETH Zurich, Geological Institute, Soneggstrasse 5, 8092 Zurich, Switzerland f Istituto Nacional de Parques, Caracas, Venezuela g Teraphosa Exploring Team, Puerto Ordaz, Venezuela article info Article history: Received 6 September 2013 Received in revised form 11 January 2014 Accepted 14 January 2014 Available online 22 January 2014 This manuscript was handled by Corrado Corradini, Editor-in-Chief, with the assistance of Michel Bakalowicz, Associate Editor Keywords: SiO 2 geochemistry Quartz-sandstone caves Landscape evolution Dissolution Weathering summary In situ measurements of discharge, pH, electric conductivity (EC), temperature, and SiO 2 content have been carried out during five expeditions in the last 20 years on the summit plateaus, inside caves and along the rivers of the surrounding lowlands of three tepui massifs in Venezuela (Auyan, Roraima, and Chimanta). Additionally, detailed chemical analyses were performed on waters sampled in a newly discovered exten- sive quartz-sandstone cave system on the Auyan Tepui. Rock samples of the quartz-sandstone bedrock from different locations have been analysed to obtain their chemical composition with a wavelength dis- persive X-ray fluorescence spectrometer. These data show that the majority of silica present in surface and subsurface water comes from dissolution of quartz and only in minor amount from hydrolysis of other sil- icate minerals. Probably the presence of a hardened crust of iron hydroxides limits the dissolution of silica on the top surface of tepuis. Dissolution in the subsurface, instead, is more significant and causes, in the long term, the ‘‘arenisation’’ of the quartz-sandstone and its subsequent removal by mechanical erosion. On the other hand, waters flowing on the arkosic rock outcropping on the lowland below the tepuis obtain their high dissolved silica content mainly from hydrolysis of silicates. The morphological evolution of these table mountains appears thus to be controlled mainly by the underground weathering of the quartz-sandstone, with the opening of deep fractures (grietas) and the col- lapse of large underground horizontal cave systems. Scarp retreat, instead, seems to be related to the higher weathering rate of the more arkosic formations underlying the quartz-sandstones. Ó 2014 Elsevier B.V. All rights reserved. 1. Introduction Extensive cave systems are found in quartz-sandstones of Pre- cambrian age outcropping in few areas around the world. These pe- culiar features are commonly developed in tectonically stable cratonic areas (for instance the Guyana Shield of Venezuela and Bra- zil, the Kaapvaal craton of South Africa, or the Westralian craton and Sydney Basin in Australia), being more prominent in humid tropical settings (like in the Minas Gerais state of Brazil, and in the quartz- sandstone outcrops in Thailand, Mozambique and in the Hunan province of China). However caves in quartz-sandstones were docu- mented also in actually hyperarid settings, like in Chad and Australia (for a complete list see Wray, 1997a, and references therein). Although the rate of dissolution of quartz in the acidic solutions commonly found on quartz-sandstones is among the slowest ones, the wide subterranean conduits and some peculiar surface land- forms formed in these rocks are clear evidences of intensive weath- ering (Wray, 2013). The resulting landscape has many features resembling karst and many authors (White et al., 1966; Martini, 1979, 1985, 2004; Piccini, 1995; Wray, 1997b; Doerr, 1999) have used such a term referring to this kind of geomorphic process although solution plays only a minor role, at least from a quantita- tive point of view. http://dx.doi.org/10.1016/j.jhydrol.2014.01.029 0022-1694/Ó 2014 Elsevier B.V. All rights reserved. ⇑ Corresponding author at: Department of Biological, Geological and Environ- mental Sciences, Italian Institute of Speleology, Bologna University, Via Zamboni 67, 40126 Bologna, Italy. Tel.: +39 0512094543. E-mail address: [email protected] (F. Sauro). Journal of Hydrology 511 (2014) 117–138 Contents lists available at ScienceDirect Journal of Hydrology journal homepage: www.elsevier.com/locate/jhydrol
Transcript of Geochemistry of surface and subsurface waters in quartz-sandstones: significance for the geomorphic...

Journal of Hydrology 511 (2014) 117–138
Contents lists available at ScienceDirect
Journal of Hydrology
journal homepage: www.elsevier .com/ locate / jhydrol
Geochemistry of surface and subsurface waters in quartz-sandstones:significance for the geomorphic evolution of tepui table mountains(Gran Sabana, Venezuela)
http://dx.doi.org/10.1016/j.jhydrol.2014.01.0290022-1694/� 2014 Elsevier B.V. All rights reserved.
⇑ Corresponding author at: Department of Biological, Geological and Environ-mental Sciences, Italian Institute of Speleology, Bologna University, Via Zamboni 67,40126 Bologna, Italy. Tel.: +39 0512094543.
E-mail address: [email protected] (F. Sauro).
Marco Mecchia a, Francesco Sauro a,b,⇑, Leonardo Piccini a,c, Jo De Waele a,b, Laura Sanna d, Nicola Tisato e,Jesus Lira f, Freddy Vergara a,g
a La Venta Geographic Explorations Association, Via Priamo Tron 35/F, 31100 Treviso, Italyb Department of Biological, Geological and Environmental Sciences, Italian Institute of Speleology, Bologna University, Via Zamboni 67, 40126 Bologna, Italyc Department of Earth Sciences, Florence University, Via La Pira 4, 50121 Florence, Italyd Institute of Biometeorology, National Research Council of Italy, Traversa La Crucca 3, 07100 Sassari, Italye ETH Zurich, Geological Institute, Soneggstrasse 5, 8092 Zurich, Switzerlandf Istituto Nacional de Parques, Caracas, Venezuelag Teraphosa Exploring Team, Puerto Ordaz, Venezuela
a r t i c l e i n f o s u m m a r y
Article history:Received 6 September 2013Received in revised form 11 January 2014Accepted 14 January 2014Available online 22 January 2014This manuscript was handled by CorradoCorradini, Editor-in-Chief, with theassistance of Michel Bakalowicz, AssociateEditor
Keywords:SiO2 geochemistryQuartz-sandstone cavesLandscape evolutionDissolutionWeathering
In situ measurements of discharge, pH, electric conductivity (EC), temperature, and SiO2 content have beencarried out during five expeditions in the last 20 years on the summit plateaus, inside caves and along therivers of the surrounding lowlands of three tepui massifs in Venezuela (Auyan, Roraima, and Chimanta).Additionally, detailed chemical analyses were performed on waters sampled in a newly discovered exten-sive quartz-sandstone cave system on the Auyan Tepui. Rock samples of the quartz-sandstone bedrockfrom different locations have been analysed to obtain their chemical composition with a wavelength dis-persive X-ray fluorescence spectrometer. These data show that the majority of silica present in surface andsubsurface water comes from dissolution of quartz and only in minor amount from hydrolysis of other sil-icate minerals. Probably the presence of a hardened crust of iron hydroxides limits the dissolution of silicaon the top surface of tepuis. Dissolution in the subsurface, instead, is more significant and causes, in thelong term, the ‘‘arenisation’’ of the quartz-sandstone and its subsequent removal by mechanical erosion.On the other hand, waters flowing on the arkosic rock outcropping on the lowland below the tepuis obtaintheir high dissolved silica content mainly from hydrolysis of silicates.
The morphological evolution of these table mountains appears thus to be controlled mainly by theunderground weathering of the quartz-sandstone, with the opening of deep fractures (grietas) and the col-lapse of large underground horizontal cave systems. Scarp retreat, instead, seems to be related to thehigher weathering rate of the more arkosic formations underlying the quartz-sandstones.
� 2014 Elsevier B.V. All rights reserved.
1. Introduction sandstone outcrops in Thailand, Mozambique and in the Hunan
Extensive cave systems are found in quartz-sandstones of Pre-cambrian age outcropping in few areas around the world. These pe-culiar features are commonly developed in tectonically stablecratonic areas (for instance the Guyana Shield of Venezuela and Bra-zil, the Kaapvaal craton of South Africa, or the Westralian craton andSydney Basin in Australia), being more prominent in humid tropicalsettings (like in the Minas Gerais state of Brazil, and in the quartz-
province of China). However caves in quartz-sandstones were docu-mented also in actually hyperarid settings, like in Chad and Australia(for a complete list see Wray, 1997a, and references therein).
Although the rate of dissolution of quartz in the acidic solutionscommonly found on quartz-sandstones is among the slowest ones,the wide subterranean conduits and some peculiar surface land-forms formed in these rocks are clear evidences of intensive weath-ering (Wray, 2013). The resulting landscape has many featuresresembling karst and many authors (White et al., 1966; Martini,1979, 1985, 2004; Piccini, 1995; Wray, 1997b; Doerr, 1999) haveused such a term referring to this kind of geomorphic processalthough solution plays only a minor role, at least from a quantita-tive point of view.
118 M. Mecchia et al. / Journal of Hydrology 511 (2014) 117–138
This work is focused on the quartz-sandstones of the tepui tablemountains in the Gran Sabana (Venezuela), considered the worldfinest quartz-sandstone karst (Wray, 2000).
Many hypotheses on the genesis of caves and karst-like featuresin quartz-sandstones have been discussed by previous authors. Allthe theories so far presented require the formation of loose sandsalong some preferential bedding planes, followed by their winnow-ing out (piping) from the quartzitic rocks by underground flowingwaters (Sczerban and Urbani, 1974; Galán and Lagarde, 1988).
The role in triggering speleogenesis by generating the ‘‘loosesands’’ has been assigned to rock dissolution by meteoric (Jennings,1983; Martini, 2000; Wray, 1997b; Piccini and Mecchia, 2009) orhydrothermal waters (Zawidzki et al., 1976) through a weatheringdissolution process called ‘‘arenisation’’. Other authors assign impor-tance to microbially-driven alkaline dissolution (Marker, 1976;Barton et al., 2009), or refer to the existence of loose sands in unlith-ified beds, also produced by dissolution and weathering of alumino-silicates (Aubrecht et al., 2011, 2012). All these theories are still underdiscussion and there is not yet a clear understanding of the main spe-leogenetic and morphogenetic factors involved (Sauro et al., 2013a).
Sauro et al. (2013a) pointed out some problems related to the‘‘unlithified beds’’ speleogenetic model proposed by Aubrechtet al. (2011), suggesting that the mineralogical composition andthe petrographical features (grain size, sorting, depositional struc-tures), and not the diagenetic degree of the bedrock probably con-trol the intensity of the weathering processes along different beds.
Chemical field analyses of waters represent a useful tool tounderstand the mechanisms and roles of SiO2 dissolution withrespect to other weathering processes and to give information onhow dissolution works in a real scenario. These data can then becompared with laboratory experiments of quartz dissolution(Krauskopf, 1956; Rimstidt, 1997 and references therein).
In this paper we focused on the geochemistry and SiO2 contentof surface and subsurface waters in the tepui table mountains. Themost complete set of chemical data currently available is presentedhere: 160 field analyses on waters (dissolved H4SiO4 expressed inSiO2 equivalent, pH, EC, temperature) carried out in three massifs(Auyan, Roraima and Chimanta) and six cave systems, in differenthydrodynamic settings. In fact, previous studies (Briceño et al.,1990; Ipiña, 1994; Mecchia and Piccini, 1999; Piccini and Mecchia,2009; Aubrecht et al., 2011) discussed data from single tepuis, orpeculiar cave systems. In addition, the concentration of major ele-ments, chlorides, sulphates, and nitrates in a very extensive cavesystem recently discovered on Auyan Tepui were measured. Final-ly, we coupled this dataset on water chemistry with wavelengthdispersive X-ray fluorescence analysis (WD-XRF) performed ondifferent tepuis quartz-sandstones in order to verify the potentialsignatures of mineral weathering.
2. Study area
2.1. Geographical, geological and climatic settings
The Gran Sabana is a vast geographical region located in north-ern South America, crossed by several tributaries of Caroní River,which flows into the Orinoco River. The main topographic eleva-tions have the shape of large tablelands named ‘‘tepuis’’, meaning‘‘mountains’’ in the local Pemon Indian language. In fact, quartz-sandstones (quartz-arenites cemented by quartz deposited in opti-cal continuity with detrital quartz) (Pettijohn et al., 1987) often caphigh hills, being among the most erosion-resistant rocks on Earth.The tepuis are bordered by vertical to overhanging walls, usuallyfrom 400 to more than 1000 m in height.
The Gran Sabana is part of the craton called the Guyana Shield.The igneous and ultra-metamorphic rocks in the northern side ofthe shield have an age reaching 3.5 Ga (Imataca-Bolivar Province,
after Gonzáles de Juana et al., 1980; Gibbs and Barron, 1993). Theoverlying siliciclastic rocks (Roraima Group) belong to the continen-tal to pericontinental environment of the Roraima-Canaima Prov-ince (Reid, 1974). The age of this arenaceous group was inferredthanks to the absolute dating of the granitic basement (2.3–1.8 Ga)and of the intrusions of basaltic dikes and the sills that cross theupper part of the Roraima Group (1.4–1.8 Ga) (Santos et al., 2003).
The quartzitic Mataui Formation, a cross bedded massive sand-stone unit of unknown thickness, which encloses all the major cavesystems so far explored, represents the youngest deposit of theRoraima Group, now situated in the highest topographical positionand forming prominent plateaus with vertical cliffs. Quartz nor-mally represents far over 80% of the rock, with well-sorted grains,commonly between 30 and 100 lm in diameter, cemented withmicrocrystalline quartz. Minor phyllosilicates (authigenic kaoliniteand/or pyrophyllite) are included in the rock (Martini, 2000, 2004;Aubrecht et al., 2011). It is assumed that the Mataui arenites werecovered by other sediments and therefore underwent metamorphictransformations (Urbani et al., 1977). Associations of minerals typ-ical of a low grade metamorphic environment were found, includingpyrophyllite and muscovite, which indicate the Mataui sandstonesto have suffered a burial pressure of �50 MPa. Such a pressurewas exerted by 2000–3000 m of bedrock (Briceño et al., 1990).
The slopes underlying the cliffs surrounding the tepuis aremade of proto-quartzites, arkoses and graywackes, with beds ofcherts, lutites and siltites (Uaimapué Formation; Reid, 1974). Inthe lowlands the main outcropping lithology is the Kukenán For-mation, prevalently composed of siltstones and shales.
The entire area was probably raised to its current altitude as earlyas �110 million years ago, at the end of the Aptian Age, as a conse-quence of the opening of the South Atlantic which broke up the Pan-gean supercontinent and separated South America from Africa(Long, 2002). A very low erosion rate, around 1 mm ky�1, was calcu-lated for the present top tepuis surface (Brown et al., 1992).
The regional climate is semi-humid/tropical with a relativelydry season lasting 3–4 months during winter (Awi in Köppen’sclassification system), with the driest months occurring betweenDecember and March, and the rainiest months between May andSeptember (Nimer, 1989). This precipitation regimen is controlledby the seasonal migration from 5� to 15� of latitude North of theInter Tropical Convergence Zone (ITCZ) (Snow, 1975).
There are no continuous rainfall gauges operating on the tepuisummits. However, a pluviometric station has been recording pre-cipitation data on the Auyan Tepui summit between 1980 and1983 (although there are some gaps in the record), showing meanannual rainfalls of about 3000 mm.
In the same span of time, streamflow has been measured inCaroni river at the gauging stations of Urimàn and Aripichi, locatedabout 15 km West and 40 km South of Chimanta massif, about fiftyand one hundred km respectively to the SW of Auyan Tepui (Galán,1992).
Considering the differences of average discharges in the twogauging stations (522 m3 s�1) and of the extensions of the twocatchment areas (6812 km2) (Galán, 1992), the effective rainfall(difference between total rainfall and evapotranspiration) can beestimated in approximately 2400 mm. For the months of Februaryand March, to which all our data are referred to, the average effec-tive monthly rainfall are 62 and 67 mm, respectively. These valuesseem to be in good agreement with rainfalls measured at the Au-yan Tepui temporary pluviometric station, and will later be usedfor a rough calculation of rainwater infiltration in tepui caves.
2.2. Investigated tepuis and cave systems
This study focuses on three of the most extended tepui massifs:Roraima (31 km2), Chimanta (1470 km2) and Auyan (700 km2)

M. Mecchia et al. / Journal of Hydrology 511 (2014) 117–138 119
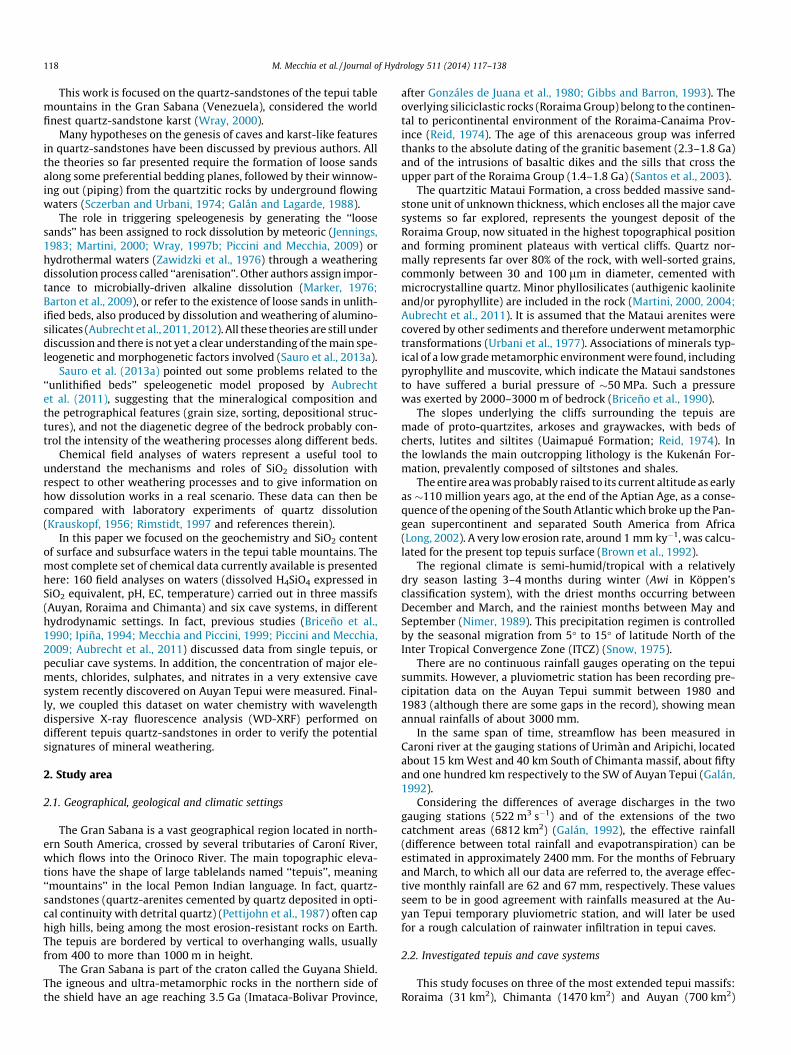
(Fig. 1). Structural and climatic conditions of these sites are verysimilar. The tepui massifs rise from the lowlands of the Gran Saba-na situated at an average altitude of about 1000 m a.s.l. (Wonkenplanation surface) (Briceño and Schubert, 1990). The upper pla-teaus have an average altitude >2000 m a.s.l. (Fig. 2). The principalstructures of the Roraima Group are kilometric-sized radius anti-clines and synclines, giving rise to cuestas and large areas of almosthorizontal strata. Some sets of fractures, mainly vertical, cut theplateaus forming a regular network of quadrangular prisms.
Peculiar landforms due to selective weathering are evident andwidespread on the quartz-sandstone plateau surfaces (Wray,2000). The most impressive morphologic features on the summitplateaus are the big shafts developed along the fractures, called si-mas or grietas in Spanish. Simas are up to 350 m deep (e.g. Aondacave), and formed by the progressive collapse of undergroundvoids that developed at the base of enlarged fractures, often wherea coarse-grained quartz sandstone (arenite to rudite) lays on fineand more erodible sandstones and arkoses (Piccini, 1995).
When these fractures are not enlarged down to the base of thequartz-sandstone formation, they cause the progressive retreat ofscarps on the summit plateau of the tepuis, and the modelling,along preferential nearly horizontal bedding planes, of peripheralsurfaces at altitude lower than the summit plateau (Piccini andMecchia, 2009). Simas and grietas are more abundant on the pla-teau rims, probably because of increasing decompressional open-ing of the joints near the external cliffs. Retreat of peripheralscarps of tepuis seems also to be related to the higher weatheringrate of the underlying more arkosic formations.
Horizontal cave systems are found in correspondence of specificfavourable horizons (beds) within the Mataui Formation. Wherethese horizons are intersected by vertical fractures, a laminar flowdeveloped and a system of interstratal protoconduits formed alongthe low dipping beds. Protoconduit enlargement was generated bypiping of loose sands, derived from arenised rock (Sczerban andUrbani, 1974) or unlithified beds (Aubrecht et al., 2011), creating
Fig. 1. Geographic settings of Gran Sabana and sampling areas (highlighted in yellow)referred to the web version of this article.)
a horizontal drainage network of conduits. Since most of the ex-plored cave systems consist of mainly parallel galleries developedalong the gently dipping strata, a vadose flow fed by meteoricgroundwater is supposed to represent the major pre-conduit flowpattern, as observed in limestone caves (Palmer, 1999).
In some cases, passages developed along these laterallywidened stratigraphic horizons form huge environments (e.g.�270 � 160 � 30 m in Imawarì Yeuta) where the ceiling is sup-ported only by random pillars. When these voids develop at shal-low depth, their collapse can create wide areas of boulders at thesurface and might also be responsible for the formation of the giantcollapse sinkholes clearly recognizable on the tepui’s flat surface.
In this study we investigated six of the most important cavesystems explored in the area: four with predominant stratigraphi-cally controlled horizontal development (Roraima Sur, Akopan-DalCin, Auchimpe, Imawarì Yeuta cave systems), and two of mixedstratigraphically/structurally controlled vertical development(Aonda and Auyan Tepui Noroeste).
Roraima Sur represents the longest cave explored in RoraimaTepui (10.8 km in length) where different draining collectors cre-ated a horizontal maze network of passages (Fig. 3). The cavemostly developed along thin layers of shales and arkoses betweenthe quartz-sandstone beds (Galán et al., 2004b; Aubrecht et al.,2012).
In the Chimanta massif our research focused on the Akopan-DalCin cave system (Akopan Tepui) 2.7 km long (Fig. 4). The highestcave entrance is a big collapse sinkhole very close to the borderingcliff, drained by a horizontal stream that intersects a main collector,stratigraphically controlled by a quartz-sandstone bed (Mecchiaet al., 2009); thin layers of iron-hydroxides were observed alongthe conduits. Some chemical analyses were also performed in theAuchimpe cave (1.7 km), part of the Arañas cave system, in theChurì tepui (the south-eastern part of Chimanta massif hosts�17 km of cave conduits explored by Czech and Slovak caverexpeditions) (Mecchia et al., 2009; Aubrecht et al., 2012).
. (For interpretation of the references to colour in this figure legend, the reader is
Fig. 2. Schematic hydrological sampling profiles of Akopan, Roraima and Auyan tepuis. The numbers in bold refer to silica content, the pH values are indicated in italics, whiledischarge is reported in litres per second. Rainfall values are below cloud symbols.
120 M. Mecchia et al. / Journal of Hydrology 511 (2014) 117–138
In the northwestern sector of Auyan Tepui most of the analyseson waters were performed during two different expeditions in theAonda cave system. This cave is composed of hundred metres deepvertical simas feeding horizontal collectors (Fig. 5). In this area, al-most 5 km of conduits were explored and surveyed providing agood view on the subterranean hydrological network, from thesinkholes to the resurgence (Piccini and Mecchia, 2009). A fewother analyses were also performed on the waters of Auyan TepuiNoroeste cave system, a cave with many entrances reaching 370 mof depth and totalling more than 3 km of conduits. Another set ofanalyses was carried out on the waters of Imawarì Yeuta cave, lo-cated in the NE sector of Auyan Tepui (Fig. 6). This cave probablyrepresents the longest quartz-sandstone cave known in the world,with about 20 km of explored passages (15.5 km already surveyed)(Sauro et al., 2013b). With the exception of three underground col-lectors draining two sinkholes, most of these galleries are no longerhydrologically active, but host wide standing pools fed by drip andseepage waters.
3. Methods
3.1. Sampling and analysis of water
Water sampling and in situ analyses in different hydrodynamicconditions (rain, occasional ponds, peat deposits, surface and sub-terranean streams, and cave drips; Fig. 7) were performed in March1993, February 1996, March 2009, February 2012, and March 2013.The same instrumentation was used over this long period of time.Logistic problems make access to the tepuis during the rainy sea-son extremely challenging if not impossible; therefore all the mea-surements here reported refer to the dry season.
Temperature (T), acidity (pH) and electrical conductivity (EC)were measured by handheld field instruments (Hanna Instru-ments) after calibration on site. Accuracy was 0.1 �C, 0.01, and1 lS cm�1 respectively. Dissolved silica concentration (DSi) wasmeasured by using a field colorimetric test kit (Aquaquant 14410Silicon – Merck), that allows the determination of silica in the con-centration range 0.01–0.25 mg L�1 with an error less than 20%.Samples with concentration higher than 0.25 mg L�1 were dilutedwith distilled water and then analysed. Results were expressed fol-lowing the convention of representing dissolved silica as the oxideSiO2. A number of sampling points were chosen for repeated mea-surements in the period of expedition, obtaining information onthe variability of SiO2 in different flow rate conditions.
In order to determine dissolved elements through ICP-MS anal-yses in the laboratory, double water samples were collected in 10sampling points at Imawarì Yeuta in March 2013: a 250 mL bottleof untreated and unfiltered water, and a 100 mL bottle of 0.45 mi-cron-filtered and 1 mL 65% HNO3 acid-preserved water.
Inductively coupled plasma-mass spectrometry (ICP-MS) (meth-od EPA 6020A) was applied for determination of multi-elementalsub lg L�1 concentrations (Al, Sb, As, Ba, Cd, Ca, Fe, Mg, Pb, K, Na,Zn) where the recovery of the Laboratory Control Sample (LCS) re-sulted between 85% and 115%, as expected by the method lines. An-ion Chromatography (method EPA 9056A) was used to determinechloride, fluoride, nitrate, and sulphate in the solution. NH4 concen-tration was measured on the untreated sample with the methodAPAT CNR IRSA 4030 A2 MAN 29 2003 (IRSA-CNR, 2003).
3.2. Discharge measurements in subterranean streams
Stream discharges in caves were estimated close to each sam-pling point by measuring repetitively the flow speed of floating ob-

Fig. 3. Plan view of the Roraima Sur cave system (Ojo de Cristal Cave section only) with sampling points and analytic results. The numbers in bold refer to silica content inmg L�1 of SiO2, while dissolved load is expressed in mg s�1; the pH values are indicated in italics; discharge is reported in litres per second (survey from Brewer-Carías andAudy, 2011).
M. Mecchia et al. / Journal of Hydrology 511 (2014) 117–138 121
jects and estimating the cross section of the stream. Cross sectionscharacterised by a regular shape and a sufficiently slow and not tooturbulent flow of water were preferably chosen. Since the objectswere floating in the centre of the channels, the mean velocitywas estimated as 80% of the measured surface velocity. For thesereasons, discharges are considered affected by an uncertainty ofat least 30% and therefore can only be considered as indicative.Dripping rates from cave walls were measured as number of dropsfalling in the unit time.
3.3. Chemical analysis of rock samples
Ten quartz-sandstone samples were ground to ultrafine pow-ders and kept 24 h at 110 �C for wavelength dispersive X-ray fluo-rescence (WD-XRF) chemical analysis. Ten grams of sample were
mixed with 2.5–5 mL of Elvacite polymer resin, dissolved in ace-tone. The mixture was stirred to allow acetone evaporation andElvacite distribution. The resultant powder was placed in a pen-ny-shaped mold and compressed with a vertical pressure of40 MPa for 1 min.
A WD-XRF spectrometer Axios – Panalytical (Institute for Min-eralogy and Petrology – IMP of ETH – Zurich) equipped with fivediffraction crystals was used. The SuperQ software package pro-vided by Panalytical was employed for calibration and data reduc-tion. Calibration is based on 30 certified international standards.The precision of analysed elemental abundances is better than±0.2% for SiO2, and ±0.1% for the other major elements with theexception of MnO2 and P2O5 that have concentration errors ofapproximately ±0.02%. For trace elements, relative errors are betterthan 10% for concentrations of 10–100 ppm, better than 5% for

Fig. 4. Plan view of the Akopan-Dal Cin cave system with sampling points and analytic results. The numbers in bold refer to silica content in mg L�1 of SiO2, while dissolvedload is expressed in mg s�1; the pH values are indicated in italics; discharge is reported in litres per second (survey from La Venta Geographic Exploration).
122 M. Mecchia et al. / Journal of Hydrology 511 (2014) 117–138
higher concentrations and can reach as much as 50% at levels be-low 10 ppm. Therefore, the detection limit is considered to beapproximately 5–10 ppm.
4. Results
Samples, collecting sites and analytical results are reported inTable A1. The relationship among physical parameters (pH andEC) and dissolved silica (SiO2) are reported in Figs. 8–10. The chem-ical results generally agree with previous literature (Briceño et al.,1990; Briceño and Paolini, 1992; Ipiña, 1994; Edmond et al., 1995;Aubrecht et al., 2011, 2012).
The mean values of physico-chemical parameters and ion con-centrations from different tepui tablelands are similar. On theother hand, each hydrodynamic condition (rivers, streams, ponds,drippings, etc.) have common characteristics with similar SiO2 con-centrations, EC and pH from all the tepuis and both in structurally(vertical) and stratigraphically (horizontal) controlled cave sys-tems (Fig. 8).
Ion concentrations of Imawarì Yeuta waters (Table A2) are verylow as suggested by the low conductivity. Fe and Al have meanconcentrations around 50 lg L�1, K is present only in few sampleswith an average of 0.53 mg L�1, while Ba is present in the streamand dripping waters with an average of 3.2 lg L�1. In some casesalso Cl, SO4 and NH4 occur with average concentrations respec-tively of 0.8, 0.6, and 0.4 mg L�1. Other elements such as Sb, As,Ca, Mg, Pb, Na, Zn, if present, were below the instrument/methoddetection limits (i.e. <1 lg L�1).
4.1. Rainwaters
Eleven rainwater samples were collected on Roraima, Akopanand Auyan tepuis. The pH ranged from 3.8 to 7.0, with an averagevalue of 5.4: the EC was always low (1–24 lS cm�1), and silica wasalways below the detection limit (Fig. 9A). The highest EC values(15–23 lS cm�1) were measured after a long period without pre-cipitation, whereas the lowest EC value (under the accuracy rangeof the instrument – 1 lS cm�1 – i.e. almost pure water) was de-tected in rainwater sampled during a heavy storm.
4.2. Stagnant surface water in peat, ponds and swamps
Twenty-seven samples were collected in ponds, swamps andpeat deposits that cover wide areas on the summit tepuis pla-teaus (Fig. 7A). The pH ranged from 3.6 to 5.9 (average 4.7)(Fig. 9B), the EC between 10 and 29 lS cm�1 (average 19 lS cm�1)(Fig. 9C). All samples were collected in daytime and water tem-perature was between 15 and 26 �C, depending on the altitudeof the sample point, but also on the time of sunlight exposurein stagnant ponds. The dissolved silica concentration ranged from<0.01 to 0.43 mg L�1 (average 0.12 mg L�1). A chemical analysis ofwater in a peat bog showed the presence of aluminium(68 lg L�1), iron (34 lg L�1), and also NH4 (0.24 mg L�1) probablyrelated to decomposition of organic matter. In fact, all the sam-ples collected on the tepui plateaus present a characteristic am-ber colour, because of decomposing vegetation substance (Ertelet al., 1986).

Fig. 5. Plan view and hydrological scheme of the Aonda cave system showing the main rivers, sinkholes and resurgences. Sampling points and analytic results at differentconditions of discharge are reported. The numbers in bold refer to silica content in mg L�1 of SiO2, while dissolved load is expressed in mg s�1; the pH values are indicated initalics; discharge is reported in litres per second (survey from La Venta Geographic Exploration).
M. Mecchia et al. / Journal of Hydrology 511 (2014) 117–138 123
4.3. Surface stream and river waters
4.3.1. Surface creeks and streams on the tepui plateausThirty-one water samples were collected in creeks and streams
flowing on the summit plateaus, where the outcropping lithologiesare mostly quartz-sandstone and sometimes alkaline sills of dia-base, and most of the area is covered by vegetation. All the flowingwaters presented the typical amber colour (Fig. 7B). Creeks andstreams with a variety of discharges (between 0.1 L s�1 and3 m3 s�1) were sampled. Water temperature varied between 14and 21 �C during sampling, corresponding mainly to an elevationgradient. Samples had pH ranging from 3.1 to 5.5 (average 4.2),EC from 10 to 27 lS cm�1 (average 19 lS cm�1), and dissolved sil-ica concentration comprised between 0.01 and 0.40 mg L�1 (aver-age 0.20 mg L�1) (Fig. 9F–H). The chemical analysis of one sampleshowed it to contain low aluminium and iron concentrations,around 34 and 68 lg L�1, respectively.
4.3.2. Surface streams and rivers in the lowlands on the pedimentssurrounding the tepuis
Fourteen water samples were collected in streams and rivers inthe lowlands, on the pediments surrounding the tepuis (Fig. 7F). Allthe flowing waters presented the typical amber colour and thewater temperatures were similar to those measured in the streamson the tepui tablelands.
Seven streams with discharges ranging between 1 and approx-imately 8000 L s�1 were sampled in the Kukenán drainage basinbelow the southern wall of the Roraima Tepui (Figs. 1 and 7F).The highest pH, from 5.8 to 7.1 (average 6.4), as well as the highestdissolved SiO2 concentrations were measured in these streams(from 5 to 21 mg L�1, above the saturation for quartz and progres-sively increasing as the distance from the tepui increased, Fig. 2).
All these values were higher than those obtained from all streamsflowing on tepui summit plateaus. Unfortunately we did not havethe possibility to measure the EC of these high silica samples be-cause of failure of the EC instrument, but the higher (neutral) pHof these waters suggests that an alkalisation effect is active. Con-versely, a sample collected in a creek on the slope near the so-called ‘‘Base Camp’’ along the normal ascending trail for Roraimashowed the typical signature of tepui waters: low pH (4.7) andlow dissolved silica concentration (0.7 mg L�1).
Three measurements were performed in the Yunek river at theYunek village, below the Eastern wall of Akopan Tepui. In low dis-charge conditions (approximately 6000–9000 L s�1) pH values of5.7 and 5.8 were measured, together with high levels of dissolvedsilica (4.1–4.3 mg L�1). After a storm event, in a higher dischargecondition (approximately 12,500 L s�1), the pH dropped to 5.2and the dissolved silica concentration to 1.1 mg L�1, while the ECmaintained a very low value (8–10 lS cm�1 in all threemeasurements).
A set of three measurements was also taken in the large Carraoriver, from Orquidea Island to Canaima waterfall, in the Gran Saba-na to the north of the Auyan Tepui. The discharge reported in Fig. 2,approximately 140,000 L s�1, represents the mean discharge atCanaima measured in February between 1980 and 1983 (Galán,1992). The pH increased along the course downstream from 5.0to 5.1, while the dissolved silica concentration slightly decreasedfrom 3.4 to 2.1 mg L�1 (Figs. 2 and 9E) perhaps because of dilutioneffects or biological intermediation along the river course. A sam-ple collected in the Aonda valley river, tributary of Carrao river,provided a pH value of 4.7 and dissolved silica concentration of0.76 mg L�1, thus showing a trend similar to the one observed inthe Kukenán catchment area. The EC (9–17 lS cm�1) did not showa clear correlation with pH and SiO2 concentration.

Fig. 6. Plan view of Imawarì Yeuta cave system with sampling points and analytic results. The numbers in bold refer to silica content in mg L�1 of SiO2, while dissolved load isexpressed in mg s�1; the pH values are indicated in italics; discharge is reported in litres per second (survey from La Venta Geographic Exploration).
124 M. Mecchia et al. / Journal of Hydrology 511 (2014) 117–138
4.4. Underground waters
4.4.1. Cave streams and resurgencesForty samples were collected in 6 cave streams and resur-
gences. All these waters present the typical amber colour(Fig. 7C). Water temperature measurements gave average valuescorrelated with altitude: 13.8 �C in the upper part of Roraima Surcave (2700 m a.s.l.), 14.6 �C in Imawarì Yeuta cave (1960 m a.s.l.),and 15.6 �C in Akopan-Dal Cin cave (1500 m a.s.l.). Very variablestream discharges characterise the different branches surveyed inthis study, and also the same main stream in a cave in short periodsof time. In the ‘‘Ali Primera’’ resurgence (inside Sima Aonda) sev-eral measurements were taken and discharge varied from 150 to800 L s�1. However, downstream the resurgence of the whole Aon-da cave system, a discharge of 3000 L s�1 was measured. In the 3measurements performed at the Akopan-Dal Cin resurgence thedischarges were estimated between 70 and 100 L s�1. The resur-gences of the Roraima cave system (two outlets at the base ofthe Southern Wall) showed a total discharge of approximately500 L s�1. In Imawarì Yeuta cave most of the conduits are no longer
hydrologically active; a discharge of 30 L s�1 was measured in themain river of the cave during a dry period.
In all the cave streams the EC was quite similar, ranging be-tween 8 and 34 lS cm�1 (average 16 lS cm�1) (Fig. 10B and C).An average pH of 4.6 resulted from measurements (Fig. 10A–C),with both the extreme values encountered in the same cave (Ima-warì Yeuta): 3.0 in the ‘‘Collector de Noroeste’’ and 6.0 at thebeginning of the ‘‘Rio de Los Italianos’’.
Stream waters from Imawarì Yeuta cave were shown to containonly small amounts of aluminium and iron (averages of 53 and56 lg L�1 respectively). Potassium was also present in some sam-ples with values between 0.41 and 0.56 mg L�1, together withsmall amounts of barium around 1.5 lg L�1. The presence of NH4
up to 0.7 mg L�1 confirmed that these waters take their origin fromsuperficial sinking streams enriched in organic matter derivedfrom decomposing vegetation in peat bogs.
The cave streams always show a relatively low concentrationof dissolved SiO2, from 0.17 up to 1.20 mg L�1 in the mainstreams. Dissolved silica content increases along their coursedownstream:

Fig. 7. Different hydrodynamic conditions characterising the set of samples: (A) Peat bogs and ponds on the tepui surface (photo La Venta). (B) Stream on the tepui plateaussurface (Akopan Tepui) (photo Corrado Conca). (C) The characteristic amber colour of cave streams in Imawarì Yeuta cave system (photo Vittorio Crobu). (D) Crystal-clearwater in standing pools feed by drippings in the fossil branches of Imawarì Yeuta (photo Vittorio Crobu). (E) Waterfalls falling from the external cliffs of Chimanta Tepui(photo Vittorio Crobu). (F) The Kukenán river at the base of Roraima Tepui (photo Vittorio Crobu). (For interpretation of the references to colour in this figure legend, thereader is referred to the web version of this article.)
M. Mecchia et al. / Journal of Hydrology 511 (2014) 117–138 125
� from 0.19 on the summit plateau to 0.27 mg L�1 at the base ofAuyan Tepui, passing through the Aonda cave system, less than2 km long, in the same day of measurement (Fig. 2);� from 0.32 to 0.65 mg L�1 in Imawarì Yeuta cave in only 1 km of
stream course (samples 3y and 9y in Fig. 6);� from 0.02 at the stream inflow to 0.20 mg L�1 at the resurgence
in Roraima Sur System in around 1.5 km of supposed subterra-nean stream course (Galán et al., 2004a) (Fig. 2);� from 0.20 mg L�1 measured in a surface creek before sinking
underground to 0.80–1.20 mg L�1 at the resurgence in Ako-pan-Dal Cin cave system (around 2 km) (Fig. 2).
A relatively constant dissolved SiO2 along the main subterra-nean stream of Akopan-Dal Cin cave system, less than 1 km long(Fig. 4), with concentration around 1.0 mg L�1, was measured ina dry period with very low discharge coming from cave drippingsand rivulets.
SiO2 concentration in cave stream water varies also with dis-charge. The stream flowing through the Aonda cave was repeat-edly measured at the Ali Primera resurgence under differentdischarge conditions (point 9, Fig. 5). The regular decrease ofSiO2 concentration was observed with the increase of dischargeduring storm events, nonetheless the dissolved silica load trans-ported by the stream rose with the increase of the discharge(Fig. 11).
4.4.2. Cave drips and stagnant pondsThirty-eight samples were collected from drips and standing
ponds. The analyses (Fig. 10D–F) showed that cave drips can be di-vided in two groups based on dissolved silica concentrations, be-low or above 4 mg L�1. The chemical characteristics of high silicadrippings have the following features: (a) transparency, (b) verylow EC, ranging from 4 to 13 lS cm�1, (c) relatively high pH, rang-ing from 5.0 to 6.5, and (d) high dissolved SiO2 concentration, rang-ing from 5.6 to 8.6 mg L�1 (water almost saturated with respect toquartz, sometimes dripping from opal speleothems). This last char-acteristic is unique, since no other type of water found in tepuispresents such a high dissolved silica content.
Low silica drippings are characterised by: (a) transparency (withfew exceptions), (b) higher EC, ranging from 10 to 33 lS cm�1, (c)lower pH, ranging from 3.7 to 5.5, and (d) relatively low dissolvedSiO2 concentrations, ranging from 0.15 to 3.40 mg L�1 (undersatu-rated with respect to quartz).
Drip rates are generally not correlated with silica concentration,although faster drips are often believed to contain lower silicacontents.
The chemical analysis of a high silica drip in the Imawarì Yeutacave forming a black-reddish flowstone revealed the presence ofrelatively high iron concentration (114 lg L�1), low aluminium(34 lg L�1), potassium (0.47 mg L�1) and the highest content ofbarium documented among all the samples (7.7 lg L�1). Standing

SiO
2 mg
L
0
2
4
6
8
10
pH2.5 3.0 3.5 4.0 4.5 5.0 5.5 6.0 6.5 7.0 7.5
0
2
4
6
8
10
EC µS cm-1 0 5 10 15 20 25 30 35
RainwaterStream on tepuisPonds, peat bogs, solution pansCave streamsDrippingsRivers and streams below tepui
EC µ
S cm
-1
0
5
10
15
20
25
30
35
pH2.5 3.0 3.5 4.0 4.5 5.0 5.5 6.0 6.5 7.0 7.5
-1Si
O2 m
g L-1
A
B
C
Fig. 8. Results for the whole set of samples analyses reported as correlationsbetween SiO2 concentration (mg L�1), pH and EC (lS cm�1). The different hydro-logical settings for each sample are reported in the legend. In A and B the extremevalues of SiO2 concentration up to 20 mg L�1 for the river below tepuis are notreported in order to have a better visualization of the dataset.
126 M. Mecchia et al. / Journal of Hydrology 511 (2014) 117–138
pools that are fed by drippings in inactive branches of the ImawarìYeuta cave system and Auchimpe have the highest content of SiO2
documented in the cave water samples (8.6 and 8.1 mg L�1), lowEC values (11.0 and 4.1 lS cm�1) and pH close to neutrality (6.1and 6.6). The samples from these pools in Imawarì Yeuta caveshowed also relatively high amounts of dissolved barium (2.8and 6.5 lg L�1), chlorides (1.1 mg L�1) and sulphates (0.63 mg L�1),while iron and aluminium were almost below the detection limit.
4.5. Chemical composition of the quartz-sandstones
The 10 samples of quartz-sandstones collected from the MatauiFormation on Roraima, Akopan and Auyan tepuis were observed inthin section under the polarized light microscope in order to iden-tify their mineralogical composition. From a petrographic point of
view these rocks are composed mainly of detrital monocrystallinequartz grains with non-undulatory extinction and often with over-growth, disposed in interlocked structures due to the burial meta-morphism that affected the Roraima Group (Urbani et al., 1977)(Fig. 12A and B). Detrital matrix is absent. In some samples the con-tent of authigenic aluminium phyllosilicates (mostly pyrophyllitewith minor kaolinite) is relevant. Kaolinite frequently grows onthe expense of feldspars and white mica, during the early diagene-sis at relatively low pressures and temperature. Pyrophyllite formsfrom precursor kaolinite and quartz through a dissolution-precipi-tation process (reaction isograd). The coexistence of kaolinite andpyrophyllite in the cement approximately marks the transition dia-genesis-metamorphism (Bucher and Frey, 1994). In some casesthey occur as a thin coating of aluminium phyllosilicates coveringthe interdigitated quartz grain rims (microstylolites), typical tex-ture of pressure solution during burial metamorphism (Fig. 12C).Thin veins of iron hydroxides cross the quartz-sandstone parallelto the stratification showing them to have migrated during thelow grade burial metamorphism following fluid pressure cracksthat cut the quartz grains (Fig. 12D). In this facies, quartz grainsare well rounded probably because of a higher phyllosilicate ce-ment impeding grain contact and consequent pressure solution.Feldspars are very rare and were not found in most samples.
The WD-XRF analyses, performed on the same 10 samples to ob-tain their relative elemental concentration (Tables 1 and 2), con-firmed the petrographic observations. In general, the content ofSiO2 (which is almost totally quartz with only insignificant amountsof amorphous silica) is between 70% and 90% while the other majorcomponent is aluminium, with concentrations between 3% and 22%depending on the relative content of phyllosilicates such as pyro-phyllite, muscovite, and kaolinite. These phyllosilicates were al-ready reported as common components of these rocks also byprevious authors (Urbani, 1976; Aubrecht et al., 2011; Sauro et al.,2013a). Analyses performed also in the more arkosic beds, showlow concentrations in K and Na, and almost no Ca and Mg, suggest-ing that the content of feldspar in these lithotypes is below 1–4%.Iron is present in the form of iron hydroxides such as goethite andlimonite (determined by raman analyses, see Sauro et al., 2013c).
As regards the trace elements, barium reaches concentrationsaround 300–400 ppm and is normally present in sandstone asinterstitial brines in form of soluble BaCl2 salts (Pettijohn et al.,1987). Titanium, fluorine, tungsten, and zirconium are componentsof highly insoluble minerals such as detrital titanite, apatite, wol-framite, and zircons (Pettijohn et al., 1987).
A sample (KC-1) collected from the Kukenán Formation at thefoot of the Auyan Tepui showed a more ferric composition withonly 53% of quartz, 10% of aluminium and 22% of iron oxides.
5. Discussion
5.1. The silica-water system
In the waters of the tepui environment, at low temperature(16–20 �C) and acidic pH (4–5), the content of dissolved silicadepends on the very low kinetics of dissolution and precipitationof quartz, and the time of water–rock interaction plays a funda-mental role. In these conditions, silica is present in solution mostlyas orthosilicic acid, H4SiO4, or as colloidal polycyclic acids(Krauskopf, 1956). The reaction with water is the following:
SiO2ðsÞ þ 2H2OðlÞ ! H4SiO4ðaqÞ
In these waters the orthosilicic acid is almost undissociated andthe effects of complexion, hydrolysis and polymerisation should benegligible.
Rimstidt (1997) calculated the saturation at nearly neutral pHto be 8.7 mg L�1 for quartz in pure water at 17 �C (the average

A
B
C
D H
G
F
E
Fig. 9. Correlation of the main physical parameters for the surface water samples. (A) Rainwaters reported as pH–EC relation graph (no graph is required for the SiO2
concentration because always below the detection limit). (B–D) Relationships between SiO2 concentration, pH and EC in ponds, peat bogs and solution pans samples. (E)Dissolved silica versus pH in samples from rivers and stream below tepuis. Unfortunately the dataset of EC for these samples is incomplete and therefore is not reported as agraph. (F–H) Relationships between SiO2 concentration, pH and EC in streams on the tepui plateaus.
M. Mecchia et al. / Journal of Hydrology 511 (2014) 117–138 127
temperature of water in tepui caves), and around 100 mg L�1 foramorphous silica. The rate of quartz dissolution (k+) depends ontemperature and pH of the solution (Fig. 13, for T = 25 �C). Thek + values for quartz were determined measuring dissolution farfrom equilibrium in laboratory, obtaining values ranging between1 � 10�12 and 1 � 10�13 mol m�2 s�1 at 25 �C in the pH range of
interest for tepui waters (Bandstra et al., 2008). Amorphous silicadissolves at a rate approximately ten times faster than quartz un-der comparable conditions (Brantley, 2008). However, the dissolu-tion rate constant and the solubility of quartz at low temperatureare quite difficult to measure by experimental testing in labora-tory, because of the long time needed to reach equilibrium. As a

A
B
C
D
E
F
Fig. 10. Correlation of the main physical parameters for the cave waters samples. DSi (SiO2 mg L�1) versus pH and EC (lS cm�1) in cave streams (A–C) and in cave drips andstanding pools (D–F). The dashed line highlights the high silica drippings and standing pools.
Load
of S
iO2
(mg
s-1)
0
50
100
150
200
Concentration m
g L -1
0
0.2
0.4
Discharge (Ls-1)0 100 200 300 400 500 600 700 800 900
Fig. 11. Dissolved concentration (dashed line) and load (solid line) of SiO2 versusdischarge during two different flood events at Ali Primera resurgences in the AondaSystem. While during growing discharge the dissolved silica concentration slightlydecreases, its dissolved load follows an opposite path, considerably increasing.Arrows indicate time evolution.
128 M. Mecchia et al. / Journal of Hydrology 511 (2014) 117–138
consequence, the uncertainty associated with the measured valuesfor the parameters of the rate equation is quite large. A challenging
factor, when experimental results are used for comparison with anatural environment, is the calculation of the reactive surface areaof the dissolving mineral.
The ionisation of the orthosilicic acid only starts at neutral tobasic pH (Harman, 1927; Govett, 1960), and at increasing alkalineconditions, with pH > 8–9, it undergoes up to four consecutive dis-sociations, significantly increasing the amount of quartz which canbe dissolved (Ford and Williams, 2007), releasing H+ ions accordingto reactions:
H4SiO4ðaqÞ ! H3SiO�4 þHþ
H3SiO�4ðaqÞ ! H2SiO2�4 þHþ
H2SiO2�4ðaqÞ ! HSiO3�
4 þHþ
HSiO3�4ðaqÞ ! SiO4�
4 þHþ
Another important dissolution process, which releases silicicacid in a natural water system, is the hydrolysis of silicate mineralssuch as feldspars:

Fig. 12. Petrographic features observable in thin sections of the Mataui Formation samples: (A) Typical quartz-sandstone composed almost totally by quartz monocrystallinegrains with interlocked structure (X Nicols). (B) Quartz-sandstone richer in pyrophyllite (X Nicols). (C) A thin coating of phyllosilicates covers the interdigitated quartz grains(microstylolites) typical of pressure solution during burial metamorphism (X Nicols). (D) Injected iron hydroxide provoking quartz grains cracking due to vertical fluidpressure (|| Nicols).
Table 1Bulk-rock composition of different quartz-sandstones (%). The symbol ‘‘/’’ means below the detection limit.
Sample ID Description SiO2 TiO2 Al2O3 Fe2O3 MnO MgO CaO Na2O K2O P2O5
AKT Unweathered quartzite 96.03 0.05 3.28 0.10 0.001 0.005 0.017 0.419 0.059 0.015ROR17 Unweathered quartzite 96.39 0.07 2.27 0.43 0.001 0.003 0.016 0.575 0.201 0.016AK3B Weathered quartzite 82.95 0.13 11.14 0.35 0.004 0.003 0.006 0.315 0.046 0.024AK4 Weathered quartzite with dark bands 85.71 0.09 3.00 0.50 0.002 0.003 0.011 0.319 0.035 0.031AK5A Weathered quartzite with dark bands 73.85 0.51 22.59 2.01 0.021 0.012 1.011 0.428 0.460 0.105AK5B Weathered quartzite with dark bands 71.71 0.65 22.60 3.70 0.035 0.070 1.010 0.505 0.629 0.079AK5C Unweathered quartzite 85.00 0.07 14.21 0.17 0.004 1.085 1.085 0.297 0.158 0.072AK3A Weathered quartzite with dark bands 81.03 0.48 16.38 1.75 0.014 1.024 1.024 0.253 0.047 0.039ROR16 Weathered quartzite 78.41 0.11 7.08 0.13 0.001 / 0.008 0.285 0.096 0.069KC1 Arkose from Kukenan F.m. 52.99 0.17 9.86 21.93 0.027 0.352 / 0.169 0.888 0.247
Table 2Trace element composition of different quartz-sandstones (ppm). The symbol ‘‘/’’ means below the detection limit.
Sample ID Ba Ce Cl Cu F S Sr Th U V W Y Zn Zr
AKT 343.6 / 6.0 34.7 102.9 / 25.4 5.9 1.0 3.3 687.2 8.1 / 60.9ROR17 359.8 / 6.7 29.3 137.9 / 38.0 6.2 2.3 5.7 722.3 6.1 / 194.3AK3B 285.3 0.6 7.1 30.8 152.0 / 27.5 7.6 2.7 3.4 267.5 10.9 1.0 231.0AK4 307.7 / 4.8 31.6 139.5 / 13.7 3.9 1.8 5.4 315.1 3.8 2.8 111.6AK5A 376.7 117.0 113.0 34.2 249.5 / 81.6 20.5 7.2 14.2 95.8 28.6 15.0 816.4AK5B 382.2 120.1 227.5 31.8 298.4 / 92.5 21.8 8.0 21.7 248.9 27.7 19.4 856.4AK5C 487.9 / 34.7 29.9 174.8 / 26.8 5.5 1.2 2.7 167.8 7.9 0.5 104.4AK3A 108.2 70.0 / 30.2 199.9 / 49.0 15.5 5.3 9.4 495.1 23.1 30.7 825.8ROR16 395.9 23.9 21.5 28.9 134.5 / 33.7 8.0 2.4 3.5 319.3 8.4 1.4 139.1KC1 161.5 50.5 56.9 38.1 946.1 232.5 31.2 19.7 10.5 107.2 117.9 11.4 70.6 125.7
M. Mecchia et al. / Journal of Hydrology 511 (2014) 117–138 129
2KAlSi3O8ðsÞ þ 2H2CO3ðaqÞ þ 9H2OðlÞ
! Al2Si2O5ðOHÞ4ðsÞ þ 4H4SiO4ðaqÞ þ 2Kþ þ 2HCO�3
2NaCaAl3Si5O16ðsÞ þ 8H2CO3ðaqÞ þ 11H2OðlÞ
! 3Al2Si2O5ðOHÞ4ðsÞ þ 4H4SiO4ðaqÞ þ 2Ca2þ þ 2Naþ þ 8HCO�3
These reactions require dissolved CO2 in the water system, re-lease K and/or Na and/or Ca and form secondary minerals suchas kaolinite, illite, and montmorillonite. Feldspars have dissolution
rates increasing with rising H+ activity at pH < 6, and rising OH-
activity above pH = 8.5 (Blum, 1994).Moreover, silicic acid is released by the dehydroxylation–desili-
cation dissolution–recrystallization reaction forming kaolinitefrom the metastable pyrophyllite in presence of water (Hurst andKönkle, 1985):
Al2Si4O10ðOHÞ2ðsÞ þ 10H2O! 2Al3þ þ 4H4SiO4ðaqÞ þ 6OH�
2Al3þ þ 2H4SiO4 þ 6OH� ! Al2Si2O5ðOHÞ4ðsÞ þ 5H2O

Fig. 13. Surface area-normalized quartz predicted dissolution rates at 25 �C as afunction of pH, derived from the fitting of experimental data (symbols representsdifferent experiments after Bandstra et al., 2008). Solid and dashed lines representtwo non-linear fits of data.
130 M. Mecchia et al. / Journal of Hydrology 511 (2014) 117–138
or the direct dissolution of kaolinite in case of acid pH, releasingalso aluminium into the solution:
Al2Si2O5ðOHÞ4ðsÞ þ 6Hþ ! 2Al3þ þH2Oþ 2H4SiO4
All these reactions can contribute to the total amount of silicicacid in the water system and the signature of each process canbe determined by the presence or absence of ions such as Al, K,Na, and Ca (Clayton, 1988).
5.2. Surface silica contribution
Unlike other measurements performed in other parts of theworld (Hem, 1985; Rutherford, 1967), no dissolved silica was mea-sured in rainwaters on tepuis. The average pH measured on tepuiswas 5.4 (Fig. 9A), well comparable with the theoretical average va-lue for rainwater, because of atmospheric dissolved carbon dioxide.Actually, the measured pH ranged from 3.8 to 7.0. That also is usual,since a very large volume of air passes through a storm system,rainfall characteristics are highly variable, not only from place toplace but also from storm to storm in a single area (Hem, 1985).Rainwaters over the Gran Sabana region are not affected by anthro-pogenic sources of pollution neither by marine salt spray, showingtherefore very low values of EC (1.3–23.5 lS cm�1, Fig. 9A). Thus,rainwater is almost distilled water with minor dissolved elementsrelated to atmospheric contributions (Sauro et al., 2013d).
When rainfall reaches the tepui surface, rainwater is in partdrained by streams or retained over variable times in bushes, grasscarpets and peat deposits. Because of decomposing vegetation, thewater gets enriched in organic matter, giving its characteristic am-ber colour (Ertel et al., 1986). Probably because of this enrichmentin organic acids and dissolved organic CO2, the pH decreasesbecoming more acid than that of rainwater (average pH 4.7). Smallamounts of SiO2 are dissolved from the quartz-sandstone substrate,producing an average concentration of 0.12 mg L�1. The actual con-centration of dissolved silica in the peat bogs and solution pondsvaries depending on the time elapsed from the last rain event (timeof water recharge in the ponds and swamps) and the local evapora-tion rate. A slight negative correlation between dissolved SiO2 andpH was found (R2 = �0.35, Fig. 9B), suggesting a correlation be-tween the organic acids and the amount of silica in solution, asfound in experimental studies (Bennett et al., 1988; Bennett, 1991).
Streams flowing on the tepui surfaces collect the waters seepingfrom the surrounding swamps and peat bogs, slightly enriched in
dissolved silica, and also interact directly with the quartz-sand-stone bedrock. The concentrations of dissolved SiO2 measured inthese streams are still very low, 0.2 mg L�1 in average. This couldbe due to the short time of water–rock interaction or locally tothe formation of silica and iron hydroxide crusts on the rock sur-face because of evaporation processes. This case hardening shieldsthe quartz rocks from subcutaneous dissolution and impedes thesubcutaneous flow of seepage waters toward the external surfaces.For this reason, the mean denudation at the top of the tepuis calcu-lated with 10Be and 26Al cosmogenic nuclides by Brown et al.(1992) is only of 1 mm ka�1 over the last several hundred thousandyears, an order of magnitude lower compared to the 12 mm ka�1
measured on the surrounding lowlands in the Gran Sabana region(Yanes and Briceño, 1993).
5.3. Subsurface silica dissolution
In Roraima, Aonda and Imawarì Yeuta cave systems, the under-ground streams show a significant increase of silica concentrationalong their course. However, as observed for surface streams, thesilica enrichment by direct dissolution along the wet streambedsis predictably almost insignificant. This is due to the very shorttime and little surficial area available for water–rock interaction.A calculation using the highest possible dissolution rate constantfor quartz, outlined before, shows that environmental and physicalconditions are insufficient even to produce a measurable increasein silica concentration in streams. The almost constant dissolvedSiO2 along less than 1 km in the main subterranean stream of Ako-pan-Dal Cin cave system (Fig. 4), with concentration around1 mg L�1 measured in a dry period with very low discharge comingfrom cave drips, appears to confirm this hypothesis.
Consequently, the increase in silica concentration measuredalong most of the cave streams depends on contributions of dis-solved silica from fractures, seepage waters, and condensationfilms on vadose conduit walls. For this reason the decrease inconcentration during flood events (Fig. 11) is related to an almostchemostatic behaviour because the dissolved silica derives mainlyfrom seepage waters with slow infiltration rates instead of quickstream floodwaters sinking directly from the surface.
The low K concentration (slightly above the detection limit of0.4 mg L�1 in only four samples out of fifteen) and the absence ofNa and Ca (always lower than the detection limit of 0.4 mg L�1) ob-served in both surface and underground waters of Imawarì Yeutacave, and the extremely low EC, suggest that hydrolysis does notrepresent a relevant process controlling the silica concentrationin the tepui waters. The aluminium solubility is very low at pH va-lue ranging from 4 to 9 and its content doesn’t change down-stream, from peat and superficial streams through the cavesystem (Fig. 14A), keeping concentrations of around 50–60 lg L�1.The presence of high aluminium concentrations (over 100 mg L�1)and higher EC in some drippings reported by Aubrecht et al. (2012),and interpreted as a proof of laterisation, must be reconsidered tomore appropriate values of 100 lg L�1. In fact, considering the col-orimetric kit that these authors used for their analyses, it is evidentthat there was an error in the notation of mg L�1 instead of the cor-rect lg L�1. Applying this correction to their data the aluminiumconcentrations are similar to our findings. In all cases the valuesof aluminium concentration documented by our research suggestthat hydrolysis of feldspars and the dissolution of kaolinite canonly be of local significance, in agreement with the general compo-sition of the quartz-sandstones.
Because hydrolysis is generally negligible, the major contribu-tion of dissolved silica must derive directly from dissolution ofquartz, with probably minor amounts of pyrophyllite-kaolinitereactions affecting the composition of seepage waters in some beds.

M. Mecchia et al. / Journal of Hydrology 511 (2014) 117–138 131
Some insights in the SiO2 dissolution process working in thesubsurface are obtained examining the set of samples from dripsand dripping-fed pools in caves. The two types of chemicallydistinct drip waters can be interpreted as fast seepage water(low silica drips), with probably several hours/days of residencetime, and slow seepage water (high silica drippings), which proba-bly is a mix of recent and old (possibly with even more than severalyears residence time) waters.
Although most of dripping waters probably come from infiltra-tion of organic-rich waters (peat bogs), they are characteristicallytransparent. Virtually all suspended organic material is supposedto be filtered out during the slow descent through very thin micro-fracture systems, explaining their transparency (Fig. 7D).
The long residence time, i.e. of water–rock interaction, can ex-plain the high dissolved silica concentration measured in manydrips and standing pools. Local evaporation in the ventilated cavi-ties might further increase the silica concentration.
The interaction with microbial communities producing ammo-nia on cave walls and rock pores, as suggested by Barton et al.(2009), could represent a mechanism for increasing pH andenhancing dissolution rates locally, but the higher values of pHdocumented in dripping waters are still not reaching the neutralityand their very low EC indicates that the silicic acid is almost undis-sociated. Moreover ammonia and in general nitrates were notfound in detectable concentration in any of the drip samples orstanding pools. Therefore, if this process is really effective it hasprobably only local significance and does not affect the generalcomposition of drip waters.
Condensation on cave walls provides a different source of wateravailable for quartz dissolution. At a low flow rate the condensa-tion water film is divided into thin threads or rivulets, and at evenlower flow rates, the threads and rivulets break up into trains of
A
B
Fig. 14. (A) Relationship between Al and Fe concentration in superficial andunderground waters of the Imawarì Yeuta cave system: most of the samples have Aland Fe content around 40–60 lg L�1, only a sample from a dripping water showedto be relatively enriched in Fe. (B) Positive correlation between barium and SiO2
content of cave waters revealing the seepage water contribution.
sliding drops and blobs (Ghezzehei, 2004). In condensation waterthe pH values should be close to neutrality, being related to equi-librium with the atmospheric CO2. Aubrecht et al. (2013) suggestedthat the group of drips closer to saturation is mainly related tooriginally strongly undersaturated, therefore highly aggressive,condensation water. However, the rate of downward movementof a condensation water film on a cave wall is far too fast, andthe interaction time with the rock surface too short, to be consis-tent with the observed high concentration of silica in drippings.
Tokunaga and Wan (1997) have already demonstrated that filmflow is a very important mechanism of flow in the vadose zone.Thus, the role of condensation water in further enlargement ofpre-existing cave passages could be crucial to attain the impressivesize of many subterranean conduits, given the extensive occur-rence of films of strongly undersaturated water that line entire sur-faces of ceilings and walls, continuously replaced by newcondensation water.
When a film of water wets a cave wall, a process of solute diffu-sion could be active because of the different SiO2 concentrationexisting between water in the wetting film (undersaturated andcontinuously renewed) and the water (supposed to be at the satu-ration point) in the intergranular porosity of the quartz-sandstonebedrock. Some silica molecules might be transported through diffu-sion from the rock pores to the film, causing pore water to becomeundersaturated with respect to quartz, reactivating dissolution onthe surrounding grain surfaces. Once triggered, and given enoughtime (i.e., in geological stable conditions, absence of fast erosionof tepui plateaus and without a faster weathering mechanism ofcave walls), the chemical potential due to solute diffusion could al-low a slow but considerable removal of silica from inside the rock,producing the deeply arenised surfaces in the quartz-sandstonecave walls, as suggested by Piccini and Mecchia (2009).
The concept of arenisation in quartz-sandstones was explainedfirst by Martini (1979) as due to dissolution along quartz grainsboundaries, where the water circulates very slowly (advection).However, given the size of intergranular pores in unaltered rock(less than 1000 nm; Derjaguin and Churaev, 1986; Pettijohn et al.,1987), we do not think advection to be possible. On the other hand,aqueous diffusion is generally the dominant transport mechanismwithin the pores, and diffusion occurs along each mineral grainboundary interconnected with continuous paths (Garrels et al.,1949). Norton and Knapp (1977) experimentally determined thediffusion through some samples of unaltered quartzites, obtainingdiffusion porosities of approximately 0.1%, a value that could be en-ough to start the arenisation process raising the general porosity inaltered walls. The relatively high concentration of barium in thedrips and dripping-fed pools closer to saturation (Fig. 14B) is alsoa clue giving information on the origin of these waters: barium, infact, is typically present in the intergranular pores of the quartz-arenite in form of barium chloride (Pettijohn et al., 1987).
In general the concentrations of silica dissolved in streams andin the drips are in agreement with the few other studies on dis-solved silica in surface and ground waters reported from otherquartz-sandstone terrains like the Sydney Basin (Wray, 1995),Tchad (Mainguet, 1972), and Amem Land (Dames and Moore,1981). Even though their precipitation regimes differ dramaticallyfrom those of the Gran Sabana, these similarities suggest thatquartz dissolution and consequent arenisation is an important geo-morphic process also in many other areas of the World.
5.4. Estimation of the subsurface dissolution
Even if the data are affected by large uncertainties because of theapproximation in the discharge measurements and because thewhole set is related only to the dry season, rough calculations canbe made to estimate the subsurface dissolution contribution in

132 M. Mecchia et al. / Journal of Hydrology 511 (2014) 117–138
the studied cave systems. Based on our data, the measured increaseof dissolved silica concentration between inflow and outflow inAonda, Roraima Sur and Akopan-Dal Cin cave systems were 0.08,0.17 and 0.80 mg L�1, respectively. Rough estimates of average dis-charges in the dry season (February–March) were 400, 500, and90 L s�1, respectively. Therefore, the load of dissolved silica addedto the cave streams (downstream the inflow) and transported outof the system was of 32, 85 and 72 mg s�1, respectively for the threecaves. However, a small part of this load of silica comes from thedissolution on the surface of the tepuis (mainly in peat bogs andswamps). We can estimate this fraction considering our mean infil-tration rate (i.e. effective precipitation) calculated for the months ofFebruary and March (65 mm/month). This infiltration rate can bechanged into infiltration discharge by calculating the approximateareas of direct infiltration into the cave systems (downstream ofthe inflow), by means of the published cave surveys. We calculatedcatchments of about 0.8, 0.9 and 0.8 km2 for Aonda, Roraima Sur,and Akopan-Dal Cin cave systems, respectively, obtaining similarinfiltration discharges for the three systems (20–22 L s�1, referredto the February–March period). Since the concentration of silica dis-solved on the tepui plateaus was approximately 0.2 mg L�1 (surfacestreams), an average contribution of about 4–4.5 mg s�1 of dis-solved silica (dry season) is expected from quartz dissolution onthe tepui surfaces, before infiltration, in all three cave systems.These values can be compared with those estimated for the wholeloads of dissolved silica added to the cave streams downstream ofthe inflow (i.e. 32, 85 and 72 mg s�1, respectively) concluding thatthe dissolution of silica on the top surface of the tepuis contributesfor only 5–13% of the total dissolved silica load. The remaining 87–95%, corresponding to 28, 81 and 68 mg s�1 for Aonda, Roraima Sur,and Akopan-Dal Cin cave systems respectively, would come fromthe underground dissolution of quartz in fractures, cave walls andstreambeds. These values are referred to the dry season, when therainfalls are less than 3 times lower than that of the average month.For correction to annual estimates of average quartz dissolutionrates in these three cave systems, values at least double might bemore realistic. Applying this correction, the quartz masses dis-solved in the three systems would be around 1800, 5100 and4300 kg a�1, corresponding to volumes of 0.7, 1.9 and 1.6 m3 a�1,respectively for Aonda, Roraima Sur, and Akopan-Dal Cin cave sys-tems respectively. Runoff distribution is also invoked in the chem-ical weathering rate values obtained for the Carrao Basin, the UpperCaroni Basin and Gran Sabana region where surface rate values of6200, 6900 and 6600 kg km�2 a�1, respectively have been observed(Yanes and Briceño, 1993).
These calculated amounts of SiO2 removed from the cave sys-tems, even if affected by large uncertainties, are surely relevantfor speleogenesis, further considering that the dissolution of 20%of the rock is enough to cause a complete arenisation (Martini,2000), breaking up the quartz-sandstone framework and conse-quently allowing mechanical erosion by turbulent streams. Thismeans that for each 1000 kg of silica (corresponding to 0.37 m3
of quartz) removed through dissolution, around 1.8 m3 of arenisedquartz-sandstone might easily be removed by mechanical erosionafterward. These simple and rough calculations do not considerthat rock can be eroded before being completely decemented andthat running waters can also carry coarse (polygranular) sandsand pebbles.
Considering the time span of weathering exposure for this areaof South America (many tens of millions of years) (Briceño andSchubert, 1990; Piccini and Mecchia, 2009), even if the detectedconcentrations of SiO2 are low, the effect of silica dissolution mustbe considered important in the geomorphic evolution. Further-more, the variability of the climate during the past could havehad an additional role: the process was surely decelerating duringdrier periods and accelerating during wetter periods.
However, our analyses do not exclude that other mechanisms ofweathering might also be locally active along some beds, such asthe dissolution of iron hydroxides, or the pyrophyllite–kaolinitere-equilibration reaction, with consequences on the rock hardness,further enhancing arenisation and the potential of mechanical ero-sion. These additional processes probably control the developmentof horizontal caves along specific layers.
In the streams flowing on the tepui pediments and the rivers ofthe surrounding lowlands the concentration of silica can reach thehighest values of the entire set of samples. This because of the factthat along the pediments the streams flow on the arkosic sand-stones of the Umaipé and Kukenán Formations where hydrolysiscan give a relevant contribution of SiO2, and also of Na, K, Ca, andMg (see the chemical analysis for the tributaries of Caronì river inEdmond et al., 1995). The higher solubility of feldspars and amor-phous silica with respect to quartz explains the abrupt increase ofsilica concentration (10–20 mg L�1) measured along small streamsflowing on the pediments below the Roraima tepui. Mainly for thisreason the denudation rate calculated by previous studies on dis-solved load mass balances of the Caronì river is around ten timeshigher than that of the tepui summit plateau (between 9 and12 mm ka�1; Yanes and Briceño, 1993; Edmond et al., 1995).
6. Conclusions
Even if the detected concentrations of SiO2 are low, as expectedfrom experimental studies, quartz dissolution appears to play a fun-damental role in the formation of the tepui landscape. The presentedgeochemical data show that the majority of dissolved silica in sur-face and underground waters of tepuis results from the dissolutionof quartz while hydrolysis of other silicates only plays a minor role.
On the top surface of the tepuis the dissolution of silica is veryslow contributing only for 5–13% of the total dissolved silica load.In the subsurface the major contribution of silica to theunderground drainage, about 87–95% of the total dissolved silicaload, is most likely given by slow percolation along vertical fissuresand horizontal interlayers or laminar movements of condensedwater films on cave walls. These waters could be enriched in SiO2
not only from direct dissolution but mainly by chemical potentialdiffusion from the intergranular porosity-saturated waters. Thisprocess does not produce secondary minerals, such as clay miner-als, which might seal the fractures and inhibit the water flow. Thelow content of K, Al, and Fe documented in some samples are prob-ably related to local hydrolysis, dissolution of minor kaolinite andgoethite in certain layers. All these chemical data suggest that aren-isation, sensu Jennings (1983), is an active process.
In conclusion, weathering on the tepui table mountains worksmainly underground causing the opening of deep fractures (simasand grietas) and the formation of extensive horizontal conduit net-works. The tepui top surface is lowering mostly through collapsesrelated to these underground processes, while scarp retreat is con-trolled by the higher weathering rate of the more arkosic forma-tions constituting the base of the massifs.
Acknowledgements
We want to thank all participants of the many expeditionsorganised by La Venta on the tepuis over the last twenty years,and especially our Venezuelan members Raul Arias Betancourtand Freddy Vergara Castro for the logistic support. This researchhas benefited from the permit for speleological exploration andwater analyses from the Instituto National de Parques (INParques)from Venezuela and from the economic support of many sponsors:Geotec S.P.A., Dolomite, Intermatica, Ferrino, Napapijri, andAllemano Metrology. Detailed chemical analyses on the waters

M. Mecchia et al. / Journal of Hydrology 511 (2014) 117–138 133
sampled during the 2013 expedition to Auyan Tepui were spon-sored by the Chelab s.r.l. laboratories, Treviso. WD-XRF analyseson rock samples were carried out by Lydia Zender of ETH-Zurich.We are grateful also to Robert A. L. Wray and one other anonymousreviewer for their useful suggestions. FS, LP and MM wrote themain discussion, MM made the majority of the analyses with thehelp of JL, FV and all the other authors. LS and JDW highly
Table A1The whole set of 160 analyses divided in different groups of hydrodynamic conditions. The dSiO2 (mg L�1), discharge (L s�1, or drops min�1 if underlined), colour. The symbol ‘‘/’’ mea
contributed to the final text, while NT contributed with the petro-graphic and WDS analyses discussion.
Appendix A
See Tables A1 and A2.
ata set specifies collecting sites, date of sampling, temperature (�C), pH, EC (lS cm�1),ns below the detection limit.
(continued on next page)

134 M. Mecchia et al. / Journal of Hydrology 511 (2014) 117–138

(continued on next page)
M. Mecchia et al. / Journal of Hydrology 511 (2014) 117–138 135

136 M. Mecchia et al. / Journal of Hydrology 511 (2014) 117–138

5.0 12.6 7.28 15
5.1 8.9 7.28 133
5.1 10.5 6.85
4.6 24.7 1.97 120
5.5 3.44 76
5.5 5.60 60
13.9 4.9 0.15
Table A2Major and minor element concentrations of the water samples from Imawarì Yeuta cave system (the sign ‘‘/’’ means below the detection limit).
Station ID Fe (lg L�1) Al (lg L�1) K (mg L�1) Ba (lg L�1) Cd (lg L�1) Cl (mg L�1) SO4 (mg L�1) NH4 (mg L�1)
A 11y 46 59 / / / / / /A 12y 33.7 68 / / / / / 0.24A 1y 46 46 / 1.67 / / / 0.20A 2y 53 48 / / / 0.43 0.46 /A 3y 40 48 / / / / / /A 5y 48 51 / 1.17 / / / 0.36A 6y 91 54 / / / / / 0.50A 7y 58 59 0.41 / / / / /A 8y 49 62 0.68 / / / / 0.39A 9y 66 56 0.57 1.14 / / / 0.69A 10k 53 / / / / / /A 4y 10.1 57 / 1.61 / 0.98 0.59 /A 10y / / / 2.82 / 1.15 0.63 /A A14y 19.7 / / 6.50 1.07 0.69 0.66 /A 15y 114 34 0.47 7.70 / / / /
M. Mecchia et al. / Journal of Hydrology 511 (2014) 117–138 137
References
Aubrecht, R., Lánczos, T., Gregor, M., Schlögl, J., Smída, B., Brewer-Carías, Ch., Vlcek,L., 2011. Sandstone caves on Venezuelan tepuis: return to pseudokarst?Geomorphology 132, 351–365.
Aubrecht, R., Barrio-Amorós, C.L., Breure, A.S.H., Brewer-Carías, C., Derka, T.,Fuentes-Ramos, O.A., Gregor, M., Kodada, J., Kovácik, L., Lánczos, T., Lee, N.M.,Lišcák, P., Schlögl, J., Šmída, B., Vlcek, L., 2012. Venezuelan Tepuis: Their Cavesand Biota. Acta Geologica Slovaca Monograph. Comenius University, Bratislava,168 p.
Aubrecht, R., Lánczos, T., Gregor, M., Schlögl, J., Šmída, B., Lišcák, P., Brewer-Carías,Ch., Vlcek, L., 2013. Reply to the comment on ‘‘Sandstone caves on Venezuelantepuis: return to pseudokarst?’’. Geomorphology 197, 197–202.
Bandstra, J.Z., Buss, H.L., Campen, R.K., Liermann, L.J., Moore, J., Hausrath, E.M.,Navarre-Sitchler, A.K., Jang, J.-H., Brantley, S.L., 2008. Compilation of mineraldissolution rates. In: Brantley, S.L., Kubicki, J.D., White, A.F. (Eds.), Kinetics ofWater–Rock Interaction. Springer Science, pp. 737–823.
Barton, H., Suarez, P., Muench, B., Giarrizzo, J., Broering, M., Banks, E.,Venkateswaran, K., 2009. The alkali speleogenesis of Roraima Sur Cave,Venezuela. In: White, W.B. (Ed.), Proceedings of the 15th InternationalCongress of Speleology, Kerrville, Texas, July 19–26, 2009, pp. 802–807.
Bennett, P.C., 1991. Quartz dissolution in organic-rich aqueous systems. Geochim.Cosmochim. Acta 55, 1781–1797.
Bennett, P.C., Melcer, M.E., Siegel, D.I., Hassett, J.P., 1988. The dissolution of quartzin dilute aqueous solutions of organic acids at 25 �C. Geochim. Cosmochim. Acta52, 1521–1530.
Blum, A.E., 1994. Feldspars in weathering. In: Parsons, I. (Ed.), Feldspars and TheirReactions. NATO ASI Series. Springer, Netherlands, pp. 595–630.
Brantley, S.L., 2008. Kinetics of mineral dissolution. In: Brantley, S.L., Kubicki, J.D.,White, A.F. (Eds.), Kinetics of Water–Rock Interaction. Springer Science, pp.151–210.
Brewer-Carías, C., Audy, M., 2011. Entrañas del mundo perdido. Charles Brewer-Carías ediciones, Altolitho, Caracas, 291 p.
Briceño, H.O., Paolini, J., 1992. Aspectos geoquímicos del macizo del Chimantá. In:Huber, O. (Ed.), Chimantá. Escudo de Guayana, Venezuela. Un Ensayo EcológicoTepuyano. Oscar Todtmann Editores, Caracas, pp. 75–88.
Briceño, H.O., Schubert, C., 1990. Geomorphology of the Gran Sabana, GuyanaShield, Southeastern Venezuela. Geomorphology 3, 125–141.
Briceño, H.O., Schubert, C., Paolini, J., 1990. Table-mountain geology and surficialgeochemistry: Chimantà massif, Venezuelan Guayana Shield. J. South AmericaEarth Sci. 3 (4), 179–194.
Brown, E.T., Stallard, R.F., Raisbeck, G.M., Yiou, F., 1992. Determination of thedenudation of Mount Roraima, Venezuela using cosmogenic 13Be and 26Al. EOS73, 170.
Bucher, K., Frey, M., 1994. Petrogenesis of metamorphic rocks. Springer, Berlin, 318p.
Clayton, J.L., 1988. Some observations on the stoichiometry of feldspar hydrolysis ingranitic soil. J. Environ. Qual. 17 (1), 153–157.
Dames and Moore Pty. Ltd., 1981. Statement of Environmental Baseline Conditions:Koongarra Uranium Project Koongarra, NT. Dames and Moore Pty. Ltd.
Derjaguin, B.V., Churaev, N.V., 1986. Properties of water layers adjacent tointerfaces. In: Croxton, C.A. (Ed.), Fluid Interfacial Phenomena. Wiley, NewYork, p. 748.
Doerr, S.H., 1999. Karst-like landforms and hydrology in quartzites of theVenezuelan Guyana shield: Pseudokarst or ‘‘real’’ karst? Z. Geomorphol. 43,1–17.
Edmond, J.M., Palmer, M.R., Grant, B., Stallard, R.F., 1995. The fluvial geochemistryand denudation rate of the Guayana Shield in Venezuela, Colombia, and Brazil.Geochim. Cosmochim. Acta 59 (16), 3301–3325.
Ertel, J.R., Hedges, J.I., Devol, A.H., Richey, J.E., de Nazare Goes Ribeiro, M., Ribeiro, G.,1986. Dissolved humic substances of the Amazon River system. Limnol.Oceanogr. 31 (4), 739–754.
Ford, D.C., Williams, P., 2007. Karst Hydrogeology and Geomorphology. Willey &Sons, Chichester, 562 p.
Galán, C., 1992. El clima del macizo del Chimantá. In: Huber, O. (Ed.), El Macizo delChimantá – Escudo della Guayana, Venezuela – Un ensayo ecologico tepuyano.O. Todtman Editors, Caracas, pp. 37–52.
Galán, C., Lagarde, J., 1988. Morphologie et evolution des cavernes et formessuperficielles dans les quartzites du Roraima. Karstologia 11–12, 49–60.
Galán, C., Herrera, F.F., Astort, J., 2004a. Origin of Roraima Sur system, Venezuela,with notes about karst development in quartzites. Boletin Soc. VenezolanaEspeleol. 38, 17–27.
Galán, C., Herrera, F.F., Carreño, R., 2004b. Geomorfología e hidrología del SistemaRoraima Sur, Venezuela, la mayor cavidad del mundo en cuarcitas: 10,8 km.Boletin Soc. Venezolana Espeleol. 38, 2–16.
Garrels, R.M., Dreyer, R.M., Howland, A.L., 1949. Diffusion of ions throughintergranular spaces in water-saturated rocks. Bull. Geol. Soc. Am. 60, 1809–1828.
Ghezzehei, T.A., 2004. Constraints for flow regimes on smooth fracturesurfaces. Water Resour. Res. 40, W11503. http://dx.doi.org/10.1029/2004WR003164.
Gibbs, A.K., Barron, C.N., 1993. The Geology of the Guyana Shield. Clarendon Press,Oxford, 246 p.
Gonzáles de Juana, C., Picard, X., Iturralde, J.M., 1980. Geologia de Venezuela y desus cuencas petrolifera. Edic. Foninves, Caracas, 1031 p.
Govett, G.J.S., 1960. Critical factors in the colorimetric determination of silica. Anal.Chim. Acta 25, 69–80.
Harman, R.W., 1927. Aqueous solutions of sodium silicates. J. Phys. Chem. 31, 616.Hem, J.D., 1985. Study and Interpretation of the Chemical Characteristics of Natural
Water. U.S Geological Survey, Water-Supply Paper 2254, 263 p.Hurst, V.J., Könkle, A.C., 1985. Dehydroxylation, rehydroxylation, and stability of
kaolinite. Clays Clay Miner. 33, 1–14.

138 M. Mecchia et al. / Journal of Hydrology 511 (2014) 117–138
Ipiña, J.M., 1994. Aspectos físico-químicos de los tepuyes Acopan y Amuri. Macizode Chimanta, Gran Sabana, Venezuela. Boletin Soc. Venezolana Espeleol. 28, 5–9.
IRSA-CNR, A.P.A.T., 2003. Metodi analitici per le acque Manuali e Linee guida 29/2003. Sez. 4000, 509–524.
Jennings, J.N., 1983. Sandstone pseudokarst or karst? In: Young, R.W.,Nanson, G.C. (Eds.), Aspects of Australian Sandstone Landscape. Australiaand New Zealand Geomorphology Group Special Publication, Wollongong,pp. 21–30.
Krauskopf, K.B., 1956. Dissolution and precipitation of silica at low temperatures.Geochim. Cosmochim. Acta 10, 1–26.
Long, D.G.F., 2002. Aspects of Late Palaeoproterozoic fluvial style: the UairenFormation, Roraima Supergroup, Venezuela. In: Altermann, W., Corcoran, P.L.(Eds.), Precambrian Sedimentary Environments: A Modern Approach to AncientDepositional Systems. Blackwell Pub., pp. 323–338.
Mainguet, M., 1972. Le Modele des Gres. Institut Geographique National, Paris, 657p.
Marker, M.E., 1976. Note on some South African pseudokarst. Boletin Soc.Venezolana Espeleol. 7 (13), 5–12.
Martini, J.E.J., 1979. Karst in Black Reef quartzite near Kaapsehoop, Eastern transval.Ann. S. Afr. Geol. Survey 13, 115–128.
Martini, J.E.J., 1985. Les phénomènes karstiques de quartzites d’Afrique du Sud.Karstologia 9, 45–52.
Martini, J.E.J., 2000. Dissolution of quartz and silicate minerals. In: Klimchouk, A.B.,Ford, D.C., Palmer, A.N., Dreybrodt, W. (Eds.), Speleogenesis. Evolution of KarstAquifers. National Speleological Society, Huntsville, pp. 452–457.
Martini, J.E.J., 2004. Silicate Karst. In: Gunn, J. (Ed.), Encyclopedia of Caves and KarstScience. Fitzroy Dearborn, London, pp. 1385–1393.
Mecchia, M., Piccini, L., 1999. Hydrogeology and SiO2 geochemistry of the AondaCave system (Auyantepui, Bolivar, Venezuela). Bolletin Soc. VenezolanaEspeleol. 33, 1–11.
Mecchia, M., Sauro, F., Corongiu, C., Crobu, V., 2009. Speleological explorations inthe Chimanta massif quartzites (Gran Sabana, Venezuela). Suppl. Kur Mag. 12,1–16.
Nimer, E., 1989. Climatologia do Brasil. IBGE, Rio de Janeiro, 421 p.Norton, D., Knapp, R., 1977. Transport phenomena in hydrothermal systems: the
nature of porosity. Am. J. Sci. 277, 913–936.Palmer, A.N., 1999. A statistical evaluation of the structural influence on solution-
conduit patterns. In: Palmer, A.N., Palmer, M.V., Sasowsky, I.D. (Eds.), KarstModeling. Karst Waters Institute, Special Publication 5, pp. 187–195.
Pettijohn, J., Potter, P.E., Siever, R., 1987. Sand and Sandstone. Springer, Berlin, 553p.
Piccini, L., 1995. Karst in siliceous rock: karst landforms and caves in the Auyán-tepui massif (Est. Bolívar, Venezuela). Int. J. Speleol. 24, 41–54.
Piccini, L., Mecchia, M., 2009. Solution weathering rate and origin of karst landformsand caves in the quartzite of Auyan-tepui (Gran Sabana, Venezuela).Geomorphology 106, 15–25.
Reid, A.R., 1974. Stratigraphy of the type area of the Roraima Group, Venezuela.Bolletin de Geologia, Venezuela, Pub. Especial 6, 343–353.
Rimstidt, J.D., 1997. Quartz solubility at low temperatures. Geochim. Cosmochim.Acta 61, 2553–2558.
Rutherford, G.K., 1967. A preliminary study of the composition of precipitation inS.E. Ontario. Can. J. Earth Sci. 4 (6), 1151–1160.
Santos, J.O.S., Potter, P.E., Reis, N.J., Hartmann, L.A., Fletcher, I.R., McNaughton, N.J.,2003. Age, source, and regional stratigraphy of the Roraima Supergroup andRoraima-like outliers in northern South America based on U–Pb geochronology.Geol. Soc. Am. Bull. 115, 331–348.
Sauro, F., Piccini, L., Mecchia, M., De Waele, J., 2013a. Comment on ‘‘Sandstone caveson Venezuelan tepuis: return to pseudokarst?’’ by R. Aubrecht, T. Lánczos, M.Gregor, J. Schlögl, B. Smída, P. Liscák, Ch. Brewer-Carías, L. Vlcek,Geomorphology 132, 351–365. Geomorphology 197, 190–196.
Sauro, F., De Vivo, A., Vergara, F., De Waele, J., 2013b. Imawarì Yeuta: a new giantcave system in the quartz sandstones of the Auyan Tepui, Bolivar state,Venezuela. In: Filippi, M., Bosak, P. (Eds.), Proceedings of the 16th InternationalCongress of Speleology, vol. 2, Brno, July 19–27, 2013, pp. 142–146.
Sauro, F., Lundberg, J., De Waele, J., Tisato, N., Galli, E., 2013c. Speleogenesis andspeleothems of the Guacamaya Cave, Auyan Tepui, Venezuela. In: Proceedingsof the 16th International Congress of Speleology, vol. 3, Brno, July 19–27, 2013,pp. 298–304.
Sauro, F., Tisato, N., De Waele, J., Bernasconi, S.M., Bontognali, T.R.R., Galli, E., 2013d.Source and genesis of sulphate and phosphate–sulphate minerals in quartz-sandstone cave environment. Sedimentology. http://dx.doi.org/10.1111/sed.12103.
Sczerban, E., Urbani, F., 1974. Formas carsicas en areniscas Precambricas delTerritorio Federal Amazonas y Estado Bolivar. Boletin Soc. Venezolana Espeleol.5 (1), 25–54.
Snow, J.W., 1975. The Climates of northern South America. University of Wisconsin,Madison, 476 p.
Tokunaga, T.K., Wan, J.M., 1997. Water film flow along fracture surfaces of porousrock. Water Resour. Res. 33 (6), 1287–1295.
Urbani, F., 1976. Opalo, Calcedonia y Calcita en la Cueva del Cerro Autano (Am 11),Territorio Federal Amazonas, Venezuela. Boletin Soc. Venezolana Espeleol. 7,129–145.
Urbani, F., Talukdar, S., Szczerban, E., Colveé, P., 1977. Metamorfismo de las rocasdel Grupo Roraima, Ediciones Bolívar y Territorio Federal Amazonas. MemoriasV Congreso Geologico Venezolano, Caracas, pp. 623–638.
White, W.B., Jefferson, J.L., Haman, J.F., 1966. Quartzite karst in SoutheasternVenezuela. Int. J. Speleol. 2, 309–314.
Wray, R.A.L., 1995. Solutional Landforms in Quartz Sandstones of the Sydney Basin.PhD Thesis, University of Wollongong, 381 p.
Wray, R.A.L., 1997a. A global review of solutional weathering forms on quartzsandstones. Earth-Sci. Rev. 42, 137–160.
Wray, R.A.L., 1997b. Quartzite dissolution: karst or pseudokarst? Cave Karst Sci. 24,81–86.
Wray, R.A.L., 2000. The Gran Sabana: the world’s finest quartzite karst? In: Migon, P.(Ed.), Geomorphological Landscapes of the World. Springer, Dordrecht, pp. 79–88.
Wray, R.A.L., 2013, Solutional weathering and karstic landscapes on quartzsandstones and quartzite. In: Frumkin, A. (Ed.), Treatise on Geomporphology,vol. 6, Karst Geomorphology, Elsevier.
Yanes, C.E., Briceño, H.O., 1993. Chemical weathering and the formation of pseudo-karst topography in the Roraima Group, Gran Sabana, Venezuela. Chem. Geol.107, 341–343.
Zawidzki, P., Urbani, F., Koisar, B., 1976. Preliminary notes on the geology of theSarisariñama plateau, Venezuela, and the origin of its caves. Boletin Soc.Venezolana Espeleol. 7, 29–37.