Geomorphic setting and stratigraphy of Cotiga Mound, Mingo County, West Virginia
Upload
bensakovichCategory
view
0download
0
Mapping, modeling, and visualization of the influences of
geomorphic processes on the alpine treeline ecotone,
Glacier National Park, MT, USA
Stephen J. Walsha,*, David R. Butlerb, George P. Malansonc, Kelley A. Crews-Meyerd,Joseph P. Messinae, Ningchuan Xiaoc
aDepartment of Geography, University of North Carolina, Chapel Hill, NC 27599-3220, USAbDepartment of Geography, Southwest Texas State University, San Marcos, TX 78666-4616, USA
cDepartment of Geography, University of Iowa, Iowa City, IA 52242, USAdDepartment of Geography, University of Texas, Austin, TX 78712-1098, USA
eDepartment of Geography, Michigan State University, East Lansing, MI 48824-1115, USA
Received 16 April 2001; received in revised form 25 January 2002; accepted 25 February 2002
Abstract
Spatially explicit digital technologies are integrated within a geographic information science (GISc) context to map, model,
and visualize selected direct and indirect geomorphic processes that influence the spatial organization of the alpine treeline
ecotone (ATE) in Glacier National Park (GNP), MT. GISc is used to examine alpine treeline and its biotic and abiotic controls
through the application of multi-resolution remote sensing systems, geospatial information and product derivatives, and
simulations of treeline spatial organization. Three geomorphic features are examined: relict solifluction terraces, evidence of
nonlinearity in the development of a catena, and the locations of isolated boulders. The significance of these features is in
constraining subsequent geomorphic and biogeographic processes, thus leading to disequilibrium. Exploration of these features
though GISc indicates that visualizations for characterizing the relations of geomorphic patterns and processes within a three-
dimensional context show promise for improved alpine slope models in the future by defining landscape attributes within a
spatially and temporally explicit context.
D 2002 Elsevier Science B.V. All rights reserved.
Keywords: Alpine treeline ecotone; Glacier National Park; Models; Slope; Solifluction; Spatial representations; Visualization
1. Introduction
The purpose of this paper is to examine the effects
of geomorphic processes and patterns that influence
the composition and spatial structure of the alpine
treeline ecotone (ATE) in Glacier National Park
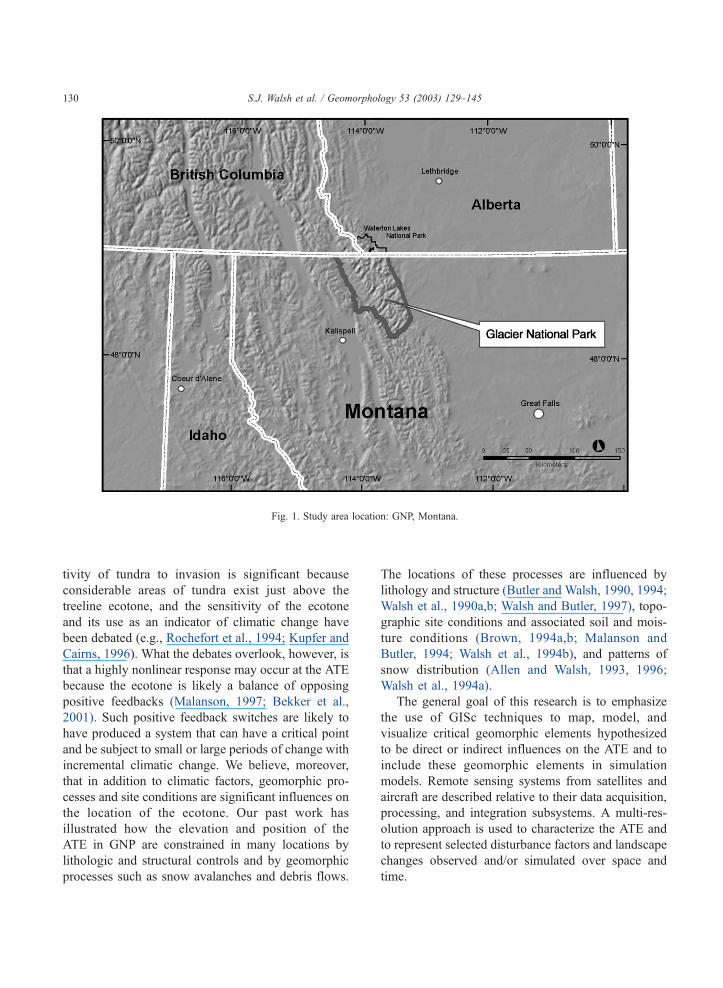
(GNP), MT (Fig. 1). We do so using spatially explicit
digital technologies framed within a geographic infor-
mation science (GISc) context. We emphasize remote
sensing, geographic information systems, and scien-
tific visualizations to assess the effects of geomorphic
processes and patterns at alpine treeline. The sensi-
0169-555X/02/$ - see front matter D 2002 Elsevier Science B.V. All rights reserved.
doi:10.1016/S0169-555X(02)00350-1
* Corresponding author. Tel.: +1-919-962-3867; fax: +1-919-
962-1537.
E-mail address: [email protected] (S.J. Walsh).
www.elsevier.com/locate/geomorph
Geomorphology 53 (2003) 129–145
tivity of tundra to invasion is significant because
considerable areas of tundra exist just above the
treeline ecotone, and the sensitivity of the ecotone
and its use as an indicator of climatic change have
been debated (e.g., Rochefort et al., 1994; Kupfer and
Cairns, 1996). What the debates overlook, however, is
that a highly nonlinear response may occur at the ATE
because the ecotone is likely a balance of opposing
positive feedbacks (Malanson, 1997; Bekker et al.,
2001). Such positive feedback switches are likely to
have produced a system that can have a critical point
and be subject to small or large periods of change with
incremental climatic change. We believe, moreover,
that in addition to climatic factors, geomorphic pro-
cesses and site conditions are significant influences on
the location of the ecotone. Our past work has
illustrated how the elevation and position of the
ATE in GNP are constrained in many locations by
lithologic and structural controls and by geomorphic
processes such as snow avalanches and debris flows.
The locations of these processes are influenced by
lithology and structure (Butler and Walsh, 1990, 1994;
Walsh et al., 1990a,b; Walsh and Butler, 1997), topo-
graphic site conditions and associated soil and mois-
ture conditions (Brown, 1994a,b; Malanson and
Butler, 1994; Walsh et al., 1994b), and patterns of
snow distribution (Allen and Walsh, 1993, 1996;
Walsh et al., 1994a).
The general goal of this research is to emphasize
the use of GISc techniques to map, model, and
visualize critical geomorphic elements hypothesized
to be direct or indirect influences on the ATE and to
include these geomorphic elements in simulation
models. Remote sensing systems from satellites and
aircraft are described relative to their data acquisition,
processing, and integration subsystems. A multi-res-
olution approach is used to characterize the ATE and
to represent selected disturbance factors and landscape
changes observed and/or simulated over space and
time.
Fig. 1. Study area location: GNP, Montana.
S.J. Walsh et al. / Geomorphology 53 (2003) 129–145130
All spatially explicit data used in our treeline
research were organized within a multimedia-inte-
grated GIS so that multiple views of the landscape
could be accommodated by linking data spatially,
temporally, and thematically. In addition dynamic,
visualizations were developed to support the mapping
and modeling elements through animations. These
animations involved model outputs, spatial displays
of co-variable and multiple-variable combinations,
satellite image change detections, multi-resolution
image views, and characterizations of compositional
and spatial patterns of the ATE associated with
lithologic, topographic, and structural controls. Each
of the GISc methods and techniques examined was
selected on the basis of (i) their potential wide
applicability (i.e., geographically and thematically)
within geomorphology; (ii) their availability through
current technologies including hardware and software
systems that are commercially supported; (iii) their
representation of proven methods and technologies
used in allied sciences, particularly landscape ecology
and physical geography; and (iv) their considerable
utility in our previous, current, and planned geomor-
phic and vegetation studies in Glacier National Park.
Therefore, each GISc method and technique offers the
potential to make a real scientific contribution to the
study of landscape form and function without impos-
ing unreasonable learning curves on rare or experi-
mental hardware/software systems.
Here, we are particularly interested in the following
questions:
(i) Does the presence of relict solifluction terraces
aid the upward migration of treeline?
(ii) Can nonlinearities in catenae affect the advance
of treeline?
(iii) What is the role of individual boulders in aiding
upward migration of treeline?
These three questions have broader significance in
geomorphology. Relict solifluction terraces, a wide-
spread feature of alpine geomorphology, can affect
slope processes for centuries if not millennia. As such,
they create conditions that are paraglacial, i.e., dis-
equilibrium (sensu Renwick, 1992) conditions caused
by a significant relaxation time in process–pattern
relations following glacial climates (Church and
Ryder, 1972). Differences in solifluction terraces, as
might be determined through the application of GISc
techniques, could be an important aspect in the
development of alpine slope models. For example,
the second question, on nonlinearities in catenae,
arises from the potential effect of solifluction terraces
on Burns and Tonkin’s (1982) Synthetic Alpine Slope
model. They emphasized that slow soil development
could lead to geomorphic thresholds. GISc techniques
can identify locations where such process thresholds
may be imminent. Finally, although individual bould-
ers are not a definitive part of a slope and soil model,
they can be generated by solifluction processes that
isolate them or lead to their movement. Individual
boulders may also be, however, a widespread result of
glaciation, i.e., erratics. In some places, glacial erratics
or other individual boulders may affect subsequent
geomorphic–soil–vegetation relations by providing a
source of otherwise unavailable nutrients through
weathering, by providing a site for aeolian deposition,
and by providing a sheltered site for plant growth. In
this paper, we report on the application of GISc
techniques to the identification of such geomorphic
features.
The basic intent of this paper is to (i) summarize
what we have already accomplished in the recent past
through the application of GISc to the study of the
ATE, with particular attention devoted to geomorphic
topics and concerns; (ii) report on current activities in
GISc directed at selected questions of geomorphol-
ogy; and (iii) chart our future directions in basic and
applied GISc research that involves new theoretical
insights into the form and pattern of the ATE,
hypothesized biotic and abiotic controls, and how
GISc might be used to map, model, and visualize
the ATE within a space–time context.
2. Study area: Glacier National Park and Lee
Ridge, MT, USA
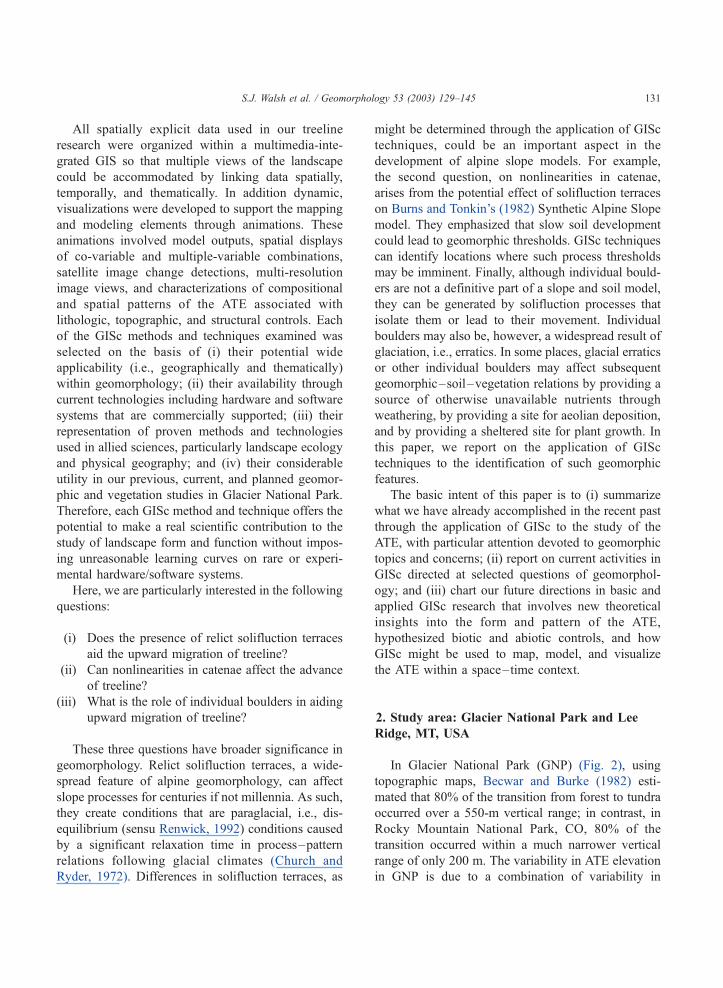
In Glacier National Park (GNP) (Fig. 2), using
topographic maps, Becwar and Burke (1982) esti-
mated that 80% of the transition from forest to tundra
occurred over a 550-m vertical range; in contrast, in
Rocky Mountain National Park, CO, 80% of the
transition occurred within a much narrower vertical
range of only 200 m. The variability in ATE elevation
in GNP is due to a combination of variability in
S.J. Walsh et al. / Geomorphology 53 (2003) 129–145 131
macroclimate, microclimate, topography, snow and
debris avalanches, and competition with tundra (But-
ler et al., 1992; Walsh et al., 1992; Malanson and
Butler, 1994). This variability makes the park an
excellent place to study spatial pattern; it is probably
more representative of the range of conditions found
in the Rocky Mountains.
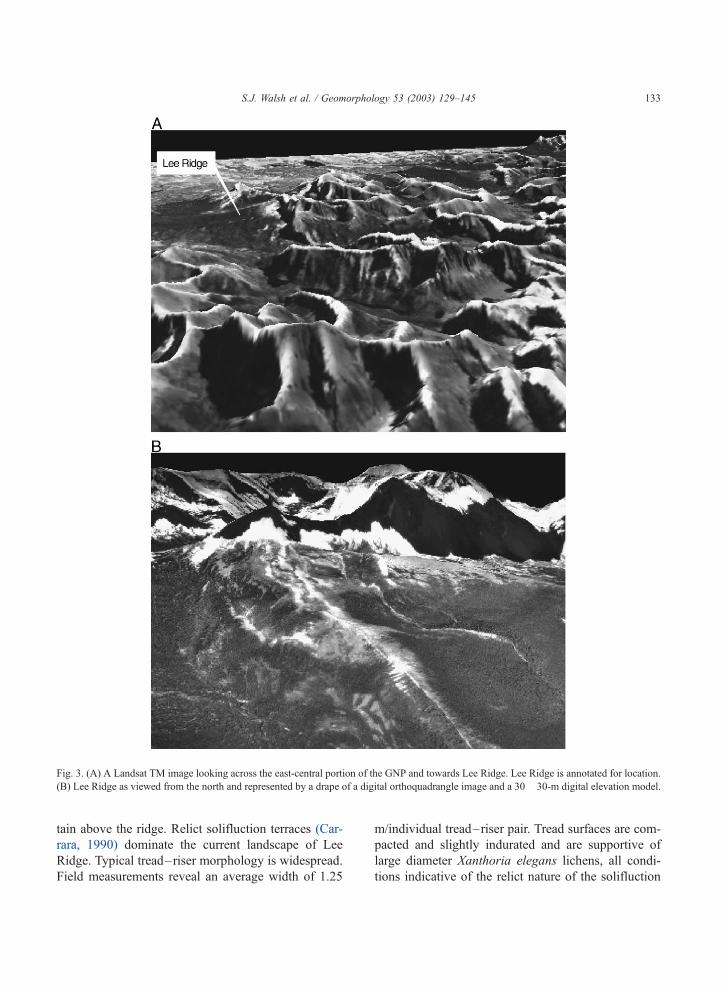
In addition to an array of sites and conditions
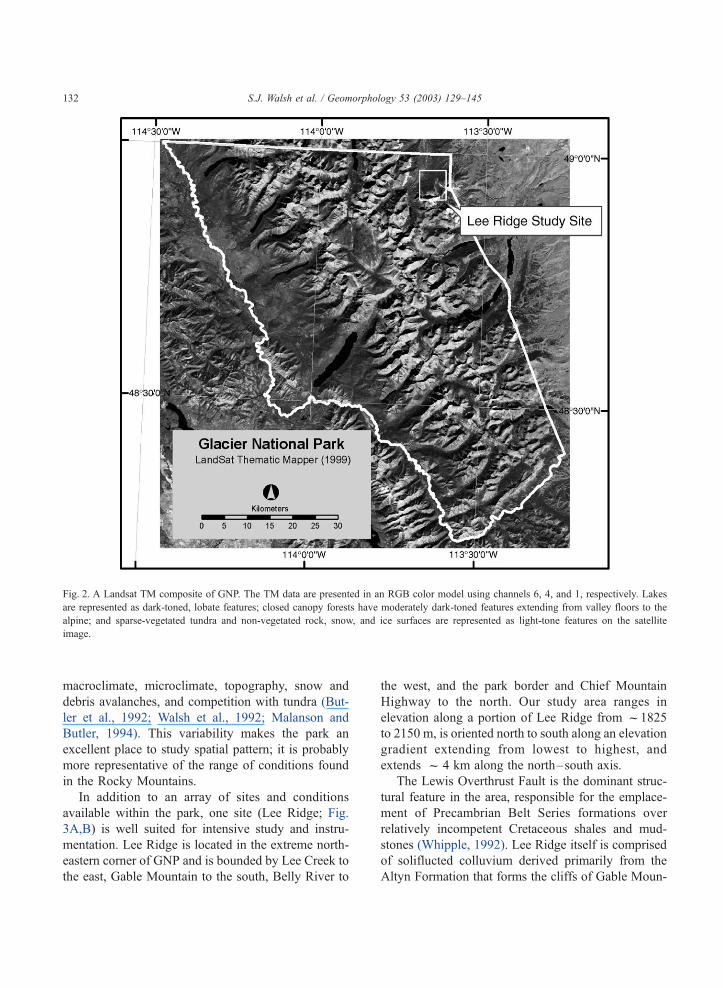
available within the park, one site (Lee Ridge; Fig.
3A,B) is well suited for intensive study and instru-
mentation. Lee Ridge is located in the extreme north-
eastern corner of GNP and is bounded by Lee Creek to
the east, Gable Mountain to the south, Belly River to
the west, and the park border and Chief Mountain
Highway to the north. Our study area ranges in
elevation along a portion of Lee Ridge from f1825
to 2150 m, is oriented north to south along an elevation
gradient extending from lowest to highest, and
extends f 4 km along the north–south axis.
The Lewis Overthrust Fault is the dominant struc-
tural feature in the area, responsible for the emplace-
ment of Precambrian Belt Series formations over
relatively incompetent Cretaceous shales and mud-
stones (Whipple, 1992). Lee Ridge itself is comprised
of soliflucted colluvium derived primarily from the
Altyn Formation that forms the cliffs of Gable Moun-
Fig. 2. A Landsat TM composite of GNP. The TM data are presented in an RGB color model using channels 6, 4, and 1, respectively. Lakes
are represented as dark-toned, lobate features; closed canopy forests have moderately dark-toned features extending from valley floors to the
alpine; and sparse-vegetated tundra and non-vegetated rock, snow, and ice surfaces are represented as light-tone features on the satellite
image.
S.J. Walsh et al. / Geomorphology 53 (2003) 129–145132
tain above the ridge. Relict solifluction terraces (Car-
rara, 1990) dominate the current landscape of Lee
Ridge. Typical tread–riser morphology is widespread.
Field measurements reveal an average width of 1.25
m/individual tread–riser pair. Tread surfaces are com-
pacted and slightly indurated and are supportive of
large diameter Xanthoria elegans lichens, all condi-
tions indicative of the relict nature of the solifluction
Fig. 3. (A) A Landsat TM image looking across the east-central portion of the GNP and towards Lee Ridge. Lee Ridge is annotated for location.
(B) Lee Ridge as viewed from the north and represented by a drape of a digital orthoquadrangle image and a 30� 30-m digital elevation model.
S.J. Walsh et al. / Geomorphology 53 (2003) 129–145 133
processes on the ridge. Localized patches of bioper-
turbation by ground squirrels and grizzly bears (sensu
Butler, 1995) disrupt the surface of some solifluction
terraces and expose fine-grained sediments to erosion
from runoff. These exposed patches of fine-grained
sediment may also, however, serve as potential seed-
beds for tree expansion on the ridge. Individual
boulders of Altyn limestone are distributed randomly
across and along the ridge, probably the result of
rockfall and subsequent rolling and tumbling from
Gable Mountain. These boulders are also typically
lichen-covered, indicative of stability.
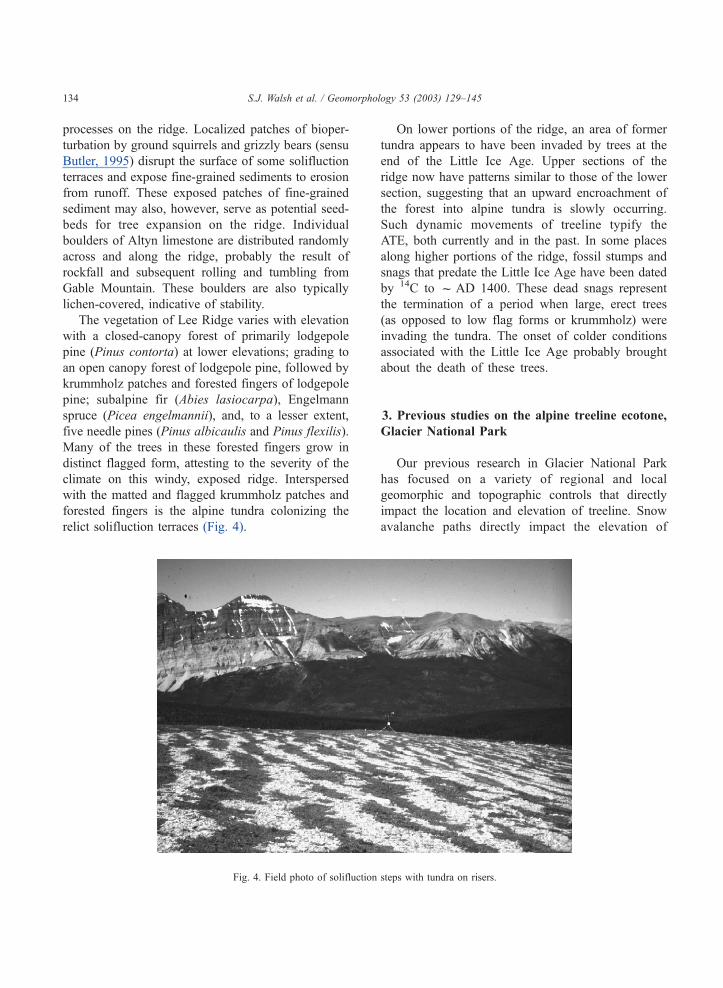
The vegetation of Lee Ridge varies with elevation
with a closed-canopy forest of primarily lodgepole
pine (Pinus contorta) at lower elevations; grading to
an open canopy forest of lodgepole pine, followed by
krummholz patches and forested fingers of lodgepole
pine; subalpine fir (Abies lasiocarpa), Engelmann
spruce (Picea engelmannii), and, to a lesser extent,
five needle pines (Pinus albicaulis and Pinus flexilis).
Many of the trees in these forested fingers grow in
distinct flagged form, attesting to the severity of the
climate on this windy, exposed ridge. Interspersed
with the matted and flagged krummholz patches and
forested fingers is the alpine tundra colonizing the
relict solifluction terraces (Fig. 4).
On lower portions of the ridge, an area of former
tundra appears to have been invaded by trees at the
end of the Little Ice Age. Upper sections of the
ridge now have patterns similar to those of the lower
section, suggesting that an upward encroachment of
the forest into alpine tundra is slowly occurring.
Such dynamic movements of treeline typify the
ATE, both currently and in the past. In some places
along higher portions of the ridge, fossil stumps and
snags that predate the Little Ice Age have been dated
by 14C to fAD 1400. These dead snags represent
the termination of a period when large, erect trees
(as opposed to low flag forms or krummholz) were
invading the tundra. The onset of colder conditions
associated with the Little Ice Age probably brought
about the death of these trees.
3. Previous studies on the alpine treeline ecotone,
Glacier National Park
Our previous research in Glacier National Park
has focused on a variety of regional and local
geomorphic and topographic controls that directly
impact the location and elevation of treeline. Snow
avalanche paths directly impact the elevation of
Fig. 4. Field photo of solifluction steps with tundra on risers.
S.J. Walsh et al. / Geomorphology 53 (2003) 129–145134
treeline by depressing the upper limit of tree growth
well below the climatic treeline (Walsh et al.,
1994a,b). The location of those avalanche paths is,
in turn, largely controlled by the regional pattern of
structural lineaments and bedrock units associated
with the Lewis Overthrust Fault (Butler and Walsh,
1990; Walsh et al., 1990a).
Other mass movement processes, notably debris
flows (Butler and Walsh, 1994; Walsh and Butler,
1997) and rock avalanche deposits (Butler et al.,
1998), also depress treeline in individual drainage
basins and along the leading edge of the Lewis
Overthrust. Debris flow sites are concentrated
beneath couloirs and gullies which also coincide
with (and are largely controlled by) the aforemen-
tioned spatial pattern of lineaments. Proximity to
semi-permanent snow patches, slope concavity, and
leeward slopes was shown to be favorable for debris
flow development and resultant depression of tree-
line.
The temporal pattern of snowmelt (controlled by
local topography, slope aspect, solar radiation poten-
tial, and wind patterns) also influences the elevation
of treeline in GNP. Brown (1994a,b) and Walsh et
al. (1994b) described three basins within eastern
GNP where treeline occurred at higher or lower
elevations than was to be expected given the cli-
matic parameters of the area. Snow patch distribu-
tion and snowmelt patterns played a strong role in
determining which sites were too dry for adequate
tree growth or which melted out too late in the
growing season to sustain tree growth (Walsh et al.,
1994a).
4. Approach
The aim of this current ATE research was to
assess the sensitivity and geomorphic characteristics
of alpine tundra that make it more susceptible to
invasion by woody species. This basic aim will be
met by developing models of tree species establish-
ment and growth that reflect causal mechanisms.
The models are based on geomorphic and biogeo-
graphic field data that include solifluction tread–
riser morphometry, surface induration/penetrability,
mapping of individual boulders associated with iso-
lated tree seedling establishment, mapping of the
pattern of animal disturbances of the soil surface,
and mapping of vegetation from multispectral air-
craft imagery—with ground-control for verification.
The models will be developed and validated at
multiple spatial and temporal scales using a GISc
approach. GISc indicators of the conditions above
treeline will be used to parameterize models, and
GISc indicators of past and present treeline will be
used to validate models. The results will allow the
interpretation of past and ongoing changes at and
above treeline.
4.1. Multimedia GIS databases
Geospatial data and Geographic Information Sys-
tems (GIS) techniques were used to represent mor-
phometric characteristics of disturbance factors (e.g.,
debris flows and snow avalanche paths) and process
variables (e.g., solar radiation potential, soil moisture
potential, snow accumulation, and ablation patterns)
hypothesized to influence the form and structure of
the ATE. A multimedia integrative GIS was devel-
oped as the analytical ‘‘backbone’’ of the research. All
static and derived data layers, in situ and remote
information, and cartographic and modeled surfaces
were assembled in the GIS database to support the
research. Digital displays were developed to examine
the relationships between scale, pattern, and process
relationships of debris flows and snow avalanche
paths and terrain characteristics and the geomorphol-
ogy of the alpine and the subalpine environments. The
static and derived data layers generated through
remote sensing and GIS approaches populated the
database for retrieval and transformation through data
visualizations that included temporal and spatial ani-
mations, flyovers, image change detections, three-
dimensional representations, image rotations, thematic
drapes, movie loops, and spatial simulations to sup-
port the mapping and modeling activities. Dynami-
cally linked data views (e.g., video, image graphics,
text, and maps) are examined in user-selected combi-
nations on the basis of commonly linked attributes
(e.g., feature IDs) within the multimedia GIS environ-
ment. Such visualization methods are highly interac-
tive, allow the user to change the extent of views (i.e.,
spatial and temporal scales), facilitate nesting of data
and scales, and accommodate the visualization of
hierarchy.
S.J. Walsh et al. / Geomorphology 53 (2003) 129–145 135
4.2. GISc: remote sensing data collection
During the summer of 1999, ADAR high spatial
resolution digital imagery was acquired. The ADAR
5500 system is a second generation, charge-coupled
device, frame camera system operated by Positive
Systems, Whitefish, MT. The ADAR 5500 operates
in four channels in the visible and near-infrared wave-
lengths (460–550, 520–610, 610–700, and 780–920
nm, respectively). The across-track field of view is
39j, and the radiometric resolution is 8 bits. Full-
frame image capture formats are 1500� 1000 pixels
with the spatial resolution varying between 50 cm and
3.0 m/pixel ground-sample distance. The nominal
spatial resolution of the imagery for our study was
1�1 m. On-board Global Positioning System (GPS)
technology spatially related each acquired image
frame to ground coordinates. Post-flight processing
modules facilitated (i) vignette correction of images
for exposure variation due to the internal effects of
sensors and optics, (ii) channel-to-channel registration
for automatic co-registration of the four multispectral
images, and (iii) file format translation for conversion
of the digital images to common file formats required
by our image processing applications software—
ERDAS Imagine.
Approximately 20 flight strips and 520 frames
measuring 1500� 1000 pixels were acquired. Follow-
ing atmospheric, geometric, and radiometric correc-
tions, initial processing was required to create a photo-
mosaic by referencing the ADAR frames to the
orthophotoquadrangles using a ‘‘camera model’’
approach that relied upon aircraft specifications and
geodetic control points established in the field during
the period of image collection. In addition to collect-
ing GPS coordinates for obvious natural features in
the field that were judged stable for our purposes (e.g.,
rock outcrops and stream/trail intersections) and/or
quasi-stable features (e.g., snow patches and water
bodies), registration markers were constructed of
plastic panels of 3� 3 m and displayed on the ground
in a ‘‘cross-hair’’ style for representation on the
acquired high resolution ADAR imagery. With the
natural and artificial ground markers spatially refer-
enced through GPS technology and subsequently
differentially corrected for higher spatial accuracies,
the mosaic image was developed as a seamless image
of the study site.
4.3. Basic image processing
Processing of the ADAR 5500 digital aircraft
data was achieved according to the following gen-
eralized set of considerations: (i) preprocessing of
the data to remove geometric and radiometric dis-
tortions in the data to reduce terrain-induced illumi-
nation biases (Meyer et al., 1993), and to perform
geographic referencing of the data to UTM coordi-
nates; (ii) preparation of a feature set for classifica-
tion of the ADAR and Landsat Thematic Mapper
(TM) satellite data through statistical clustering and
categorization of spectral responses for land use–
land cover (LULC) mapping; (iii) calculation of the
Normalized Difference Vegetation Index (NDVI), a
measure of plant greenness through use of the
visible and near-infrared spectral channels that are
sensitive to plant pigmentation and chlorophyll con-
tent, respectively, of the ADAR 5500 and Landsat
TM; and (iv) special-purpose processing (e.g., digital
enhancements) of the ADAR data to (a) clarify the
position of landscape boulders that serve as anchors
against the wind where soil fines may accumulate
and produce a more favorable environment for tree
seedling establishment, (b) define solifluction pat-
terns (e.g., treads and risers), and (c) differentiate
between tree/no-tree surfaces for evaluation of the
simulation models of tree growth and establishment
at Lee Ridge.
Principal Components Analysis (PCA) is often
regarded as a data compression technique that
enhances image views by representing scene spectral
variance from multiple remote sensing channels into
derived and transformed images that capture de-
creasing amounts of that variance through the com-
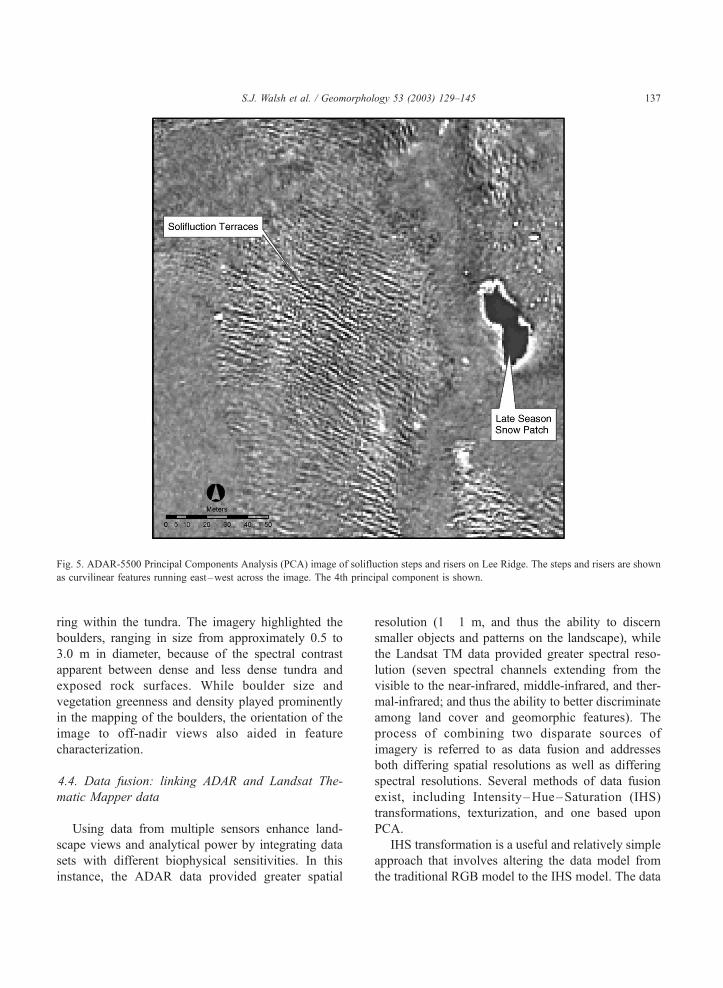
ponents (Walsh et al., 1990b). Fig. 5 is a view of
Lee Ridge with the first principal component of the
multiple channels of ADAR representing the soli-
fluction steps and risers. The image characterizes the
curvilinear pattern of the solifluction lobes and the
terraces running through Lee Ridge. The vegetated
solifluction risers are represented as interleaved,
dark-toned bands running across Lee Ridge, while
the non-vegetated solifluction steps are represented
as light-tone alternating bands. Lee Ridge was also
represented through an RGB (Red: channel 4;
Green: channel 3; Blue: channel 2) image of the
ADAR data to characterize isolated boulders occur-
S.J. Walsh et al. / Geomorphology 53 (2003) 129–145136
ring within the tundra. The imagery highlighted the
boulders, ranging in size from approximately 0.5 to
3.0 m in diameter, because of the spectral contrast
apparent between dense and less dense tundra and
exposed rock surfaces. While boulder size and
vegetation greenness and density played prominently
in the mapping of the boulders, the orientation of the
image to off-nadir views also aided in feature
characterization.
4.4. Data fusion: linking ADAR and Landsat The-
matic Mapper data
Using data from multiple sensors enhance land-
scape views and analytical power by integrating data
sets with different biophysical sensitivities. In this
instance, the ADAR data provided greater spatial
resolution (1�1 m, and thus the ability to discern
smaller objects and patterns on the landscape), while
the Landsat TM data provided greater spectral reso-
lution (seven spectral channels extending from the
visible to the near-infrared, middle-infrared, and ther-
mal-infrared; and thus the ability to better discriminate
among land cover and geomorphic features). The
process of combining two disparate sources of
imagery is referred to as data fusion and addresses
both differing spatial resolutions as well as differing
spectral resolutions. Several methods of data fusion
exist, including Intensity–Hue–Saturation (IHS)
transformations, texturization, and one based upon
PCA.
IHS transformation is a useful and relatively simple
approach that involves altering the data model from
the traditional RGB model to the IHS model. The data
Fig. 5. ADAR-5500 Principal Components Analysis (PCA) image of solifluction steps and risers on Lee Ridge. The steps and risers are shown
as curvilinear features running east–west across the image. The 4th principal component is shown.
S.J. Walsh et al. / Geomorphology 53 (2003) 129–145 137
sets are first resampled to a common pixel dimension
or spatial resolution and then transformed to the IHS
model. This method is commonly used when integrat-
ing Landsat TM and SPOT Panchromatic data (SPOT
Panchromatic has a 10� 10-m spatial resolution but
only one spectral channel that represents the broad
visible portion of the spectrum). Texturization, in
contrast, maintains the different pixel dimensions
and instead uses the finer-grained data (here, ADAR)
to provide textural information for each Landsat TM
pixel (each Landsat TM pixel is 30� 30 m, and thus
would contain f 900 ADAR pixels at a resolution of
1�1 m). Statistics are derived from the finer-grained
data and imported into the areal template provided by
the coarser-grained data.
For vegetation cover assessment, the finer-scaled
data can also be used to generate a vegetation index
such as NDVI that is compiled into the Landsat TM
30� 30-m template and used as an additional layer of
textural information. However, given the lower spec-
tral resolution of the ADAR data, not all vegetation
indices can be compiled to be equivalent with TM-
based indices. Texture statistics could also be gener-
ated from ADAR-based NDVI values and used to
inform the Landsat TM data layers. Also, in addition
to spatially compiling the 1�1-m ADAR data into
the 30� 30-m resolution template of Landsat TM, a
moving window or kernel can also be used to generate
statistics and/or vegetation index values to translate
neighborhood textural information from the ADAR
imagery to the TM imagery.
The third type of approach involves the use of
PCA, a derived set of orthogonal axes developed from
the spectral input channels of the remote sensing
system and represented by single layers of informa-
tion. Many times, the PCA layers from alternate
systems (e.g., derived from ADAR) are substituted
for one of the visible channels of the Landsat TM
imagery, as visible channels are known to contain
redundant information for many land cover types and
often have moderate to severe atmospheric scattering.
The process may also be used in the reverse direction
whereby a PCA transform is used to create one
channel of TM data used in conjunction with other
ADAR channels, again likely replacing one of the
ADAR visible channels.
While other approaches exist, the general fusion
methodology described herein relies upon using
higher resolution information to inform the co-
arser-grained analyses. In a more formal sense,
multilevel statistical models can also be developed
to integrate fine- and coarse-grained information in
a multivariate model where spectral channels and
their transformations serve as the descriptor varia-
bles. Also, within a context of data visualization,
overlaying higher spatial resolution data onto
coarser resolution data is quite common for enhanc-
ing selected landscape strata where additional infor-
mation is needed, such as edges and ecotones. In a
multiphased approach, Landsat TM data might be
used to characterize a landscape signature of a
disturbance, where the higher spatial resolution
ADAR data are then used to assess the nature of
that disturbance.
Lastly, the customization of data acquired via an
aircraft platform (as opposed to a satellite platform)
is an important issue to consider. Since the ADAR
data were acquired from an aircraft, mission spec-
ifications were set to highlight specific landscape
views and mapping goals. Such customization gives
the analyst control over maximizing the potential
utility of the data. For instance, timing an over-
flight to make use of low sun-angle conditions or
altering landscape views through experimentation
with sensor-terrain azimuth and orientation could
be used to enhance features such as solifluction
terraces, lineaments, and contacts between forest
edges. Moreover, the gain settings of the sensors
can be altered to enhance various segments of the
landscape such as the higher reflecting tundra or the
lower reflecting coniferous forest. In other words,
the analyst can interact more with mission specifi-
cations on aircraft- and ground-based systems than
on satellite-based systems. Ground-based spectral
radiometers and plant canopy analyzers might also
be used within a multi-resolution concept to inform
the ADAR data (or Landsat TM data) and to help
set mission specifications for optimizing landscape
characterizations from remotely sensed systems by
predetermining optimum spectral regions for map-
ping.
4.5. Digital elevation models
Digital elevation data consist of an array of
regularly spaced elevations. Elevation is used for
S.J. Walsh et al. / Geomorphology 53 (2003) 129–145138
the determination of potential energy: calculation of
climatic variables such as pressure and temperature,
vegetation and soil trends, and material volumes
including cut and fill. From the discrete digital
elevation data, calculating derivatives is possible at
any location. The 30� 30-m digital elevation models
for Lee Ridge and the immediate vicinity were
processed to characterize topographic elevation and
the primary derivatives—slope angle and slope
aspect. In addition, we have used the DEMs to
generate higher-order variables including solar radi-
ation potential and soil moisture potential after
Brown (1992) and Allen (1995), landform index
after McNab (1993), and wind potential after Allen
(1995).
4.6. Simulation models
We are developing nested models of treeline
response. The core model is a mechanistic model
of tree establishment and growth based on modifi-
cations to, and integration between, two existing
models; a biogeochemical cycling model (ATE-
BGC; Cairns, 1997; Cairns and Malanson, 1997,
1998), and a forest gap model (FORSKA; Leemans,
1989) modified to represent the form of mat
krummholz growth as well as upright trees. The
models are being validated using ADAR data,
digital orthophotoquads, and ground samples for
test slopes. The core model is embedded in a
mesoscale landscape model (Walsh et al., 1990a,b;
Brown, 1994a,b) and also generates a fine-scale,
cellular automaton model to analyze emergent spa-
tial pattern. Here, we use an even simpler model
(Malanson et al., 2000) that is preliminary to the
cellular automaton.
This basic simulation model embodies the re-
source-averaging hypothesis: trees need to gather
more resources and can do so over a larger area than
do tundra plants. When resources become few and
patchy along a gradient, a limit for trees will be
reached. Our simulation allows us to model the
relation between the spatial pattern of the alpine
treeline ecotone and the abiotic pattern of the environ-
ment, including geomorphic conditions at the boun-
dary. The simulation also allows us to examine the
change in the abiotic resources on a slope that can be
caused by geomorphic features.
5. Results
We address three questions that are examined here:
(i) What geomorphic features can we incorporate in
our models using GISc?
(ii) What vegetation features can we detect with
GISc that lead us to new hypotheses about
geomorphic constraints?
(iii) Can scientific data visualization help?
5.1. Modeling geomorphic features
Two geomorphic features can be mapped into a
GIS based on image analysis. Solifluction lobes
appear as a regular pattern in the image derived from
the ADAR data using PCA (Fig. 5). Isolated boulders
(which may serve as sites offering adequate soil
moisture, weathering generated nutrients, and protec-
tion from wind) appear as randomly distributed fea-
tures on the RGB image derived from ADAR data.
Will these patterns of geomorphic features lead to
differences in a simulation model? As a preliminary
test, we examined the differences in our resource-
averaging model between gradients created with, and
without, a specific effect that might be created by
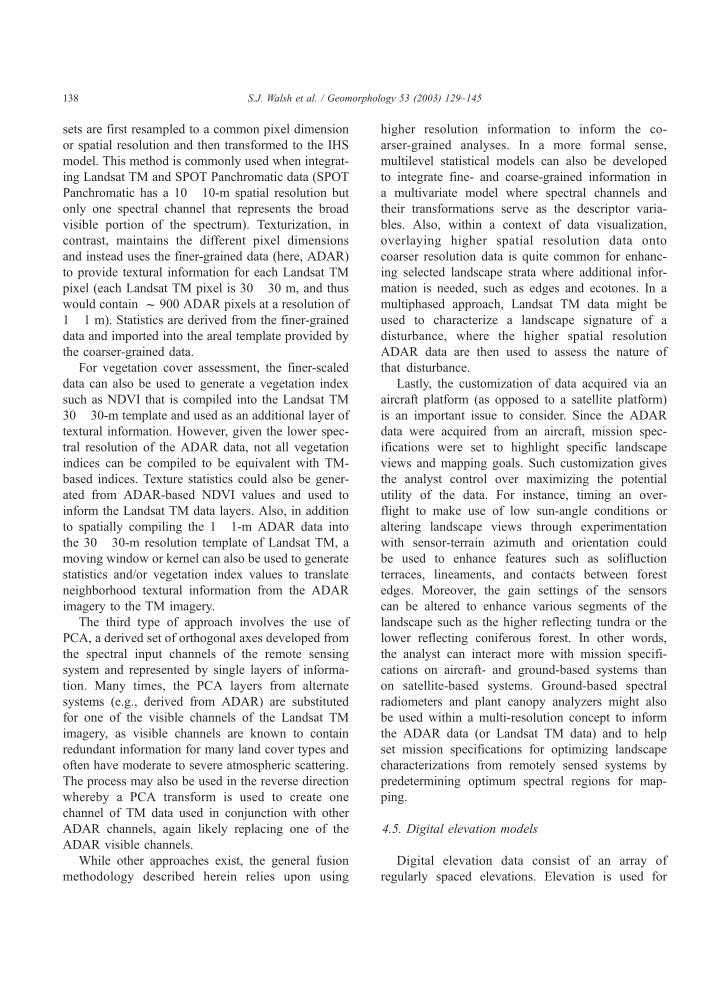
solifluction lobes. To verify our simulations and to
explore how new inputs might change the current
treeline at Lee Ridge from current conditions, a tree/
no-tree image was generated through an ISODATA,
unsupervised classification of the ADAR-5500 digital
data (Fig. 6). Our basic question on Lee Ridge was:
could the fingers of trees extending up into tundra be
a response to linear patterns in the abiotic environ-
ment, i.e., the solifluction lobes. To the kinds of
variance added to the environmental gradient of
abiotic-site quality by the model (e.g., random var-
iance at 30% of the mean or a fractal surface of
variance), we increased the abiotic site quality of
every other column by 10% (note that on Lee Ridge,
the solifluction lobes run nearly perpendicular to the
advancing forest edge). Fig. 7A,B reveals that the
addition of solifluction lobes does produce the kinds
of finger-like distribution of trees that are seen on Lee
Ridge and elsewhere. The problem remains that the
fingers are not exactly parallel to the lobes—they
cross them at an angle of 20j, and in other places the
angle may be greater.
S.J. Walsh et al. / Geomorphology 53 (2003) 129–145 139
We are working to incorporate the pattern of bould-
ers in the model. Preliminary fieldwork indicates that
fine aeolian sediments collect on the leeward sides of
boulders on Lee Ridge, where winds are predominantly
from the west. The aeolian deposits are substantially
enriched in silt and clay when compared to exposed
soils on the adjacent wind-swept solifluction treads.
5.2. New vegetation features
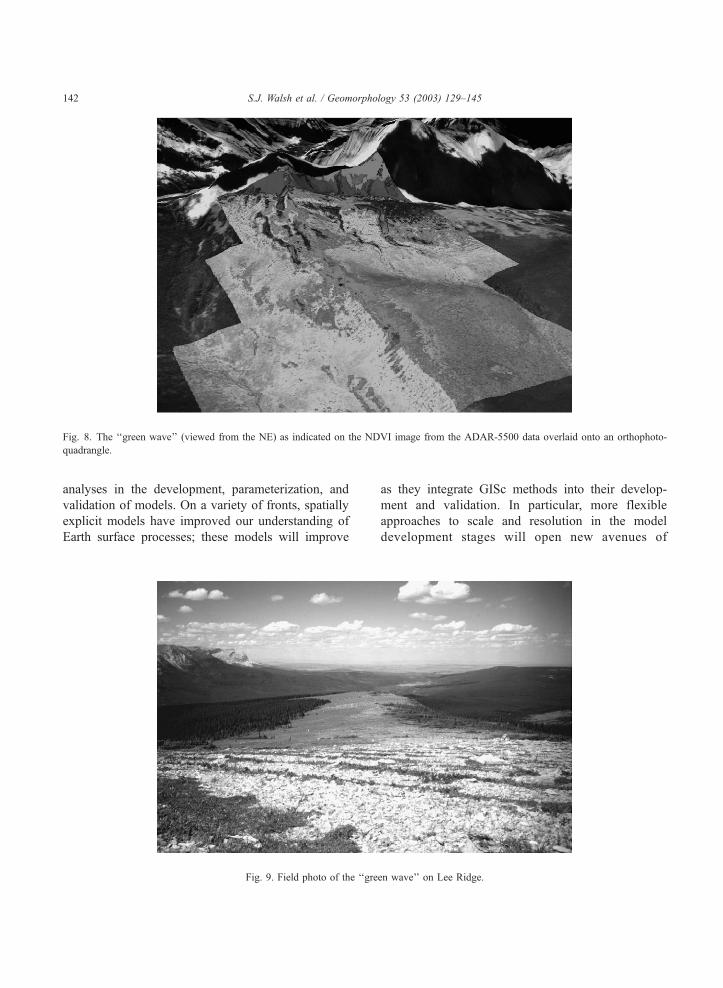
Previously unobserved, the remote sensing product
revealed a ‘‘green wave’’ of denser tundra that is in
advance of the forest edge and which extends out and
beyond the most advanced fingers and outliers of the
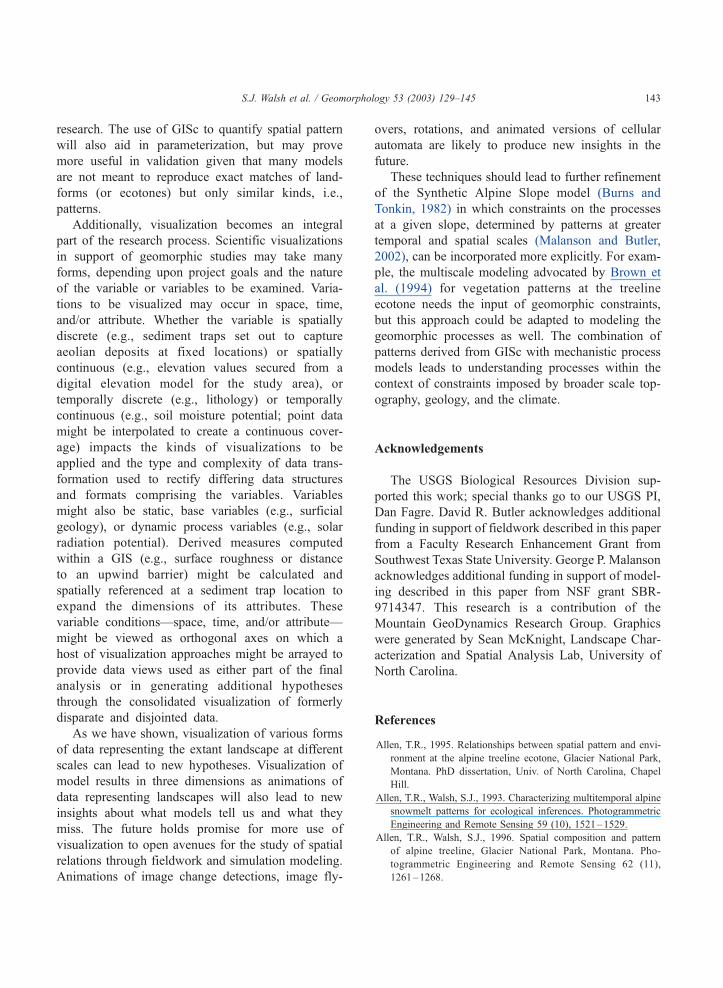
forest edge (Fig. 8). The wave is now obvious on
analog aerial photography as well, but it is still difficult
to discern in the field (Fig. 9). We hypothesize that this
denser tundra is indicative of conditions deeper below
the surface, where finer-grained soils will allow the
establishment of trees. The green wave represents a
relatively abrupt transition from clear solifluction ter-
races where the treads are unvegetated to a condition in
which the treads are vegetated and the subsequent soil
and slope processes will approach equilibrium with
current forces more quickly.
5.3. Visualization
Scientific data visualization has aided our under-
standing of fine-scale geomorphic patterns and their
relationship with, and possible influence on, the
alpine treeline ecotone on Lee Ridge. Visualization
of geomorphic features on processed imagery
draped on DEMs allows us to determine how to
include them in simulation models. Future simula-
tions will use the data underlying the draped
imagery (elevation and both solifluction and iso-
lated boulders) as a direct input to the surface of
the variance of the abiotic site quality. Future
fieldwork will be aimed at testing hypotheses about
the green wave. Once we know what causes this
feature, it can then be incorporated in simulations
either as a direct input or dynamically by simulating
the process behind it.
6. Discussion and interpretations
Where are the emergent opportunities and chal-
lenges of GISc in geomorphology? GISc promises to
make spatial patterns a more fundamental part of our
Fig. 6. ADAR-derived image of tree (black)/no-tree (white) categorization of Lee Ridge.
S.J. Walsh et al. / Geomorphology 53 (2003) 129–145140
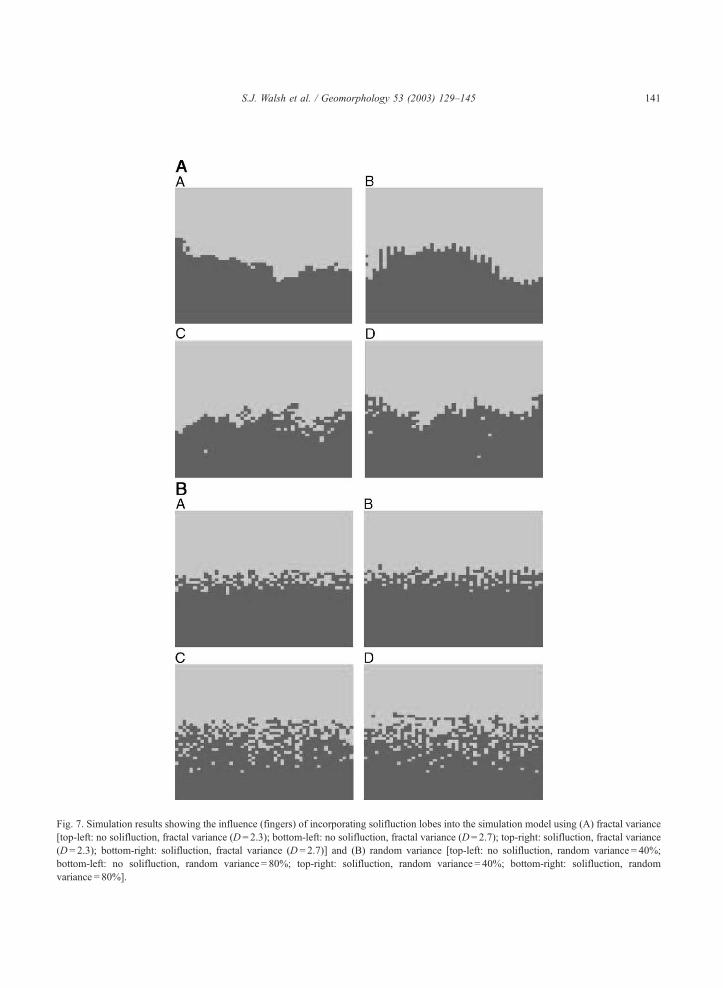
Fig. 7. Simulation results showing the influence (fingers) of incorporating solifluction lobes into the simulation model using (A) fractal variance
[top-left: no solifluction, fractal variance (D = 2.3); bottom-left: no solifluction, fractal variance (D= 2.7); top-right: solifluction, fractal variance
(D = 2.3); bottom-right: solifluction, fractal variance (D = 2.7)] and (B) random variance [top-left: no solifluction, random variance = 40%;
bottom-left: no solifluction, random variance = 80%; top-right: solifluction, random variance = 40%; bottom-right: solifluction, random
variance = 80%].
S.J. Walsh et al. / Geomorphology 53 (2003) 129–145 141
analyses in the development, parameterization, and
validation of models. On a variety of fronts, spatially
explicit models have improved our understanding of
Earth surface processes; these models will improve
as they integrate GISc methods into their develop-
ment and validation. In particular, more flexible
approaches to scale and resolution in the model
development stages will open new avenues of
Fig. 9. Field photo of the ‘‘green wave’’ on Lee Ridge.
Fig. 8. The ‘‘green wave’’ (viewed from the NE) as indicated on the NDVI image from the ADAR-5500 data overlaid onto an orthophoto-
quadrangle.
S.J. Walsh et al. / Geomorphology 53 (2003) 129–145142
research. The use of GISc to quantify spatial pattern
will also aid in parameterization, but may prove
more useful in validation given that many models
are not meant to reproduce exact matches of land-
forms (or ecotones) but only similar kinds, i.e.,
patterns.
Additionally, visualization becomes an integral
part of the research process. Scientific visualizations
in support of geomorphic studies may take many
forms, depending upon project goals and the nature
of the variable or variables to be examined. Varia-
tions to be visualized may occur in space, time,
and/or attribute. Whether the variable is spatially
discrete (e.g., sediment traps set out to capture
aeolian deposits at fixed locations) or spatially
continuous (e.g., elevation values secured from a
digital elevation model for the study area), or
temporally discrete (e.g., lithology) or temporally
continuous (e.g., soil moisture potential; point data
might be interpolated to create a continuous cover-
age) impacts the kinds of visualizations to be
applied and the type and complexity of data trans-
formation used to rectify differing data structures
and formats comprising the variables. Variables
might also be static, base variables (e.g., surficial
geology), or dynamic process variables (e.g., solar
radiation potential). Derived measures computed
within a GIS (e.g., surface roughness or distance
to an upwind barrier) might be calculated and
spatially referenced at a sediment trap location to
expand the dimensions of its attributes. These
variable conditions—space, time, and/or attribute—
might be viewed as orthogonal axes on which a
host of visualization approaches might be arrayed to
provide data views used as either part of the final
analysis or in generating additional hypotheses
through the consolidated visualization of formerly
disparate and disjointed data.
As we have shown, visualization of various forms
of data representing the extant landscape at different
scales can lead to new hypotheses. Visualization of
model results in three dimensions as animations of
data representing landscapes will also lead to new
insights about what models tell us and what they
miss. The future holds promise for more use of
visualization to open avenues for the study of spatial
relations through fieldwork and simulation modeling.
Animations of image change detections, image fly-
overs, rotations, and animated versions of cellular
automata are likely to produce new insights in the
future.
These techniques should lead to further refinement
of the Synthetic Alpine Slope model (Burns and
Tonkin, 1982) in which constraints on the processes
at a given slope, determined by patterns at greater
temporal and spatial scales (Malanson and Butler,
2002), can be incorporated more explicitly. For exam-
ple, the multiscale modeling advocated by Brown et
al. (1994) for vegetation patterns at the treeline
ecotone needs the input of geomorphic constraints,
but this approach could be adapted to modeling the
geomorphic processes as well. The combination of
patterns derived from GISc with mechanistic process
models leads to understanding processes within the
context of constraints imposed by broader scale top-
ography, geology, and the climate.
Acknowledgements
The USGS Biological Resources Division sup-
ported this work; special thanks go to our USGS PI,
Dan Fagre. David R. Butler acknowledges additional
funding in support of fieldwork described in this paper
from a Faculty Research Enhancement Grant from
Southwest Texas State University. George P. Malanson
acknowledges additional funding in support of model-
ing described in this paper from NSF grant SBR-
9714347. This research is a contribution of the
Mountain GeoDynamics Research Group. Graphics
were generated by Sean McKnight, Landscape Char-
acterization and Spatial Analysis Lab, University of
North Carolina.
References
Allen, T.R., 1995. Relationships between spatial pattern and envi-
ronment at the alpine treeline ecotone, Glacier National Park,
Montana. PhD dissertation, Univ. of North Carolina, Chapel
Hill.
Allen, T.R., Walsh, S.J., 1993. Characterizing multitemporal alpine
snowmelt patterns for ecological inferences. Photogrammetric
Engineering and Remote Sensing 59 (10), 1521–1529.
Allen, T.R., Walsh, S.J., 1996. Spatial composition and pattern
of alpine treeline, Glacier National Park, Montana. Pho-
togrammetric Engineering and Remote Sensing 62 (11),
1261–1268.
S.J. Walsh et al. / Geomorphology 53 (2003) 129–145 143
Becwar, M.R., Burke, M.J., 1982. Winter hardiness limitations and
physiography of woody timberline flora. In: Li, P.H., Sakai, A.
(Eds.), Plant Cold Hardiness and Freezing Stress: Mechanisms
and Crop Implications, vol. 2. Academic Press, New York,
pp. 307–323.
Bekker, M.F., Malanson, G.P., Alftine, K.J., Cairns, D.M., 2001.
Feedback and pattern in simulations of the alpine treeline eco-
tone. In: Millington, A.C., Walsh, S.J., Osborne, P.E. (Eds.),
Applications of GIS and Remote Sensing in Biogeography and
Ecology. Kluwer Academic Publishing, Dordrecht, The Neth-
erlands, pp. 123–138.
Brown, D.G., 1992. Topographical and biophysical modeling of
vegetation patterns at alpine treeline. PhD dissertation, Univ.
of North Carolina, Chapel Hill. 239 pp.
Brown, D.G., 1994a. Comparison of vegetation– topography rela-
tionships at the alpine treeline ecotone. Physical Geography 15,
125–145.
Brown, D.G., 1994b. Predicting vegetation types at treeline using
topography and biophysical disturbance. Journal of Vegetation
Science 5, 641–656.
Brown, D.G., Cairns, D.M., Malanson, G.P., Walsh, S.J., Butler,
D.R., 1994. Remote sensing and GIS techniques for spatial and
biophysical analyses of alpine treeline through process and em-
pirical models. In: Michener, W.K., Stafford, S., Brunt, J.
(Eds.), Environmental Information Management and Analysis:
Ecosystem to Global Scales. Taylor and Francis, Pennsylvania,
pp. 453–481.
Burns, S.F., Tonkin, P.J., 1982. Soil-geomorphic models and the
spatial distribution and development of alpine soils. In: Thorn,
C.E. (Ed.), Space and Time in Geomorphology. George Allen
and Unwin, London, pp. 25–43.
Butler, D.R., 1995. Zoogeomorphology—Animals as Geomorphic
Agents. Cambridge Univ. Press, Cambridge. 231 pp.
Butler, D.R., Walsh, S.J., 1990. Lithologic, structural, and topo-
graphic influences on snow-avalanche path location, Eastern
Glacier National Park, Montana. Annals of the Association of
American Geographers 80 (3), 362–378.
Butler, D.R., Walsh, S.J., 1994. Site characteristics of debris flows
and their relationship to alpine treeline. Physical Geography 15
(2), 181–199.
Butler, D.R., Malanson, G.P., Walsh, S.J., 1992. Snow-avalanche
paths: conduits from the periglacial–alpine to the subalpine–
depositional zone. In: Dixon, J.C., Abrahams, A.D. (Eds.), Peri-
glacial Geomorphology. Wiley, London, pp. 185–202.
Butler, D.R., Malanson, G.P., Wilkerson, F.D., Schmid, G.L., 1998.
Late Holocene sturzstroms in Glacier National Park, Montana,
U.S.A. In: Kalvoda, J., Rosenfeld, C. (Eds.), Geomorphological
Hazards in High Mountain Areas. Kluwer Academic Publishing,
Dordrecht, The Netherlands, pp. 149–166.
Cairns, D.M., 1997. Modeling controls on pattern at alpine treeline.
Geographical and Environmental Modelling 2, 37–56.
Cairns, D.M., Malanson, G.P., 1997. Examination of the carbon
balance hypothesis of alpine treeline location, Glacier National
Park, Montana. Physical Geography 18, 125–145.
Cairns, D.M., Malanson, G.P., 1998. Environmental variables in-
fluencing carbon balance at the alpine treeline ecotone: a mod-
eling approach. Journal of Vegetation Science 9, 679–692.
Carrara, P.E., 1990. Surficial Geologic Map of Glacier National
Park, Montana. USGS Map 1-1508-D, Miscellaneous Investiga-
tions Series.
Church, M., Ryder, J.M., 1972. Paraglacial sedimentation: a con-
sideration of fluvial processes conditioned by sedimentation.
Geological Society of America Bulletin 83, 3059–3072.
Kupfer, J.A., Cairns, D.M., 1996. The suitability of montane eco-
tones as indicators of global climatic change. Progress in Phys-
ical Geography 20, 253–272.
Leemans, R., 1989. Description and simulation of stand structure
and dynamics in some Swedish forests. Acta Universitatis Up-
saliensis 221, 1–69.
Malanson, G.P., 1997. Effects of feedbacks and seed rain on eco-
tone patterns. Landscape Ecology 12, 27–38.
Malanson, G.P., Butler, D.R., 1994. Competitive hierarchies, soil
fertility gradients, and the elevation of treeline in Glacier Na-
tional Park, Montana. Physical Geography 15, 166–180.
Malanson, G.P., Butler, D.R., 2002. The Western Cordillera. In:
Orme, A. (Ed.), The Physical Geography of North America.
Oxford Univ. Press, Oxford, UK.
Malanson, G.P., Xiao, N., Alftine, K., Bekker, M., Butler, D.R.,
Brown, D.G., Cairns, D.M., Daniel Fagre, D., Walsh, S.J.,
2000. Abiotic and biotic controls of spatial pattern at alpine
treeline. In: Parks, B.O., Clarke, K.M., Crane, M.P. (Eds.), In-
tegrating GIS and Environmental Modeling: Problems, Pros-
pects, and Needs for Research (GIS/EM4). CIRES/University
of Colorado, Boulder, 11 pp. on CD-ROM.
McNab, W.H., 1993. A topographic index to quantify the effect of
mesoscale landform on site productivity. Canadian Journal of
Forest Research 23, 1100–1107.
Meyer, P., Itten, K.I., Kellenberger, T., Sandmeier, S., Sandmeier,
R., 1993. Radiometric corrections of topographically induced
effects on Landsat TM data in an alpine environment. ISPRS
Journal of Photogrammetry and Remote Sensing 48, 17–28.
Renwick, W.H., 1992. Equilibrium, disequilibrium, and none-
quilibrium landforms in the landscape. Geomorphology 5,
265–276.
Rochefort, R.M., Little, R.L., Woodward, A., Peterson, D.L., 1994.
Changes in sub-alpine tree distribution in western North Amer-
ica: a review of climatic and other causal factors. Holocene 4,
89–100.
Walsh, S.J., Butler, D.R., 1997. Morphometric and multispectral
image analysis of debris flows for natural hazard assessment.
Geocarto International 12 (1), 9–17.
Walsh, S.J., Butler, D.R., Brown, D.G., Bian, L., 1990a. Carto-
graphic modeling of snow avalanche path location within Gla-
cier National Park, Montana. Photogrammetric Engineering and
Remote Sensing 56 (5), 615–621.
Walsh, S.J., Cooper, J.W., Von Essen, I.E., Gallager, K.R.,
1990b. Image enhancement of Landsat Thematic Mapper data
and GIS integration for evaluation of resource characteristics.
Photogrammetric Engineering and Remote Sensing 54 (8),
1135–1141.
Walsh, S.J., Malanson, G.P., Butler, D.R., 1992. Alpine treeline in
Glacier National Park, Montana. In: Janelle, D.G. (Ed.), Geo-
graphical Snapshots of North America. Guilford Press, New
York, pp. 167–171.
S.J. Walsh et al. / Geomorphology 53 (2003) 129–145144

Walsh, S.J., Butler, D.R., Allen, T.R., Malanson, G.P., 1994a. In-
fluence of snow patterns and snow avalanches and the alpine
treeline ecotone. Journal of Vegetation Science 5, 657–672.
Walsh, S.J., Butler, D.R., Brown, D.G., Bian, L., 1994b. Form and
pattern of alpine environments: an integrative approach to spa-
tial analysis and modelling in Glacier National Park, USA. In:
Heywood, D.I., Price, M.F. (Eds.), Mountain Environments and
GIS. Taylor and Francis, London, pp. 189–672.
Whipple, J.W., 1992. Geologic Map of Glacier National Park. US
Geological Survey Miscellaneous Investigations Series, Map I-
1508-F. US Geological Survey, Washington, DC.
S.J. Walsh et al. / Geomorphology 53 (2003) 129–145 145
Copyright © 2022 FDOKUMEN