Integration of Electrical Resistivity and Modified DRASTIC ...
Upload
khangminh22Category
view
2download
0
Studies of electrical properties of low-resistivity sandstones based on digital rocktechnology
Weichao Yan1 , Jianmeng Sun1,5, Jinyan Zhang2, Weiguo Yuan3,Li Zhang4, Likai Cui1 and Huaimin Dong1
1 School of Geosciences, China University of Petroleum, Qingdao 266580, People’s Republic of China2 Shengli Well Logging Company, SINOPEC, Dongying, 257015, People’s Republic of China3 Sinopec Exploration Company, Chengdu 610041, People’s Republic of China4Department of Resources and Civil Engineering, Shandong University of Science and Technology, Tai’an271019, People’s Republic of China
E-mail: [email protected]
Received 28 March 2017, revised 18 July 2017Accepted for publication 18 August 2017Published 18 January 2018
AbstractElectrical properties are important parameters to quantitatively calculate water saturation in oiland gas reservoirs by well logging interpretation. It is usual that oil layers show high resistivityresponses, while water layers show low-resistivity responses. However, there are low-resistivityoil zones that exist in many oilfields around the world, leading to difficulties for reservoirevaluation. In our research, we used digital rock technology to study different internal andexternal factors to account for low rock resistivity responses in oil layers. We first constructedthree-dimensional digital rock models with five components based on micro-computedtomography technology and x-ray diffraction experimental results, and then oil and waterdistributions in pores were determined by the pore morphology method. When the resistivity ofeach component was assigned, rock resistivities were calculated by using the finite elementmethod. We collected 20 sandstone samples to prove the effectiveness of our numericalsimulation methods. Based on the control variate method, we studied the effects of differentfactors on the resistivity indexes and rock resistivities. After sensitivity analyses, we found themain factors which caused low rock resistivities in oil layers. For unfractured rocks, influentialfactors arranged in descending order of importance were porosity, clay content, temperature,water salinity, heavy mineral, clay type and wettability. In addition, we found that the resistivityindex could not provide enough information to identify a low-resistivity oil zone by usinglaboratory rock–electric experimental results. These results can not only expand ourunderstandings of the electrical properties of low-resistivity rocks from oil layers, but also helpidentify low-resistivity oil zones better.
Keywords: electrical properties, low-resistivity oil zone, digital rock technology
(Some figures may appear in colour only in the online journal)
1. Introduction
Low-resistivity oil zones with high oil production have beenfound throughout the world, and the electrical properties oflow-resistivity sandstones from these layers receive much
interest because the remaining oil in pores is difficult to iden-tify by resistivity log analysis. A low-resistivity oil zone isdefined as an oil zone which is not significantly different fromthe water zone by using resistivity logging responses (Liuet al 2006). This phenomenon causes incorrect fluid identifi-cations, which calculates higher water saturations for oil layers.
Journal of Geophysics and Engineering
J. Geophys. Eng. 15 (2018) 153–163 (11pp) https://doi.org/10.1088/1742-2140/aa8715
5 Author to whom any correspondence should be addressed.
1742-2132/18/010153+11$33.00 © 2018 Sinopec Geophysical Research Institute Printed in the UK153
Dow
nloaded from https://academ
ic.oup.com/jge/article/15/1/153/5112921 by guest on 12 February 2022

This problem has been acknowledged for over 40 years,and the low-resistivity oil zones exist in many oilfields allover the world (Worthington 2000). The factors causingunfractured low-resistivity rocks from oil layers are compli-cated, which can be separated into two categories, includinginternal factors and external factors. Most researchers attrib-uted low-resistivity contrast to one or combination of factors,including irreducible water, shoulder bed effects, clay typeand content, high water salinity, heavy conductive minerals,and deep invasion by conductive muds (Palar and Sutiyono1997, Worthington 1997, Hamada and Al-Awad 2000,Saha 2003, Lubis et al 2016). In addition, wettability may beanother factor that causes low resistivities because wettabilityinfluences rock resistivity (Montaron 2007).
Due to the complexity of different factors, quantitativestudies of different factors on rock resistivities are not easy tobe performed by laboratory rock–electric experiments. As anadvanced numerical simulation method, the digital rocksimulation has been widely used in petrophysical propertiesanalyses (Blunt 2001, Arns and Meleán 2009, Peng et al2012). Traditional digital rock models contain two parts,including solid matrix and pores. This method can bewell-used in fluid flow numerical simulations because thepores dominate flow patterns, while it is not suitable forelectrical properties simulations because of the existence ofhigh conductive minerals in rocks. Therefore, it is necessaryto construct 3D digital rock models with different solidcomponents. However, due to complexity of rock compo-nents, it is difficult to identify different minerals only by usingmicro-computed tomography (micro-CT) technology.Another technique is needed to provide more information tocalibrate detailed descriptions of rock components. Mutinaand Bruyndonckx (2012) combined both micro-CT andmicro-x-ray fluorescence systems to obtain information onspatial distribution of chemical elements in a rock. QemS-CAN images determine the mineral phase at each individualvoxel, which can be extended to the full 3D digital rock space(Golab et al 2013). Although several researchers studied theeffects of some factors on rock electrical properties by usingdigital rock technology, they did not further investigate howthese factors caused low rock resistivity responses in oillayers.
In this study, we first clarified a more specific concept ofthe ‘low-resistivity oil zone’ by experimental results. Wecombined micro-CT, x-ray diffraction (XRD) and routinecore lab experiments to construct 3D digital rocks with dif-ferent components. Then we used the pore morphologymethod and finite element method (FEM) to simulate fluidsdistributions and rock electrical properties respectively. Theeffectiveness of our methods was verified by 20 sandstonesamples comparing both experimental rock–electric exper-imental results and simulation results. Seven influential fac-tors were studied, including temperature, wettability, watersalinity, heavy mineral, clay type, clay content and rockporosity. Finally, through sensitivity analyses, we found mainfactors causing low-resistivity oil zones.
2. Numerical simulation method and theory
2.1. 3D digital rock model generation
In order to employ the digital rock technology to study theelectrical properties of low-resistivity sandstones, construct-ing a 3D digital rock is the first step. The traditional digitalrock generation method separates rock samples in two parts,solid matrix and pores. This method is useful for dealing withfluid flow simulations because solid matrix has little influenceon flow properties. However, in order to study electricalproperties, it is vital to identify different mineral componentsin a rock.
Among 3D digital rock reconstruction techniques, micro-CT technology is widely used in the porous media analysis toinvestigate the real micro-structures of the rock samples.Although numerical simulations could extract the structuralinformation from two-dimensional slices, or from grain sizedistributions, micro-CT reconstruction method is much moreaccurate in characterizing different components and pores. Inour research, we combined CT images and XRD experimentalresults to generate 3D digital rock models of different rocksamples. The principle of multiple component segmentation isbased on the density differences of the mineral phases in agrayscale image of the rock sample (Halisch et al 2010). Ifone type of mineral has high density, such as pyrite, the grayvalue in the CT images will be high. It should be noted thatdue to the complex composition of different matters in rockmatrix, gray values of mineral phases are not specific values,leading to difficulties in performing accurate segmentations.However, it is not necessary to separate different componentsaccurately because the main purpose of our research is tostudy influential factors of the electrical properties of rocks.
Based on routine porosity results and XRD experimentalresults, we divided a rock sample into five components,including pores, quartz, feldspar, clay minerals and heavyminerals. The content of each component can be easilyacquired by using image segmentation. Figure 1 shows theanalyzed results of three sandstones and one mudstone, andthe porosities are 13.39%, 6.94%, 7.20% and 2.89% respec-tively. In addition, these rocks have different mineral contentsand pore size distributions. The first row color marks are theexplanations of different colors. In this figure, red componentrefers to pores, dark blue refers to quartz, light blue refers tofeldspar, brown refers to clay minerals and green refers toheavy minerals. 3D digital rocks after segmentations areshown in the second row. The third row images are thinsections, which are selected in the middle of 3D digital rocks.Size information is illustrated below, and the resolution ofeach voxel is 6.55 μm.
2.2. Electrical simulation methods
Low-resistivity rocks may contain different types of fluidsand contents, therefore, it is important to determine fluiddistributions in pores before electrical simulations. In ourresearch, we used pore morphology method to simulate oiland water distributions in pores under different water
154
J. Geophys. Eng. 15 (2018) 153 W Yan et al
Dow
nloaded from https://academ
ic.oup.com/jge/article/15/1/153/5112921 by guest on 12 February 2022

saturations in a digital rock which was constructed from x-rayCT images. The main algorithm of this method is an openmorphology algorithm, which is expressed by:
A B A B B, 1= Å ( ) ( )
where both A and B are data sets. For set A, the open operation isan iteration of erosion by set B firstly and then follows a dilationcalculation by set B. Erosion and dilation are two basic opera-tions in mathematical morphology (Haralick et al 1987). Thisprocess is repeated until the program reaches to the maximumiteration. The water saturation value after each iteration can becalculated by counting voxels of different phases.
After determining different fluid distributions, we usedthe electrical simulation methods to acquire rock resistivitiesunder different water saturations. As an advanced electrical
simulation method, FEM is often used to simulate rockresistivity. The data file of a digital rock model is a hugematrix, which consists of lots of voxels. We applied anelectrical field between two opposite faces of the digital rockmodel, and the voltage distribution of each voxel determinesthe whole model energy. The effective resistivity of thismodel is determined by solving the problem of minimizingthe system energy. In our research, the periodic boundaryconditions were set as the restrictive condition of the calcul-ation. Ideally, the energy gradient with respect to the variablesof the voltage is zero. We defined a stopping criterion ofC=1×10⁻⁷, and the simulation stopped when the normsquared of the gradient vector was less than C. The detaileddescriptions of the pore morphology method and FEM can befound in Liu et al (2009) and Garboczi (1998).
Figure 1. Constructed 3D digital rock models based on x-ray CT images and XRD results; (a)–(c) are images of three sandstones, whileimage (d) belongs to a mudstone.
155
J. Geophys. Eng. 15 (2018) 153 W Yan et al
Dow
nloaded from https://academ
ic.oup.com/jge/article/15/1/153/5112921 by guest on 12 February 2022

When we performed this simulation method on a digitalrock, resistivity of each component was manually assigned asan input parameter. In our research, six components should beconsidered, including oil, water, quartz, feldspar, clayminerals and heavy minerals. We assumed that the resistiv-ities of quartz, feldspar and oil were infinite and resistivitiesof other components were calculated based on temperature orcation exchange capacity (CEC, mol/100 g). The resistivityof clay was calculated by the total resistivity of each claymineral. The percentages of clay minerals were measured byXRD experiments, and clay minerals’ resistivities (Rclay, Ωm)were calculated by combining table 1 and equation (2):
RB
CEC 1, 2clay
t
t G
ff r
=-( )
( )
where ft is the total porosity of the rock, decimal; ρG is theaverage grain density, g cm−3; and B is the equivalent ionicconductance of clay exchange cations, which can be obtainedby the methods described in Dacy and Martin (2006). Thisparameter is related to the temperature, which means if thetemperature changes, clay resistivity will be changed.
Heavy minerals in sandstone samples have a wide rangeof resistivities, such as zircon (44 Ωm), tourmaline(109Ωm), garnet (107Ωm), leucosphenite (103Ωm), mag-netite (10−3 Ωm) and pyrite (10−3Ωm). Although it is hardto separate different heavy minerals, mineral contents can beobtained by XRD experimental results.
In order to study effects of the water salinity and thetemperature on rock resistivity, we set the input water resis-tivity value by using the following equations:
RC
T
1
2.74 100.0123
81.77
1.8 38.77, 3
w1 4w0.955
1
=´ ´
+
´+
-
⎛⎝⎜
⎞⎠⎟
⎛⎝⎜
⎞⎠⎟ ( )
R RT
T
1.8 39
1.8 39, 4w2 w1
1
2= ⋅
++
( )
where Cw is the water salinity, mg l −1; T1 is the first temp-erature value, °C; T2 is the second temperature value, °C; Rw1
the first water resistivity value, Ωm; Rw2 is the second waterresistivity value, Ωm.
3. Results and discussion
3.1. A more specific concept of a low-resistivity oil zone
Some researchers have tried to identify the low-resistivity oilzone quantitatively, and they believe that the resistivity oilzone has a resistivity index (I) smaller than two (Liuet al 2006). However, we regard the ‘low-resistivity oil zone’as a relative concept, and it is unwise to use a resistivity indexvalue to characterize an oil zone. Although a small resistivityindex means low resistivity theoretically, small resistivityindexes calculated by either well log interpretations orlaboratory rock–electric experimental results cannot deter-mine fluid types in rocks.
In order to prove our concept, we conducted laboratoryrock–electric experiments on two sandstones, which wereNo.1 and No.2 respectively. The water resistivity was0.48Ωm. Resistivity index was calculated by Archie’sequation, revealing the relationship between rock resistivityand water saturation (Archie 1942).
R
R
b
SRI , 5n
t
0 w
= = ( )
where Rt is the true resistivity of the rock sample; R0 is theresistivity of the water saturated rock; b is a lithology coef-ficient; Sw is the water saturation and n is the saturationexponent. Figure 2 shows the experimental results of tworocks. It is indicated that the resistivity index of No. 1 (1.79)is higher than No. 2 (1.62), however, the rock resistivity ofNo. 1 is nearly a half of No. 2 under the same water satur-ation. If No. 2 is obtained from a water layer, then it will bedifficult to determine fluid types of No. 1 by resistivity log-ging responses. Therefore, laboratory rock–electric experi-ments of at least two sandstone samples are necessary forjudging a low-resistivity oil zone, and resistivity index cannotprovide accurate information.
3.2. Validations of our electrical properties simulation method
Although some researchers had proved the effectiveness ofusing FEM to calculate electrical properties (e.g., Jianget al 2011, Zhao et al 2013, Nie et al 2016), they divided adigital rock model into three parts, ignoring the influence ofclay and heavy minerals. Based on routine core analyses andXRD experimental results, percentage of each phase can beobtained. We collected 20 sandstone samples from Xihudepression and performed both laboratory experiments andnumerical simulations. Following representative elementaryvolume analysis, a sub-volume of digital rock with a size of300×300×300 voxels was segmented for each sandstonesample. These sub-volume digital rocks were selected in themiddle of 3D digital rocks. Measured porosities of these rockswere ranging from 5.85% to 15.47%, and the average porositywas 10.39%.
The input resistivity parameters for simulations weretried to be consistent with actual values. We compared thesaturation exponent values (n) in equation (5) of bothlaboratory rock–electric experiments results and simulation
Table 1. CEC of each clay mineral.
Clay mineral CEC range (mol/100 g) Mean CEC (mol/100 g)
Chlorite 10–40 25Illite 10–40 25Kaolinite 3–15 9Smectite 80–150 115
156
J. Geophys. Eng. 15 (2018) 153 W Yan et al
Dow
nloaded from https://academ
ic.oup.com/jge/article/15/1/153/5112921 by guest on 12 February 2022
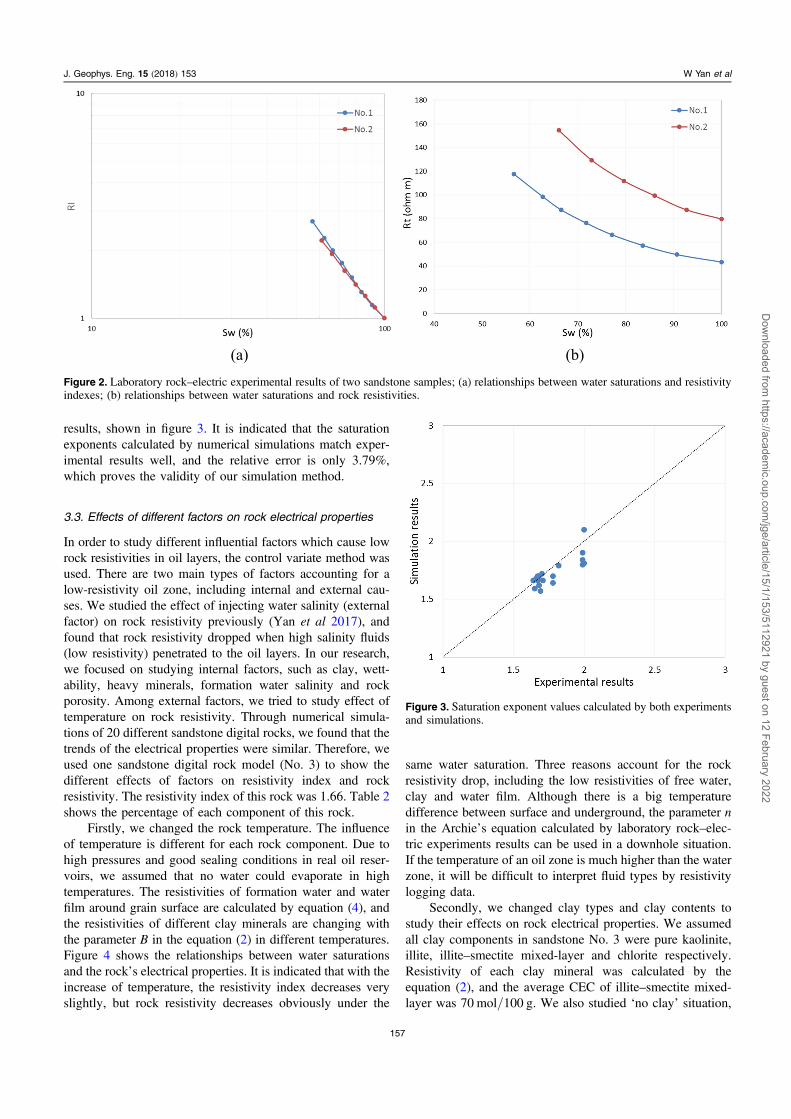
results, shown in figure 3. It is indicated that the saturationexponents calculated by numerical simulations match exper-imental results well, and the relative error is only 3.79%,which proves the validity of our simulation method.
3.3. Effects of different factors on rock electrical properties
In order to study different influential factors which cause lowrock resistivities in oil layers, the control variate method wasused. There are two main types of factors accounting for alow-resistivity oil zone, including internal and external cau-ses. We studied the effect of injecting water salinity (externalfactor) on rock resistivity previously (Yan et al 2017), andfound that rock resistivity dropped when high salinity fluids(low resistivity) penetrated to the oil layers. In our research,we focused on studying internal factors, such as clay, wett-ability, heavy minerals, formation water salinity and rockporosity. Among external factors, we tried to study effect oftemperature on rock resistivity. Through numerical simula-tions of 20 different sandstone digital rocks, we found that thetrends of the electrical properties were similar. Therefore, weused one sandstone digital rock model (No. 3) to show thedifferent effects of factors on resistivity index and rockresistivity. The resistivity index of this rock was 1.66. Table 2shows the percentage of each component of this rock.
Firstly, we changed the rock temperature. The influenceof temperature is different for each rock component. Due tohigh pressures and good sealing conditions in real oil reser-voirs, we assumed that no water could evaporate in hightemperatures. The resistivities of formation water and waterfilm around grain surface are calculated by equation (4), andthe resistivities of different clay minerals are changing withthe parameter B in the equation (2) in different temperatures.Figure 4 shows the relationships between water saturationsand the rock’s electrical properties. It is indicated that with theincrease of temperature, the resistivity index decreases veryslightly, but rock resistivity decreases obviously under the
same water saturation. Three reasons account for the rockresistivity drop, including the low resistivities of free water,clay and water film. Although there is a big temperaturedifference between surface and underground, the parameter nin the Archie’s equation calculated by laboratory rock–elec-tric experiments results can be used in a downhole situation.If the temperature of an oil zone is much higher than the waterzone, it will be difficult to interpret fluid types by resistivitylogging data.
Secondly, we changed clay types and clay contents tostudy their effects on rock electrical properties. We assumedall clay components in sandstone No. 3 were pure kaolinite,illite, illite–smectite mixed-layer and chlorite respectively.Resistivity of each clay mineral was calculated by theequation (2), and the average CEC of illite–smectite mixed-layer was 70 mol/100 g. We also studied ‘no clay’ situation,
Figure 2. Laboratory rock–electric experimental results of two sandstone samples; (a) relationships between water saturations and resistivityindexes; (b) relationships between water saturations and rock resistivities.
Figure 3. Saturation exponent values calculated by both experimentsand simulations.
157
J. Geophys. Eng. 15 (2018) 153 W Yan et al
Dow
nloaded from https://academ
ic.oup.com/jge/article/15/1/153/5112921 by guest on 12 February 2022

which means the resistivity of clay was infinite. Numericalsimulation results of rock electrical properties are shown infigure 5. It is obvious that clay has great effect on rockelectrical properties. On one hand, the existence of claydecreases both resistivity index and rock resistivity. On theother hand, illite–smectite mixed-layer has the greatestinfluence on resistivity. Clay with a higher CEC has a lowerparameter n and a lower rock resistivity value. Then, westudied the effects of clay contents on rock electrical prop-erties. We assumed all clays were pure illite, and constructed
clays around pores by random generations, replacing solidvoxels. The generated clay contents were 0%, 3.95%, 7.26%and 16.86% respectively. Numerical simulation results ofrock electrical properties are shown in figure 6. We can seethat with the increase of clay content, both resistivity indexand rock resistivity decrease greatly. Therefore, high claycontents can cause low resistivity in oil layers. If an oil layercontains both high percentage of clay and high CEC, theresistivity contrast between an oil layer and a water layer willbe low.
Table 2. Percentage of each component of sandstone No.3.
Component Pore Illite–smectite Illite Kaolinite Chlorite Quartz Feldspar Heavy minerals
Content (%) 12.71 0.16 1.38 0.24 2.17 54.74 28.21 0.39
Figure 4. Effects of temperatures on rock electrical properties; (a) relationships between water saturations and resistivity indexes,(b) relationships between water saturations and rock resistivities.
Figure 5. Effects of clay minerals on rock electrical properties; (a) relationships between water saturations and resistivity indexes,(b) relationships between water saturation and rock resistivities.
158
J. Geophys. Eng. 15 (2018) 153 W Yan et al
Dow
nloaded from https://academ
ic.oup.com/jge/article/15/1/153/5112921 by guest on 12 February 2022

Then the effects of heavy minerals on electrical proper-ties were analyzed. Due to the large scale of resistivities ofdifferent heavy minerals, we regarded pure garnet (highresistivity), zircon (medium resistivity) and pyrite (lowresistivity) as heavy minerals respectively to perform num-erical simulations. The simulation results are shown infigure 7, which indicates that only heavy minerals with lowresistivity have great influence on rock electrical properties.Both resistivity index and rock resistivity decrease with theincrease of heavy mineral conductivity. Low content ofpyrite can lead to low rock resistivity, therefore, we believehigh percentage of pyrite decreases rock resistivity drama-tically. For interpreting oil or water layers, heavy mineralsare quite useful clues. When low-resistivity heavy mineralsin reservoirs are abundant, they may cause a low-resistivityoil zone.
Formation original water salinity was also regarded as animportant factor that causes low rock resistivity. We setsalinity of water as 1000 mg l−1, 5000 mg l−1, 10 000 mg l−1,50 000 mg l−1 and 100 000 mg l−1 respectively. By usingequation (3), input water resistivities can be calculated.Figure 8 shows the relationships between water saturationsand rock electrical properties. We can see that with theincrease of water salinity, resistivity index increases, whilerock resistivity decreases. High salinity irreducible or freeformation water strengthens current field, leading to low-resistivity responses in well logging data.
Most sandstone reservoirs tend to be water wet orintermediate-wet, and water forms a film between pores andsolid matrix. Although several researchers proved that rockwettability influenced resistivity by using digital rock tech-nology (Liu et al 2009, Jiang et al 2011), their models were
Figure 6. Effects of clay contents on rock electrical properties; (a) relationships between water saturations and resistivity indexes,(b) relationships between water saturation and rock resistivities.
Figure 7. Effects of heavy minerals on rock electrical properties; (a) relationships between water saturations and resistivity indexes,(b) relationships between water saturations and rock resistivities.
159
J. Geophys. Eng. 15 (2018) 153 W Yan et al
Dow
nloaded from https://academ
ic.oup.com/jge/article/15/1/153/5112921 by guest on 12 February 2022

constructed by using electro-insulating solid matrix and fluidphases. In addition, it is necessary to study if wettability playsa significant role in causing low resistivity. Based on thedescriptions by Liu et al (2009), five water film conductivitieswere chosen as 0 S m−1 (oil wet), 0.02 S m−1, 0.04 S m−1,0.08 S m−1 and 0.16 S m−1 respectively in our research.Figure 9 shows the results of different wettabilities on elec-trical properties. Although water wet rocks have lowerresistivity indexes and rock resistivities than oil wet rocks, itis difficult to form low-resistivity oil zones.
Core experiments of rocks in a low-resistivity oil zoneusually show low porosity results, and then someresearchers may think low porosity is a key factor foridentifying oil zone which cannot be interpreted by resis-tivity well logging techniques. We used our methods toprove if low porosity caused low rock resistivity. Twenty
sandstone digital rock samples were not used because oftheir small range of porosities and different clay contents.We used a process-based method (Bryant and Blunt 1992) toconstruct rock models with different porosities. Figure 10shows the 3D images of these rocks, including 5.0%, 10.0%,15.0%, 20.0%, 25.0% and 30.0% respectively. Red repre-sents pores and blue represents solid matrix. Figure 11shows electrical properties of these rock models. With theincrease of porosity, water saturated rock resistivity (R0) isdecreasing following the Archie’s equation. However, rockresistivity is also decreasing, which is inconsistent withthe traditional concept. From our simulation results, wecan conclude that the resistivities of oil layers with highporosities may be much lower than the low porosity waterlayers. In order to explain this difference between laboratoryobservations and our simulation conclusions, we studied the
Figure 8. Effects of water salinity on rock electrical properties; (a) relationships between water saturations and resistivity indexes,(b) relationships between water saturations and rock resistivities.
Figure 9. Effects of wettability on rock electrical properties; (a) relationships between water saturations and resistivity indexes,(b) relationships between water saturations and rock resistivities.
160
J. Geophys. Eng. 15 (2018) 153 W Yan et al
Dow
nloaded from https://academ
ic.oup.com/jge/article/15/1/153/5112921 by guest on 12 February 2022

relationships between experimental measured porosities andshale contents of an actual oil well, shown in figure 12. It isobvious that with the increase of porosity, clay contentdecreases. In order to study the effect of rock porosity on
electrical properties, we ignored clay minerals in digital rockmodels. Our results change the traditional concept about theeffect of porosity on resistivity. We have proved that withthe increase of clay content, rock resistivity decreases.
Figure 10. Constructed 3D digital rock models with different porosities; (a) 5.0%; (b) 10.0%; (c) 15.0%; (d) 20.0%; (e) 25.0%; (f) 30.0%.
Figure 11. Resistivity properties of constructed rocks; (a) relationships between rock porosities and R0; (b) relationships between watersaturation and rock resistivities.
161
J. Geophys. Eng. 15 (2018) 153 W Yan et al
Dow
nloaded from https://academ
ic.oup.com/jge/article/15/1/153/5112921 by guest on 12 February 2022

Therefore, it is not low porosity but clay content that causesa low-resistivity oil zone.
After studies of seven possible factors which may causelow-resistivity oil zones, it is necessary to find out the mainfactors. Sensitivity analyses can be used to select main factorsof altering rock resistivities. In this paper, the Morrisscreening method (Lenhart et al 2002) was used to determinemain factors. It used sensitivity index, which was expressedby:
sY Y Y
P Pn
1001 , 6
i
ni i
i i0
11 0
1å=
--
-=
-+
+
( )( )
( ) ( )
where s is the sensitivity index; Yi is the ith output value; Yi+1
is the (i+1)th output value; Y0 is the initial value; Pi is thepercentage change between ith output value and initial value;Pi+1 is the percentage change between (i+1)th output valueand initial value; n is the number of calculations.
Higher s means higher sensitivity, and sensitivity degreesof different factors are classified as follows: |s| � 1 meansvery high sensitivity parameter; 0.2�|s| < 1 means highsensitivity parameter; 0.05�|s| < 0.2 means medium sen-sitivity parameter; 0�|s| < 0.05 means small to negligiblesensitivity parameter. Figure 13 shows the results of sensi-tivities of different factors that cause a low-resistivity oilzone. The following influential factors are arranged in thedescending order of importance: porosity, clay content,temperature, water salinity, heavy mineral, clay type andwettability. In order to identify low-resistivity oil layers,comparisons of these factors between different layers shouldbe taken into consideration.
4. Conclusions
The effects of internal and external factors on rock resistiv-ities are intensively explored by using digital rock technol-ogy. The 3D digital rock models are constructed with fivecomponents, including pores, quartz, feldspar, clay mineralsand heavy minerals. The electrical properties of rocks arestudied using the pore morphology method and FEM.According to the experimental and numerical simulationresults, the results show that the low-resistivity oil zone is arelative concept, and it is necessary to perform laboratoryexperiments on at least two rock samples from different layersto judge an oil layer. Different factors have different effectson rock electrical properties. Through sensitivity analyses, webelieve the influential factors arranged in the descendingorder of importance are porosity, clay content, temperature,water salinity, heavy mineral, clay type and wettability. Ourresults explain the possible reasons of low rock resistivityresponses in oil layers by quantitative analyses, which help toimprove the low-resistivity oil zone identification andevaluation.Figure 12. Relationships between rock porosities and shale contents.
Figure 13. Sensitivity analyses of different factors that cause a low-resistivity oil zone.
162
J. Geophys. Eng. 15 (2018) 153 W Yan et al
Dow
nloaded from https://academ
ic.oup.com/jge/article/15/1/153/5112921 by guest on 12 February 2022

Acknowledgments
This work was supported in part by the National Science andTechnology Major Project (No. 2016ZX05006002-004),Fundamental Research Funds for the Central Universities(No.16CX06049A) and and National Science Foundation forYoung Scientists of China (No. 41704113).
ORCID iDs
Weichao Yan https://orcid.org/0000-0002-3605-9210
References
Archie G E 1942 The electrical resistivity log as an aid indetermining some reservoir characteristics Trans. Am. Inst.Mech. Eng. 146 54–62
Arns C H and Meleán Y 2009 Accurate simulation of NMRresponses of mono-mineralic carbonate rocks using xray-CTimages SPWLA 50th Annual Logging Symp. (Texas)
Blunt M J 2001 Flow in porous media — pore network models andmultiphase flow Curr. Opin. Colloid Interface Sci. 6 197–207
Bryant S and Blunt M 1992 Prediction of relative permeability insimple porous media Phys. Rev. A 4 2004–12
Dacy J and Martin P 2006 Practical advances in core-based watersaturated analysis of shaly tight gas sand Int. Symp. of theSociety of Core Analysts (Texas)
Garboczi E J 1998 Finite element and finite difference programs forcomputing the linear electric and elastic properties of digitalimages of random materials NIST Interagency ReportNISTIR 6269
Golab A, Ward C R, Permana A, Lennox P and Botha P 2013 High-resolution three-dimensional imaging of coal using microfocusx-ray computed tomography, with special reference to modesof mineral occurrence Int. J. Coal Geol. 113 97–108
Halisch M, Müller C and Hübner W 2010 General identification andcharacterization of rock-forming minerals in CT images HighResolution X-ray CT Symp. (Dresden)
Hamada G M and Al-Awad M N J 2000 Petrophysical evaluation oflow resistivity sandstone reservoirs J. Can. Petrol. Technol. 397–14
Haralick R M, Sternberg S R and Zhuang X 1987 Image analysisusing mathematical morphology IEEE Trans. Pattern Anal.Mach. Intell. 4 532–50
Jiang L, Sun J, Liu X and Wang H 2011 Study of different factorsaffecting the electrical properties of natural gas reservoir rocksbased on digital cores J. Geophys. Eng. 8 366–71
Lenhart T, Eckhardt K, Fohrer N and Frede H G 2002 Comparisonof two different approaches of sensitivity analysis Phys. Chem.Earth 27 645–54
Liu S, Liu J, Li H and Zhou Y 2006 Definition and classification oflow-resistivity oil zones J. China Univ. Min. Techol. 16228–32
Liu X, Sun J and Wang H 2009 Numerical simulation of rockelectrical properties based on digital cores Appl. Geophys. 61–17
Lubis L A, Ghosh D P and Hermana M 2016 Elastic and electricalproperties evaluation of low resistivity pays in Malay Basinclastics reservoirs IOP Conf. Ser.: Earth Environ. Sci. 38012004
Montaron B 2007 A quantitative model for the effect of wettabilityon the conductivity of porous rocks 15th SPE Middle East Oil& Gas Show and Conf. (Bahrain)
Mutina A and Bruyndonckx P 2012 Micro-CT/micro-XRF study ofreservoir rocks: examination of technique applicability for coreanalysis Micro-CT Meeting (Wallonia)
Nie X, Zou C, Li Z, Meng X and Qi X 2016 Numerical simulation ofthe electrical properties of shale gas reservoir rock based ondigital core J. Geophys. Eng. 13 481–90
Palar S and Sutiyono S 1997 Approaches in evaluating low-resistiveformations 1997 SPE Asia Pacific Oil and Gas Conf. (KualaLumpur)
Peng S, Hu Q, Dultz S and Zhang M 2012 Using x-ray computedtomography in pore structure characterization for a Bereasandstone: resolution effect J. Hydrol. 472–473 254–61
Saha S 2003 Low-resistivity pay (LRP): ideas for solution 27thAnnual SPE Int. Conf. and Exhibition (Abuja)
Worthington P F 1997 Recognition and development of low-resistivity pay 1997 SPE Asia Pacific Oil and Gas Conf.(Kuala Lumpur)
Worthington P F 2000 Recognition and evaluation of low-resistivitypay Petrol. Geosci. 6 77–92
Yan W, Sun J, Zhang J, Golsanami N and Hao S 2017 A novelmethod for estimation of remaining oil saturations in water-flooded layers Interpretation- J. Sub. 5 9–23
Zhao J, Sun J, Liu X, Chen H and Cui L 2013 Numerical simulationof the electrical properties of fractured rock based on digitalrock technology J. Geophys. Eng. 10 055009
163
J. Geophys. Eng. 15 (2018) 153 W Yan et al
Dow
nloaded from https://academ
ic.oup.com/jge/article/15/1/153/5112921 by guest on 12 February 2022
Copyright © 2022 FDOKUMEN