Deformation bands in porous sandstones - Bergen Open ...
153
Deformation bands in porous sandstones their microstructure and petrophysical properties Anita Torabi Dissertation for the degree Philosophiae Doctor (PhD) Department of Earth Science University of Bergen 2008
-
Upload
khangminh22 -
Category
Documents
-
view
2 -
download
0
Transcript of Deformation bands in porous sandstones - Bergen Open ...

Deformation bands in porous sandstonestheir microstructure and petrophysical properties
Anita Torabi
Dissertation for the degree Philosophiae Doctor (PhD)
Department of Earth Science
University of Bergen
2008

2

ContentsPreface……………………………………………………………………………..5
Acknowledgements………………………………………………………………..7
Abstract……………………………………………………………………………9
Introduction……………………………………………………………….………11
Paper 1……………………………………………………………………………25
Torabi, A., Braathen, A., Cuisiat, F., and Fossen, H., 2007. Shear zones in
porous sand: Insights from ring-shear experiments and naturally deformed
sandstones. Tectonophysics, 437, 37-50.
Paper 2……………………………………………………………………………41
Rotevatn, A., Torabi, A., Fossen, H., and Braathen, A., 2007. Slipped
deformation bands: a new type of cataclastic deformation bands in
Western Sinai, Suez Rift, Egypt. Accepted, Journal of Structural Geology.
Paper 3……………………………………………………………………………83
Torabi, A., Fossen, H., and Alaei, B., 2007. Application of spatial correlation
functions in permeability estimation of small-scale deformation bands in
porous rocks. In press, Journal of Geophysical Research (Solid Earth).
Paper 4……………………………………………………………………..........111
Torabi, A., and Fossen, H., 2007. Spatial variation of microstructure and
petrophysical properties of deformation bands. Under review in Jounal of
Structural Geology.
Synthesis………………………………………………………………………..137
Appendix………………………………………………………………………..149
3

4

PhD dissertation, A. Torabi, 2007
Preface
The work presented in this dissertation was carried out in my PhD project. The
project started in April 2005 at the Centre for Integrated Petroleum Research (CIPR),
Department of Earth Science; University of Bergen (UiB). My PhD project has been a
part of the "Fault Facies" project at CIPR. The Fault Facies project is a multi-
disciplinary petroleum research project which aims to improve the implementation of
faults in 3D geological reservoir models. The project has several different themes, one of
which is focused on the micro-scale deformation structures known as deformation bands,
which form during the process of fault initiation and also damage-zone development.
This theme was developed in my PhD project, where the main concern was to increase
our understanding of the microstructure and petrophysical properties of deformation
bands and to investigate their effect on petrophysical characteristics of sandstone
reservoirs.
This dissertation comprises four separate and complementary parts:
Part one (Introduction): This part describes the "state of the art" for deformation bands
and their development, states the objectives of the research I conducted , and describes
the relation between the four scientific papers that make up the main body of the thesis.
Part two (papers): The second part, which is the main outcome of my study, is a
collection of four research papers, of which the first has already been published, and the
second has been accepted for publication and the third is in review in an international
journal. The fourth paper will soon be submitted.
The four papers included are:
Paper 1: Torabi A., Braathen, A., Cuisiat, F., and Fossen, H., 2007. Shear zones in
porous sand: Insights from ring-shear experiments and naturally deformed sandstones.
Tectonophysics, 437, 37-50.
This paper presents an analysis of analogue experimental modeling of shear zones based
on original ring-shear experiments. It includes microscopic study of both experimental
shear zones and natural deformation bands. The result of this study was also presented in
Petroleum Geoscience Collaboration Conference, 24th -25th October 2006, The
Geological Society, Burlington House, London.
5

PhD dissertation, A. Torabi, 2007
Paper 2: Rotevatn, A., Torabi, A., Fossen, H., and Braathen, A., 2007. Slipped
deformation bands: a new type of cataclastic deformation bands in Western Sinai, Suez
Rift, Egypt. Accepted, Journal of Structural Geology.
The second paper describes a new type of cataclastic deformation band. This study
reports original field outcrop study, optical microscopy and laboratory measurements.
Paper 3: Torabi, A., Fossen, H., and Alaei, B., 2007. Application of spatial correlation
functions in permeability estimation of small-scale deformation bands in porous rocks.
In review, Journal of Geophysical Research (Solid Earth).
Paper 4: Torabi, A., and Fossen, H., 2007. Spatial variation of microstructure and
petrophysical properties of deformation bands. To be submitted to Journal of Structural
Geology.
The third and the fourth papers comprise a detailed study of the microstructure of all
types of deformation bands and an estimation of their petrophysical properties using an
image processing method developed through this study. These works were presented in
Winter Conference, 8th -10th January 2007, Stavanger, Organized by Geological Society
of Norway, and also in StatoilHydro International Student Conference, 9th – 13th October
2007, StatoilHydro Research Center, Trondheim, Norway.
Part three (Synthesis): This part provides a synthesis of the results obtained at different
parts of the study. It includes a brief discussion, and also addresses limitations of the
different approaches applied in the conducted research. Some suggestions for future
work are also included in this part.
Part four (Appendix): The last part contains the MATLAB program that was written to
calculate the one- and two-point spatial correlation functions and specific surface area of
the pore-grain interface from backscatter images of faulted sandstones.
Anita Torabi December, 2007
6

PhD dissertation, A. Torabi, 2007
Acknowledgements
My PhD project was a part of a larger CIPR research initiative called “Fault
Facies” which was financed by the Norwegian Research Council (NRC), Statoil (now
StatoilHydro) and Conoco-Philips. I would like to express my gratitude to all of my
supervisors: Alvar Braathen for his encouragement and scientific discussions, and Arne
Skauge, William Helland-Hansen and Fabrice Cuisiat for their support and useful
comments. I would especially like to thank Haakon Fossen for his continuous guidance
and generosity. His motivating comments and inspiration was crucial during my PhD
project. I would also like to thank Egil Sev. Erichsen for his assistance with the
Scanning Electrone Microscope. Jan Tveranger is acknowledged for sharing his
knowledge and experience. I would like to thank Tore Skar for good collaboration
during working at CIPR and also for his encouragement. Walter Wheeler is also
appreciated for reviewing the introduction and synthesis parts of this dissertation. I
would like to take the opportunity to express my appreciation to the administrations at
the Earth Science Department and CIPR. Special thanks to Irene Huse who was always
helpful when, in several crucial moments in my study, I was beset with computer-related
problems. I am grateful to many friends and colleagues. I am indebted to my husband
Behzad Alaei who has always been supportive and sympathetic and to my two lovely
and intelligent children, my son Armin and my daughter Arezo, who were supportive
and patient enough to tolerate the hard life of having a PhD student as mother. They
sometimes participated in the scientific discussions at home and now after almost 3
years, they know these tiny, neat phenomena known as deformation bands very well. I
would like to dedicate my thesis to my family for their love and support.
7

8

PhD dissertation, A. Torabi, 2007
Abstract
Deformation bands are commonly thin tabular zones of crushed or reorganized grains
that form in highly porous rocks and sediments. Unlike a fault, typically the slip is
negligible in deformation bands. In this dissertation the microstructure and
petrophysical properties of deformation bands have been investigated through
microscopy and numerical analysis of experimental and natural examples. The
experimental work consists of a series of ring-shear experiments performed on porous
sand at 5 and 20 MPa normal stresses and followed by microscopic examination of thin
sections from the sheared samples. The results of the ring-shear experiments and
comparison of them to natural deformation bands reveals that burial depth (level of
normal stress in the experiments) and the amount of shear displacement during
deformation are the two significant factors influencing the mode in which grains break
and the type of shear zone that forms. Two end-member types of experimental shear
zones were identified: (a) Shear zones with diffuse boundaries, which formed at low
levels of normal stress and/or shear displacement; and (b) Shear zones with sharp
boundaries, which formed at higher levels of normal stress and/or shear displacement.
Our interpretation is that with increasing burial depth (approximately more than one
kilometer, simulated in the experiments by higher levels of normal stress), the
predominant mode of grain fracturing changes from flaking to splitting; which facilitates
the formation of sharp-boundary shear zones. This change to grain splitting increases the
power law dimension of the grain size distribution (D is about 1.5 in sharp boundary
shear zones). Based on our observations, initial grain size has no influence in the
deformation behavior of the sand at 5 MPa normal stresses.
A new type of cataclastic deformation band is described through outcrop and
microscopic studies; here termed a "slipped deformation band". Whereas previously-
reported cataclastic deformation bands are characterized by strain hardening, these new
bands feature a central slip surface, which indicates late strain softening. They lack the
characteristic compaction envelop, and are typified by higher porosity and lower
permeability than previously-described cataclastic deformation bands. Intense
background fracturing of the host rock and significant initial porosity are considered to
be important in creating these newly-discovered deformation bands.
In a related study, we investigate, for millimeter- wide deformation bands, the scale
limitation inherent in laboratory measurements of porosity and permeability. The scale
9

PhD dissertation, A. Torabi, 2007
limitations imposed by the deformation band relative to the physical sample size
motivated us to develop a new method for determining porosity and permeability based
on image processing. While plug measurements measure the effective permeability
across a 25.4 mm (1 inch) long sample, which includes both host rock and deformation
band, the method presented here provides a means to estimate porosity and permeability
of deformation band on microscale. This method utilizes low-order (one- and two-
orders) spatial correlation functions to analyze high-resolution, high-magnification
backscatter images, to estimate the porosity and specific surface area of the pore-grain
interface in the deformed sandstones. Further, this work demonstrates the use of a
modified version of the Kozeny-Carmen relation to calculate permeability by using
porosity and specific surface area obtained through the image processing. The result
shows that permeability difference between the band and the host rock is up to four
orders of magnitude. Moreover, the porosities and permeabilities estimated from image
processing are lower than those obtained from their plug measurements; hence the
traditional laboratory measurements have been overestimating permeability because of
the previously-unrecognized scale problem. In addition, the image processing results
clearly show that, as a result of microstructural variation, both porosity and permeability
vary along the length of individual deformation bands, with permeability variations of
up to two orders of magnitude. Such petrophysical variations are found in several types
of deformation bands (disaggregation, cataclastic and dissolution bands), but the range
depends on the deformation mechanisms, in particular on the degree of (i) cataclasis, (ii)
dissolution in cataclastic and dissolution bands, and (iii) on the phyllosilicate content in
disaggregation bands. This microscopic anisotropy in the petrophysical properties of
deformation bands opens up a new and fruitful area for further research. Our results
show that for phyllosilicate bands the band thickness is related to the phyllosilicate
content, whereas for cataclastic bands no apparent correlation was found between
thickness and intensity of cataclasis.
10

PhD dissertation, A. Torabi, 2007
Introduction
Sedimentary rocks, whether they are water aquifer or petroleum reservoirs are
characterized by features which affect the fluid flow. The faulting of clastic rocks can
induce large- and small-scale heterogeneities in the spatial distribution of petrophysical
characteristics, particularly porosity and permeability. Enhanced understanding of the
structure and the petrophysical properties of fault zones in comparison to the
surrounding undeformed host rock is essential when efforts are made to predict fluid
flow through faulted reservoirs.
Many workers have provided a theoretical foundation for understanding the
movement of fluids, especially hydrocarbons, in the subsurface (e.g. Hubbert, 1953;
Berg, 1975; Schowalter, 1979; England, 1987; Watts, 1987). However, applying such
studies to the movement of hydrocarbons within faulted reservoirs has been limited by
the absence of detailed data on the petrophysical properties of fault rocks (e.g. porosity
and permeability), as well as the distribution of fault-related deformation structures (e.g.
Fisher et al., 2001). Recent publications have provided quantitative data on the
petrophysical properties of faults and their associated localized microstructures, known
as deformation bands (e.g. Antonellini and Aydin, 1994; Fisher and Knipe, 1998;
Gibson, 1998, Fisher and Knipe, 2001; Hesthammer and Fossen, 2001; Ogilvie and
Glover, 2001; Shipton, et al., 2002), the distribution of fault related structures (e.g.
Allan, 1989; Knipe, 1997; Yielding et al., 1997; Shipton et al., 2001), as well as the fault
zone structures in both macro- and microscale ( e.g. Cowie and Scholz, 1992; Gibson,
1994; Peacock and Sanderson, 1994; McGrath and Davison, 1995; Knipe et al., 1997;
Fossen et al., 2007).
Although such data are required as input to reservoir simulators, large uncertainties
exist in the detail of the associated structures in the fault zones and absolute values of
properties; these uncertainties ultimately have large influence on the predicted fluid
flow. The main aim of the studies in this dissertation is to improve our knowledge of
deformation bands and their petrophysical properties such as porosity and permeability.
As a complete review of the existing literature is provided through the enclosed papers,
the following section is a brief overview of the state of the art for the studied topic.
11

PhD dissertation, A. Torabi, 2007
Deformation bands and their petrophysical properties
Deformation bands are tabular, thin structures, which form at the onset of strain
localization in porous rocks (e.g. Rudnicki and Rice, 1975, Bésuelle, 2001a; Klein et al.,
2001; Rudnicki, 2002; Olsson et al., 2002, Rudnicki, 2004; Schultz and Siddharthan,
2005, Aydin et al., 2006; Fossen et al., 2007, Holcomb et al., 2007, Fig. 1) . They are
preferentially oriented with respect to the stress field (Bésuelle, 2001). Deformation
bands are different from faults and fractures in that they do not feature a discrete fracture
or slip surface (e.g. Fossen et al., 2007).
Fig.1. Deformation bands at different scales: (a) Deformation bands(marked by the arrows), outcrop photo (lens-cap for scale) ; (b) A millimeter wide deformation band (marked by the arrows) in a cylindrical plug of sandstone (length of the plug is 25.4 mm/ 1 inch); (c) A millimeter wide deformation band in a hand sample, the scale bar is in centimeters (d) photomicrograph of a deformation band outlined with red dashed lines, quartz grains are white, epoxy saturating the pore space is blue.
12
PhD dissertation, A. Torabi, 2007
Field and laboratory observation show that they are not necessarily associated with
a dilational strain. Very often they show porosity reduction (Bésuelle, 2001).
Deformation bands range from compactional through simple shear to dilational (e.g.
Anttonellini and Aydin, 1994; Antonelli et al., 1994; Mollema and Antonellini, 1996,
Cashman and Cashman, 2000; Du Bernard et al., 2002) and involve different
deformation mechanisms including particulate (granular) flow, cataclasis and dissolution
(e.g. Gibson, 1994; Rawling and Goodwin, 2003; Fossen et al, 2007, Fig. 2).
Disaggregation bands form as result of granular flow and involve rolling, sliding and
reorganization of the sand grains in sand or sandstones at shallow depth or low effective
stress (e. g. Rawling and Goodwin, 2003). Disaggregation bands (Fig. 2a) do not affect
the petrophysical properties of the deformed sandstone significantly. Cataclastic
deformation bands (Fig. 2c) are characterized by grain abrasion, crushing or cataclasis
and can reduce porosity and permeability of deformed sandstones significantly
(Antonellini and Aydin, 1994). Dissolution and cementation bands form where
dissolution or cementation is dominant (Fig. 2d). Dissolution and quartz cementation
have been suggested as an explanation for poor reservoir performance in North Sea
reservoirs located at >3 km depth (Hesthammer et al., 2002).
Typical deformation bands such as those first reported by Aydin (1978) in Utah,
are about a millimeter thick, several meters to hundreds of meters in length and have
maximum displacements in the range of several millimeters to several centimeters.
These bands consist of two zones, namely inner zone and outer zone. The inner zone
comprises a zone of fractured and crushed grains, whereas the deformation in outer zone
was restricted to reorganization of the grains and pore collapse (Aydin, 1978; Aydin and
Johnson, 1978).
The Localization and development of deformation bands and the evolution of their
permeability structure have been investigated through experimental work (e.g. Mair et
al., 2000; Main et al., 2001; Lothe et al., 2002; Ngwenya, et al., 2003). In the course of
deformation mechanism in porous sand and sandstone, controlling factors have been
conveniently isolated and studied in the laboratory. Such studies have attracted
significant attention from geologists, rock- and soil-mechanics engineers, and
geophysicists (Mandl et al., 1977; Zhu and Wong, 1997; Zhang and Tullis, 1998; Main
et al., 2001; Mair et al., 2000; 2002; Sperrevik et al., 2002; Lothe et al., 2002; Garga and
Sendano, 2002; Clausen and Gabrielsen, 2002; Kjelstad et al., 2002; Ngwenya et al.,
2003; Agung et al., 2004; Sassa et al., 2004). Numerical modeling of deformation bands
13

PhD dissertation, A. Torabi, 2007
has also provided valuable insights (e.g. Antonellini et al., 1995; Wang et al., 2001;
Borja, 2003; Narteau and Main, 2003; Schultz & Balasko, 2003; Okubo and Schultz,
2005).
Several publications address the effects of the small-scale geological features on
large-scale permeability of the reservoirs (e.g. Durlofsky, 1992; Jourde, 2002; Sternlof et
al., 2004). For more than two decades, much attention has been devoted to the
petrophysical properties of deformation bands, in particular permeability reduction
caused by the presence of deformation bands in faulted sandstones (Pitman, 1981;
Jamison and Streans, 1982; Antonellini and Aydin, 1994; Knipe et al., 1997; Gibson,
1998; Fisher and Knipe, 2001; Ogilvie and Glover, 2001; Shipton et al., 2002; Sternlof
et al., 2004). Individual cataclastic deformation bands in Utah are reported to reduce the
porosity of the host sandstone by one order of magnitude and the permeability by three
orders of magnitude (Antonellini and Aydin, 1994).
Fig.2. Examples of deformation bands formed as results of different deformation mechanisms; (a) A disaggregation band from Gullfaks field, North Sea(b) A phyllosilicate band from Huldra field, North Sea (c)A cataclastic band from Sinai, Egypt (d) A dissolution band from San Rafael Desert,Utah.
14

PhD dissertation, A. Torabi, 2007
Phyllosilicate bands (Fig. 2b), which form by granular flow in sandstones
containing more than 10-15% phyllosilicate, involve up to several orders of reduction in
permeability according to plug measurements reported by Fisher and Knipe (2001).
However, the dispersion in the reported porosity and permeability data for deformation
bands is noticeable. Moreover, spatial variations in porosity and permeability, related to
microstructural variations along individual deformation bands, have been given little or
no attention in the literature (cf. Fossen and Bale, 2007).
In addition, most of the published porosity and permeability data for deformation
bands are from either mini-permeameter or plug measurements. A central question is
whether these data are representative of the permeability effects of millimeter wide
deformation bands? What kinds of uncertainties are associated with these methods?
There has been significant progress in numerical permeability models for sandstone
reservoirs, one could ask whether existing image processing based methods typically
applied to undeformed sandstones (e.g. Ehrlich et al., 1984; Wissler, 1987; Koplik et al.,
1984; Doyen, 1988; Blair et al., 1996, Bakke and Øren, 1997; Keehm et al., 2004; 2006;
White et al., 2006) could be used to estimate the porosity and permeability of
deformation bands?
Objectives of this study
The prediction of fluid flow paths in deformed porous sandstone requires more
accurate geological models of deformation band morphology, and their evolution. The
studies collected in this dissertation share the common aim of increasing our
understanding of the detailed microstructure and petrophysical properties of deformation
bands with special reference to deformation bands formed in extensional geological
settings, in particular rift related structures similar to the North Sea. In order to achieve
this goal a three-part workflow was defined.
1- Analogue modeling of deformation bands by ring-shear experiments (Paper
1). In the ring-shear project, we aimed to investigate the initiation and
development of shear zones in highly porous sand at different stress levels.
The effect of grain size on deformation process was also studied.
Fundamental for this study was the creation of shear zones which are similar
to natural deformation bands formed at shallow to medium burial depth.
15

PhD dissertation, A. Torabi, 2007
2- Outcrop study; an outcome of this work was establishing a database on thin
sections of different types of deformation bands. Our database involves
examples from Corsica (France), Sinai (Egypt), Utah (USA). The main focus
was to present a new type of deformation band, first observed by us during
the field and laboratory works on samples from Sinai, Egypt (Paper 2). These
bands are distinct from other deformation bands in our database. The work
examines the microstructure and petrophysical properties of this new band
type and discusses mechanisms and causes for their formation.
3- Numerical analysis of the petrophysical properties of deformation bands and
their host rock, such as porosity and permeability (Papers 3 and 4); the main
concern for this part was to find a reasonably accurate method to estimate the
porosity and permeability of deformation bands. Furthermore we sought to
explain the wide dispersion in the published petrophysical properties of
deformation bands. Examples of different types of deformation bands from
localities around the world were examined using optical microscopy,
Secondary Electron Microscope and image processing.
References
Agung, M. W., Sassa, K., Fukuoka, H., Wang, G., 2004. Evolution of shear-zone
structure in undrained ring-shear tests. Landslides 1, 101-112.
Allan, U. S., 1989. Model for hydrocarbon migration and entrapment within faulted
structures. AAPG Bulletin, 73, 803-811.
Antonellini, M. and Aydin, A., 1994. Effect of faulting on fluid flow in porous
sandstones: petrophysical properties, AAPG Bulletin, 78, 355-377.
Antonellini, M.A., Aydin, A. & Pollard, D. D., 1994. Microstructure of deformation
bands in porous sandstones at Arches National Park, Utah. Journal of Structural
Geology, 16, 941–959.
Antonellini, M. and Pollard, D., 1995. Distinct element modelling of deformation bands
in sandstone, Journal of Structural Geology, 17, 8, 1165-1182.
Aydin, A., 1978. Small faults formed as deformation bands in sandstone. Pure and
applied Geophysics 116: 913-913.
Aydin, A., Johnson, A. M., 1978. Development of faults as zones of deformation bands
and as slip surfaces in sandstone. PAGEOPH 116.
16

PhD dissertation, A. Torabi, 2007
Aydin, A., Borja, R. I. and Eichhubl, P., 2006.Geological and Mathematical framework
for failure modes in granular rock. Journal of Structural Geology, 28, 83-98.
Bakke, S. and Øren, P. E., 1997. 3-D Pore-scale modelling of sandstones and flow
simulations in the pore networks, SPE 35479, 2.
Berg, R. R. (1975). Capillary entry pressure in stratigraphic traps. AAPG Bulletin, 59,
939-956.
Blair, S. C., Berge, P. A., and Berryman, J. G., 1996. Using two-point correlation
functions to characterize microgeometry and estimate permeabilities of sandstones and
porous glass, J. Geophys. Res., 101(B9), 20359-20375.
Borja, R. I., 2003. Computational modelling of deformation bands in granular media. II.
Numerical Simulatiions, Comput. Methods Appl. Mech. Engreg. 193, 2699-2718.
Bésuelle, 2001. Compacting and dilating shear bands in porous rocks: Theoretical and
experimental conditions, Journal of Geophysical Research, Vol. 106, No.87, P. 13,435-
13,442.
Cashman, S. & Cashman, K., 2000. Cataclasis and deformation-band formation in
unconsolidated marine terrace sand, Humboldt County, California. Geology,28, 111–
114.
Clausen, J. A., Gabrielsen, R. H., 2002. Parameters that control the development of clay
smear at low stress states: an experimental study using ring-shear apparatus. Journal of
Structural Geology 24(10), 1569-1586.
Cowie, P.A. & Scholz, C.H., 1992. Displacement–length scaling relationship for faults:
data synthesis and analysis. Journal of Structural Geology, 14, 1149–1156.
Doyen, P. M., 1988. Permeability, conductivity, and pore geometry of sandstone, J.
Geophys. Res., 93, 7729-7740.
Du Bernard, X. D., Eichhubl, P., and Aydin, A., 2002. Dilation bands: A new form of
localized failure in granular media, Geophysical Research Letters 29(24), 2176.
Ehrlich R., Kennedy, S. K., Crabtree, S. J. and Cannon, R. L., 1984. Petrographic image
anlysis: I. Analysis of reservoir pore complexes, Journal of Sedimentary Petrology, 54,
1515-1522.
England, W.A., MacKenzie, A.S., Mann, D.M., Quigley, T.M., 1987. The movement
and entrapment of petroleum fluids in the subsurface. Journal of the Geological Society,
144, 327– 347.
Fisher, Q. J., & Knipe, R. J., 1998. Microstructural controls on the petrophysical
properties of fault rocks. In G. Jones, Q. J. Fisher & R. J. Knipe, Faulting and fault
17

PhD dissertation, A. Torabi, 2007
sealing in hydrocarbon reservoirs. Geological Society of London Special Publications
147, 117-135, London; The Geological Society.
Fisher, Q.J., Harris, S. D., McAllister, E., Knipe, R. J., Bolton, A. J., 2001, Marine and
Petroleum Geology, 18, 251-257.
Fisher, Q. J. and Knipe, R. J., 2001. The permeability of faults within siliciclastic
petroleum reservoirs of the North Sea and Norwegian Continental Shelf, Marine and
Petroleum Geology, 18, 1063-1081.
Fossen, H., Schultz, R. A., Shipton, Z., Mair, K., 2007. Deformation bands in sandstone-
a review. Journal of the Geological Society, London, 164, 4, 755-769.
Fossen, H & Bale, A. 2007: Deformation bands and their influence on fluid flow. AAPG
Bulletin 91, 1685-1700.
Gibson, R.G. 1994. Fault-zone seals in siliciclastic strata of the Columbus Basin,
offshore Trinidad. AAPG Bulletin, 78, 1372–1385.
Gibson, R.G. 1998. Physical character and fluid-flow properties of sandstone derived
fault zones. In: Coward, M.P., Johnson, H. & Daltaban, T.S. (eds) Structural Geology in
Reservoir Characterization. Geological Society, London, Special Publications, 127, 83–
97.
Hesthammer, J. and Fossen, H., 2001. Structural core analysis from the Gullfaks area,
northern North Sea, Marine and Petroleum Geology 18, 411-439.
Hesthammer, J., Bjorkum, P. A., Watts, L., 2002. The effect of temperature on sealing
capacity of faults in sandstone reservoirs: Examples from the Gullfaks and Gullfaks Sør
fields, North Sea, AAPG Bulletin.
Holcomb, D., J. W., Rudnicki, K. A., Issen, K., Sternlof, 2007. Compaction localization
in the Earth and laboratory: state of the research and research directions, Acta
Geotechnica, 2, 1-15.
Hubbert, M. K. (1953). Entrapment of petroleum under hydrodynamic conditions.
AAPG Bulletin, 37, 1954-2026.
Jamison, W.R. & Stearns, D.W. 1982. Tectonic deformation of Wingate Sandstone,
Colorado National Monument. AAPG Bulletin, 66, 2584–2608.
Jourde, H., Flodin, E. A., Aydin, A., Durlofsky, L. J., and Wen, X-H., 2002.
Computing permeability of fault zones in eolian sandstone from outcrop measurements,
AAPG Bulletin, 86(7), 1187-1200.
Keehm, Y., Mukerji, T., Nur, A., 2004. Permeability prediction from thin sections: 3D
reconstruction and Lttice-Boltzmann flow simulation, Geophys. Res. Let., 31, L04606.
18

PhD dissertation, A. Torabi, 2007
Keehm, Y., Sternlof, K., Mukerji, T., 2006. Computational estimation of compaction
band permeability in sandstone, Geosciences Journal, 10, 4, 499-505.
Kjelstad, A., Chuhan, F., Høeg, K., Bjørlykke, K., 2002. Cataclastic shear band
formation in sands at high stresses: An analogue experimental model and its relevance
for faults in sedimentary basins. PhD Thesis, University of Oslo.
Klein, E., P., Baud, T., Reuschle and T-f., Wong, 2001. Mechanicl behaviour and failure
mode of Bentheim Sandstone under triaxial compression, Phys. Chem., Earth (A), Vol.
26, NO. 1-2, pp. 21-25
Knipe, R.J., Fisher, Q.J. & Clennell, M.R. et al. 1997. Fault seal analysis: successful
methodologies, application and future directions. In: Møller-Pedersen, P. & Koestler,
A.G. (eds) Hydrocarbon Seals: Importance for Exploration and Production. Norwegian
Petroleum Society Special Publication, 7, 15–40.
Knipe, R. J., Fisher, Q. J., Jones, G., Clennell, M. B., Farmer, B., Kidd, B., McAllister,
E., Porter, J. R., & White, E. A., 1997, Fault seal prediction methodologies, applications
and successes. In P. Mùller-Pedersen, & A. G. Koestler (Eds.), Hydrocarbon seals Ð
importance for exploration and production. Special Publication NPF, 7, 15-38,
Amsterdam; Elsevier.
Koplik, J., Lin, C., Vermette, M., 1984. Conductivity and permeability from
microgeometry, J. Appl. Phys., 56, 3127-3131.
Lothe, A. E., Bjørnevoll Hagen, N., Gabrielsen, R. H., Larsen, B.T., 2002. An
experimental study of the texture of deformation bands: effects on porosity and
permeability of sandstones. Petroleum Geoscience 8, 195-207.
Main, I., Mair, K., Kwon, O., Elphick, S., and Ngwenya, B., 2001. Experimental
constraints on the mechanical and hydraulic properties of deformation bands in porous
sandstones: a review. In: Holdsworth, R. E, Strachan, R. A., Magloughlin, J. F. and
Knipe, R. J. (Eds). The Nature and Tectonic Significance of Fault Zone Weakening.
Geological Society, London, Special Publication, 186, 43-63.
Mair, K., Marone, C., 1999. Friction of simulated fault gouge for a wide range of
velocities. Journal of Geophysical Research 104(B12), 28,899-28,914.
Mair, K., Main, I. G. and Elphick, S. C., 2000. Sequential growth of deformation bands
in the laboratory. Journal of Structural Geology 22, 25-42.
Mair, K., Frye, K. M., Marone, C., 2002. Influence of grain characteristics on the
frictioin of granular shear zones. Journal of Geophysical Research 107(B10).
19

PhD dissertation, A. Torabi, 2007
Mandl, G., de Jong L. N., Maltha, A., 1977. Shear zones in granular material. Rock
Mechanics. 9, 95-144.
Marone, C., Scholz, C. H, 1989. Particle-size distribution and microstructures within
simulated fault gouge. Journal of Structural Geology 11(7), 799-814.
McGrath, A., & Davison, I., 1995. Damage zone geometry around faulttips. Journal of
Structural Geology, 17, 1011-1024.
Mollema, P.N. & Antonellini, M.A. 1996. Compaction bands: a structural analogue for
anti-mode I cracks in aeolian sandstone. Tectonophysics, 267, 209–228.
Ngwenya, B. T., O. Kwon, et al. (2003). "Permeability evolution during progressive
development of deformation bands in porous sandstones. Journal of Geophysical
Research 108(B7): 2343 10. 1029/2002JB001854.
Ogilvie, S. R., Glover, Paul, W. J, 2001. The petrophysical properties of deformation
bands in relation to their microsturcture. Earth and Planetary Science Letters, 193, 129-
142.
Okubo, C. H., Schultz, R. A., 2005. Journal of the Geological Society, London, 162,
939-949.
Olsson, W. A., D. J., Holcomb, J. W. Rudnicki, 2002, Compaction loclization in porous
sandstone: implication for reservoir mechanics, Oil & Gas science and Technology, Rev.
IFP, Vol., 57, No. 5, pp. 591-599
Peacock, D. C. P., & Sanderson, D. J., 1994. Geometry and development of relay ramps
in normal fault systems. American Association of Petroleum Geologists Bulletin, 78,
147-165.
Pittman, E. D., 1981. Effect of fault-related granulation on porosity and permeability of
quartz sandstones, Simpson Group (Ordovician) Oklahoma, AAPG Bull., 65, 2381-
2387.
Rawling, G. C., Goodwin, L. B., 2003. Cataclasis and particulate flow in faulted, poorly
lithified sediments. Journal of Structural Geology 25(3), 317-331.
Rudnicki, J. W., J. R., Rice, 1975, Conditions for the localization of deformation in
pressure-sensitive dilatant materials, J. Mech. Phys., Solids, 1975, Vol. 23, pp. 371-394
Rudnicki, J. W., 2002. Condition for compaction and shear bands in a transversely
isotropic material, International Journal of Solids and Strcuctures, 39, pp. 3741-3756
Rudnicki, J. W., 2004. Shear and compaction band formation on an elliptic yield cap,
Journal of Geophysical Research, Vol. 109
20

PhD dissertation, A. Torabi, 2007
Sassa, K., Fukuoka, H., wang, G., Ishikawa, N., 2004. Undrained dynamic-loading ring-
shear apparatus and its applicatiion to landslide dynamics. Lanslides 1, 7-19.
Schowalter, T. T. (1979). Mechanisms of secondary hydrocarbon migration and
entrapment. AAPG Bulletin, 63, 723-760.
Schultz, R. A. and Balasko, C. M., 2003. Growth of deformation bands into echelon and
ladder geometries, Geophysical Research Letters, 30, 2033.
Schultz, R. A., Siddharthan, R., 2005. A general framework for the occurrence and
faulting of deformation bands in porous granular rocks, Tectonophysics, 411, 1-18.
Shipton, Z.K. & Cowie, P.A. 2001. Analysis of three-dimensional damage zone
development over _m to km scale range in the high-porosity Navajo sandstone, Utah.
Journal of Structural Geology, 23, 1825–1844.
Shipton, Z. K., Evans, J. P., Robeson, K. R., Forster, C: B., Snelgrove, S., 2002.
Structural heterogeneity and permeability in eolian sandstone: Implications for
subsurface modelling of faults. AAPG Bull. 86 (%), 863-883.
Sperrevik, S., Gillespie, P. A., Fisher, Q. J., Halvorsen, T., Knipe, R. J., 2002. Empirical
estimation of fault rock properties. In: Koestler, A. G. and Hunsdale, R. (Eds).
Hydrocarbon Seal Quantification. Norwegian Petroleum Society (NPF), Special
Publication. 11,109-125.
Sternlof, K. R., Chapin, J. R., Pollard, D. D., and Durlofsky, L. J., 2004. Permeability
effects of deformation band in arrays in sandstone. AAPG Bull., 88, 9, 1315-1329.
Watts, N. L. (1987). Theoretical aspects of cap-rock and fault seals for single and two
phase hydrocarbon columns. Marine and Petroleum Geology, 18, 4, 274-307.
Wissler, T. M., 1987. Sandstone pore structure: A quantitative analysis of digital SEM
images, PhD. thesis, Mass. Inst. of Technol., Cambridge.
White, J., A., Borja, R. I., Fredrich, J. T., 2006. Calculating the effective permeability of
sandstone wit multiscale lattice Boltzmann/finite element simulations. Acta
Geotechnica, 1, 195-209.
Yielding, G., Freeman, B., & Needham, D. T., 1997. Quantitative fault seal prediction.
American Association of Petroleum Geologists Bulletin, 81, 897-917.
Zhang, S., Tullis, T. E., 1998. The effect of fault slip on permeability and permeability
anisotropy in quartz gouge. Tectonophysics 295(1-2), 41-52.
Zhu, W., Wong, T., 1997. The transition from brittle faulting to cataclastic flow. Journal
of Geophysical Research 102(B2), 3027-3041.
21

22
PhD dissertation, A. Torabi, 2007
Paper 1 Torabi, A., Braathen, A., Cuisiat, F., and Fossen, H., 2007. Shear zones in porous sand:
Insights from ring-shear experiments and naturally deformed sandstones. Tectonophysics, 437,
37-50.
23

24

Autho
r's
pers
onal
co
py
Shear zones in porous sand: Insights from ring-shear experiments andnaturally deformed sandstones
Anita Torabi a,⁎, Alvar Braathen a, Fabrice Cuisiat b, Haakon Fossen a
a Centre for Integrated Petroleum Research, Department of Earth Science, University of Bergen, Post Box 7800, 5020 Bergen, Norwayb Norwegian Geotechnical Institute, Post Box 3930, N-0806 Oslo, Norway
Received 20 September 2006; received in revised form 15 February 2007; accepted 27 February 2007Available online 19 March 2007
Abstract
We have used thin section and particle size analyses to relate stress–strain relationships in ring-shear experiments with burialdepth at the time of faulting in naturally deformed samples. We show that the burial depth (level of stress) and the amount of sheardisplacement at the time of deformation are important factors influencing the type of grain breakage and also the type of shear zonethat forms. Further, petrographic image analyses with porosity estimations show systematic change related to progressivedevelopment of the shear zones and the development of two end-member types of shear zones: (a) Shear zones with diffuseboundaries formed at low levels of stress, and (b) Shear zones with sharp boundaries formed at higher levels of stress. We considerthe mechanism of deformation at shallow depth/low level of stress to be dominated by reorganization, rolling and flaking of grains.This mechanism causes rough surfaces of the grains at the margins and within the shear zones. At greater depths or at higher levelsof stress, the predominant mode of fracturing transgresses from flaking to grain splitting, resulting in lower porosity values andgreater particle size reduction. Furthermore, this transition results in a slow increase in the power law dimension from 1.4 to 1.6with respect to the increased displacement.© 2007 Elsevier B.V. All rights reserved.
Keywords: Shear zone; Stress; Strain; Particle size; Porosity; Burial depth
1. Introduction
Zones of localized deformation found in highly porousrocks and sediments, in most cases mechanically strongerand with lower porosity than surrounding rocks, arecommonly referred as deformation bands (Aydin et al.,2006; Fossen et al., in press). In this studywe investigate atype of deformation band which has a strong componentof shear and involves both compaction and shearing ofsand and sandstone. Shear deformation is localized to azone, which wewill call a shear zone. It is commonly seen
that the petrophysical properties of the rock are changedduring the course of the deformation. In particular, thepermeability within the shear zone may change dynam-ically during and after deformation, dependent on manyfactors. Their occurrence and formation have thereforebeen the subjects of considerable attention among petro-leum and hydro geologists.
Initiation and development of shear zones as de-formation structures in highly porous, granular rock areaffected by the mechanical and hydraulic properties ofthe host rock. These properties depend on the micro-structural evolution of the rock, in particular themechanical processes that act during fault formation,how these processes interact, and the stage of evolution
Tectonophysics 437 (2007) 37–50www.elsevier.com/locate/tecto
⁎ Corresponding author.E-mail address: [email protected] (A. Torabi).
0040-1951/$ - see front matter © 2007 Elsevier B.V. All rights reserved.doi:10.1016/j.tecto.2007.02.018
25

Autho
r's
pers
onal
co
py
(Ngwenya et al., 2003). Outcrop and drill core ob-servations represent only the final results of deforma-tion. Indirect information about the evolution of thestructures can be gained by studying natural structuresrepresenting various stages of strain. Alternatively, suchinformation can be directly obtained through controlledlaboratory experiments performed in a deformationapparatus, such as the ring-shear apparatus.
The mechanism of deformation in porous sand andsandstones is dependent on the initial porosity, grainsize, pore fluid pressure, temperature, burial depth, andstate of stress and strain throughout the deformationhistory (Fossen et al., in press). These factors control thetype of shear zone that forms and influence its thickness.For example, high porosity and coarse grain size com-bined with shallow burial depth (low confining pres-sure) at the time of faulting tend to increase the thicknessof shear zones (e.g. Antonellini and Aydin, 1999).
The deformation mechanism controlling factors areconveniently isolated and studied in the laboratory. Hencethe advantage of experimental study of shear zones ingranular materials is well documented. Such studies haveattracted significant attention from geologists, rock and soilmechanics engineers, and geophysicists alike (Mandl et al.,1977; Zhu and Wong, 1997; Zhang and Tullis, 1998; Mairand Main, 2000; Main et al, 2001; Mair et al,2002; Sperrevik et al., 2002; Lothe et al., 2002; Garga andSendano, 2002; Clausen and Gabrielsen, 2002; Kjelstad etal., 2002; Ngwenya et al., 2003; Agung et al., 2004; Sassaet al., 2004). Most works are based on triaxial and uniaxialcompressional tests. However some of the studies,including Mandl et al. (1977), Zhang and Tullis (1998),Garga and Sendano (2002), Sperrevik et al. (2002),Clausen and Gabrielsen (2002), Agung et al. (2004) andSassa et al. (2004) used a low stress ring-shear apparatus.Mandl et al. (1977) used the ring-shear apparatus to studythe development of shear zones and the accompanyingchanges in texture and stress state in granular material at amaximum of 920 kPa. Agung et al. (2004) investigated theevolution of shear zone structure in undrained ring-sheartests at 180 kPa under different shear displacements.
In the present study the occurrence and developmentof shear zones in sand has been investigated using a newhigh-stress ring-shear apparatus designed and built atthe Norwegian Geotechnical Institute (NGI, Oslo, Nor-way). This instrument can handle up to 20 MPa imposednormal stresses, corresponding to about 2 km or more ofoverburden. Our aim is to explore the formation of shearzones and associated porosity change inside deformedsample at the simulated condition of relatively shallowburial depth. We implement the experimental results inthe interpretation and classification of natural shear
zones. Our outcrop samples are from an in-house data-base on faulted sandstones in Sinai (Egypt), Corsica(France), and Utah (USA). In the light of burial depth forthe study areas at the time of deformation we studiedand compared the results of experiments and naturalrocks in order to further understand the physical pro-cesses of faulting. This has been performed by micro-structural study of deformed sand and sandstones basedon comparison of thin sections from experiments andfrom natural rocks.
2. Ring-shear apparatus
The ring-shear device was originally designed to studythe residual strength of soils (Hvorslev, 1939; Bishopet al., 1971). In the ring-shear apparatus, the sample isforced to shear along a predefined plane located at theseparation of the upper and lower confining rings(Hvorslev, 1939). Later Mandl et al. (1977) used thering-shear apparatus to study shear zones in granularmaterial. For a good historical review of the ring-shearapparatus and further information, the reader is referred toSassa et al. (2004). The effect of clay and sand properties,strain rate and geometrical aspects on the clay smearcontinuity in the fault zone has been studied by Sperreviket al. (2002) and Clausen and Gabrielsen (2002), bothperforming their experiments atNGI. Limitations inherent
Fig. 1. A simplified sketch of the ring-shear cell. Rotating parts aredrawn in light blue and movable parts in grey. The material sample isyellow. The horizontal red arrows on the lower ring indicate directionof movement. The vertical red arrow on the top of the upper ring showsthe direction of loading on the ring-shear cell. Notice the drainagepoints placed on the upper and lower rings and knives to transfer shearstress to the sample. The width of the ring specimen is 25.4 mm and itsheight is 45 mm. The area of the sample is equal to 223 cm2. Thediameter of sampler cylinder is 1 in. Courtesy of NGI.
38 A. Torabi et al. / Tectonophysics 437 (2007) 37–50
26

Autho
r's
pers
onal
co
py
in the previous ring-shear apparatus at NGI (i.e. low stresslevel used for geotechnical applications) have motivatedthe construction of a new ring-shear device (Fig. 1). Thenew ring-shear apparatus can handle up to 20MPa normalstresses, simulating more than 2 km burial depth, thusrepresenting a significant improvement over the previousone. Besides, thin sections prepared from final samplescan be used for porosity measurements and particle sizeanalysis and further in the analysis of deformation underdifferent stress conditions.
The ring-shear apparatus operates as a uniaxialdeformation device during normal loading prior toshearing (similar to Mandl et al., 1977). During therotation in the Mandl ring-shear apparatus, the normalloading remains constant but the maximum principalstress rotates due to shear stress such that at the horizontalshear zone the angle between the shear zone and thenormal stress is equal to 45° (see Mandl et al., 1977).
The ring-shear apparatus consists of five parts(Cuisiat and Skurtveit, 2006):
• The ring-shear assembly and reaction frame• The loading system• The shearing system• The hydraulic system• Instrumentation, data acquisition and control systems
The ring-shear assembly consists of a pedestal, upperand lower frames, upper and lower rings, and inner andouter confining rings. The sample is contained within theannular space created between the inner and outerconfining rings, and the lower and upper rings. Thewidth of the annular space between the rings is 25.4 mm.The maximum height of the sample is 45 mm, limited bythe need for seating of the O-rings at the upper ring toensure hydraulic sealing. The area of the sample is equalto 223 cm2. On the upper and lower rings, 48 knives (orgrooves) are evenly located to ensure transfer of thetorque to the specimen. 48 openings for valves are evenlydistributed between the knives at the upper and lowerrings for flow measurements. During shearing, the upperring is fixed and only the lower ring rotates clockwise.Two reaction arms on the upper frame provide the reactionforces against the rotation forces of the lower assembly.
Two load cells measure the reaction forces, which in theabsence of friction are equal to the shear forces exerted onthe specimen.
The following variables are measured during anexperiment:
• Vertical force from MTS (MTS is a registered trade-mark) load cell (FMTS)
• Lateral forces F1 and F2 from tangential load cells• Stroke from MTS transducer (δMTS)• Axial displacement from internal LVDT, i.e. LinearVariable Differential Transformer, (δLVDT)
• Absolute motor rotation, torque, rotation velocity• Pore pressures at upper and lower GDS (Global DigitalSystem Ltd.) pumps (uup, ulow)
• Pressure difference across sample from pressuretransducer (Δu)
• Status of automatic valves (open/closed)
The following variables are calculated and loggedduring an experiment:
• Shear stress s : s ¼2ðF1 þ F2ÞR
kðro þ riÞðr2o−r2i ÞwhereR is the radial distance between lateral load cells,ro is the outer radius of the test specimen and ri is theinner radius of the specimen; F1, F2 are the lateralforces from tangential load cells.
• Normal stress r : r ¼FMTS
kðr2o−r2i Þwhere F
MTSis the vertical force from the MTS
machine;
• Shear displacement at mid-sample l : l ¼ 2kðro þ riÞ
2h360
θ
is the rotation angle of the lower ring in degrees.
3. Ring-shear sample description and testingprocedures
The test program was designed for initial testing ofthe apparatus and to explore its potential for studyingsand deformation. In total, four different types of sandhave been used (Table 1). Three types of sand from
Table 1Description of sands used in the ring-shear experiments
Type of sand Grain size (D60) in mm Age Type Angularity Location
Bornholm no. 1 0.4 Jurassic Quartzarenite Subrounded–subangular DenmarkBornholm no. 17 0.2 Jurassic Quartzarenite Subrounded–subangular DenmarkBornholm no. 15 0.93 Early Jurassic Quartzarenite Subrounded–subangular DenmarkBaskarp 0.17 Holocene Quartzarenite Subangular–angular Sweden
39A. Torabi et al. / Tectonophysics 437 (2007) 37–50
27

Autho
r's
pers
onal
co
py
Bornholm, Denmark (Jurassic) and a Holocene, well-sorted sand from Baskarp, Sweden were used for thelow stress experiments. The Baskarp sand was alsoused for the high-stress experiments. The sandscontain more than 90% quartz and have differentgrain size and angularity. The Bornholm sand waschosen because of its sub-rounded form and availabil-ity in different grain sizes at NGI. We have performeddrained experiments at atmospheric pore pressure, andthe shear rate was so slow that any inducedoverpressure would not exceed 100 kPa at any timeduring shearing. This value is small compared to thetotal normal stress applied on the specimen (5 or20 MPa), which ensures that the shear inducedpressure build-up will not influence the frictionalbehavior of the sands. Testing procedures for the newring-shear apparatus were developed during theexperimental program (Cuisiat and Skurtveit, 2006).
• The silt fraction (N0.075 mm) of the material wasremoved prior to mounting of the sample because ofpotential clogging of the filters by fine material.
• Sand was tamped into the cell in a wet condition. Theamount of water needed varies with the type of sand,the mixture should be sticky, not a slurry.
• The lower ring was filled with sand. The top surfacewas flattened with a flat knife.
• First the sample was saturated with water. The ex-periments were then carried out in drained conditions(outlet opened to atmosphere).
• The sample was then loaded normally with a rate of1MPa/min until the desired normal stress was reached.
In tests RT04, RT05, RT06, RT08, RT09, RT10, RT13;a vertical cyclic load at 28 kN was applied (100 cycles:mean: 28 kN, amplitude: 5 kN, frequency: 0.05 Hz) to
ensure full penetration of the “knives” into the sample,and homogeneous stress distribution within the sample.
• Minimum rest period was 15 min before shearing.• The shearing has been done stepwise with stops forflow measurements under constant normal stresses(shear rate was 2°/min). Flow measurement was donebefore every stage of shearing.
• Thin section samples were collected with a steelcylinder at the end of the tests. The steel cylinder waspushed down vertically into the sample (perpendic-ular to the shear zone) from top to the bottom withoutlateral movement. The samples were oven-dried at105°C for 24 h and then impregnated with epoxyunder vacuum. A detailed description of the tests ispresented in Table 2.
4. Methodology of analyzing the thin sections
Polished thin sections from sheared sand and sand-stones have been prepared and studied by both opticaland Scanning Electron Microscope (SEM). Backscat-tered Electron Images (BSE) from the SEM weregenerated from thin sections and analyzed by meansof standard image analysis software (ImageJ). Particlesize area distributions based on grain areas wereobtained from the BSE Images. The selected areas inpixels were calibrated in square millimeters by settingthe real scale on the image.
The description of the particle size distribution for thesamples includes statistical analysis. The latter is presentedas exceedence frequency plots for all the thin sections.Exceedence Frequency (EF) of a particular value of ameasured variable is defined as the number of data withvalues greater than that value, divided by the total numberof the data.
Table 2Description of the ring-shear experiments
Test no. Sand type Grain size(D60) in mm
Initial porosity(%)
Porosity reductiondue to loading
Initial height(mm)
Vertical stress(MPa)
Rotation(degree)
Sheardisplacement(mm)
RT01 21 Bornholm 0.373 44.6 2.9 40 5 45 109.75RT02 21 Bornholm 0.373 45 3.3 40 5 60 146.34RT03 21 Bornholm 0.373 45 3.3 40 5 75 182.93RT04 21 Bornholm 0.373 45 4 44 5 360 878.07RT05 17 Bornholm 0.191 47.5 2.4 40 5 60 146.34RT06 15 Bornholm 0.934 43.4 6.8 44 5 150 365.86RT08 Baskarp 0.176 37 1.7 45 5 450 1097.6RT09 Baskarp 0.176 41 4.1 44 20 75 182.93RT10 Baskarp 0.176 41 5.4 44 20 45 109.75RT13 15 Bornholm 0.934 43 3.5 44.5 5 75 184.06
40 A. Torabi et al. / Tectonophysics 437 (2007) 37–50
28

Autho
r's
pers
onal
co
py
In the present study, the plots of log EF versus logparticle size areas have been investigated. The best fit for agiven particle size distribution of a shear zone is a powerlaw described by its dimension D (exponent). Thecalculated D is two-dimensional but can be converted tothree dimensions by simply adding 1 (Sammis et al., 1987;Blenkinsop, 1991).
Porosity has been measured in thin sections throughbinary images fromBSE images (Table 3). However, sinceporosity measurements are influenced by the thresholdlevel between black (pores) and white (particles) pixels,and any void appears black in the binary images, themeasured porosities may be slightly overestimated.
5. Results from ring-shear experiments
Based on the detailed analysis of the thin sectionsfrom the ring-shear experiments we have classified theshear zones into two different categories:
i) Shear zones with diffuse boundaries formed atlow level of stress.
ii) Shear zones with sharp boundaries formed athigher levels of stress.
This division is supported by particle size analysisusing high-resolution 2-D images (BSE images) fromthin sections. In this context, it is important that thedistributions and not the averages of particle sizes areindicative of the underlying processes of cataclasticdeformation (Marone and Scholz, 1989). At a low levelof stress (5 MPa normal stress), flaking of the grains isthe dominant mode of deformation (Fig. 2a), resulting inrough grain surfaces. At higher levels of stress (20 MPanormal stress), the grains mostly break by splitting (Fig.
2b). Changing of the dominant grain breakage modefrom flaking to splitting creates different types of shearzones. Based on thin section studies, vertical sectionsthrough the deformed sand have been separated intothree main parts (Fig. 3a),
• The “top layer”, representing the upper part.• The “shear zone” or the middle part.• The “bottom layer” or the lower part of the section.
The boundaries of the shear zones are for the most partgradual in the thin sections for experiments performed at5 MPa normal stress and low rotations (shear displace-ments); such as for thin sections from experiments RT01,RT02, RT03, RT06 and RT13. We call such shear zonesdiffuse boundary shear zones (Fig. 3a). However, insome thin sections, such as RT04, RT08 and RT09, RT10;sharp shear zone boundaries are visible at high shearrotation (high displacements) under 5MPa normal stresses.They are also present for the relatively lower shear straindisplacements obtained under 20MPa normal stresses. Themargins of such sharp boundary shear zones are herenamed the “upper” and “lower shear zone margin”,respectively (Fig. 3b). The diffuse boundary shear zonesare wider than the sharp boundary shear zones. RT09(20MPa; 75 degree rotation) represents the best example of
Table 3Estimated porosities from BSE images of thin sections from ring-shearexperiments
Testno.
Initialporosity(%)
Toplayerporosity(%)
Uppermarginshearzoneporosity(%)
Shearzoneporosity(%)
Lowermarginshearzoneporosity(%)
Bottomlayerporosity(%)
RT01 44.6 42 – 33 – –RT02 45 39 – 23RT03 45 40 – 20RT04 45 32 20 15 18 30RT06 43.4 35 24 31RT08 37 34 31 11 29 30RT09 41 24 20 13 15 25RT10 41 18 9 7 11 28RT13 43 32 15 36
Fig. 2. Different types of grain breakage in thin sections; (a) grainflaking is dominant at low level of stress (BSE image from RT01, toplayer); (b) grain splitting is the dominant mechanism at higher levels ofstress (BSE image from RT09, top layer).
41A. Torabi et al. / Tectonophysics 437 (2007) 37–50
29

Autho
r's
pers
onal
co
pya strongly layered shear zone. This shear zone shows amore compacted central part with maximum reduction inparticle size and significant porosity decrease (Figs. 3b and4a, b). The shear zone is surrounded bymargins and the topand bottom layers that contain coarser particle sizecompared to the shear zone. In sharp boundary shearzones like RT09 there is an asymmetry in the particle sizedistribution, with slightly more particles size reduction inthe lower than the upper margin. Similar observations havebeen reported by Mandl et al. (1977) and Agung et al.(2004) for layered shear zones.
The particle size distribution plots for sample RT09(Fig. 4b) indicate that the best fit to the particle sizedistribution is a power law with a low D value (1.44). Theoverall results reveal that increasing the normal stress and/or shear stress (by rotation) changes theD values graduallyfrom 1.4 at low levels of stress to 1.5 at higher levels ofstress. Based on the results of the experiments, we havechosen to explore three variables, namely the role of sheardisplacement, grain size and loading.
5.1. The role of shear displacement
Four experiments have been conducted on thepure, medium-grained, sub-rounded Bornholm sand at
5 MPa. The experiments involved different amountsof rotation (shear displacement, Fig. 5a). Withincreasing shear displacement, the shear stress roseup to yield strength, which is the start of dominantgrain fracturing between 2.3–2.7 MPa for theseexperiments. The post-yield development was in twoparts, with an early (low-strain) history of gentleincrease in shear stress and general shear localization(seen in RT01, RT02, RT03, RT04, Fig. 5a) before theshear stress started to increase faster (as seen in RT04in Fig. 5a). Fig. 5b illustrates that the porosity changeduring the rapid increase of shear stress (up to2.7 MPa) is very small. In the first part of the post-yield evolution porosity decreased faster than in thesecond part (only observed in RT04). This changeindicates the onset of strong shear localization in thesand. The irregularities in the curves in Fig. 5a and bare probably related to uneven penetration of theknives into the specimen to transfer shear stress. Theanalysis of particle size distribution of thin sectionsfrom RT01, RT03, and RT04 reveals progressivelymore particle size reduction with increasing shearstrain (displacement), see Fig. 6. The shear zones inthe first three tests (RT01, RT02, and RT03) can beclassified as shear zones with diffuse boundaries. The
Fig. 3. Classification of shear zones based on BSE images from SEM study; (a) note the formation of a diffuse boundary shear zone at low level ofstress, seen in an example from RT02 and (b) sharp boundary shear zone at high level of stress, seen in an example from RT09.
42 A. Torabi et al. / Tectonophysics 437 (2007) 37–50
30

Autho
r's
pers
onal
co
pyshear zone in RT04 can be interpreted as a sharpboundary shear zone.
5.2. Effect of grain size
The ring-shear dataset enables the comparison ofsands with different grain sizes, since the sands em-ployed vary from medium-grained Bornholm sand inRT01, RT02, RT03, and RT04 via coarse-grained Born-holm sand in RT06 and RT13 to fine-grained Bornholmsand in RT05 (Table 1). Comparison of the results fromexperiments RT01, RT02, RT03, RT04, RT05, RT06,and RT13 shows no significant change in the frictionalcoefficient (ratio of shear stress to normal stress) of thesands with change in grain size at 5 MPa normalstresses; they show similar behavior for comparableshear displacements (Fig. 7a). However, increasing thedegree of rotation from test to test makes significantdifferences in the final grain size distribution. Similarly,when comparing particle sizes of RT03 and RT13,which were both run at 5 MPa and 75 degree rotation(i.e. 182.93 mm shear displacement), the results showsimilar grain size reduction for two different grain sizes
(Fig. 7b). Both of the shear zones can be defined ashaving diffuse boundaries.
5.3. Effect of loading
Normal stress prior to rotation creates irreversibledeformation due to compaction of the sand (Fig. 8a).
Fig. 5. (a) Shear stress versus shear displacement for RT01, RT02,RT03, RT04, which illustrate that with increasing shear displacement,shear stress rises up to yield strength (start of the grain crushing at 2.3–2.7 MPa). The post-yield has two parts, the first part has a gentler slope(yellow ellipse) than the second part (brown ellipse); the numbers inparentheses refer to normal stress in MPa, and rotations in degreesrespectively. (b) Porosity is approximately constant in pre-yield part ofthe experiments. The porosity reduction is faster in the first part of thepost-yield field.
Fig. 4. Sharp boundary shear zone in an example fromRT09; (a) Porosityvariation inside the sample presented on the petrographic image; themaximum reduction occurred in the middle of the shear zone (point 3);points 1 and 5 show approximate locations of top and bottom layers andpoints 2 and 4 show locations in upper and lower margins. (b) Particlesize analysis of the sample RT09, which shows EF (exceedencefrequency) versus PSA (particle size area). Note the particle sizereduction from outside the shear zone towards the middle of the shearzone. The shear zone is well layered and classified as a sharp boundaryshear zone. A power law fit represents the best fit on the curve with 95%confidence.
Fig. 6. Particle Size Area (PSA) versus Exceedence Frequency (EF) forshear zone samples from RT01 (45 degree, rotation), RT02 (60°),RT03 (75°), RT04 (360°), all loaded to 5 MPa but experiencingincreased rotation. The plot shows how increased rotation reduces theparticle size systematically. The numbers in parentheses refer tonormal stress in MPa, and rotation in degrees respectively.
43A. Torabi et al. / Tectonophysics 437 (2007) 37–50
31

Autho
r's
pers
onal
co
pyFurthermore, compilation of all of the experiments(Fig. 8b) shows that with increasing axial strain duringnormal loading prior to shearing, the porosity decreases,thus confirming compaction during normal loading.Once rotation is imposed and shear displacement startsto accumulate in the post-yield stage, fracturing be-comes more pronounced. Comparison of the test RT08(5 MPa, 450 degree rotation) with RT09 (20 MPa,75 degree rotation) and RT10 (20 MPa, 45 degreerotation), all run on fine-grained Baskarp sand (Fig. 9),show that at higher (20 MPa) normal stress, the yieldstrength increases to more than 10 MPa, and the shearzone becomes more localized. With further increase inshear displacement, the shear stress declines in RT09and RT10. Test RT08, on the contrary, shows a pro-nounced peak in its yield strength, which can be relatedto lower, imposed normal stress (5 MPa) and low initialporosity. This is in accordance with Kjelstad et al.(2002), who showed the effect of initial porosity on thebehavior of the same type of sand in direct shear ex-
periments. Further, RT08 shows that after reaching theyield strength, the shear stress drops to a stable level(residual strength), see Fig. 9.
6. Examples of natural shear zones
Small shear localizations that form as a result ofcompaction and shear in porous rocks in nature are
Fig. 9. Shear strength increases at higher normal stresses, comparisonbetween tests RT09, RT10 (20 MPa) and RT08 (5 MPa), all run onfine-grained Baskarp sand. The numbers in parentheses refer to normalstress in MPa, and rotation in degrees respectively.
Fig. 8. (a) Effect of initial loading, all the experiments showcompaction of the sand at the loading stage. (b) Effect of loading onporosity for all samples; with increase in axial strain the porositydecreases as a result of compaction. The numbers in parentheses refer tonormal stress in MPa.
Fig. 7. (a) Friction coefficient as a function of shear displacement forcoarse (sample from RT06 and RT13), medium (RT01, RT02, RT03,RT04), and fine (RT05) grained Bornholm sand. The plots suggestsimilarity in friction coefficient for experiments run at 5MPa. (b) Particlesize analysis for samples fromRT03 (mediumBornholm sand) and RT13(coarse Bornholm sand) both deformed at 5 MPa normal stress. Theyshow a similar distribution of the particle size reduction for the two tests.The numbers in parentheses refer to normal stress inMPa, and rotation indegrees respectively.
44 A. Torabi et al. / Tectonophysics 437 (2007) 37–50
32

Autho
r's
pers
onal
co
py
Fig. 10. Thickness and displacement relationship for natural deformation bands and experimental shear zones; the shear zones from ring-shearexperiments show approximately similar thickness but higher displacement than the natural single deformation bands, in this sense they are similar tothe deformation band clusters. Data from Gullfaks are from Fossen and Hesthammer (2000).
Fig. 11. (a) Petrographic image of the shear zone from thin sectionCorsica-3 (France). Note that, owing to the extensive flaking, the shearzone is classified as diffuse boundary shear zone. (b) Particle sizeanalysis of the sample, which shows particle size reduction in the shearzone. The power-law fit to the shear zone particle size distribution hasa low D value.
Fig. 12. (a) BSE image from thin section TM-4 (Sinai, Egypt). Noteboth flaking and splitting of the grains; the shear zone is classified asdiffuse boundary shear zone. (b) Particle size analysis of the sample,which shows particle size reduction in the shear zone. The power-lawfit to the shear zone particle size distribution has a low D value.
45A. Torabi et al. / Tectonophysics 437 (2007) 37–50
33

Autho
r's
pers
onal
co
py
called deformation bands (Aydin, 1978) or, more spe-cifically, compactional shear band (Schultz and Sid-dharthan, 2005; Fossen et al., in press). They have beenstudied throughout the world (e.g., Underhill andWoodcock, 1987; Fowles and Burley, 1994; Antonelliniand Aydin, 1999; Antonellini and Aydin, 1999; Fossenand Hesthammer, 2000; Lothe et al., 2002; Rawling andGoodwin, 2003). Comparison of natural deformationbands with the experimental shear zones presented herereveals that they have a similar mm- to cm-scale range inthickness (Fig. 10). On the other hand, most naturalexamples have maximum displacements of a few centi-meters, while created shear zones in ring-shear appara-tus have up to 100 cm displacement.
We have studied samples from faulted, porous sand-stones collected fromSinai (Egypt), Corsica (France), andUtah (USA). Most deformation bands in the database arenot easily comparable with the experimental shear zones,
however, there are similarities that are useful to highlightin a comparison. The differences can for example beascribed to the occurrence of cement that is found in mostreservoir sandstones. In order to avoid the effect ofcement, which is absent in the experiments, the degree ofcementation is small or negligible in the selected samples.Three thin sections were selected as examples due to goodsimilarity with experimental shear zones. Thin sectionCorsica-3 shows a deformation band in poorly consoli-dated, shallow marine, medium-grained sandstone, sam-pled in the damage zone of a normal fault in the Aleriabasin (Corsica, France). The sand is composed mainly ofquartz, some feldspar and rock fragments. The throw ofthe band is about 5 mm, and was formed at a maximumburial depth of about 100m. Thin sections TM-4 andWK-7 show deformation bands in a medium-grained fluvialsandstone sampled in the damage zone of the Tayiba Faultin Nubian Sandstone (eastern Suez Rift, Egypt) (Beach
Fig. 13. (a) BSE images from thin sectionWK-7 (Sinai, Egypt); which presents a more compacted part in the centre of the shear zone and two margins(comparable to upper and lower margins in ring-shear result) and hosts (comparable to top and bottom layers). The shear zone can be considered assharp boundary shear zone. (b) Grain size analysis of the thin section, which presents the grain size reduction from hosts to the shear zone; Note to thepower-law fit to the shear zone with a low D value.
46 A. Torabi et al. / Tectonophysics 437 (2007) 37–50
34

Autho
r's
pers
onal
co
py
et al., 1999). The Nubian sandstone contains more than90% quartz. The Tayiba fault has a throw of 120–150 m,whereas the deformation bands show throws of around1 cm. The maximum burial depth during the formation ofthese structures is almost 1.5 km (Sharp, personal com-munication). However, a somewhat shallower depth ispossible since the region was partly unroofed duringprogressive regional rifting.
Grain flaking is the dominant grain breakage mech-anism in Corsica-3 (Fig. 11a and b), as seen by largergrains surrounded by a very fine-grained matrix in thedeformation band. The band is dominated by two grainsizes and contains significant porosity. On the contrary, inTM-4 from Sinai, both flaking and splitting of grains areobserved. The combination of flaking and splitting resultsin a few larger grains surrounded by a finer-grainedmatrixwith a very heterogeneous grain size (Fig. 12a and b).Based on particle size analysis, the shear zones in theCorsica-3 and TM-4 are comparable to the diffuseboundary shear zones from the ring-shear experiments(Figs. 11a and 12a). WK-7 is zoned (Fig. 13a) and with asharp boundary to the host sandstone. The core containssome smaller particles surrounded by a heterogeneousmatrix, which is characteristic for combined flaking anddominant grain splitting, and the porosity is very low. Themarginal zones contain larger particles but otherwise amatrix similar to the core. In this case the porosity issignificantly higher. Study of the BSE images suggeststhat splitting is more pronounced than flaking. Grain sizeanalysis of WK-7 (Fig. 13b) confirms the presence of azoned shear zone with a central part of maximum grainsize reduction, i.e. similar to the sharp boundary shearzone from ring-shear experiments. Besides, the grain sizeanalysis of the shear zone from the thin sections show apower law distribution with low D values that, whencompared with experimental shear zones, fits a pattern ofgradual increase from 1.4 to 1.5 with higher stress(increasing burial depth and displacement).
When comparing the three examples of deformationbands, there seems to be an effect of burial depth. Near-surface faulting, as exemplified by Corsica-3, is domi-nated by flaking. At significant depth, represented byTM-4 and WK-7, grain splitting becomes pronouncedand contributes in combination with flaking to signif-icant grain size reduction. However, TM-4 and WK-7,which are from the same site, show clear differences.TM-4 is a diffuse boundary deformation band withoutzonation whereas WK-7 is a sharp boundary band that iszoned. As regards porosity, the band in TM-4 can becompared with the marginal zones of WK-7. Suchdifferences could be explained by, for example, differentburial depth during formation, since the region has
experienced progressive unroofing, or by differences inshear or localization processes, or the velocity of defor-mation might explain the difference between WK-7 andTM-4. We return to this discussion below.
7. Discussion
There are limitations in the ring-shear experimentsthat have an impact on their value for comparison withdeformation bands and faulted sandstone in nature. Forexample, the initiation of the shear zone is along apredefined plane, there is limited thickness of the con-fined sample inside the rings that hampers shear zonewidening, and no cement is present contrary to thegeneral observations from reservoir sandstones.
In the following, we first address the types of shearzones and the importance of grain characteristics iden-tified in the experiments, before comparing the ex-perimental shear zones with natural deformation bands.The latter is crucial in order to validate the experimentalresults before applying such results in reservoir models.According to the experiments reported here, the normalstress is the key factor that influences the type andthickness of shear zone, and the initial grain size is asubordinate factor. We conclude with a general discus-sion of grain size distribution, deformation mechanismsand porosity that can be expected in deformed sand andsandstone from different burial depths.
7.1. Formation of different type of shear zones
Two types of shear zones were observed in ourexperiments; (i) diffuse boundary shear zones and (ii)sharp boundary shear zones. Diffuse shear zones werealso reported by Mandl et al. (1977) and Agung et al.(2004) who produced layered shear zone structures inboth drained and undrained ring-shear tests at low normalstresses. Agung et al. (2004) divided the shear zone intothree layers: The compacted core and the adjacent zonesabove and below the core. The sharp boundary shearzones produced in the current experiments are previouslyunreported from ring-shear experiments run on naturalporous sand but they have been reported from theexperiments on crushed granite (Beeler et al., 1996;Scruggs and Tullis, 1998). They are similar to the zoneddeformation bands presented by Gabrielsen and Aarland(1990). They appear at higher levels of normal stress, asillustrated by experiments RT09 (Fig. 3b) and RT10 andare comparable with deeper burial depths as shown by thenatural deformation band in WT-7 (Fig. 13) and also athigh shear displacements according to the observationsfrom experiment RT04.
47A. Torabi et al. / Tectonophysics 437 (2007) 37–50
35

Autho
r's
pers
onal
co
py
Shear displacement affects the deformation mecha-nism. Fracturing of the grains becomesmore pronouncedwith increased rotation in the experiments at 5 MPa (e.g.experiment RT04). At the same time the shear zonebecomes more localized and strain hardened (Fig. 5a).This development can be directly linked to the formationof a sharp boundary shear zone (for example in RT04). Inmore detail, deformation progresses from the first part ofthe post-yield to the second part, representing a switchfrom early strain softening probably caused by crushingof the grains by either flaking or splitting in the yieldstage, to strain hardening related to interlocking of thecrushed grains in the shear zones followed by shearlocalization (Fig. 5a, b). At higher normal stress(20 MPa), the yield strength increases to more than10MPa (RT09 and RT10). In this condition, the mode ofgrain breakage is dominated by splitting rather thanflaking of the grains, which leads to more compaction inthe shear zone, seen as particle size and porosity re-duction. The shear zone at this high normal stress(20 MPa) can be defined as a sharp boundary shear zonewith a pronounced shear zone in the middle (Fig. 2b).
7.2. Effect of grain characteristics on deformation
Investigating the effect of grain size on frictionalbehavior of the sand (Fig. 7a) shows that initial grainsize has no influence on the deformation behavior at5 MPa normal stresses. According to Kjelstad et al.(2002), at normal stresses higher than 5 MPa, thestrength values of initially loose sands are very similarfor coarse-, medium-, and fine-grained mono-quartzsand. On the contrary, the effect of grain angularity andParticle Size Distribution (PSD) is important for thedeformation of granular materials, as documented byMair et al. (2002).and stability of a granular shear zone are sensitive tograin shape and Particle Size Distribution (PSD) duringshear zone evolution. The impact is identified for dif-ferent level of stress (5–25 MPa).
7.3. Comparison of experimental shear zones and naturaldeformation bands
The shear zones of the ring-shear experiments have amaximum thickness of 5 mm, which is approximatelysimilar to that found for natural deformation bands, butthe ring-shear experiments result in higher displace-ments (Fig. 10). Increasing the normal stress in theexperiments (similar to burial depth in natural examples)leads to thinning of the shear zone and localization ofstrain. In this light, the high-displacement experimental
shear zones can also be considered as analogues tosheared sand and sandstone in the core of faults. In thecomparison of deformation bands sampled in sandstonefrom Corsica and Sinai with the experimental shearzones, it becomes clear that the experimental shearzones do not perfectly reproduce the natural examples.This can mostly be ascribed to the presence of cement inreservoir sandstone and the space restrictions imposedby the ring-shear apparatus.
Evidence of grain reorganization and flaking similarto sample Corsica-3, reveals shallow cataclasis at lessthan 1 km depth and favors the formation of diffuseboundary shear zones. Flaking of sand grains has alsobeen observed in poorly consolidated sand in the RioGrande Rift (Rawling and Goodwin, 2003). Withincreasing burial depth, our observations indicate thatgrains start to break by splitting rather than flaking,thereby promoting cataclasis (TM-4). At higher stresslevels, sharp boundary shear zones form. At this stage,the deformation mechanism transgresses from predom-inantly flaking to predominantly splitting of the grains(e.g. the shear zone from sample WK-7 formed at about1.5 km depth). Furthermore, grain size analyses of shearzones from the thin section show a power law dis-tribution with low D values for all the three naturalsamples that fit a pattern of gradual increase of thedimension with higher stress (increasing burial depthand displacement).
7.4. Grain size distribution and deformation mechanism
In the present study, using different sands (quartzarenite) in the drained ring-shear experiments when(unlike the natural cases) there is no chemical alterationin the sample during deformation, the deformation ofquartz and feldspar grains are similar at low normalstress (5 MPa, less than 1 km burial depth). Hence,grains have been broken mostly by flaking of the grainsurfaces by abrasion, resulting in a low fractaldimension (1.4). With increasing burial depth(20 MPa, or more than 2 km burial depth), grains startto split. The change in the mode of fracturing fromflaking to splitting increases the fractal dimensiongradually. We conclude that the burial depth (normalstress in our experiments) and applied shear displace-ment are two significant factors influencing graincrushing and the resulting D values. Comparison ofour results with previous studies reveals that even at20 MPa normal stresses we do not reach the steady stateparticle size distribution (D∼2.58). We consider themechanism of deformation at shallow depth/low levelof stress to be dominated by reorganization, rolling and
48 A. Torabi et al. / Tectonophysics 437 (2007) 37–50
They show that frictional strength
36

Autho
r's
pers
onal
co
py
flaking and minor splitting of the grains. This mech-anism causes rough grain surfaces at the margins andwithin the shear zones, and produces a matrix of elon-gated grains surrounding surviving coarser grains. Atdeeper or at higher levels of stress the mode of fracturingtransgresses from predominantly flaking to predomi-nantly grain splitting, causing lower porosity values andincreased particle size reduction.
Rawling and Goodwin (2003) assumed that theirsamples at low confining pressure had not reached asteady-state particle size distribution (characterized lowD values of 1.7–2.1). Hence, with further deformationthe particle size distribution would change, perhapsresulting in higher D values. Further, this transitionresults in a slow increase in the D values.
At higher confining pressure and burial depth, therelative size of the individual grains becomes an im-portant factor influencing the grain fracturing (Sammiset al., 1987). At yet higher confining pressure, the thirdprocess of Blenkinsop (1991); (particle size reductiondue to cataclasis); is responsible for fragmentation whichis the development of cataclasis in a process of selectivefracturing of relatively larger particles. This may alsooperate during localization and faulting.
A power-law gives the best fit for particle size areadistribution of shear zones in this study. The power-lawdistribution is the only distribution that does not includea characteristic length scale. Thus it must be applicableto scale-invariant phenomena (Mandelbrot, 1982; Tur-cotte, 1997). A fractal distribution requires the numberof objects larger than a specified size to have a power-law dependence on the size (Turcotte, 1997).
The power-law distributions, which fall within thelimits of non-integer/fractional dimensions, i.e., 0bDb3,can be defined as fractals and clearly scale-invariant(Turcotte, 1997). The power dimensions from both theexperiments and natural examples are very low and sothey might be considered as fractional dimensions. Sincethe dominant flaking at low stress levels creates angularand non-similar grains, the term self-affinemight fit to thistype of fractal. The power-law distribution is a non-linearrelationship, which reveals that the obtained particle sizedistribution in the shear zones can be expressed by otherfactors, such as burial depth, stress levels at the time ofdeformation and strength of the grains.
8. Conclusions
Shear zones created in ring-shear experiments havebeen studied and compared with natural examples. Basedon this study, the shear zone has been divided into threelayers; (i) the “top layer”, representing the upper part; (ii)
the “shear zone” or the middle part; and (iii) the “bottomlayer” or the lower part of the section. The particle sizedistribution analysis shows that particle sizes are smallerin the middle part of the shear zone. The thin sections alsoshow the development of two end-member types of shearzones: (a) Shear zones with diffuse boundaries formed atlow levels of stress, and (b) Shear zones with sharpboundaries formed at higher levels of stress. We concludethat the burial depth (normal stress in our experiments)and the applied shear displacement are two significantfactors influencing grain crushing and the resulting Dvalues. We consider the mechanism of deformation atshallow depth/low level of stress to be dominated byreorganization, rolling and flaking of the grains. Thismechanism causes rough surfaces of grains at the marginsand within the shear zones. At higher burial depths orlevels of stress the fracturing mode transgresses frompredominantly flaking to predominantly grain splitting,causing lower porosity values and higher particle sizereduction. Further, this transition result in a slow increasein the grain size-distribution D values.
We conclude that initial grain size has no influence onthe deformation behavior of the sand at 5 MPa normalstresses. Comparison of experimental shear zoneswith thenatural ones shows similar thickness but differentdisplacements. Furthermore we presented comparableexperimental shear zones to the natural examples.
Acknowledgments
The ring-shear experiments were carried out as partof the Fault Seal Project managed by the ”NorwegianGeotechnical Institute” (NGI) between 2003 and 2006,which was supported by NGI, The Norwegian ResearchCouncil (NRC), Norsk Hydro ASA, and Total. Thepermission to use data and publish the results is greatlyappreciated. Professor Knut Bjørlykke (University ofOslo) advised in the course of the project. We appreciatethe experimental work that has been carried out by RaCleave, Elin Skurtveit, Lars Grande and Trude Ørbechat NGI. Thanks go to Egil Erichsen for help with theSEM analyses and also to Brian Anthony Farrelly for hisgreat help and kindness. This study was completed in theframe of Fault Facies Project at the Centre for IntegratedPetroleum Research, University of Bergen, and supportedby NRC, Statoil, Conoco-Philips, and Statoil-Vista.
References
Agung,M.W., Sassa,K., Fukuoka,H.,Wang,G., 2004. Evolution of shear-zone structure in undrained ring-shear tests. Landslides 1, 101–112.
Antonellini, M., Aydin, A., 1999. Outcrop-aided characterization of afaulted hydrocarbon reservoir: Arroyo Grande Oil Field, California,
49A. Torabi et al. / Tectonophysics 437 (2007) 37–50
37

Autho
r's
pers
onal
co
py
USA. Faults and subsurface fluid flow in the shallow crust. AmericanGeophysical Union 113, 7–26.
Aydin, A., 1978. Small faults formed as deformation bands insandstone. Pure and Applied Geophysics 116, 913–930.
Aydin, A., Borja, R.I., Eichhubl, P., 2006. Geological and mathemat-ical framework for failure modes in granular rock. Journal ofStructural Geology 28, 83–98.
Beach, A., Welbon, A.I., Brockbank, P.J., McCallum, J.E., 1999.Reservoir damage around faults: outcrop examples from the Suezrift. Petroleum Geoscience 5 (2), 109–116.
Beeler, N.M., Tullis, T.E., Blanoped, M.L., Weeks, J.D., 1996.Frictional behaviour of large displacement experimental faults.Journal of Geophysical Research 101 (B4), 8697–8715.
Bishop, A.W., Green, G.E., Garga, V.K., Andersen, A., Brown, J.D.,1971. A new ring-shear apparatus and its application to themeasurement of residual strength. Geotechnique 21 (1), 273–328.
Blenkinsop, T.G., 1991. Cataclasis and processes of particle sizereduction. PAGEOPH 136 (1).
Clausen, J.A., Gabrielsen, R.H., 2002. Parameters that control thedevelopment of clay smear at low stress states: an experimental studyusing ring-shear apparatus. Journal of Structural Geology 24 (10),1569–1586.
Cuisiat, F., Skurtveit, E., 2006. Large strain testing of fault seals. FinalReport on Fault Seal Project, NGI Repot No 2001288-3.
Fossen, H., Hesthammer, J., 2000. Possible absence of small faults inthe Gullfaks Field, northern North Sea. Journal of StructuralGeology 22 (7), 851–863.
Fossen, H., Schultz, R.A., Shipton, Z., Mair, K., in press. Deformationbands in sandstone — a review. Journal of the Geological Society(London), 164.
Fowles, J., Burley, S., 1994. Textural and permeability characteristicsof faulted, high porosity sandstones. Marine and PetroleumGeology 11 (5).
Gabrielsen, R.H., Aarland, R.K., 1990. Characteristics of pre-syn-consolidation structures and tectonic joints and microfaults in fine-to medium-grained sandstones. Rock Joints. Balkema, Amster-dam, pp. 45–50.
Garga, V.K., Sendano, J.I., 2002. Steady state strength of sands ina constant volume ring shear apparatus. Geotechnical TestingJournal 25 (4), 414–421.
Hvorslev, M.J., 1939. Torsion shear tests and their place in thedetermination of the shearing resistance of soils. Proc. Am. Soc.Test. Mater., vol. 39, pp. 999–1022.
Kjelstad, A., Chuhan, F., Høeg, K., Bjørlykke, K., 2002. Cataclasticshear band formation in sands at high stresses: An analogueexperimental model and its relevance for faults in sedimentarybasins. PhD Thesis, University of Oslo.
Lothe, A.E., Bjørnevoll Hagen, N., Gabrielsen, R.H., Larsen, B.T.,2002. An experimental study of the texture of deformation bands:effects on porosity and permeability of sandstones. PetroleumGeoscience 8, 195–207.
Main, I., Mair, K., 2001. Experimental constraints on the mechanicaland hydraulic properties of deformation bands in porous
sandstones: a review. In: Holdsworth, R.E, Strachan, R.A.,Magloughlin, J.F., Knipe, R.J. (Eds.), The Nature and TectonicSignificance of Fault Zone Weakening. Geological Society,London, Special Publication, vol. 186, pp. 43–63.
Mair, K., Fyre, K.M., M oren, C., 2002. Influence of grain characteristics onthe friction of granular shear zones. Journal of Geophysical Research 107 (B10).
Mair, K., Main, I., Elphick, S., 2000. Sequential growth of deformationbands inthe laboratory. Journal of Structural Geology 22, 25–42.
Mandelbrot, B.B., 1982. The Fractal Geometry of Nature. Freeman,San Fransisco.
Mandl, G., de Jong, L.N., Maltha, A., 1977. Shear zones in granularmaterial. Rock Mechanics 9, 95–144.
Marone, C., Scholz, C.H., 1989. Particle-size distribution andmicrostructures within simulated fault gouge. Journal of StructuralGeology 11 (7), 799–814.
Ngwenya, B.T., Kwon, O., et al., 2003. Permeability evolution duringprogressive development of deformation bands in porous sandstones.Journal of Geophysical Research 108 (B7), 2343.t1 doi:10.1029/2002JB001854.
Rawling, G.C., Goodwin, L.B., 2003. Cataclasis and particulate flowin faulted, poorly lithified sediments. Journal of StructuralGeology 25 (3), 317–331.
Sammis, C., King, G., Biegel, R., 1987. The kinematics of gougedeformation. PAGEOPH 125 (5).
Sassa, K., Fukuoka, H., Wang, G., Ishikawa, N., 2004. Undraineddynamic-loading ring-shear apparatus and its application tolandslide dynamics. Landslides 1, 7–19.
Schultz, R.A., Siddharthan, R., 2005. A general framework for theoccurrence and faulting of deformation bands in porous granularrocks. Tectonophysics 411, 1–18.
Scruggs, V.J., Tullis, T.E., 1998. Correlation between velocitydependence of friction and strain localization in large displacementexperiments on feldspar, muscovite and biotite gouge. Tectono-physics 295, 15–40.
Sperrevik, S., Gillespie, P.A., Fisher, Q.J., Halvorsen, T., Knipe, R.J.,2002. Empirical estimation of fault rock properties. In: Koestler, A.G.,Hunsdale, R. (Eds.), Hydrocarbon Seal Quantification. NorwegianPetroleum Society (NPF), Special Publication, vol. 11, pp. 109–125.
Turcotte, D.L., 1997. Fractals and Chaos in Geology and Geophysics.Cambridge University Press.
Underhill, J.R., Woodcock, N.H., 1987. Faulting mechanisms in high-porosity sandstones; New Red Sandstone, Arran, Scotland. In:Jones, M.E., Preston, R.M.F. (Eds.), Deformation of Sedimentsand Sedimentary Rocks. Geological Society Special Publication,vol. 29, pp. 91–105.
Zhang, S., Tullis, T.E., 1998. The effect of fault slip on permeabilityand permeability anisotropy in quartz gouge. Tectonophysics295 (1-2), 41–52.
Zhu,W.,Wong, T., 1997. The transition from brittle faulting to cataclasticflow. Journal of Geophysical Research 102 (B2), 3027–3041.
50 A. Torabi et al. / Tectonophysics 437 (2007) 37–50
38

PhD dissertation, A. Torabi, 2007
Paper 2 Rotevatn, A., Torabi, A., Fossen, H., and Braathen, A., 2007. Slipped deformation bands: a new
type of cataclastic deformation bands in Western Sinai, Suez Rift, Egypt. Accepted, Journal of
Structural Geology.
39

40

A. Rotevatn et al.
Slipped deformation bands: a new type of cataclastic deformation
bands in Western Sinai, Suez Rift, Egypt
ATLE ROTEVATN1,2, ANITA TORABI1,2, HAAKON FOSSEN2 & ALVAR BRAATHEN1,3
1 Department of Earth Science, University of Bergen, Box 7800, 5020 Bergen, Norway 2Centre for Integrated Petroleum Research, University of Bergen, Box 7800, 5020 Bergen,
Norway3 Now at: the University Centre in Svalbard, Box 156, 9171 Longyearbyen, Norway
Corresponding author: [email protected]
ABSTRACT
We describe a new type of cataclastic deformation band that features a central discrete
slip surface within separate, individual bands. This is unusual as slip surface
development is normally constrained to the eventual brittle failure of a deformation band
cluster zone due to strain hardening and sequential growth of deformation bands. The
bands also lack the zone of compaction that is known to encapsulate the cores of many
classical cataclastic deformation bands. Furthermore, the studied bands are thin, many
less than 1 mm wide, with measured offsets of up to 230 mm, surpassing those of
classical cataclastic bands by about one order of magnitude. Thin section and particle
size distribution analyses demonstrate that cataclasis in the bands is intense, particularly
in those that contain a central slip surface. However, petrophysical analysis demonstrates
that porosities inside the bands are, in contrast to classical cataclastic bands, relatively
high (9-32%). Nevertheless, permeability is reduced by up to 4.5 orders of magnitude
relative to that of the host rock. This is in excess of what is previously reported from
single cataclastic bands and indicate that the bands may represent baffles to fluid flow.
At the same time, the central slip planes may promote along-band flow, which may have
a positive effect on communication within a water or hydrocarbon reservoir.
We conclude that, unlike classical cataclastic bands, the bands of this study strain
soften during their evolution. Thus, they can accumulate higher strains than classical
cataclastic bands and are prone to be reactivated during progressive deformation. The
bands appear to have formed under conditions close to simple-shear, following an
evolution of (1) band nucleation by grain fracturing and crushing, (2) progressive
41

Slipped deformation bands
cataclasis, (3) nucleation of a central fracture, and (4) slippage along the fracture – the
end result is referred to as a ‘slipped deformation band’. Widespread background
intragranular fracturing of the host rock and relatively high porosity in the bands are
suggested as the most probable causes of deviation from traditional models for tectonic
deformation in high-porosity sandstones.
INTRODUCTION
A fundamental understanding of faulting in porous media is essential for structural
geologists working with the deformation of sedimentary rocks. The topic has been the
subject of keen interest, partly due to its relevance in water and, particularly,
hydrocarbon reservoirs (e.g. Antonellini & Aydin 1995, Hesthammer & Fossen 2001,
Shipton et al. 2002). Faulted silicilastic rocks require some special considerations, as
fault initiation and deformation mechanisms in highly porous rocks differ from those in
low- or non-porous rocks. Of particular interest is the fact that the pore space within the
rock volume facilitates some characteristic deformation processes. These include: (1)
rigid grain reorganization (granular flow) resulting in compaction, dilation or isochoric
strain; (2) grain fracturing/crushing (cataclasis) related to high stress concentrations at
grain contact points (e.g. Antonellini et al. 1994). The resulting structural elements are
generally referred to as deformation bands (Aydin 1978, also known as shear bands,
granulation seams and microfaults) – tabular-planar deformation structures along which
shear takes place.
Deformation bands differ from discrete fault surfaces in a number of ways.
Primarily, they do not exhibit a discrete and continuous slip plane (grain-scale micro-
fractures do however exist), but rather a shear zone of less than a few millimetres width,
across which displacement is distributed. They feature offsets on a millimetre to
centimetre scale, and lengths ranging from less than one to tens of metres. Single
deformation bands longer than 100 metres are rare. The displacement-length ratio of
(cataclastic) deformation bands may be up to three orders of magnitude larger than that
of faults (Fossen & Hesthammer 1997).
Classified by deformation mechanism (following Fossen et al. 2007), there are two
main types of deformation bands. One is known as disaggregation bands (e.g. Mandl et
al. 1977, Bense et al. 2003); a sub-type of these are known as phyllosilicate bands
42

A. Rotevatn et al.
(framework phyllosilicate bands of Knipe et al. 1997). Disaggregation bands form by
localized grain reorganization, but practically no grain crushing. This type of band is the
most common type of band at shallow deformation depths. The other type is referred to
as cataclastic bands (e.g. Aydin 1978, Aydin & Johnson 1983, Davis 1999), as grain
crushing or cataclasis is an important mechanism. Cataclastic bands are favoured by
high confining pressures (e.g. Fossen et al. 2007) and good sorting and rounding, which
produce high stress concentrations at grain contact points (Gallagher et al. 1974). In
simple terms, cataclasis is regarded as a common deformation mechanism in porous
sandstones having undergone faulting at depths greater than 1 km (e.g. Fisher & Knipe
2001). In this work we focus on cataclastic deformation bands that differ from those
described in the literature. Thus, in order to comprehend the differences appearing from
the descriptions below, we first take a look at what we in the current study refer to as
classical cataclastic deformation bands.
Classical cataclastic deformation bands
What is now considered the classical work on cataclastic deformation bands was
carried out in the Entrada and Navajo Sandstones of southern Utah by Aydin (1978).
Microstructurally, Aydin described the cataclastic deformation bands as 0.5 mm thick
zones of grain crushing encapsulated in a zone of compaction and grain reorganization.
Aydin and Johnson (1978) also presented a three-stage model for faulting in porous
sandstones: (1) nucleation and growth of an individual deformation band, (2) formation
of multiple deformation bands (cluster zones) due to strain hardening, and (3) the
breakthrough of a continuous slip surface in the cluster zone. It is important to notice
that slip surfaces in these rocks only occurs after the accumulation 10s or 100s of bands
in a decimetre to metre thick zone. The findings of Aydin (1978) and Aydin & Johnson
(1978) have later been supported by a number of field based studies, both from the same
rock units (Antonellini & Aydin 1995, Fossen & Hesthammer 1998, Davis 1999,
Davatzes & Aydin 2003, Shipton & Cowie 2003, Johansen & Fossen in press), and from
similar rock units in the western USA (Jamison & Stearns 1982, Sternlof et al. 2004),
Great Britain (Underhill & Woodcock 1987, Edwards et al. 1993, Beach et al. 1997), the
North Sea (Hesthammer & Fossen, 2001) and numerous other places. Furthermore,
experimental work gives additional support to their model (e.g. Mair et al. 2000, Lothe
et al. 2002).
43

Slipped deformation bands
Previous work has established that deformation bands can alter the effective
permeability of highly porous sandstones (e.g. Sternlof et al. 2004). For cataclastic
deformation bands of the type studied by Aydin and others (e.g. Aydin 1978, Aydin &
Johnson 1978, Aydin & Johnson 1983, Antonellini et al. 1994), the permeability
measured across a single deformation band can be reduced by several orders of
magnitude relative to that of an adjacent undeformed sample, with the greatest
reductions occurring in the most permeable sandstones. Some of the published data (e.g.
Antonellini & Aydin 1994, Fisher & Knipe 2001) indicate permeability contrasts of up
to 6 orders of magnitude, while others report lower values (Taylor & Pollard 2000). One
reason for the locally high contrast reported by some authors is that permeability has
been measured across multiple deformation bands, and a distinction between single and
multiple bands are generally not made in published data sets. According to our own field
data from localities in Utah (see discussion and figures therein), most single cataclastic
deformation bands have a permeability 0-3 orders of magnitude lower than the adjacent
host rock. The permeability reduction is due to the significant changes in porosity, pore-
throat geometry and pore connectivity caused by grain crushing and reorganization.
The current study is based on outcrops of faulted pre-rift sandstones in the
eastern flank of the late Oligocene to early Miocene Suez rift, in the Western Sinai
Peninsula, Egypt (Fig. 1). In this area we identified and investigated a type of cataclastic
deformation bands that seem incompatible with the classical bands described by Aydin
(1978) and others. In particular, they do not comply with Aydin and Johnson’s (1978)
model, where a cluster of deformation bands is formed before the formation of a slip
plane. Instead, the deformation bands described in this paper develop internal central slip
planes within far-apart individual deformation bands that are unrelated to deformation
band cluster zones. This study undertakes an investigation of these deformation bands,
and seeks to:
1. document and describe their geometry and structural characteristics;
2. measure and assess their petrophysical properties and potential effect on fluid
flow;
3. discuss how these deformation bands may have formed, and why they deviate
from the classical model for fault initiation in porous sandstones.
44

A. Rotevatn et al.
GEOLOGICAL SETTING
The Suez Rift is an aborted arm of the Red Sea rift system, forming a NW-SE trending
basin, c. 300 km long and c. 80 km wide, separating the Sinai micro-plate from the
African plate (Fig. 1a, e.g. Garfunkel & Bartov 1977, Lyberis 1988, Bosworth et al.
2005). The main phase of rifting occurred during the separation of the African and
Arabian plates from the latest Oligocene until its termination in the Miocene (c. 24 –
15.5 Ma). Termination of rifting relates to initiation of the Dead Sea–Aqaba transform,
which accommodates continued extension in the Red Sea rift (Cochran 1983). The Suez
rift is characterized by classical rift geometries featuring half-grabens and rotated normal
fault blocks (e.g. Moustafa 1993, Jackson et al. 2006). The current work is based on
outcrop studies along extensional faults in the eastern shoulder of the Suez Rift, c. 1.5
km into the footwall of the rift-bounding Thal Fault (Fig. 1), as described by Sharp et al.
(2000). Deformation bands in the Nubian Sandstone of the hangingwall and footwall of
these faults are the focus of this study. The term Nubian Sandstone (Shukri 1945) refers
to a regionally extensive succession of Cambrian to Early Cretaceous sandstones in the
NE African region (e.g. Bosworth 1995). In Sinai, the Nubian Sandstone comprises
predominantly non-marine fluvial sands, with a few marginal marine and aeolian
interbeds (e.g. Gupta et al. 1999). At the localities featured in this study they are mainly
fluvial. The maximum burial depth of the stratigraphic level of the study area at the time
of faulting is about 1.5 km (Du Bernard et al. 2002).
45

Slipped deformation bands
Fig. 1. Structural map of the Hammam Faraun fault block and surrounding areas. The localities of the
current study are indicated. Based on Moustafa (1993), Sharp et al. (2000) and Jackson et al. (2006).
46

A. Rotevatn et al.
FIELD DATA AND RESULTS
Localities and field methods
We focus on two localities, at which a large number of deformation bands were
examined. Both localities are found NE of the Hammamm Faraun fault block, along
extensional faults that probably formed coevally with the larger Thal Fault. At both
localities, the Nubian Sandstone comprises the hangingwall and footwall of the
extensional faults.
At locality 1 (Wadi El Khaboba; Fig. 1) a NW striking fault displays an offset of
c. 15 m; the sense of slip is normal, with a small sinistral strike-slip component. The
fault core is characterized by a 5-15 cm thick zone of cataclasites derived from
sandstones in the hangingwall and footwall, encapsulated by a 30-100 cm thick zone
with a very high density of anastomosing cataclastic deformation bands. Several discrete
slip planes in the core accommodate the majority of fault displacement. The studied
deformation bands are found in the damage zone (Fig. 2) of this fault, c. 1-30 m away
from the fault core.
Fig. 2. Damage zone profile from locality 1 in Wadi el Khaboba. The structure frequency profile records
the number of deformation bands per metre against distance from main fault. The equal area stereo net
shows that the bands (black great circles) strike sub-parallel to the main fault (red great circles) and thus
are related to its formation.
47

Slipped deformation bands
At locality 2 (Wadi El Iseila; Fig. 1), there are two faults affecting the Nubian
Sandstone (Fig. 3). The largest fault strikes WSW and has an offset of c. 150 metres.
The studied outcrop is 150-200 metres into the footwall of this fault. There is also
another smaller, but, for the studied outcrop, more influential fault, striking S with an
offset of c. 15 m. This fault features a c. 1.2 m thick core comprising a c. 30 cm thick
cataclasite, and a c. 90 cm thick zone of anastomosing deformation bands, displaying
ladder and fishnet geometries (Davis 1999, Schultz & Balasko 2003). As on the previous
locality, several discrete slip surfaces in the fault core have accommodated most of the
fault displacement. The studied deformation bands are located 5-30 metres into the
hangingwall of the latter fault.
As the lithology and deformation bands at the two localities are very similar, we
will not differentiate between the localities in the following, but treat them as one.
Numerous deformation bands were identified and recorded in the damage zones of the
main faults, the results of which are outlined below. Basic field methods were applied:
compass, measuring tape and GPS were used to record orientations, offsets, thicknesses,
spatial relationships and positioning. Furthermore, a mini-permeameter was used to
collect permeability data, and samples for thin sections and laboratory analysis of
petrophysical properties were collected.
Fig. 3. Equal area stereo net showing
the orientation of deformation bands
and faults at locality 2 in Wadi El
Iseilat. The largest fault in the area is
plotted as red great circles. The
smaller but, for the studied outcrop,
closer and more influential fault is
plotted as green great circles. Black
great circles represent deformation
bands.
48

A. Rotevatn et al.
Host rock
The host rock at both localities is fluvial sandstone from the Jurassic to Early
Cretaceous Malha Formation (Abdallah & El Adindani 1963) of the Nubian Sandstone
succession. Grain sizes vary from medium to very coarse sand, and the stratigraphic
units feature well preserved cross-stratification. The host rock is very loose, which may
partly be a result of weathering, but largely a result of poor consolidation. The latter is
common for sandstones at shallow burial depths, which may be relatively loose and
friable at burial depths down to 2.5-3 km (Bjørlykke & Egeberg 1993). Thin sections
confirm only minor effects of burial diagenesis (Fig. 4a). Dissolution has occurred at
some grain contacts but is not abundant. Cementation is practically non-existent,
consistent with the shallow (~1.5 km) burial depths that the Nubian Sandstone has
experienced in this area; quartz cementation occurs mainly at temperatures in excess of
90 °C (Walderhaug, 1996) or at depths in excess of 3.5 km (Bjørlykke & Høeg 1997).
Grain fracturing, however, is widespread in the host rock (Fig. 4b), particularly in
coarse-grained sandstone layers. The degree to which grains are affected by fracturing
varies from single fractures to complete grain breakdown. Grain fracturing is laterally
relatively uniform within layers of similar grain size, but is in some thin sections seen to
increase in intensity near the deformation bands.
Fig. 4. Photomicrographs of host rock samples. Note that grain fracturing is abundant.
49

Slipped deformation bands
Deformation bands in the field
The deformation bands observed in the current study (referred to as Sinai bands in
the following) display characteristics that are both similar and different from classical
cataclastic deformation bands (CCDB). The bands are recognized as cataclastic
deformation bands based on three criteria: 1) Displacement is detectable and on a mm to
cm scale; 2) displacement is accommodated in a mm-thick, white coloured shear zone;
3) in the thin zone of shearing, grain size reduction is detectable by eye or hand lens, and
further confirmed by thin section analysis and SEM images (see below). Although these
criteria match those of CCDB, the Sinai deformation bands display other characteristics
that are not compatible with CCDB. Most notably, many of the deformation bands
feature slip planes within widely spaced individual bands that are not associated with
deformation band clusters (Fig. 5). Deformation bands without slip surfaces were also
identified, and the following visual subdivision was made in the field: 1) deformation
bands with no visible fracture- or slip plane (Fig. 6a); 2) deformation bands with a
visible central fracture (Fig. 6d); 3) deformation bands featuring a central fracture with
visible slickenlines (Fig. 6g). The fracture planes and slip planes seen in some of the
deformation bands were of varying continuity, ranging from patchy cm-scale
occurrences to completely continuous along much of the strike of the deformation band
(Figs. 6d and 6g).
50

A. Rotevatn et al.
Fig. 5. Picture from the studied outcrop at locality one showing three individual deformation bands
(indicated by arrows), all of which feature central slip planes. The inset shows a hand specimen taken from
one of the deformation bands, where the slip plane is clearly visible. The scale bar on the inset is in
centimetres.
51

Slipped deformation bands
Fig. 6. Field photos and photomicrographs of deformation band samples collected in the field. (a-c)
Deformation bands without fracture/slip surface. (d-f) Deformation bands with a central fracture but no
slickenlines. (g-i) Deformation bands with a central slip surface with slickenlines.
52

A. Rotevatn et al.
Offset and thickness
The studied deformation bands feature thicknesses similar to or slightly less than
CCDB (Fig. 7), the mean thickness of the bands being 0.8 mm (Table 1). Offsets are
larger than those known for CCDB, the maximum offset recorded being 230 mm and the
mean offset being 21 mm (Table 1). There is no strong correlation between offset and
thickness, which is typical for cataclastic deformation bands. The thickness of the Sinai
bands remains stably at around 0.8 mm for most bands, regardless of the amount of
offset. However, the Sinai data indicate a correlation between the amount of offset and
the development and growth of a central slip surface. Where the offset is less than c. 15
mm there is a mix of bands with no slip plane, bands with fracture planes but no
slickenlines and bands with slip planes featuring slickenlines. Where offset exceeds c. 15
mm however, practically all bands feature slip planes with slickenlines (Fig. 7). It thus
appears that beyond this value, displacement is no longer accommodated by cataclastic
shear, but rather accommodated by slip along a discrete slip surface.
Fig. 7. Log-log plot of displacement versus thickness of deformation bands. Three series of field
measurements from Sinai are plotted: Deformation bands with no fracture plane, deformation bands with a
central fracture but no slickenlines, and deformation bands with a central slip plane with slickenlines. In
53

Slipped deformation bands
addition, two series from Utah (unpublished) are plotted, from the Navajo Sandstone and the Entrada
Sandstone, respectively.
Fig. 8. Thin section of slipped deformation band showing severe crushing near the slip surface, indicated
by arrows.
_____________________________________________________________________________________
Fig. 9 (opposite). Results from statistical analysis of particle size distribution obtained from Backscattered
Electron images (BSE). Log EF (exceedence frequency) is plotted against log PSA (particle size area). (a-
d) Deformation bands with no visible fracture. (e-h) Deformation bands with a central fracture. All of
these, except (e), feature visible slickenlines.
54

A. Rotevatn et al.
55

Slipped deformation bands
Cataclasis and grain size distribution
The cataclastic cores of the bands in the current study exhibit grain crushing
ranging from mild grain breakdown to extremely intense cataclasis (Fig. 6). The most
intense grain crushing is observed in bands containing a central fracture- or slip surface
(Fig. 8). This is supported by statistical analysis of particle size distribution obtained
from Backscattered Electron images (BSE) using image processing methods (Torabi et
al. 2007).
The results are presented graphically in Fig. 9, where plots of log EF vs. log
particle size areas (PSA) have been investigated. Exceedence Frequency (EF) of a
particular value of a measured variable is defined as the number of data with values
greater than that value, divided by the total number of the data. In each of the examined
thin sections, images of the host rock outside of the band as well as the band itself have
been investigated. The particle size distribution plots show that, for all of the analysed
samples, there is a reduction of grain size in the bands relative to the host rock. The
kinked or curved appearance of most host rock particle size distribution plots are
different from the straight lines or curves with straight central segments seen in the
deformation band particle size distribution plots. This is typical of cataclastically
deformed sand (e.g. Sammis et al. 1987). In these cases the particle size distribution of
the bands can be described by a power law with dimension D (exponent). The calculated
two-dimensional D can be converted to the third dimension by adding 1 (Sammis et al.
1987, Blenkinsop 1991, Torabi et al. 2007). The value of the three-dimensional D is
presented in table 2.
56

A. Rotevatn et al.
Particle size distribution plots from the margin of the deformation bands show
distributions intermediate between those of the host rock and the band (Fig. 9 d, h). In
general, there is a positive correlation between the value of D and the intensity of
cataclasis: high D-values indicate strong cataclasis. The bands hosting a central slip
plane feature the highest D values (2.09-2.39) and thus have undergone the most intense
cataclasis (Table 2). Nevertheless, there are still some unbroken large grains in many of
the bands (Fig. 6h). The intensity of the cataclasis is lower in the bands without a central
slip surface (D=1.49-1.72) than in those containing slip surfaces (Fig 6 and 9, table 2).
Bands with the least intense cataclasis, i.e. where the grain breakdown is mild and
limited, appear to have undergone much less deformation and are thus labelled incipient
bands (Fig. 10). These are bands that do not host a central fracture- or slip surface. The
relationship between these incipient bands and more mature bands will be addressed
further in the discussion.
Fig. 10. Photomicrograph of
incipient deformation band.
Incipient deformation bands
represent the earliest stage of
development for the studied
deformation bands.
57

Slipped deformation bands
Fig. 11. (a) Photomicrograph showing typical deformation band architecture of the bands in the current
study. Note that there is a cataclastic core, but no surrounding compactional envelope. (b) Architecture of
a classical cataclastic deformation band with a cataclastic core and a zone of compaction enveloping the
core. This photomicrograph is from the Navajo Sandstone in Utah, and is modified from Fossen and
Gabrielsen (2005).
Architecture
The core of classical cataclastic deformation bands is known to be encapsulated in
a zone of compaction and grain reorganization (Aydin 1978). However, the bands in the
current study feature no such zone of compaction (Fig. 11). Instead the bands display a
sharp transition between undeformed host rock and the cataclastic core. The transition is
sharpest across bands that contain a central slip plane, as the cataclasis is most intense
here.
The slip surfaces themselves are easy to identify as discontinuities within the
cataclastic core of the band (Fig. 6i). Most slip surfaces do not appear as open fractures
in thin section. However, precipitated black minerals (probably iron oxides and/or
58

A. Rotevatn et al.
hydroxides, Fig. 12) provide evidence for palaeo-fluid flow and precipitation along the
slip surfaces.
Fig. 12. Photomicrographs of deformation bands hosting a central slip surface with slickenlines. Note the
black precipitated minerals (probably ferric oxides) in the centre of the bands, which we interpret as
evidence for palaeo-fluid flow in along the slip surfaces.
PETROPHYSICAL PROPERTIES
Methods
Porosity and permeability measurements have been carried out using different
field-, laboratory- and image analysis techniques. For porosity, image analysis
techniques using optical microscopy for host rock samples and SEM imagery for
deformation band samples were applied (see Appendix A for details). A total of 44
porosity determinations using this technique were conducted on a selection of thin
sections from collected hand samples. Eleven of these were host rock thin sections and
59

Slipped deformation bands
33 thin sections with deformation bands. In addition to this, one sample was analysed at
ResLab Reservoir Laboratories in Stavanger, Norway, where helium porosity by Boyle’s
law technique was determined (see Appendix A for details).
For permeability, a combination of mini-permeameter field measurements and
laboratory experiments were applied. The laboratory measurements were conducted at
ResLab Reservoir Laboratories, determining the Klinkenberg-corrected gas permeability
(Klinkenberg 1941) by the steady state technique (see Appendix A for details). Eight
core plugs, drilled and sampled in the field, were analyzed using this method. Of these, 2
were host rock samples, 2 were samples with single bands with slip surface and 4 were
samples taken from slip surfaces along the main fault in locality 1. In addition to this,
measurements were conducted in the field using a TinyPerm II Portable Air
Permeameter (mini-permeameter) manufactured by New England Research (see
Appendix A for details). Permeabilities from 43 sample locations in the field were
determined using this method. Of these were 8 host rock, 10 bands with no slip surface,
5 bands with fracture plane but no visible slickenlines, and 20 bands hosting a slip
surface with slickenlines.
Porosity
The results from the porosity determinations are shown in Fig. 13. The data are
organized by type of sample: host rock, incipient bands, bands without slip surface and
bands with a central slip surface.
The data show that host rock porosity and porosity of incipient bands fall within
approximately the same range of values (21-35% for host rock samples and 24-35% for
incipient bands). This is in agreement with observations from thin sections (Fig. 10),
which show that porosity is relatively unchanged in such bands. However, the
populations of deformation bands without and with slip surfaces, fall within a relatively
lower range of porosity values (10-26% and 9-32%, respectively), although there is
overlap with host rock and incipient band porosities. The large variations of porosity
values within the deformation bands are probably explained by differences in amount
and localization of cataclasis in the bands. For one of the samples, a porosity profile
across a deformation band (featuring a central slip surface) was made (Fig. 14). The
profile shows a porosity drop across a band from the host rock, via the margin to the
60

A. Rotevatn et al.
centre of the cataclastic core. However, porosity in the bands is surprisingly high
(lowest value being 9%) when compared with other studies of cataclastic deformation
bands (Fig. 13). The implications of this are addressed in the discussion.
Fig. 13. Porosity data for deformation bands of the current study compared to data from Aydin (1978) and
Antonellini and Aydin (1994).
61

Slipped deformation bands
Fig. 14. Porosity profile across a single cataclastic deformation band. The geometry of the extrapolation
curve between data points is inferred from thin section studies, which indicate abrupt transitions in grain
size from host rock to deformation band.
Permeability
Permeability results from laboratory and mini-permeameter measurements are
shown in Fig. 15. The results are separated according to sample type: host rock, bands
with no visible fracture, bands with a visible central fracture but no slickenlines, and,
finally, bands hosting a central slip surface with slickenlines. In addition, a population of
laboratory measurements from main fault slip surfaces at locality 1 is shown. Incipient
bands have not been tested for permeability due to difficulties excavating a surface
suitable for mini-permeameter measurements. Furthermore, samples of incipient bands
for laboratory determination of permeability were too loose to be fit for analysis. All
measurements represent permeability of flow across the band. Band-parallel
permeability was not measured.
The permeametry data reveal a distinctly reduced permeability in all bands relative
to the host rock. The host rock permeability values range from 4000 to 53000 mD with a
mean of 13000 mD. These values are extremely high and probably inaccurate due to the
mini-permeameter’s limitations in resolving permeabilities above 10000 mD. However,
note that the laboratory measurements fall within the range of the mini-permeameter
measurements. We therefore consider the measured values to be sufficiently accurate for
62

A. Rotevatn et al.
comparative purposes. The different types of bands feature permeability values 1.5 to
4.5 orders of magnitude lower than those of the host rock. Deformation bands without
any fracture- or slip surface display permeability values between 13.7 mD and 64.3 mD,
with a mean of 31.1 mD. The bands with a central fracture but no slickenlines fall within
the range of 4.0-26.2 mD, with a mean of 14.6 mD. Finally, the bands hosting a central
slip plane with slickenlines display permeabilities of 1.7 to 22.1 mD, with a mean of 7
mD. Hence, there is an increase in permeability contrast (relative to the host rock) from
bands with no fracture development (1.5 to 3.5 orders of magnitude), via bands with a
central fracture but no slickenlines (2 to 4 orders of magnitude), to bands with a central
slip surface with slickenlines (up to 4.5 orders of magnitude). A permeability reduction
of 1.5 to 4.5 orders of magnitude is within the high range of our own and previously
published data for deformation band permeability (see Fig. 16 and e.g. Antonellini &
Aydin 1994, Ahlgren 2001, Fisher & Knipe 2001, Lothe et al. 2002). Mini-permeameter
measurements of slip planes in the core of the main fault at locality 1 record a lower
permeability reduction of approximately 1.5-2.5 orders of magnitude.
Fig. 15. Deformation band permeability data. Open data points indicate laboratory measurements of
permeability, whereas the filled points are mini-permeameter measurements. See text for details.
63

Slipped deformation bands
Fig. 16. Permeability contrast data from the current study (bands with central slip surface) plotted together
with our own data from single deformation bands (CCDB) in Utah (unpublished).
DISCUSSION
The deformation bands examined in this work occur in highly porous sandstones
and are visually very similar to classical cataclastic deformation bands (CCDB).
Furthermore, grain comminution is an important deformation mechanism at the
microscale, and none of the bands accumulate large (metre-scale) displacement.
However, detailed investigation reveals differences that are significant (Table 3). The
64

A. Rotevatn et al.
Sinai bands deviate from CCDB in several aspects. Firstly, they lack a grain compaction
envelope around the cataclastic zone and, secondly, they exhibit more pronounced
cataclasis. However, the most outstanding difference occurs when a central fracture
forms in the bands, which localizes most of the subsequent strain accumulation to a zone
that is narrower than the original band (see below for the reasoning behind this temporal
relationship). At this point, the life of the deformation band as such is over, and it is
converted into a slipped deformation band. The ensuing discrete slip explains why Sinai
bands have accumulated more offset (we have recorded offsets up to 230 mm) than
CCDB, which die after accumulating 3-4 cm offset at the most.
The development history of the deformation bands described in the current study
can be inferred from the interpretation of different developmental stages, based on the
thin sections. The least developed and most pristine bands are the so-called incipient
bands (Fig. 10). Cataclasis is mild and there is no porosity reduction (Fig. 13). Only
initial deformation appears to have taken place. This stage is followed by bands with
pronounced cataclasis but no fracture plane/slip surface (Fig. 6a-c), and, finally, by
bands with a central fracture- or slip surface (Fig. 6d-i). We believe that these represent
increasingly progressed stages of the evolution of the Sinai bands. We suggest the
following model for the evolution of deformation bands in the localities studied here:
1. Scattered grain crushing due to vertical loading (compaction).
2. Nucleation of a cataclastic deformation band. Mild cataclasis, no porosity
reduction (incipient band).
3. Progressive shear and cataclasis. The band now displays pronounced cataclasis.
Porosity is mildly reduced but still relatively high.
4. Progressive shear, cataclasis and nucleation of a fracture plane in the centre of
the band. The fracture nucleates in patches along the band (Fig. 6d), which
gradually propagate and coalesce until the fracture is continuous along the
entirety of the band (Fig. 6g). No significant further reduction of porosity.
5. Discrete slip along the fracture plane. Slickenlines form. Extreme cataclasis
develops near the slip surface (Fig. 8). No significant further reduction of
porosity.
65
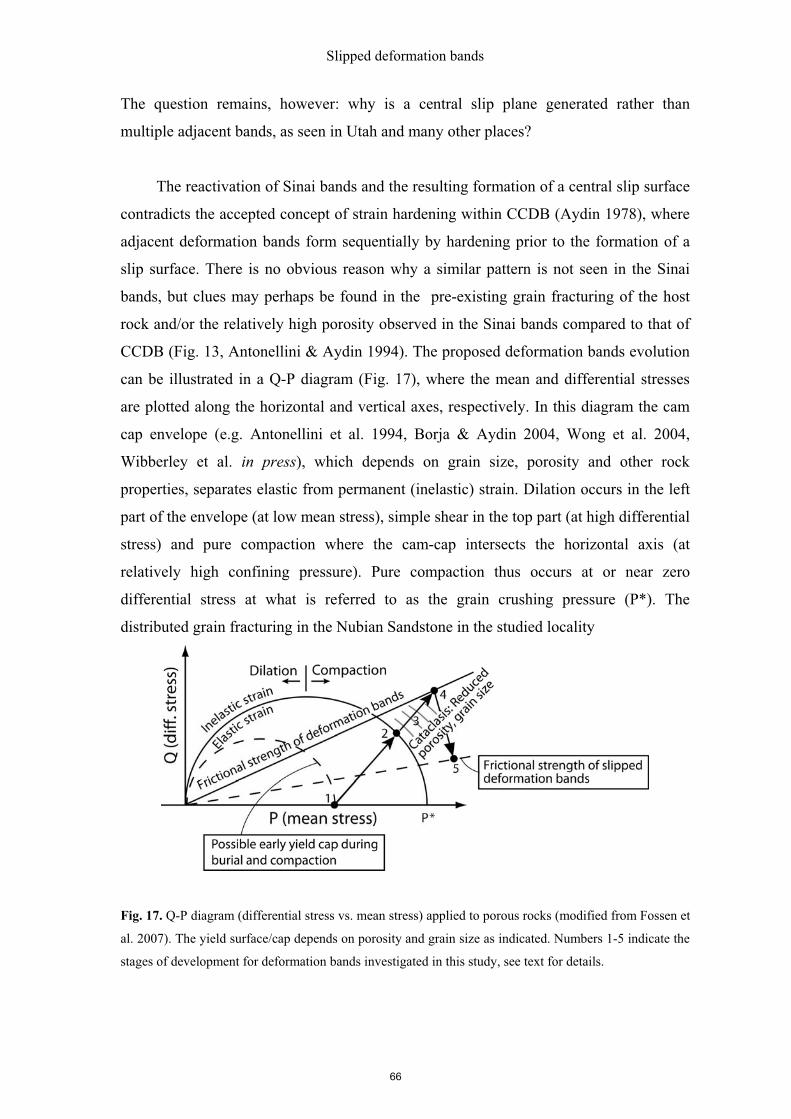
Slipped deformation bands
The question remains, however: why is a central slip plane generated rather than
multiple adjacent bands, as seen in Utah and many other places?
The reactivation of Sinai bands and the resulting formation of a central slip surface
contradicts the accepted concept of strain hardening within CCDB (Aydin 1978), where
adjacent deformation bands form sequentially by hardening prior to the formation of a
slip surface. There is no obvious reason why a similar pattern is not seen in the Sinai
bands, but clues may perhaps be found in the pre-existing grain fracturing of the host
rock and/or the relatively high porosity observed in the Sinai bands compared to that of
CCDB (Fig. 13, Antonellini & Aydin 1994). The proposed deformation bands evolution
can be illustrated in a Q-P diagram (Fig. 17), where the mean and differential stresses
are plotted along the horizontal and vertical axes, respectively. In this diagram the cam
cap envelope (e.g. Antonellini et al. 1994, Borja & Aydin 2004, Wong et al. 2004,
Wibberley et al. in press), which depends on grain size, porosity and other rock
properties, separates elastic from permanent (inelastic) strain. Dilation occurs in the left
part of the envelope (at low mean stress), simple shear in the top part (at high differential
stress) and pure compaction where the cam-cap intersects the horizontal axis (at
relatively high confining pressure). Pure compaction thus occurs at or near zero
differential stress at what is referred to as the grain crushing pressure (P*). The
distributed grain fracturing in the Nubian Sandstone in the studied locality
Fig. 17. Q-P diagram (differential stress vs. mean stress) applied to porous rocks (modified from Fossen et
al. 2007). The yield surface/cap depends on porosity and grain size as indicated. Numbers 1-5 indicate the
stages of development for deformation bands investigated in this study, see text for details.
66

A. Rotevatn et al.
indicates that the state of stress in the sandstone was close to P*. This abundant grain
fracturing must have been caused by the weight of the overburden. We suggest that the
local grain crushing pressure (P* in Fig. 17) was reached at some pre-deformation band
stage, although unequivocal evidence for this is not found. Although not a common
feature for sandstones at shallow burial depths, experimental work has demonstrated that
such fracturing may occur at low stresses (2-6 MPa, Chuhan et al. 2002). Interestingly,
experiments in the same study have also shown that microfractures can form during
compaction. These microfractures are not visible under the microscope. Such fractures
cause a general weakening of the sandstone that promotes cataclasis. Yet, pervasive
grain fracturing is more common at higher stresses, which at shallow depths could be
promoted by low pore pressures (Wong & Baud 1999, Baud et al. 2000). Furthermore,
the large host rock grain sizes are more prone to grain fracturing than their fine-grained
equivalents at low stresses (lower than 5 MPa, Chuhan et al. 2002). A combination of
these effects may thus have been at work to achieve the level of background grain
fracturing seen in the host rock.
We speculate that pre-existing grain fractures may promote cataclasis as
differential stress builds up and deformation bands form (stage 2 above and in Fig. 17).
The grain fractures represent micro-discontinuities that weaken the rock locally, and
therefore represent locations where deformation bands can nucleate and grow, especially
if the micro-fractures are orientated favourably relative to the applied stress. As
cataclasis is a process of grain fracturing, a cataclastic deformation band is essentially a
compilation of micro-fractures. In CCDB, stress concentration at the contact point of
unfractured grains is allowed to build up until eventually causing failure. Although this
is clearly also the case for the bands in Sinai, we believe that the background fracturing
of the host rock grains may have had two important effects that make these bands
different: 1) the grains fail earlier and without a preceding phase of shear-induced
compaction (which is not to be confused with the burial compaction that caused the
background grain fracturing seen in the host rock); 2) upon failure, inter-granular
fractures grow faster and may have a preferred orientation as fracture growth may follow
preferentially orientated intra-granular grain fractures. Thus, shear-induced cataclasis
(stages 2-3 above and in Fig. 17) may progress faster and be more severe than what
would be the case for a CCDB for the same applied stress. Furthermore, if inter-granular
fractures attain a preferred orientation parallel to the band, it may strongly contribute to
67

Slipped deformation bands
local weakening within the band. Hence, the band becomes susceptible to brittle failure
and forms a through-going slip surface (stage 4-5 above and in Fig. 17).
Another aspect of rapidly progressing and intense cataclasis is the rapid reduction
to very small grain sizes within the band (see e.g. Fig. 9f and 9g). This implies more
grains from breakdown of larger grains, and also more grain fracture surfaces. This
would aid the nucleation and propagation of a central fracture within a band, since: there
are more grain fractures available for amalgamation to a fracture surface. Evidence for
the high-intensity cataclasis is found in the particle size distribution data and the
magnitude of the three dimensional power law dimension D. As previously mentioned,
the high values of D (2.09-2.39, Table 2) recorded in the bands with slip planes indicate
that the cataclasis is severe. If compared to Particle size distribution plots from CCDB in
the damage zone of the Bartlett Fault, SE Utah (Fig. 18, D= ~1.4-1.5), the value of the
three dimensional D is evidently much higher in the Sinai bands containing slip surfaces
than in the Utah bands. Thus, the cataclasis is significantly less severe in CCDB from
the Bartlett Fault than that of the slipped deformation bands in the current study.
However, for Sinai bands without a central fracture/slip surface, the D values (1.49-1.72)
are comparable, although slightly higher, to those from the Bartlett fault.
68

A. Rotevatn et al.
Porosity is another factor that may have an effect. Higher porosity affect the cam
cap envelope and may lower the critical pressure required for failure (Fig. 17, Schultz &
Siddharthan 2005, Fossen et al. 2007). Hence, the high porosity within the bands may
cause the Sinai bands to be more susceptible to subsequent brittle failure than CCDB.
The CCDB, undergoing much more syn-kinematic compaction to the point of complete
destruction of porosity, will increase the required critical pressure for subsequent failure
(reactivation) and thus strain harden. As the Sinai bands preserve porosity to a larger
degree, they have not strain hardened to any significant extent. Thus, the combined
effect of preserved porosity and the presence of intra-granular fractures in the host rock
make the Sinai bands represent zones of weakness after initial failure.
The porosity difference between Sinai bands and CCDB furthermore suggests that
dissimilar modes of deformation are involved in their formation. Whereas CCDB form
during compactional shear (resulting in very low porosity), the relatively high porosity
in the Sinai bands indicate that they were formed by a mode closer to simple shear. This
Fig. 18. Particle size distribution
data from two deformation bands
in the damage zone of the Bartlett
Fault, Utah (unpublished). Note
that for deformation band
CCDB1, two values of the power-
law dimension D have been
calculated, one for the entirety of
the data series (D1), and one for
the steepest segment (D2).
69

Slipped deformation bands
also explains why there is no compaction zone enveloping the cataclastic zone. To our
knowledge, no record exists of cataclastic deformation bands having formed by
isochoric simple shear.
The permeability data presented in this paper are, as previously mentioned, in the
upper range of our own and previously published petrophysical data for CCDB (Fig. 16).
There are systematic variations, however, with a gradual increase in permeability
contrast (relative to matrix permeability) from bands with no slip plane through to bands
with fully developed slip surfaces. Permeability contrast also increase with the severity
of the cataclasis affecting the same bands. The progressive cataclasis and the associated
destruction of pore connectivity, explains the stepwise increase of the permeability
contrast described above. Additionally, slip surface wall rocks make efficient sealing
membranes, bringing the permeability contrast to a maximum where they are present.
The recorded permeability data have implications for fluid flow. Should such
deformation bands occur in a subsurface reservoir, they would represent potential baffles
to flow, even more so than CCDB. What is not captured by our permeability
measurements, however, is the effect of intra-band slip surfaces on flow parallel to the
band. The slip surfaces may represent fractures along which fluids can flow. Because of
this, their impact on reservoir performance is likely to be significantly different to that of
CCDB. Whereas CCDB generally reduce permeability and is considered negative in a
reservoir setting, bands with slip planes, although baffles to band-normal flow, represent
potential conduits for band-parallel flow. Depending on the continuity and
interconnectedness of such bands, they might actually have a positive effect on reservoir
communication.
SUMMARY AND CONCLUSIONS
A new type of cataclastic deformation bands has been presented. Based on the collected
data and field observations, we draw the following conclusions:
1. The cataclastic deformation bands (CCDB) described in this work are different
from classical cataclastic deformation bands described in the existing literature
(e.g. Aydin 1978). The Sinai bands are characterized by intense cataclasis,
70

A. Rotevatn et al.
relatively little compaction, strain weakening and, in many cases, discrete slip
along a central slip surface. The bands are thought to have formed under near
simple shear conditions.
2. A stepwise model for the evolution of the studied deformation bands has been
suggested and is laid out in detail in the previous section.
3. The background grain fracturing observed in the host rock, combined with the
limited porosity collapse, is the most probable explanation for the deviation from
the classical model for faulting in porous clastic rocks (Aydin & Johnson 1978).
4. The deformation bands feature porosities that are significantly higher than
published figures for cataclastic deformation bands elsewhere (e.g. Antonellini &
Aydin 1994).
5. Permeability contrast data fall in the high range of data for classical cataclastic
deformation bands, particularly where slip surfaces are developed (Fig. 16 and
e.g. Antonellini & Aydin 1994, Lothe et al. 2002).
6. In a reservoir setting, the structures may represent baffles to cross-band flow, but
slip surfaces also represent fractures along which fluids may flow. The bands
may therefore act as conduits to band-parallel flow and increase connectivity
within a hydrocarbon or groundwater reservoir.
ACKNOWLEDGEMENTS
Ian Sharp is thanked for directing us to the outcrops used in this study. Eivind
Bastesen is thanked for assistance during the first field season, and for useful discussions
in the early stages of this study. Jan Tveranger and Nestor Cardozo are thanked for an
enjoyable time in the field. Nestor Cardozo is also thanked for critical reviews of the
manuscript. The authors wish to acknowledge the Fault Facies project for funding this
study through the financial project support granted by the Norwegian Research Council,
Statoil and ConocoPhillips.
71

Slipped deformation bands
APPENDIX A: POROSITY AND PERMEABILITY ANALYSIS METHODS
Porosity image analysis technique
Porosity has been estimated from BSE images of thin sections using image
processing method (Torabi et al. 2007). Grain and pore phases of deformed sandstone
occupy different spatial positions. In such a two-phase (grain-pore) system of volume v
each phase occupies a subvolume 1v (for grains) and subvolume 2v (for pores), and a
characteristic or indicator function can be defined as follows:
Each image includes a matrix of M by N pixels. In order to be able to use the
indicator function to characterize the microgeometry of the samples, the colour intensity
range should be limited to two pixel values representing the two phases of the medium
(binary image). For a binary image we define a function f(i, j ) that is zero for grains and
one for pores, and ( ji, ) indicates the position of pixels in the image. The pore one-point
correlation function, s1, gives information about the volume fraction of the two phases in
an image consisting of M by N pixels (Garboczi et al. 1999), which is the porosity ( ).
)2(1),(),(1 ij jiji f
MxNfs
i=1, 2, 3,...M and j=1, 2, 3,…N
Porosity laboratory measurements:
Grain volume was measured by helium injection using a Boyle's law porosimeter.
Bulk volume was determined by immersing the sample in mercury, using the weigh
balance/ buoyancy technique. Porosity and grain density were calculated by recording
the weight of the samples.
)1(10
)(2
1
vrvr
rf
72

A. Rotevatn et al.
Gas permeability laboratory measurements:
Gas permeability (core plugs taken perpendicular to deformation bands and host
rock core plugs) was determined by flowing nitrogen gas through the samples. At steady
state conditions, the gas flow rate, the pressure drop over the plug sample and the
upstream pressure were recorded. The confining pressure applied during the
measurement was 20 bar. The gas permeability Kg was then calculated using Darcy's law
(Darcy 1856). The Klinkenberg corrected permeability value, Kl, was determined
empirically, based on the measured Kg and the corresponding average pore pressure, Pm
(Klinkenberg 1941).
Mini-permeameter analysis procedure:
Measurements were conducted using a TinyPerm II Portable Air Permeameter
(mini-permeameter) manufactured by New England Research When recording
permeability data, the operator pressures a rubber nozzle against the specimen and
withdraws air from it with a single stroke of a syringe. As air is pulled from the sample,
a micro-controller unit simultaneously monitors the syringe volume and the transient
vacuum pulse created at the sample surface. Using signal processing algorithms the
micro-controller computes the response function of the sample/instrument system. The
response function is related to permeability K:
,8737.12log8206.0 10 KT
where T is the value of the response function and the recorded output from the mini-
permeameter. When performing the tests in the field, the deformation bands were
excavated, carefully removing part of the hangingwall of the deformation band. Once
access was gained to the surface of the band/slip surface, the tests were performed as
described above. For each sample point 3-5 measurements were made, in order to ensure
the quality of the data. For each sample point, an average of the measurements was
calculated and used as the representative value for that point.
73
Slipped deformation bands
REFERENCES
Abdallah, A. M. & El Adindani, A. 1963. Stratigraphy of upper Paleozoic rocks, western
side of the Gulf of Suez 25. Geological Survey of Egypt Paper, 18 p.
Ahlgren, S. G. 2001. Exploring the formation, microtexture, and petrophysical properties
of deformation bands in porous sandstone. AAPG Bulletin 85, 2046.
Antonellini, M. & Aydin, A. 1994. Effect of faulting on fluid flow in porous sandstones:
petrophysical properties. AAPG Bulletin 78, 355-377.
Antonellini, M. & Aydin, A. 1995. Effect of faulting on fluid flow in porous sandstones:
geometry and spatial distribution. AAPG Bulletin 79, 642-671.
Antonellini, M., Aydin, A. & Pollard, D. D. 1994. Microstructure of deformation bands
in porous sandstones at Arches National Park, Utah. Journal of Structural Geology 16,
941-959.
Aydin, A. 1978. Small faults formed as deformation bands in sandstone. Pageoph 116,
913-930.
Aydin, A. & Johnson, A. M. 1978. Development of faults as zones of deformation bands
and as slip surfaces in sandstone. Pageoph 116, 931-942.
Aydin, A. & Johnson, A. M. 1983. Analysis of faulting in porous sandstones. Journal of
Structural Geology 5, 19-31.
Baud, P., Zhu, W. & Wong, T.-f. 2000. Failure mode and weakening effect of water on
sandstone. Journal of Geophysical Research 105, 16371-16389.
Beach, A., Brown, J. L., Welbon, A. W., McCallum, J. E., Brockbank, P. J. & Knott, S.
D. 1997. Characteristics of fault zones in sandstones from NW England: application to
fault transmissibility. In: Petroleum geology of the Irish Sea and adjacent areas (edited
by Meadows, N. S., Trueblood, S. P., Hardman, M. & Cowan, G.). Geological Society,
London, Special Publications 124, 315-324.
Bense, V. F., Van den Berg, E. H. & Van Balen, R. T. 2003. Deformation mechanisms
and hydraulic properties of fault zones in unconsolidated sediments; the Roer Valley Rift
System, The Netherlands. Hydrogeology Journal 11, 319-332.
74

A. Rotevatn et al.
Bjørlykke, K. & Egeberg, P. K. 1993. Quartz cementation in sedimentary basins. AAPG
Bulletin 77, 1538-1548.
Bjørlykke, K. & Høeg, K. 1997. Effects of burial diagenesis on stresses, compaction and
fluid flow in sedimentary basins. Marine and Petroleum Geology 14, 267-276.
Blenkinsop, T. G. 1991. Cataclasis and processes of particle size reduction. Pageoph
136, 59-86.
Borja, R. I. & Aydin, A. 2004. Computational modeling of deformation bands in
granular media. I. Geological and mathematical framework. Comput. Methods Appl.
Mech. Engrg. 193, 2667-2698.
Bosworth, W. 1995. A high-strain rift model for the southern Gulf of Suez (Egypt). In:
Hydrocarbon Habitat in Rift Basins (edited by Lambiase, J. J.). Geological Society,
London, Special Publications 80, 75-102.
Bosworth, W., Huchon, P. & McClay, K. 2005. The Red Sea and Gulf of Aden Basins.
Journal of African Earth Sciences 43, 334-378.
Chuhan, F. A., Kjeldstad, A., Bjørlykke, K. & Høeg, K. 2002. Porosity loss in sand by
grain crushing - experimental evidence and relevance to reservoir quality. Marine and
Petroleum Geology 19, 39-53.
Cochran, J. R. 1983. A model for development of the Red Sea. AAPG Bulletin 67, 41-69.
Darcy, H. 1856. Les Fontaines Publiques de la Ville de Dijon, Dalmont, Paris, 647 p.
Davatzes, N. C. & Aydin, A. 2003. Overprinting faulting mechanisms in high porosity
sandstones of SE Utah. Journal of Structural Geology 25, 1795-1813.
Davis, G. H. 1999. Structural geology of the Colorado Plateau Region of Southern Utah,
with special emphasis on deformation bands. The Geological Society of America, 157 p.
Du Bernard, X., Labaume, P., Darcel, C., Davy, P. & Bour, O. 2002. Cataclastic slip
band distribution in normal fault damage zones, Nubian sandstones, Suez rift. Journal of
Geophysical Research 107, ETG6-1, 6-12.
75

Slipped deformation bands
Edwards, H. E., Becker, A. D. & Howell, J. A. 1993. Compartmentalization of an
aeolian sandstone by structural heterogeneities: Permo-Triassic Hopeman Sandstone,
Moray Firth, Scotland. In: Characterization of fluvial and aeolian reservoirs (edited by
North, C. P. & Prosser, D. J.). Geological Society, London, Special Publications 73,
339-366.
Fisher, Q. J. & Knipe, R. J. 2001. The permeability of faults within siliciclastic
petroleum reservoirs of the North Sea and Norwegian Continental Shelf. Marine and
Petroleum Geology 18, 1063-1081.
Fossen, H. & Gabrielsen, R. H. 2005. Strukturgeologi (structural geology textbook in
Norwegian). Fagbokforlaget, Bergen, 375 p.
Fossen, H. & Hesthammer, J. 1997. Geometric analysis and scaling relations of
deformation bands in porous sandstone. Journal of Structural Geology 19, 1479-1493.
Fossen, H. & Hesthammer, J. 1998. Deformation bands and their significance in porous
sandstone reservoirs. First Break 16, 21-25.
Fossen, H., Schultz, R. A., Shipton, Z. K. & Mair, K. 2007. Deformation bands in
sandstone - a review. Journal of the Geological Society, London 164, 755-769.
Gallagher, J. J., Friedman, M., Handin, J. & Sowers, G. M. 1974. Experimental studies
relating to microfracture in sandstone. Tectonophysics 21, 203-247.
Garboczi, E. J., Bentz, D. P. & Martys, N. S. 1999. Digital images and computer
modeling. In: Methods in the Physics for porous media (edited by Wong, P.-Z.).
Academic Press, San Diego, California 35, 1-41.
Garfunkel, Z. & Bartov, Y. 1977. Tectonics of the Suez Rift. Geological Survey of Israel
Bulletin 71, 1-41.
Gupta, S., Underhill, J. R., Sharp, I. R. & Gawthorpe, R. L. 1999. Role of fault
interactions in controlling synrift sediment dispersal patterns: Miocene, Abu Alaqa
Group, Suez Rift, Sinai, Egypt. Basin Research 11, 167-189.
Hesthammer, J. & Fossen, H. 2001. Structural core analysis from the Gullfaks area,
northern North Sea. Marine and Petroleum Geology 18, 411-439.
76

A. Rotevatn et al.
Jackson, C. A. L., Gawthorpe, R. L., Leppard, C. W. & Sharp, I. R. 2006. Rift-initiation
development of normal fault blocks: insights from the Hammam Faraun fault block,
Suez Rift, Egypt. Journal of the Geological Society, London 163, 165-183.
Jamison, W. R. & Stearns, D. W. 1982. Tectonic deformation of Wingate Sandstone,
Colorado National Monument. AAPG Bulletin 66, 2584-2608.
Johansen, T. E. S. & Fossen, H. in press. Internal deformation of fault damage zones in
interbedded siliciclastic rocks. Geological Society, London, Special Publications.
Klinkenberg, L. J. 1941. The permeability of porous media to liquid and gases. In:
Drilling and Production Practice. American Petroleum Inst. 200-213.
Knipe, R. J., Fisher, Q. J., Jones, G., Clennell, M. R., Farmer, A. B., Harrison, A., Kidd,
B., McAllister, E., Porter, J. R. & White, E. A. 1997. Fault seal analysis: successful
methodologies, applications and future directions. In: Hydrocarbon Seals: Importance
for Exploration and Production (edited by Møller-Pedersen, P. & Koestler, A. G.).
Norwegian Petroleum Society Special Publication 7, 15-40.
Lothe, A. E., Gabrielsen, R. H., Bjørnevoll-Hagen, N. & Larsen, B. T. 2002. An
experimental study of the texture of deformation bands; effects on the porosity and
permeability of sandstones. Petroleum Geoscience 8, 195-207.
Lyberis, N. 1988. Tectonic evolution of the Gulf of Suez and the Gulf of Aqaba.
Tectonophysics 153, 209-220.
Mair, K., Main, I. & Elphick, S. 2000. Sequential growth of deformation bands in the
laboratory. Journal of Structural Geology 22, 25-42.
Mandl, G., DeJong, L. N. J. & Maltha, A. 1977. Shear zones in granular material. Rock
Mechanics 9, 95-144.
Moustafa, A. R. 1993. Structural characteristics and tectonic evolution of the east-
margin blocks of the Suez rift. Tectonophysics 223, 281-299.
Sammis, C., King, G. & Biegel, R. 1987. The kinematics of gouge deformation.
Pageoph 125, 777-812.
77

Slipped deformation bands
Schultz, R. A. & Balasko, C. M. 2003. Growth of deformation bands into echelon and
ladder geometries. Geophysical Research Letters 30, 2033, 10.1029/2002GL018449.
Schultz, R. A. & Siddharthan, R. 2005. A general framework for the occurrence and
faulting of deformation bands in porous granular rocks. Tectonophysics 411, 1-18.
Sharp, I. R., Gawthorpe, R. L., Armstrong, B. & Underhill, J. R. 2000. Propagation
history and passive rotation of mesoscale normal faults: implications for syn-rift
stratigraphic development. Basin Research 12, 285-306.
Shipton, Z. K. & Cowie, P. A. 2003. A conceptual model for the origin of fault damage
zone structures in high-porosity sandstone. Journal of Structural Geology 25, 333-345.
Shipton, Z. K., Evans, J. P., Robeson, K. R., Forster, C. B. & Snelgrove, S. 2002.
Structural heterogeneity and permeability in faulted aeolian sandstone: Implication for
subsurface modeling of faults. AAPG Bulletin 86, 863-883.
Shukri, N. M. 1945. Geology of the Nubian sandstone. Nature 156, 116.
Sternlof, K. R., Chapin, J. R., Pollard, D. D. & Durlofsky, L. J. 2004. Permeability
effects of deformation band arrays in sandstone. AAPG Bulletin 88, 1315-1329.
Taylor, W. L. & Pollard, D. D. 2000. Estimation of in-situ permeability of deformation
bands in porous sandstone, Valley of Fire, Nevada. Water Resources Research 36, 2595-
2606.
Torabi, A., Braathen, A., Cuisiat, F. & Fossen, H. 2007. Shear zones in porous sand:
Insights from ring-shear experiments and naturally deformed sandstones. Tectonophysics
437, 37-50.
Underhill, J. R. & Woodcock, N. H. 1987. Faulting mechanisms in high porosity
sandstones; New Red Sandstone, Arran, Scotland. In: Deformation of sediments and
sedimentary rocks (edited by Jones, M. E. & Preston, R. M. F.). Geological Society,
London, Special Publications 29, 91-105.
Wibberley, C. A. J., Petit, J.-P. & Rives, T. in press. The mechanics of fault distribution
and localization in high-porosity sands, Provence, France. In: The localization of
78
A. Rotevatn et al.
fracture damage in rocks (edited by Couples, G. D., Lewis, H. & Meredith, P. D.). The
Geological Society of London, Special Publication, in press.
Wong, T.-f. & Baud, P. 1999. Mechanical compaction of porous sandstones. Oil & Gas
Science and Technology - Rev. IFP 54, 715-727.
Wong, T.-f., David, C. & Menébdez, B. 2004. Mechanical compaction. In: Mechanics of
fluid-saturated rocks (edited by Guéguen, Y. & Boutéca, M.). Elsevier, Amsterdam 55-
114.
79

80

PhD dissertation, A. Torabi, 2007
Paper 3 Torabi, A., Fossen, H., and Alaei, B., 2007. Application of spatial correlation functions in
permeability estimation of small-scale deformation bands in porous rocks. In press, Journal of
Geophysical Research (Solid Earth).
81

82

A. Torabi et al.
Application of spatial correlation functions in permeability estimation of
deformation bands in porous rocks
Anita Torabi1, Haakon Fossen1, Behzad Alaei2
1) Department of Earth science, University of Bergen, Centre for Integrated Petroleum Research,
Allégt. 41, 5007 Bergen, Norway
2) Rocksource ASA, Olav Kyrresgt. 22, 5808 Bergen, Norway
Corresponding author, [email protected]
Abstract
Millimeter-thick strain localization structures in porous sandstones, known as
deformation bands, are reported to perturb the permeability structure of petroleum
reservoirs and aquifers. However, the internal permeability structure of deformation
bands is difficult to assess by means of classical methods. We have used spatial
correlation functions to estimate the porosity and specific surface area in the deformed
sandstones from high-resolution Backscattered Electron images. This work demonstrates
the use of a modified version of the Kozeny-Carman relation to calculate permeability
based on the information obtained from image processing. We have identified the
anisotropy with regard to petrophysical properties in deformed sandstones and
demonstrated variations in microstructure and properties across and along the
deformation bands. Our results show that properties outside the deformation bands differ
significantly from those inside the band (up to three orders of magnitude). Moreover
permeability varies by up to two orders of magnitude along a single band. Furthermore,
our porosity and permeability estimates are lower than those obtained from plug
measurements. While plug measurements measure the effective permeability across a
2.54 cm (inch) long sample, the method demonstrated here provides a means to estimate
porosity and permeability on the microscale, and to map out the variations in these
properties along as well as across deformation bands and similar structures.
Key words: Microstructure, Permeability and porosity, transport properties
83

Application of spatial correlation functions
1. Introduction
Much attention has recently been devoted to faulted sandstones and their porosity
and permeability structure [Ogilvie et al., 2001; Bense et al., 2003; Sternlof et al., 2004;
Kwon et al., 2005]. Deformation localizes in highly porous sandstones and sediments by
the formation of deformation bands [Aydin et al., 2006; Fossen et al., 2007], which are
millimeter thick zones of deformation. Deformation bands range from compactional
through simple shear to dilational, and involve particulate flow, cataclasis and/or
dissolution. In most cases, porosity and permeability are altered within deformation bands
during formation and growth. In particular, many deformation bands have been found to
have considerably lower permeability than their host rocks [Pittman 1981; Jamison and
Stearns 1982; Antonellini and Aydin, 1994; Knipe et al., 1997; Gibson 1998; Fisher and
Knipe, 2001; Lothe et al., 2002; Shipton et al., 2002], although dilation and permeability
increase can occur in some cases [e.g., Du Bernard et al., 2002]. Deformation bands are
common constituents of clastic petroleum reservoirs, where they occur as single
structures, as clusters and in fault damage zones [e.g., Hesthammer and Fossen, 2001].
Thus, predicting the role of deformation bands in a petroleum reservoir relies on a sound
understanding of their permeability structure.
Permeability is traditionally measured using a mini-permeameter in the field or by
drilling inch-size cores for laboratory testing. In our experience, mini-perm measurements
have large uncertainties, and plug measurements are hampered by sampling difficulties,
weathering effects and high cost, and require advanced laboratory facilities. Moreover,
the resolution of plug measurements is constrained by the plug length (usually 2.54 cm/ 1
inch) while deformation structures such as single deformation bands in porous sandstones
are only around 1 mm thick.
As an alternative approach, image processing methods can be used to characterize
the microstructure of the rocks and to provide a quantitative means for understanding the
dependence of physical properties on the pore structure [Blair et al., 1996]. During the
past decades, different approaches have been used to relate microstructural information to
physical, mechanical and transport properties of rocks [Ehrlich et al., 1984; Wissler,
1987; Koplik et al., 1984; Doyen, 1988; Blair et al., 1996, Bakke and Øren, 1997; Keehm
et al., 2004; 2006; White et al., 2006; Wu et al., 2006]. For instance, Bakke and Øren
[1997] presented a process-based modeling for sandstone that accounts for physical
84

A. Torabi et al.
processes such as sedimentation, compaction and digenesis. Their model is suitable only
for undeformed sandstone with a limited range of grain size. Keehm et al. [2004]; [2006]
predicted permeability from thin sections. They reconstructed 3D porous media from 2D
thin section using a stochastic method and the Lattice Boltzmann technique for 3D flow
simulation. We have applied Blair et al’s. [1996] method to the high resolution
Backscattered Electron images (BSE) of deformation bands. Moreover, employing high
resolution images allows us to capture complex microgeometry in deformation bands. In
this study we use spatial correlation functions to characterize the microgeometry of small-
scale deformation structures in a statistical way and to estimate their physical properties
such as porosity and specific surface area.
Few attempts have been made to apply the spatial correlation functions to obtain
microgeometry of anisotropic porous media. Berge et al. [1993, 1997] applied correlation
functions for anisotropic porous media on 2D images of tuff. Berryman [1998] has
developed the fundamental formulation for stationary anisotropic porous materials but his
concept has not been tested on real anisotropic rock samples.
In the present study, we show how deformation bands induce anisotropy (both
across and along the band) to sandstone at the microscale and for the first time apply
Berryman’s concept [1998] to a natural anisotropic and heterogeneous media. Under
Fault Facies research project at the Centre for Integrated Petroleum Research at the
University of Bergen, we have investigated many faulted sandstones from different
sedimentary basins to explore the effects of deformation bands on the physical properties
of sandstone. Understanding the nature of the anisotropy introduced by deformation
bands is crucial in estimating three-dimensional properties of deformed sandstones from
two-dimensional images. Porosity values have been extracted from low magnification
images by applying a one-point correlation function to the binary BSE images of both
bands and outside bands. Specific surface area of the pore-grain interface has been
estimated using a two-point correlation function and employing images with different
magnification. The details of three different approaches for calculating specific surface
area will be described in the result section. Finally specific surface area and porosity
values were used to estimate the permeability using empirical relations such as the
Kozeny-Carman relation. The estimated permeability values are compared to plug
measurements.
85

Application of spatial correlation functions
2. Theoretical framework
Rocks are usually considered as composite materials composed of at least two
phases; solids and pores. The properties of composite materials depend on the properties,
amount and spatial distribution of each phase. Some properties, such as the elastic
modulus and permeability, are functions of pore phase microstructure. The statistical
distribution of the relative locations of the microstructural features of interest represents
their spatial arrangement.
N-point correlation functions are important statistical descriptors that are useful for
characterizing the spatial arrangement and heterogeneity of microstructural geometry
[e.g. Debye et al., 1957; Corson, 1974; Gokhale, 2004; Cule and Torquato, 1999]:
Sn(i ) (r1,r2 ,...rn ) ( f (i ) (r1) f (i ) (r2 )... f (i ) (rn )) (1)
Equation 1 describes the volume average over the spatial positions of r . N-point
correlation functions contain statistical information about the arrangement of the
constituents in a composite material by measuring the probability of certain simple
geometrical arrangements of the constituents.
The basic information on volume composition and interfacial surface area is
contained in the lowest-order correlation functions [Cule and Torquato, 1999]. The one-
point ( S1 ) and two-point ( 2S ) pore-pore correlation functions are given by
S1(r) f (r) (2)S2 (r) f (r x) f (r y) (3)
Two properties of the two-point correlation function can be derived from equations 4 and
5:
)(2 rS has the characteristic asymptotic behavior [e.g., Cule and Torquato, 1999]. Grain
and pore phases of deformed sandstone occupy different spatial positions. In such a two-
phase (grain-pore) system of volume v each phase occupies a subvolume gv (for grains)
and subvolume pv (for pores), and a characteristic or indicator function can be defined as
follows:
S2 (r) S1(r)(x, y) 0
(4)
lim S2 (r) 2
r(5)
86

A. Torabi et al.
The pore one-point correlation function, S1, gives information about the volume
fraction of the two phases represented by an image consisting of M by N pixels [Garboczi
et al., 1999]
)7(1),(),(1 ij jiji f
MxNfS i=1, 2, 3,... M and j=1, 2,
3,…N
The pore-pore two-point correlation function, S2(x,y), describes the probability that
two points with a specified distance apart (a line) are both in pore phase. It is defined by
)8(1),( ),(),(),(),(2 yjxijiyjxiji ffMxN
ffyxS
We assume that the system is translational invariant so only the difference between
the two pixels is important, not their absolute positions. Furthermore, S2(x,y) can be
calculated using Fourier transform methods. We have used the following equation
[Garboczi et al., 1999] to calculate the two-point correlation function:
)9())((
),(1 1
),(),(2
xM
i
yN
j
yjxiji
yNxMff
yxS
The equation shows the two-point correlation function for an MxN matrix (for example a
2D image of faulted sandstone) in a Cartesian coordinate system.
2. 1. Deformation band induced anisotropy
Characterization of the microstructure of anisotropic porous media has not been
explored in much detail and is an important new area within the field of rock physics. The
development of more accurate methods that relate anisotropy to rock properties such as
permeability is of high importance. Although such applications are more difficult in
general, correlation functions may also be applied to anisotropic random media [Berge et
al., 1997].
)6(10
)(p
g
vrvr
rf
87

Application of spatial correlation functions
Figure 1. Deformation bands in (a) outcrop, scale bar is in centimeters (b) plug (length of the plug is 2.54 cm/1 inch) and (c) under optical microscope.
2D images of thin sections from deformed sandstone have been used in this study.
Figure 1 shows typical deformation bands at three different scales: outcrop scale, plug
sample scale, and at the microscale represented by a photomicrograph. It is obvious from
these pictures that the strain localization represented by the deformation bands adds
anisotropy to the sandstone. An anisotropic spatial correlation function of a random
porous medium could be used to compute the specific surface area by first performing
88

A. Torabi et al.
Figure 2. Photomicrographs from two perpendicular thin sections from one single band from sample LD-6 (Sinai, Egypt) that show variation of microstructure along the band in the xz plane and yz planes. The symbols on the Figure correspond to the symbols in Figure 7, which show the approximate location of measured data.
a three-dimensional average and then taking the first derivative with respect to the lag at
the origin. However, by using 2D images and an understanding of the nature of
anisotropy, planar radial average can be calculated instead [Berryman, 1998]. Therefore
we first calculated the two-point correlation function in a Cartesian coordinate system
using Equation 9. Then we calculated the planar radial average using 2D bilinear
interpolation method and the following equation to convert the Cartesian coordinate
system to polar coordinate system.
Understanding the nature of anisotropy with regard to petrophysical properties
(porosity, permeability) induced by deformation is crucial in estimating three-
dimensional properties of deformed sandstones from two-dimensional images. There are
both macro- and microscopic aspects of the permeability-related anisotropy caused by
deformation bands. Macroscopically, individual deformation bands are only around one
S2 (r)1
2r 1S2
l 0
2r
(r,l
4r) (10)
89

Application of spatial correlation functions
millimeter thick and up to a hundred meters long, across which fluid flow is reduced
because of the permeability contrast between the band and their host rock. This aspect has
been investigated using plug measurements in the laboratory and mini-permeameter in
the field [e.g. Antonellini and Aydin, 1994; Sigda et al., 1999; Shipton et al., 2002].
While this aspect regards variations across the band, i.e. in the z direction in Figure 2,
microscopic variations within the band may occur in the xy-plane. In order to investigate
these microscale variations we have prepared thin sections from two perpendicular
sections (xz and yz planes) through a deformation band (Figure 2).
Berryman [1998] assumes that if the random variations of the properties occur only
along the z axis, the surface normal vector is uniformly distributed and lies in the same
plane as r. Therefore, the specific surface area (i.e. the total area of the pores divided by
total volume of the porous media) can be calculated using:
However, this assumption is not always valid since both microstructure and physical
properties may vary along deformation bands (Figure 2).
If we consider the deformed sandstone to be anisotropic in three dimensions, then
the normal vector does not necessarily lie in the plane of r. In this case the specific
surface area is given by [Berryman, 1998]:
S2(0)s4
(12)
Since we have identified variations in microstructural features such as grain size and pore
space distribution along the band, Equation 12 provides a better estimate of the specific
surface area from two point correlation functions than Equation 11, as discussed in more
detail in the result section.
)11()0(2s
zxS
90

A. Torabi et al.
2.2. Image processing and spatial correlation functions
The selected BSE images are imported as unsigned 8-bit integer with a gray-scale
intensity range from 0 to 255 and the pixel values clustered within this range. The spatial
resolution of the image indicates the size of the pixels, with high resolution implying a
small pixel size. Both resolution and magnification of the image are important in
capturing the microstructural properties of the rocks, as discussed in the result section.
Each image includes a matrix of M by N pixels. If there is noise in the data, isolated
pixels can be removed by filters such as a median filter. In order to be able to use the
indicator function (Equation 6) to characterize the microgeometry of the samples, the
color intensity range should be limited to two pixel values representing the two phases of
the medium. The intermediate pixels between white and black pixel values in the gray-
scale images have proportions of black and white in their areas. When a threshold shade
of gray is chosen, all pixels with grays above this threshold are white (grains) and all
below are black (pores). Two methods have been used to calculate the threshold value to
generate the binary image. The resulting binary image is evaluated by visual inspection
and compared to the original BSE image to get the best estimate of the threshold. The two
methods are:
1. MATLAB built-in function (imhist): The function uses Otsu's method [1979],
which chooses the threshold to minimize the intraclass variance of the black and
white pixels.
2. Manual selection: The histogram of intensity range (0 to 255) versus frequency of
each intensity value has been used to select the threshold value manually.
The binary image has pixel value ‘0’ in the pore space and ‘1’ in the grain space.
Since we are interested in void correlation functions, the binary image has been reversed
to have ‘1’ for voids and ‘0’ for grains. Then we define a function f(i, j ) that is zero for
grains and one for pores, and ( ji, ) indicates the position of pixels in the image. Figures
3a and 3b show an original gray-scale image and its reversed binary image (pores white
and grains black). One point correlation function has been calculated for the reverse
binary image using Equation 7.
91

Application of spatial correlation functions
Figure 3. BSE image from outside band (host rock); (a) gray-scale image (b) reversed binary image obtained from the image shown in Figure 3a.
In this work, Equations 9 and 10 have been used in a function that is written in
MATLAB to calculate the two-point correlation function for the reversed binary image.
Finally Equation 12 has also been used to estimate the specific surface area from two-
point correlation functions. Figure 4 shows the anisotropic two-point correlation function
variations versus r. The two properties of the correlation function (Equations 4 and 5) and
its asymptotic behavior are also shown in Figure 4.
Figure 4. Normalized two-point correlation function versus distance (chosen along the image). The solid line shows the slope near the origin. Note the properties that can be obtained from this function. The maximum value at the origin is equal to porosity and the asymptotic value corresponds to
2.
92

A. Torabi et al.
2.3. Permeability and Kozeny-Carman relation
In order to estimate permeability we use a modified version of the Kozeny-Carman
relation developed by Paterson [1983] and Walsh and Brace [1984]. Here, pores in the
porous media are considered to be tubular. We then have that
)13(/ 22 cFsk
where is the porosity and c is a constant related to pore geometry that is equal to 2 for
porous materials (assuming that pores have circular cross-sections) and F is the
formation factor and has an exponential relationship with porosity [Archie 1942];
)14(mF
Furthermore, s is the specific surface area of the tubes. Archie [1942] defined an
empirical relationship between electrical properties and formation factor for rocks. Later
Wyllie [1952] developed the relationship between formation factor and other properties
of rocks, such as porosity. In this relation the exponent m is a cementation factor and it
varies between 1.5 for poorly consolidated sandstones and 2 for well consolidated
sandstones [Brace, 1977; Sen et al., 1981; Wong et al., 1984; Blair et al., 1996]. We used
1.8 for our moderately consolidated sandstones. The computed porosities and specific
surface areas from spatial correlation functions are used to estimate permeability using
Equation (13).
3. Results
The size range resolvable from back scatter images depends on the magnification
and resolution of the image. We have used BSE images (1024 × 768) with variety of
magnifications, i. e. from 155X up to 2.58 KX. It is important to consider the effect of
magnification on the calculated one- and two-point correlation functions. Based on
previous studies [e. g. Blair et al., 1996], low magnification images (images which
include 10-100 grains) seem to be appropriate for calculating one-point correlation
functions (porosity), since they cover a bigger area of the sample than high magnification
images and therefore are more representative. It has also been verified that laboratory
measured porosity are in agreement with the estimated values from low magnification
images. On the other hand, high magnification images are more suitable for obtaining a
93

Application of spatial correlation functions
two-point correlation function and hence specific surface area of the pore-grain interface
[e.g. Blair et al., 1996].
Having accepted Blair et al’s [1996] concept, we use low magnification images that
cover the whole area of interest for porosity estimates from both inside and outside the
band. To calculate specific surface area outside of the band by means of the two-point
correlation function, we use a high magnification image. Cataclastic deformation bands
have wide range of grain size and pore geometry. Therefore it is a challenge to pick the
appropriate magnification to assess the accurate specific surface area of the pores in these
bands.
Table 1 shows the information related to the samples that have been used in this
study. Figure 5 shows five BSE images from sample Wk-01 from Sinai, Egypt at
different magnifications as examples. Figure 5a illustrates an overview of the whole thin
section from sample Wk-01, which has a deformation band in the middle (Table 1).
Table 1 . Description of the samples of the thin sections used in this studysample Grain size Mineralogy Type of band Formation Location Coordinates
UT fine Quartz arenite Cataclastic band with quartz dissolution
Entrada Sst.
San Rafael Desert, Utah, USA
0525998-4271679
CNM fine Quartz arenite Cataclastic band with quartz dissolution
NavajoSst.
Colorado Nat’l Mon., USA
4332902-695343
V Fine to medium
Quartz arenite Cataclastic band with some quartz dissolution
Moab Mbr.
Hidden Canyon Utah, USA
4285800-605825
WK-01 medium Quartz arenite Cataclastic band Nubian Sst.
Sinai, Egypt 0523668-3219513
Wk-08 medium Quartz arenite Cataclastic band Nubian Sst.
Sinai, Egypt 0523668-3219513
I medium Quartz arenite Cataclastic band with some iron oxide
cement
NubianSst.
Sinai, Egypt -
LD-6A, B medium Quartz arenite Cataclastic bands with some iron oxide
cement
NubianSst.
Sinai, Egypt -
By increasing the magnification (Figure 5c, 5d, 5e, which have been used for
calculation of specific surface area) only a small part of a deformation band is perceptible
and hence the calculated specific surface area cannot be correct. Our research shows that
in order to capture the complex microgeometry of deformation bands we need several
high-resolution BSE images across the band. In order to verify this idea and examine the
two-point void correlation function sensitivity to the magnification of the images, a
database from our measurements for deformation bands, using images with different
magnifications from deformed sandstone is provided (Table 2, Figure 6). We applied
three different approaches:
94

A. Torabi et al.
1. First we calculated the specific surface area of the pores from an image with a low
magnification that covers the entire thickness of the band. We have also used this
image for porosity estimation since it includes the wide variety of the grain and pore
size in the deformation bands (squares in Figure 6 show the calculated permeability
using this approach, Table 2).
2. In a second approach, we followed Blair et al.’s (1996) concept and used one high
magnification image from a small part of the band to calculate specific surface area of
the pores (triangles in Figure 6 show the calculated permeability using this approach,
as listed in Table 2).
3. In a third approach, several high magnification images were taken across the band
to cover the entire thickness of the band. Then the average specific area for the
entire band was estimated using specific surface areas obtained for the different
Figure 5. (a) BSE image from deformed sandstone with a central deformation band. (b) Low magnification BSE image from the band that covers the entire width of the band and has been used for porosity estimation of the band. (c), (d), (e) High-magnification BSE images taken across the band that cover the entire width of the band and have been used for calculation of two point correlation functions and hence average of the specific surface area.
95

Application of spatial correlation functions
images (diamonds in Figure 6 show the calculated permeability using this method,
Table 2).
The permeability values calculated by using the first approach are always higher
than those from the next two approaches. We can classify our results into two different
groups.
1. In samples “Wk-01”, “Wk-08” and “I” from Sinai, the permeability obtained
from averaging the specific surface area (approach 3) are lower than the results
from the first approach but higher than the values from the second approach.
2. In sample “UT”, “CNM” and “V” from Utah, the permeability from approach 3
are lower than values obtained from approaches 1, and 2.
Figure 6. Permeability versus porosity as estimated by using the image processing method described in this article. Three different approaches have been applied on the deformation bands. For outside the bands, the approach #2 has been used. The method has been applied on a single image with appropriate magnification (squares, approach #1) for both porosity and specific surface area estimation, and on two images, the pervious image for porosity estimation and a high magnification image for estimation of specific surface area (triangles, approach #2). The diamonds are related to the permeability estimated from calculated average specific surface area using several high magnification images that cover the entire width of the deformation band (approach #3). Note the contrast in porosity and permeability within and outside of the band and also the classification of data for deformation bands into two groups. For more detail see Figure 5 and Table 2.
96

A. Torabi et al.
Figure 6 also illustrates that both porosity and permeability have been reduced within the
bands. The highest porosity reduction was found for sample UT, where porosity is
reduced from ~30% outside the band to ~10% within the band and permeability is
decreased up to three orders of magnitude. This variation comes from the first source of
anisotropy (macroscopic aspect) induced by deformation band that has been stated in
section 2.1.
Table 2 Calculated specific surface area and permeability data using the three different approaches discussed in the text;
sample Approach Specific Surface Area (μ)-1 Permeability (mD)
UT-host 2 0.039 4010Wk-host 2 0.027 1780Wk-08-host 2 0.022 4301V-host 2 0.048 1246CNM-host 2 0.054 756I-host 2 0.059 626UT-band 1 0.084 11UT-band 2 0.091 9UT-band 3 0.124 4Wk-01-band 1 0.13 16Wk-01-band 2 0.405 1.7Wk-01-band 3 0.349 3Wk-08-band 1 0.178 17Wk-08-band 2 0.31 5Wk-08-band 3 0.386 6V-band 1 0.054 20V-band 2 0.07 13V-band 3 0.1 2CNM-band 1 0.15 6.9CNM-band 2 0.17 5 CNM-band 3 0.217 2I-band 1 0.16 18I-band 2 0.6 1.7I-band 3 0.585 2.2
To quantify the microscopic aspect of anisotropy along deformation bands, we have
estimated porosity and permeability along one single deformation band (Sample LD-6
from Sinai, Egypt) in two perpendicular thin sections (Figures 2 and 7). We have applied
our third approach to calculate permeability for the deformation band in this sample.
Porosities in the xz-plane (diamonds in Figure 7) are smaller than porosities in the yz-
97

Application of spatial correlation functions
plane (about 15% differences). However, permeability values in the xz-plane are up to
two orders of magnitude lower than those in the yz-plane.
We compared our estimated porosities and permeabilities to laboratory measured
data obtained from plugs of the same samples. Laboratory measurements of absolute
permeability usually involve the direct application of Darcy’s law, based on the
measurements of individual variables such as flow rate, pressure drop, and sample
dimension. Most laboratory measurements are carried out at samples with well-defined
geometry, such as cylindrical core plugs, which are generally 2.54 or 3.8 cm (1 or 1.5
inch) in diameter with length varying from 5 to 10 cm ( 2 to 4 inches) [Dandekar, 2006].
Our estimated porosity and permeability for deformation bands are lower than the
laboratory data, regardless of the choice of image processing approach (Figure 8).
Figure 7. Porosity and permeability obtained from two perpendicular thin sections (xz and yz, see Figure 2) from sample LD-6 (Sinai, Egypt). Note the variations along the band.
98

A. Torabi et al.
Figure 8. (a) Comparison of laboratory measured and our estimated permeability (b) and porosity. The estimated values are seen to be slightly lower.
99

Application of spatial correlation functions
4. Discussion and conclusions
Since deformation bands are small-scale structures with about 1 millimeter
thickness it is a challenge to obtain their internal properties precisely. Both field and
laboratory approaches have their limitations and uncertainties. The thin-section based
image analysis technique presented here makes it possible to estimate the properties of
the bands themselves. The practical importance of this technique has been demonstrated
by combining the measured values of porosity and specific surface area with a Kozeny-
Carman relation to obtain estimates of fluid permeability. The main cause of the errors in
image processing methods is the discrepancy between thin sections and the actual rock
samples; that is, a thin section is only a small part of the rock and can give slightly
different statistical parameters [Keehm et al., 2004]. However, this is not the case for
deformation bands because of their small thickness. Therefore, image processing
technique through thin section analysis is suitable for extracting microstructural
information from deformation bands.
In the image analysis technique, the effect of magnification and resolution of the
images on the calculated specific surface areas has been investigated. We have resolved
the sensitivity of the image processing method to the resolution of the image by using
high-resolution images that provide insight into more complex microgeometries. In order
to calculate specific surface area Blair et al. [1996] used only one high magnification
image from the undeformed sample. Our study shows that a high magnification image is
not appropriate for estimating the properties of deformation bands with a relatively wide
range of grain and pore sizes. Due to cataclasis and other deformation processes, the
microgeometry of most deformation bands is complex. Hence it makes the use of a single
high-magnification image that captures only a small area of the anisotropic media
inappropriate. To examine the sensitivity of specific surface area in the deformation band
to the magnification of the image, we have proposed three approaches. The first uses one
low magnification image that covers the whole band, the second applies one high
magnification image that contains a small part of the band (Blair et al’s [1996] method)
and finally the third approach combines several high magnification images in order to
cover the thickness of the band. Permeability values obtained from the third approach are
different from the values calculated from first and second approaches (Figure 6).
100

A. Torabi et al.
The difference between the two groups of data in Figure 6 can be ascribed to the
deformation mechanisms involved during the initiation and development of the bands. In
the first group (samples from Sinai), only cataclasis is observed, while in the second
group (samples from Utah), both cataclasis and pressure chemical dissolution are present.
We have tested Berryman’s [1998] concept on stationary and anisotropic random
porous media for deformed sandstones to quantify the permeability variations along the
deformation band using 2D images from thin sections with different orientations. We
show that the anisotropic deformation bands are not two-dimensional, i.e., the random
variations occur both in the xz and yz planes (Figure 2). The main purpose of using 2D
images with different orientation is to investigate porosity and permeability variations in
different directions and consequently quantifying the porosity and permeability
anisotropy induced by deformation bands. We have identified deformation-induced
anisotropy in properties such as porosity and permeability in deformed sandstones. This
anisotropy occurs at both macro- and microscopic scales in the deformation bands. In this
study we point out the microscopic aspect of anisotropy along deformation bands. Based
on the presented results (Figure 7), the permeability changes along the band are
substantial and the difference is almost two orders of magnitude in the two directions.
The permeability values form two different clusters, with higher porosity and
permeability in the yz plane. Since deformation bands are long and introduce
discontinuities and compartmentalization to fluid reservoirs, studying their microstructure
and variations along the bands is significant.
We have used a modified version of Kozeny-Carman relation to calculate
permeability. In order to calculate the formation factor, the exponential relationship
between formation factor and porosity obtained from an empirical relationship introduced
by Archie [1942] was used. Based on the previous studies on the formation factor of
sandstones, we have assumed the exponent m in Equation 16 to be equal to 1.8 for our
moderately consolidated sandstones. We think the results would be more accurate if we
use the lab-measured formation factor for the deformed sandstones in this equation. Our
results show that both porosity and permeability decrease as a result of cataclasis and
quartz dissolution in the band, but permeability changes are higher up to three orders of
magnitude. This can be explained by the increased specific surface area in the band due to
the presence of the crushed grains.
Understanding the details of microstructure requires calculation of all correlation
functions, but since we have estimated one- and two-point correlation functions (lower
101

Application of spatial correlation functions
order correlation functions) the estimated permeability values are in the range of possible
values. This range is referred to as conventional improved bounds in contrary to rigorous
bounds [Torquato 2000].
The difference between plug measurements and our calculated permeability and
porosity can be explained by the sample-size limitation inherent to the plug
measurements, in which it is difficult or impossible to get the properties of a millimeter-
thick deformation band. The laboratory-measured data represent the average properties of
the band and its host rock. The method demonstrated here represents a means of finding
and mapping variations in permeability along as well as across narrow zones such as
deformation bands. This opens new opportunities for research on how deformation bands
and similar features affect fluid flow in three dimensions.
Notations
,...2,1nSn N-point correlation function.
r Spatial positions in 2D images.
)(rf Characteristics or indicator function equal to 1 or 0 depending on the position r.
Porosity.
),(2 yxS Two-point correlation function for distance in Cartesian coordinates
),(2 rS Two-point correlation function for a distance in polar coordinates.
ji, Pixel positions in 2D BSE images.
k Permeability.
c Constant related to pore geometry.
F Formation factor.
s Specific surface area.
m Archie’s cementation factor.
gv Grain volume.
102

A. Torabi et al.
pv Pore volume.
Acknowledgements
This study was completed in the frame of Fault Facies Project at the Centre for
Integrated Petroleum Research, University of Bergen, and supported by Norwegian
Research Council, Statoil, Conoco-Philips, and Statoil. Thanks are due to Alvar Braathen
for scientific discussions. Thanks go to Egil Erichsen for help with the SEM analyses and
also to Atle Rotevan, Eivind Bastesen, Tore Skar and Silje S. Berg for participating in the
collection of some of the samples used in this work.
References
Adler, P. M. (1992), Porous media: Geometry and transport, 544 pp., Butter-worth-
Heinemann, Newton, Mass.
Antonellini, M. and A., Aydin (1994), Effect of faulting on fluid flow in porous
sandstones: petrophysical properties, AAPG Bull., 78, 355-377.
Archie, G. E. (1942), The electrical resistivity log as an aid in determining some reservoir
characteristics, Trans. Am. Ins. Min. Metall. Pet. Eng., 146, 54-62.
Aydin, A., R. I., Borja, P. Eichhubl (2006), Geological and mathematical framework for
failure modes in granular rock, Journal of Structural Geology, 28, 83-98.
Bense, V. F., E. H., Van den Berg and R. T., Van Balen (2003), Deformation mechanisms
and hydraulic properties of fault zones in unconsolidated sediments; the Roer Valley Rift
System, The Netherlands. Hydrogeology Journal, 11, 319-332.
Bakke, S., P. E. Øren (1997), 3-D Pore-scale modelling of sandstones and flow
simulations in the pore networks, SPE 35479, 2.
Berge, P. A., J. G., Berryman, S. C., Blair, C., Pana (1997), Scalar properties of
transversely isotropic Tuff from images of orthogonal cross sections, UCRL-JC-
Lawrence Livermore National Laboratory, Livermore, California 94551-9900.
Berryman, J. G. (1985), Measurement of spatial correlation functions using image
processing techniques. J. Appl. Phys., 57, 2374-2384.
103

Application of spatial correlation functions
Berryman, J. G. (1987), Relationship between specific surface area and spatial correlation
functions for anisotropic porous media. J. Math. Phys., 28, 244-245.
Berryman, J. G. (1998), Planar spatial correlations, anisotropy, and specific surface area
of stationary random porous media, J. Appl. Phys., 83 (3).
Blair, S. C. and J. G., Berryman (1991), Estimates of permeability and relative
permeability for sandstone using image analysis of cross sections, in J. C. Roegiers, Rock
Mechanics as a Multidisciplinary Science, Proceedings of the 32nd U.S. Symposium on
Rock Mechanics, A. A. Balkema, Rotterdam, 365-374.
Blair, S. C., P. A., Berge and J. G., Berryman (1993), Two-point correlation functions to
characterize microgeometry and estimate permeability of synthetic and natural
sandstones, Lawrence Livermore National Laboratory, Livermore, California Rep.
UCRL-LR-114182.
Blair, S. C., P. A., Berge and J. G., Berryman (1996), Using two-point correlation
functions to characterize microgeometry and estimate permeabilities of sandstones and
porous glass, J. Geophys. Res., 101(B9), 20359-20375.
Brace, W. E. (1977), Permeability from resistivity and pore shape. J. Geophys. Res., 82,
3343-3349.
Corson, P. (1974), Correlation functions for predicting properties of heterogeneous
materials, I, Experimental measurements of spatial correlation functions in multiphase
solids, J. Appl. Phys., 45, 3159-3164.
Cule, D. and S. Torquato (1999), Generating random media from limited microstructural
information via stochastic optimization, J. Appl. Phys., 86(6).
Dandekar, A. Y. (2006), Petroleum reservoir rock and fluid properties, 460 pp., CRC
Press, Taylor and Francis Group.
Debye, P., H. R., Anderson Jr. and H., Brumberger (1957), Scattering by an
inhomogeneous solid, II, The correlation function and its application, J. Appl. Phys., 28,
670-683.
Doyen, P. M. (1988), Permeability, conductivity, and pore geometry of sandstone, J.
Geophys. Res., 93, 7729-7740.
Du Bernard, X. D., P., Eichhubl, and A., Aydin (2002), Dilation bands: A new form of
localized failure in granular media, Geophysical Research Letters 29(24), 2176.
Ehrlich R., S. K. Kennedy, S. J., Crabtree and R. L., Cannon (1984), Petrographic image
anlysis: I. Analysis of reservoir pore complexes, Journal of Sedimentary Petrology, 54,
1515-1522.
104

A. Torabi et al.
Fisher, Q. J. and R. J., Knipe (2001), The permeability of faults within siliciclastic
petroleum reservoirs of the North Sea and Norwegian Continental Shelf, Marine and
Petroleum Geology, 18, 1063-1081.
Flodin, E., A., Aydin, L.J., Durlofsky, B., Yeten (2001), Representation of fault zone
permeability in reservoir flow models, Presented at the society of Petroleum Engineers
Annual Technical Conference and Exhibition, New Orleans, Louisiana (SPE paper
71671), 10 pp.
Flodin, E., M., Gerdes, A., Aydin and W. D., Wiggins (2005), Petrophysical properties
and sealing capacity of fault rock, Aztec sandstone, Nevada, in R. Sorkhabi and Y. Tsuji,
eds., Faults and fluid flow, and petroleum traps, AAPG Memoir 85, 197-217.
Fossen, H., R. A. Schultz, K., Mair and Z. K. Shipton (2007), Deformation bands in
sandstones - a review, Journal of Geological Society, London, 164, 754-769.
Garboczi, E. J., D. P., Bentz and N. S., Martys (1999), Digital images and computer
modelling. Experimental methods in the physical sciences, Methods in the Physics of
Porous Media, Chapter 1, Academic Press, San Diego, CA. 35, 1-41.
Gibson, R. G. (1998), Physical character and fluid-flow properties of sandstone-drived
fault zones, Geological Society, London 127, 83-97.
Gokhale, A. M. (2004), Experimental Measurements and Interpretation of
Microstructural N-Point Correlation Functions, Microsc. Microanal., 10 (Suppl 2), 736-
37.
Hesthammer, J. and H. Fossen (2001), Structural core analysis from the Gullfaks area,
northern North Sea, Marine and Petroleum Geology 18, 411-439.
Jamison, W. R. and D. W., Stearns (1982), Tectonic deformation of Wingate Sandstone,
Colorado National Monument, AAPG Bull., 6, 2584-2608.
Jourde, H., E. A., Flodin, A., Aydin, L. J., Durlofsky and X-H., Wen (2002), Computing
permeability of fault zones in eolian sandstone from outcrop measurements, AAPG Bull.,
86(7), 1187-1200.
Keehm, Y., T., Mukerji, A., Nur (2004), Permeability prediction from thin sections: 3D
reconstruction and Lttice-Boltzmann flow simulation, Geophys. Res. Let., 31, L04606.
Keehm, Y., K., Sternlof, T., Mukerji (2006), Computational estimation of compaction
band permeability in sandstone. Geosciences Journal, 10, 4, 499-505.
Knipe, R. J., Q. J., Fisher, G., Jones, M. B., Clennell and A. B., Farmer (1997), Fault seal
analysis: Successful methodologies, application and future directions, in P. Moller-
105

Application of spatial correlation functions
pederson and A. G: Koestler. Hydocarbon seals: Importance for exploration and
production. NPF Special Publication, 7, 15-40.
Koplik, J., C., Lin, M., Vermette (1984), Conductivity and permeability from
microgeometry, J. Appl. Phys., 56, 3127-3131.
Kwon, O., B. T., I. G., Ngwenya, Main, S. C., Elphick (2005), Permeability evolution
during deformation of siliciclastic sandstones from Moab, Utah, in R. Sorkhabi and Y.
Tsuji eds., Faults, Fluid flow, and petroleum traps. AAPG Memoir, 85, 219-236.
Lothe, A. E., R. H., Gabrielsen, N., Larsen and B. T., Bjørnevoll (2002), An experimental
study of the texture of deformation bands: effects on porosity and permeability of
sandstones, Petroleum Geosciences, 195-207.
Martys, N. and E. J., Garboczi (1992), Length scales relating the fluid permeability and
electrical conductivity in random two-dimensional model porous media, Phys. Rev., B
46, 10.
Ogilvie, S. R., Paul, W. J. Glover (2001), The petrophysical properties of deformation
bands in relation to their microsturcture. Earth and Planetary Science Letters, 193, 129-
142.
Otsu, N. (1979), A threshold selection method grey-level histogram, IEEE Transactions
on Systems, Man and Cybernetics, 9(1), 62-66
Paterson, M. S. (1983), The equivalent channel model for permeability and resistivity in
fluid-saturated rock- A reappraisal, Mech. Mater., 2, 345-352.
Pittman, E. D. (1981), Effect of fault-related granulation on porosity and permeability of
quartz sandstones, Simpson Group (Ordovician) Oklahoma, AAPG Bull., 65, 2381-2387.
Sen, P. N., C., Scala and M. H., Cohen (1981), A self-similar model for sedimentary
rocks with application to the dielectric constant of fused glass beads, Geophysics 46, 781-
795.
Shipton, Z. K., J. P., Evans, K. R., Robeson, C. B., Forster and S., Snelgrove (2002),
Structural heterogeneity and permeability in eolian sandstone: Implications for subsurface
modeling of faults, AAPG Bull., 86(5), 863-883.
Sigda, J. M., L. B., Goodwin, P. S., Mozely, and J. L.,Wilson (1999). Permeability
Alteration in small-displacement faults in poorly lithified sediments: Rio Grande, Central
New Mexico in Faults and subsurface fluid flow in the shallow crust, Geophysical
Monograph 113, American Geophysical Union.
Sternlof, K. R., J. R., Chapin, D. D., Pollard and L. J. Durlofsky (2004), Permeability
effects of deformation band in arrays in sandstone. AAPG Bull., 88, 9, 1315-1329.
106

A. Torabi et al.
Torquato, S. and M. D., Rintoul (1995), Effect of the interface on the properties of
composite media, Phys. Rev. Lett., 75, 4067-4070.
Van der Marck, S. C. (1993), Comment on" using two-point correlation functions to
characterize microgeometry and estimate the permeabilities of sandstones and porous
glass" by Stephan Blair, Patricia Berge, and James G. Berryman. J. Geoph. Res.
102(B11), 24811-24812.
Walsh, J. B. and W. F., Brace (1984), The effect of pressure on porosity and the transport
properties of rock, J. Geophys. Res., 89, 9425-9431.
Walsh, J. J., J., Watterson, A., Heath, P. A., Gillespie and C., Childs (1998), Assessment
of the effects of sub-seismic faults on bulk permeabilities of reservoir sequences.
Geological Society, London, Special publication, 127, 99-113.
White, J., A., R. I., Borja, J. T., Fredrich (2006), Calculating the effective permeability of
sandstone wit multiscale lattice Boltzmann/finite element simulations. Acta Geotechnica,
1, 195-209.
Wissler, T. M. (1987), Sandstone pore structure: A quantitative analysis of digital SEM
images, PhD. thesis, Mass. Inst. of Technol., Cambridge.
Wong, P. Z., J., Koplik and J. P., Tomanic (1984), Conductivity and permeability of
rocks, Phys. Rev., B 30.
Wyllie, M. R. J. (1953), Formation factors of unconsolidated porous media: influence of
particle shape and effect of cementation, Trans. AIME 198, 103-110.
Yeong, C. L. Y. and S., Torquato (1998), Reconstructing random media, Phys. Rev., E
495-506.
107

108

PhD dissertation, A. Torabi, 2007
Paper 4 Torabi, A., and Fossen, H., 2007. Spatial variation of microstructure and petrophysical
properties of deformation bands. Under review in Journal of Structural Geology.
109

110

A. Torabi & H. Fossen
Spatial variation of microstructure and petrophysical properties of deformation bands
Anita Torabi, Haakon Fossen
Department of Earth Science, University of Bergen, and Centre for Integrated Petroleum Research, Post Box 7800, 5020 Bergen, Norway
Corresponding author: Anita Torabi, [email protected]
Abstract
A series of deformation bands from various sandstones deformed at different
depths have been studied with respect to microstructural and petrophysical variations.
We have found that the internal microstructure of many deformation bands varies along
the bands at the cm or even mm scale. The variations can result in variations in
petrophysical properties such as porosity and permeability. In the examples explored,
porosity varies by up to 18% and permeability by up to two orders of magnitude within
deformation bands. Such petrophysical variations are found in different types of
deformation bands, but the range depends upon the deformation mechanisms, in
particular on the degree of cataclasis and dissolution in cataclastic and dissolution bands,
and on the phyllosilicate content in disaggregation bands. Moreover, the grain size
distributions change along the bands with regard to the degree of cataclasis.
Furthermore, the increased specific surface area of the pore-grain interface as a result of
cataclasis in the cataclastic bands causes more permeability reduction compare to other
types of deformation bands. Phyllosilicate content can also influence the thickness of the
phyllosilicate bands. However, there is no apparent correlation between thickness and
intensity of cataclasis in the studied cataclastic deformation bands.
1. Introduction
Deformation bands are localized deformed microstructures that form in highly
porous rocks and sediments. They are commonly found in faulted sand and sandstone
(e.g. Aydin, 1978; Pittman, 1981; Jamison and Stearns, 1982; Underhill and Woodcock,
1987; Knipe, et al., 1997, Fossen et al., 2007). Their internal characteristics have the
111

Spatial variation of microstructure
potential of changing the petrophysical properties of reservoirs dramatically and thus
affect the choice of production strategy of oil and gas fields (Fisher and Knipe, 2001;
Hesthammer and Fossen, 2001; Ogilvie and Glover, 2001).
Deformation bands form by different deformation mechanisms (Fossen et al.,
2007). Disaggregation bands result from granular flow at shallow burial depth that
involves rolling, sliding and rotation of sand grains. These bands do not usually affect
the petrophysical properties of the deformed sandstone significantly (e. g. Rawling and
Goodwin, 2003). Phyllosilicate bands are a special subgroup of disaggregation bands
that form by granular flow in sand or sandstone where the phyllosilicate content exceeds
10-15% (Knipe et al., 1997). Phyllosilicate bands cause up to several orders of reduction
in permeability according to plug measurements reported by Fisher & Knipe (2001).
Cataclastic deformation bands are characterized by grain fracturing, crushing and
abrasion (cataclasis). Individual cataclastic bands are typically reported to reduce
porosity of the deformed sandstone by one and permeability by three orders of
magnitude as compared to their host rock (Antonellini and Aydin, 1994). Dissolution
and cementation bands form where dissolution or cementation is the dominant
deformation mechanism. A dissolution band typically consists of tightly packed quartz
grains with little or no indication of fracturing of the grains (Gibson, 1998). Dissolution
and quartz cementation have been suggested as an explanation for poor reservoir
performance in North Sea reservoirs located at >3 km depth (Hesthammer et al., 2002).
Single deformation bands are typically about one millimeter thick and up to a
hundred meters long. They can grow into clusters of deformation bands in which faults
can initiate, as envisaged by Aydin and Johnson (1978). Clusters of bands can
accumulate several hundred bands over a zone less than a meter wide (Johansen and
Fossen, in press), in which case the zone can be several hundred meters long. They can
also form and grow in the damage zone of an existing fault, for instance as a response to
geometric complications during fault slippage (e.g. Rykkelid and Fossen, 2002).
Since deformation bands and deformation band zones are long enough to
compartmentalize reservoirs, their physical properties have been devoted attention by a
number of previous workers (e.g. Aydin 1978; Pittman, 1981; Jamison and Stearns,
1982; Underhill and Woodcock, 1987; Knipe, 1997; Gibson, 1998; Fisher and Knipe,
2001). However, variations in porosity and permeability, related to microstructural
variations within deformation bands, have been given little or no attention in the existing
literature (cf. Fossen and Bale, 2007). The typical reported cataclastic deformation bands
112

A. Torabi & H. Fossen
of the Colorado Plateau, as described by Aydin (1978), Aydin & Johnson (1978, 1983)
and Davis (1999), form where mechanical grain fracture is the dominant deformation
mechanism. These authors described deformation bands as consisting of a central
cataclastic core within a volume of compacted rock. Variation of microstructure across
the band has also been studied through experimental work (e.g. Agung et al., 2004).
Sharp boundary shear zones produced at high level of stress in ring shear experiments
(Torabi et al., 2007) show zonation comparable to the microstructural variation reported
by Aydin (1978). In these experiments, porosity varied from ~24% in the host rock
down to ~17% in the margin and to ~12% within the central part of the shear zone
(Torabi et al., 2007). Furthermore, variations in microstructure, and therefore in porosity
and permeability along the band, must be addressed when their effect on fluid flow is
considered.
While microstructural variations along as well as across deformation bands are
easily studied under the microscope, their internal permeability structure is difficult to
assess by means of classical methods. In general, image processing methods can be used
to characterize the microstructure of rocks and provide a quantitative means for
understanding the dependence of physical properties on pore structure (Ehrlich et al.,
1984; Wissler, 1987; Koplik et al., 1984; Doyen, 1988; Blair et al., 1996, Bakke and
Øren, 1997; Keehm et al., 2004; 2006; White et al., 2006; Wu et al., 2006). In the
present study we use an image processing method especially designed for the purpose of
estimating porosity and permeability within deformation bands (Torabi et al., in review).
In order to see the effect of grain size on microstructure of the bands, we describe the
grain size distributions in the measured locations in the host rock and within the bands.
We first exemplify different types of deformation bands with respect to their
deformation mechanism from different localities around the world that show variations
in thickness, microstructure and properties such as porosity and permeability along the
band and then present a case study from the Entrada Sandstone (Utah, USA) to show
variations along deformation bands as they cross layers of different grain size and
porosity.
113

Spatial variation of microstructure
2. Methodology
Traditionally, laboratory-based plug and mini-permeameter data represent one-
dimensional properties of deformation band and its host rock. Image processing
methods, on the other hand, provide a means to estimate porosity and permeability on
the micro-scale, and to map out the variations in properties along as well as across
deformation bands. In the current project, polished thin sections of faulted sandstones
have been studied by optical and scanning electron microscope and high-resolution
Backscattered electron (BSE) images have been taken. Porosity and permeability have
been estimated using spatial correlation functions and a modified version of Kozney-
Carman relation (Torabi et al., in review). In the image processing method, we make a
binary image from the selected high-resolution gray-scale BSE image by choosing an
appropriate threshold. The binary image has been reversed to have ‘0’ pixel value in the
grain space and ‘1’ in the pore space. The binary image ( f (ij)) is represented by a
NM matrix. The one point correlation function (Eq. 1) is applied to the binary image
( 1S ), which gives information about the volume fraction of the two phases i.e. pore and
grain is (Garboczi et al., 1999):
This function gives the porosity. The next step is to calculate the pore-pore two
point correlation function, S2 (x, y) for the binary image by using Eq. 2, that is the
probability that two points with a specified distance apart (a line) are both in pore phase
(Berryman 1986; Torquato, 1999).
S2 (x, y) f(i, j ) f(i x, j y)1
MxNf(i, j ) f(i x, j y) (2)
The specific surface area (Eq. 3) of the pore-grain interface is calculated from the
two-point correlation function (Berryman, 1998). We calculated permeability by using a
modified version of the Kozeny-Carman relation (Eq. 4), where is the porosity and c
is a constant related to pore geometry that is equal to 2 for porous materials assuming
circular cross section for pores, F is the formation factor and has an exponential
relationship with porosity (Archie, 1942);
NjMifMxN
fSij jiji ,...2,1;,...2,1)1(1
),(),(1
114
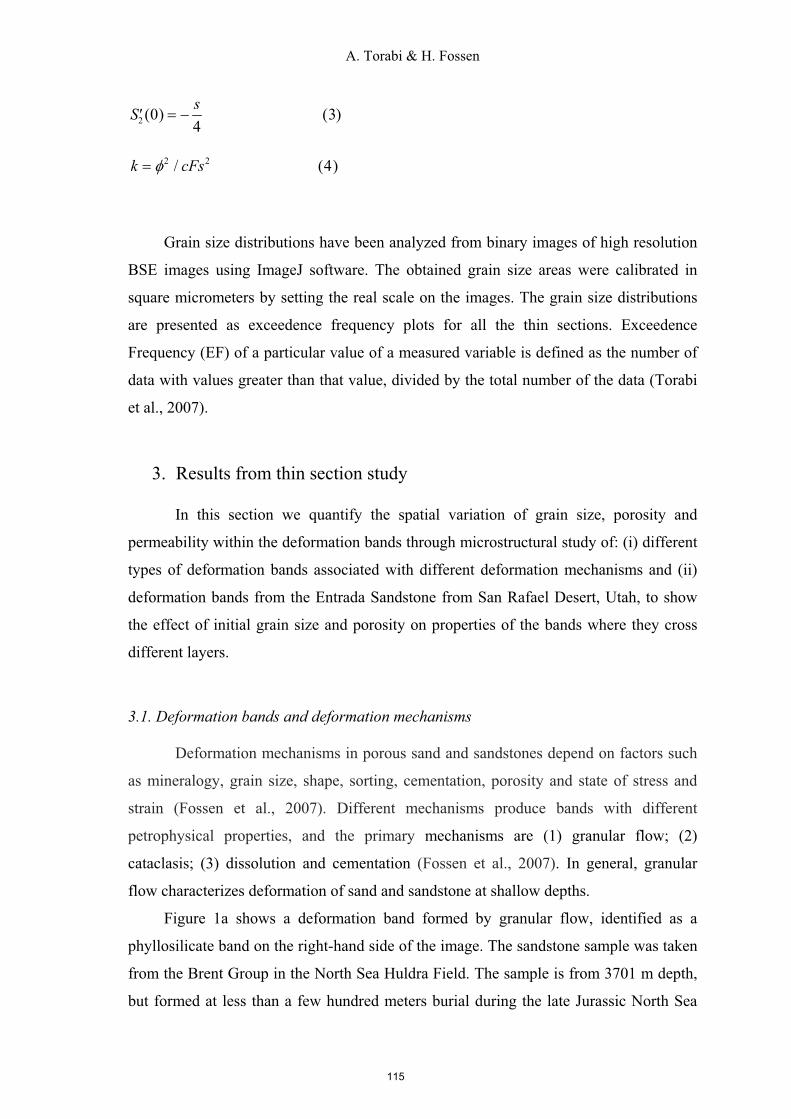
A. Torabi & H. Fossen
S2 (0)s4
(3)
k 2 / cFs2 (4)
Grain size distributions have been analyzed from binary images of high resolution
BSE images using ImageJ software. The obtained grain size areas were calibrated in
square micrometers by setting the real scale on the images. The grain size distributions
are presented as exceedence frequency plots for all the thin sections. Exceedence
Frequency (EF) of a particular value of a measured variable is defined as the number of
data with values greater than that value, divided by the total number of the data (Torabi
et al., 2007).
3. Results from thin section study
In this section we quantify the spatial variation of grain size, porosity and
permeability within the deformation bands through microstructural study of: (i) different
types of deformation bands associated with different deformation mechanisms and (ii)
deformation bands from the Entrada Sandstone from San Rafael Desert, Utah, to show
the effect of initial grain size and porosity on properties of the bands where they cross
different layers.
3.1. Deformation bands and deformation mechanisms
Deformation mechanisms in porous sand and sandstones depend on factors such
as mineralogy, grain size, shape, sorting, cementation, porosity and state of stress and
strain (Fossen et al., 2007). Different mechanisms produce bands with different
petrophysical properties, and the primary mechanisms are (1) granular flow; (2)
cataclasis; (3) dissolution and cementation (Fossen et al., 2007). In general, granular
flow characterizes deformation of sand and sandstone at shallow depths.
Figure 1a shows a deformation band formed by granular flow, identified as a
phyllosilicate band on the right-hand side of the image. The sandstone sample was taken
from the Brent Group in the North Sea Huldra Field. The sample is from 3701 m depth,
but formed at less than a few hundred meters burial during the late Jurassic North Sea
115
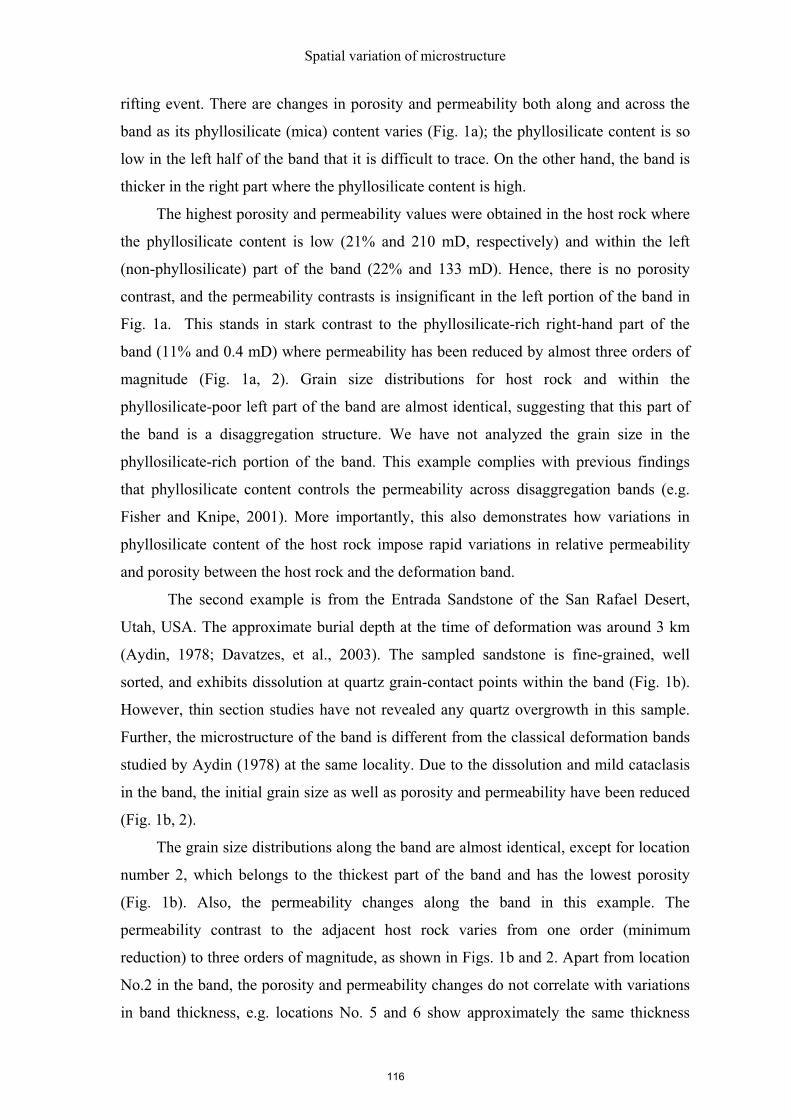
Spatial variation of microstructure
rifting event. There are changes in porosity and permeability both along and across the
band as its phyllosilicate (mica) content varies (Fig. 1a); the phyllosilicate content is so
low in the left half of the band that it is difficult to trace. On the other hand, the band is
thicker in the right part where the phyllosilicate content is high.
The highest porosity and permeability values were obtained in the host rock where
the phyllosilicate content is low (21% and 210 mD, respectively) and within the left
(non-phyllosilicate) part of the band (22% and 133 mD). Hence, there is no porosity
contrast, and the permeability contrasts is insignificant in the left portion of the band in
Fig. 1a. This stands in stark contrast to the phyllosilicate-rich right-hand part of the
band (11% and 0.4 mD) where permeability has been reduced by almost three orders of
magnitude (Fig. 1a, 2). Grain size distributions for host rock and within the
phyllosilicate-poor left part of the band are almost identical, suggesting that this part of
the band is a disaggregation structure. We have not analyzed the grain size in the
phyllosilicate-rich portion of the band. This example complies with previous findings
that phyllosilicate content controls the permeability across disaggregation bands (e.g.
Fisher and Knipe, 2001). More importantly, this also demonstrates how variations in
phyllosilicate content of the host rock impose rapid variations in relative permeability
and porosity between the host rock and the deformation band.
The second example is from the Entrada Sandstone of the San Rafael Desert,
Utah, USA. The approximate burial depth at the time of deformation was around 3 km
(Aydin, 1978; Davatzes, et al., 2003). The sampled sandstone is fine-grained, well
sorted, and exhibits dissolution at quartz grain-contact points within the band (Fig. 1b).
However, thin section studies have not revealed any quartz overgrowth in this sample.
Further, the microstructure of the band is different from the classical deformation bands
studied by Aydin (1978) at the same locality. Due to the dissolution and mild cataclasis
in the band, the initial grain size as well as porosity and permeability have been reduced
(Fig. 1b, 2).
The grain size distributions along the band are almost identical, except for location
number 2, which belongs to the thickest part of the band and has the lowest porosity
(Fig. 1b). Also, the permeability changes along the band in this example. The
permeability contrast to the adjacent host rock varies from one order (minimum
reduction) to three orders of magnitude, as shown in Figs. 1b and 2. Apart from location
No.2 in the band, the porosity and permeability changes do not correlate with variations
in band thickness, e.g. locations No. 5 and 6 show approximately the same thickness
116
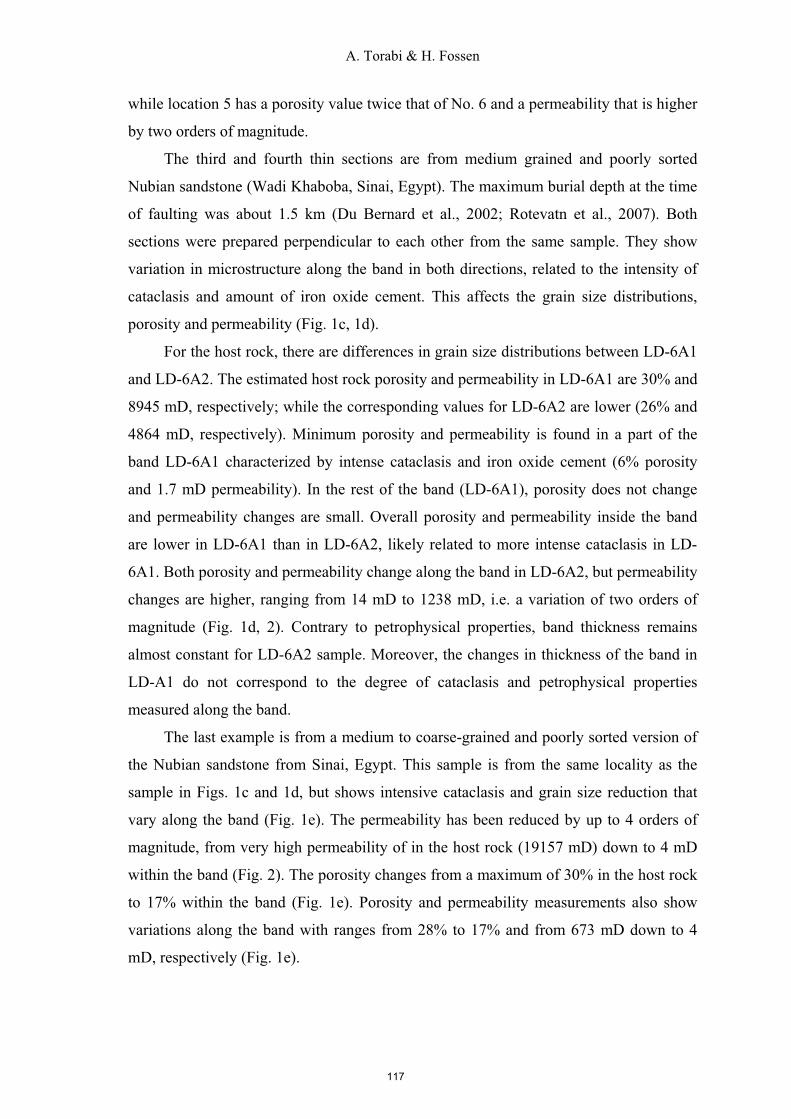
A. Torabi & H. Fossen
while location 5 has a porosity value twice that of No. 6 and a permeability that is higher
by two orders of magnitude.
The third and fourth thin sections are from medium grained and poorly sorted
Nubian sandstone (Wadi Khaboba, Sinai, Egypt). The maximum burial depth at the time
of faulting was about 1.5 km (Du Bernard et al., 2002; Rotevatn et al., 2007). Both
sections were prepared perpendicular to each other from the same sample. They show
variation in microstructure along the band in both directions, related to the intensity of
cataclasis and amount of iron oxide cement. This affects the grain size distributions,
porosity and permeability (Fig. 1c, 1d).
For the host rock, there are differences in grain size distributions between LD-6A1
and LD-6A2. The estimated host rock porosity and permeability in LD-6A1 are 30% and
8945 mD, respectively; while the corresponding values for LD-6A2 are lower (26% and
4864 mD, respectively). Minimum porosity and permeability is found in a part of the
band LD-6A1 characterized by intense cataclasis and iron oxide cement (6% porosity
and 1.7 mD permeability). In the rest of the band (LD-6A1), porosity does not change
and permeability changes are small. Overall porosity and permeability inside the band
are lower in LD-6A1 than in LD-6A2, likely related to more intense cataclasis in LD-
6A1. Both porosity and permeability change along the band in LD-6A2, but permeability
changes are higher, ranging from 14 mD to 1238 mD, i.e. a variation of two orders of
magnitude (Fig. 1d, 2). Contrary to petrophysical properties, band thickness remains
almost constant for LD-6A2 sample. Moreover, the changes in thickness of the band in
LD-A1 do not correspond to the degree of cataclasis and petrophysical properties
measured along the band.
The last example is from a medium to coarse-grained and poorly sorted version of
the Nubian sandstone from Sinai, Egypt. This sample is from the same locality as the
sample in Figs. 1c and 1d, but shows intensive cataclasis and grain size reduction that
vary along the band (Fig. 1e). The permeability has been reduced by up to 4 orders of
magnitude, from very high permeability of in the host rock (19157 mD) down to 4 mD
within the band (Fig. 2). The porosity changes from a maximum of 30% in the host rock
to 17% within the band (Fig. 1e). Porosity and permeability measurements also show
variations along the band with ranges from 28% to 17% and from 673 mD down to 4
mD, respectively (Fig. 1e).
117

Spatial variation of microstructure
Fig.1. Photomicrographs of thin sections of deformation bands (left), porosity and permeability values for measured locations (middle) and plots of grain size distributions (right). On each photograph, the locations are noted. The numbers on the thin section images correspond to the numbers used in presentation of the porosity and permeability data and grain size distributions. (a) Phyllosilicate band(sample 3701); (b) dissolution band (sample UT-A); (c) cataclastic band (sample LD-6A1); (d) cataclastic band (sample LD-6A2); (e) cataclastic band (WK-13).
118

A. Torabi & H. Fossen
The grain size analyses show reduction of the grain size area in the band compare
to the host rock (Fig. 1e), although the grain size area varies also along the band. Again,
the thickness variation does not correlate with the change in microstructure and
petrophysical properties (Fig. 1e). This is shown by the fact that the selected locations in
the beginning and end of the band show similar thickness, but the grain size distribution
and porosity and permeability values are different. High magnification images (Fig. 1e)
reveal different microstructures and grain size distributions for these two parts implying
different degree of cataclasis.
3.2. Effect of initial grain size and porosity
The influence of initial grain size and porosity of the host rock on the
development of deformation band microstructure and properties were explored through a
study of deformation bands that cross nine definable layers at the base of an eolian sand
unit in the Entrada Sandstone in the San Rafael Desert, Utah, USA, (Fig. 3). The burial
depth is thought to be around 3 km at the time of deformation (Aydin, 1978; Davatzes, et
al., 2003). The grain size is generally fining upward through these layers, but detailed
analyses show the grain size and porosity to change at the scale of a single thin section
(Figs. 4 and 5).
Fig.2. Plot of measured permeability values within deformationbands versus host rock permeability. Note to the reductions inpermeability by up to four orders of magnitude in the deformationbands.
119
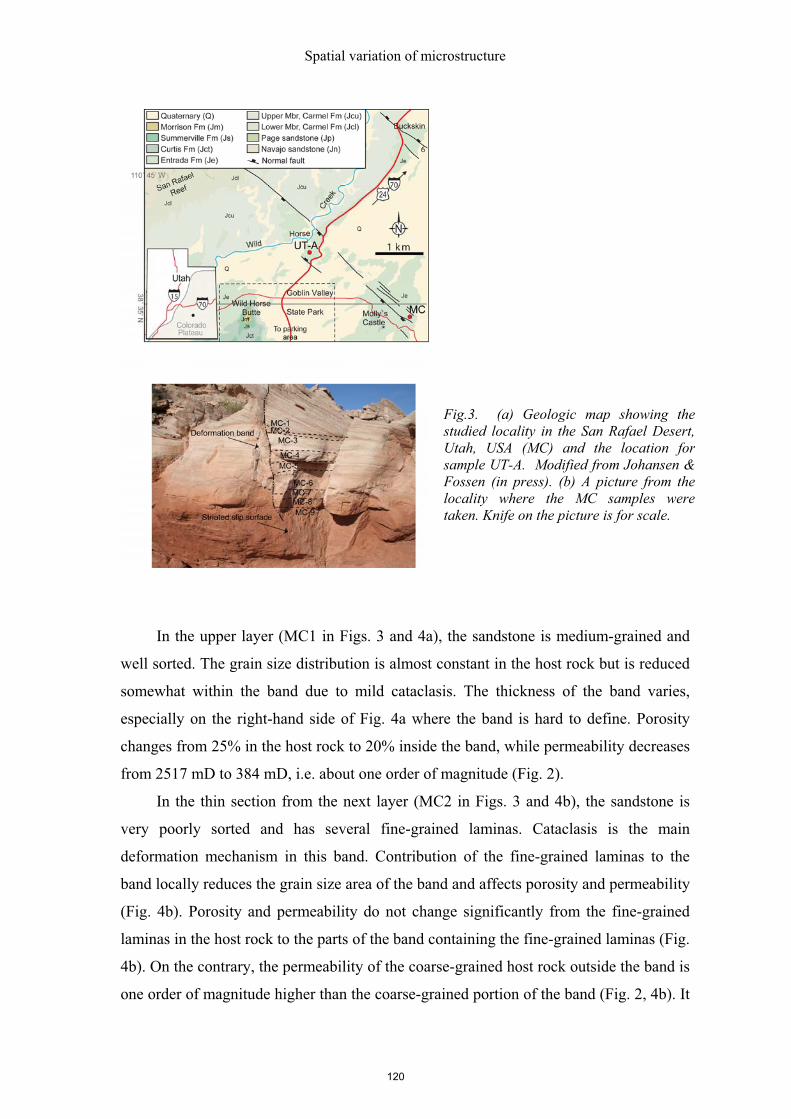
Spatial variation of microstructure
In the upper layer (MC1 in Figs. 3 and 4a), the sandstone is medium-grained and
well sorted. The grain size distribution is almost constant in the host rock but is reduced
somewhat within the band due to mild cataclasis. The thickness of the band varies,
especially on the right-hand side of Fig. 4a where the band is hard to define. Porosity
changes from 25% in the host rock to 20% inside the band, while permeability decreases
from 2517 mD to 384 mD, i.e. about one order of magnitude (Fig. 2).
In the thin section from the next layer (MC2 in Figs. 3 and 4b), the sandstone is
very poorly sorted and has several fine-grained laminas. Cataclasis is the main
deformation mechanism in this band. Contribution of the fine-grained laminas to the
band locally reduces the grain size area of the band and affects porosity and permeability
(Fig. 4b). Porosity and permeability do not change significantly from the fine-grained
laminas in the host rock to the parts of the band containing the fine-grained laminas (Fig.
4b). On the contrary, the permeability of the coarse-grained host rock outside the band is
one order of magnitude higher than the coarse-grained portion of the band (Fig. 2, 4b). It
Fig.3. (a) Geologic map showing the studied locality in the San Rafael Desert, Utah, USA (MC) and the location forsample UT-A. Modified from Johansen & Fossen (in press). (b) A picture from the locality where the MC samples were taken. Knife on the picture is for scale.
120

A. Torabi & H. Fossen
is not easy to trace the band in the right hand side of the section in Fig. 4b, where it
seems to be a zone of deformation with a somewhat lower porosity and permeability
than its surroundings (Fig. 4b).
In layer MC3 (Fig. 3), the thin section only shows the deformed sandstone and
therefore it is difficult to compare the grain size area, porosity and permeability within
and outside the band (Fig. 4c). The grain size distribution is bimodal in that it contains a
considerable amount of both fine and coarse grains (Fig. 4c). Porosity and permeability
are lower than the estimated values from layers MC1 and MC2 (Fig. 4c), suggesting a
higher degree of cataclasis in this sample.
The sandstone in the fourth layer (MC4 in Fig. 3) is poorly sorted and the grain
size distribution both outside and inside the deformation band is bimodal (Fig. 4d).
Porosity is slightly decreased whereas permeability is reduced by up to two orders of
magnitude within the band as a result of mainly cataclasis (Figs. 2 and 4d). The band has
a fairly constant thickness. The thin section from the fifth layer (MC5 in Fig. 3) shows
the sandstone to be poorly sorted (Fig 4e). The band shows a fairly constant thickness
and the grain size analysis reveals a bimodal distribution and also grain size reduction in
the band (Fig. 4e). This reduction is related to the low to moderate amount of cataclasis.
Similar to the previous bands, there are small porosity changes while permeability varies
up to three orders of magnitude (Fig. 2, 4e).
In the thin section from layer MC6 (Fig. 5a), there are two branching bands in the
left-hand part. The thin section shows a very poorly sorted sandstone with finer grain
size areas around two bands. However, the grain size distributions along these bands are
identical (Fig. 5a). The highest permeability reduction in these bands is one order of
magnitude (Fig. 2). Porosity decreases from 20% down to 13% and 14% within the
bands (Fig. 5a). The bands in this layer also show evidence of cataclasis. The thin
section from layer MC7 (Fig. 5b) illustrates poorly sorted sandstone with a high content
of iron oxide. The grain size has obviously been reduced (Fig. 5b) in the band.
Furthermore, porosity is reduced by 2% and permeability by one order of magnitude
compared to the host rock (Fig. 2). Both cataclasis and iron oxide cement are present in
this band. In the sample from layer MC8 (Fig. 3), the sandstone is seen to be poorly
sorted. The boundaries of the band are sharp and easily definable in the BSE images
(Fig.5c).
121
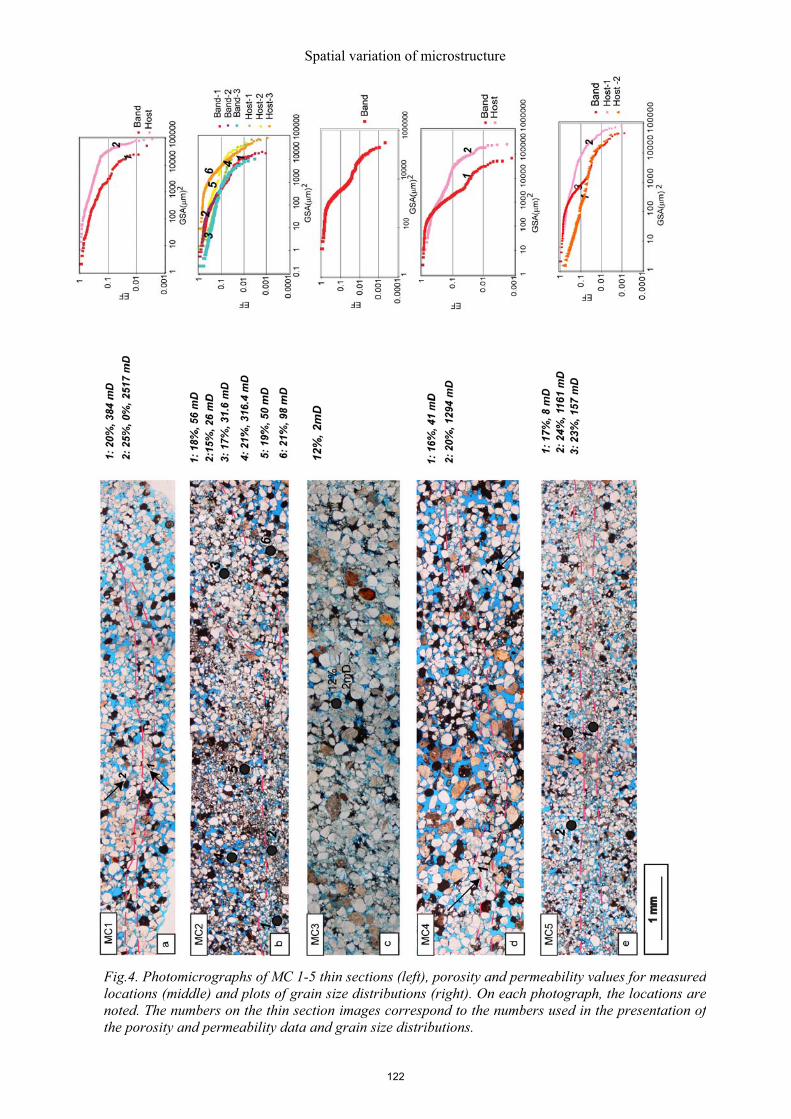
Spatial variation of microstructure
Fig.4. Photomicrographs of MC 1-5 thin sections (left), porosity and permeability values for measuredlocations (middle) and plots of grain size distributions (right). On each photograph, the locations are noted. The numbers on the thin section images correspond to the numbers used in the presentation ofthe porosity and permeability data and grain size distributions.
122

A. Torabi & H. Fossen
Fig.5. Same as Fig. 4, but for samples MC 6-9.
123

Spatial variation of microstructure
This can be explained by the intense cataclasis in this band. The grain size analysis
(Fig. 5c) shows two different grain size distributions in the host rock. The one obtained
from loc. 4 is finer than that from loc. 3 in Fig. 5c. As it is expected, porosity and
permeability are higher in the coarse host rock than fine one. Two measured locations in
the band show almost similar grain size distribution and porosity, whereas permeability
is one order of magnitude lower in loc. 2 than loc. 1 (Figs. 2 and 5c).
In the section from layer MC9, two bands merge into a single thin band (Fig. 5d).
The sandstone is fine-grained and poorly sorted. Grain size area is finer in the merged
bands than in the individual branches (Fig. 5d). Porosity decreases by up to 12 % in the
band compared to the host (Fig. 5d). Permeability is low outside the band, but still
decreases by up to two orders of magnitude into the band (Fig. 2).
4. Discussion
Most previous workers address deformation bands and the reduction in
permeability across them from a one-dimensional perspective. In this work we have
explored how deformation bands show significant internal variations along the bands, by
analyzing thickness, microtexture and petrophysical properties.
4.1. Band thickness
Experimental and numerical studies show that the thickness of shear deformation
bands depends on grain size, grain angularity, and initial density and confining pressure
(Bésuelle, 2001; Haied et al., 2000; Bied et al., 2002; Alsaleh, et al., 2006; Alshibli et
al., 2006). The presence of coarse, non-fractured grains in the bands, e.g. the intact
coarse grain in each of the bands in Figs. 1c, d and e, affects the thickness of the bands.
The presence of intact coarse grains in the middle of cataclastic bands can be explained
by the fact that selective fracturing of relatively large grains is favored at high confining
pressures during shearing (Blenkinsop, 1991). For the examples presented here, the
confining pressure may not be sufficient to cause fracturing of the largest grains. Our
observations also show that the band is thicker where the mica content is high in the
phyllosilicate band (Fig. 1a).
Numerical modeling of strain localization in granular material shows that shear
band thickness tends to reduce as a result of increasing confining pressure (Alsaleh et al.,
124

A. Torabi & H. Fossen
2006; Alshibli, et al., 2006). Furthermore, the results from ring shear experiments reveal
that increasing the level of normal stress (corresponding to confining pressure) can
change diffuse boundary shear zone to sharp boundary ones implying reduction in their
thickness (Torabi et al., 2007). In this light, the natural deformation bands studied here
formed at different confining pressures. However, for each band confining pressure and
bulk strain is basically constant at the scale of observation during the formation of the
deformation bands. Rather, the variations in microtexture and degree of cataclasis along
the bands can be ascribed to variations in strain within the bands, i.e. stronger strain
localization implies more cataclasis. More exactly, in the studied samples the level of
strain localization is not simply related to the thickness of the band. For instance, the two
selected parts of the band in Fig. 1e have almost the same thickness but show different
degree of cataclasis and hence different grain size and petrophysical properties.
4.2. Deformation mechanism
Initial porosity and grain size are important factors influencing the deformation
mechanism (Wong et al., 1997; Flodin et al., 2003). The MC samples, collected from
layers with different grain size and porosity, all show clear evidence of cataclasis, but
the degree of cataclasis changes from one layer to the next based on grain size analyses
(Figs. 4, 5).
The effect of phyllosilicate content and cement on deformation mechanism during
the deformation of granular material has received attention (e.g. Trent, 1989; Yin and
Dvorkin, 1994; Antonellini et al., 1994; Flodin et al., 2003). Antonellini et al. (1994)
reported that deformation band tends to be narrow and localized where the host rock
phyllosilicate content is high. They also found that the thickness of the phyllosilicate
bands depends on the amount of offset they accommodate. However, the offset in the
phyllosilicate band in Fig. 1a can be considered to be constant at the scale of the thin
section, thus eliminating this effect in our examples. Rather, the porosity and
permeability reduction found in the phyllosilicate band in Fig. 1a depend on the
continuity and phyllosilicate content of the band: the porosity and permeability values
are lower where the band has higher phyllosilicate content. This is well illustrated by
location No.7 in Fig. 1a, which has 11% porosity and 0.4 mD permeability.
Cemented granular material are found to be more resistant to grain crushing as
compared to the same uncemented material for the same loading and confining pressure
125

Spatial variation of microstructure
(e.g. Trent, 1989; Yin and Dvorkin, 1994). Quartz dissolution and iron oxide cement in
deformation bands hinder cataclasis by increasing the bounding surface of the grains and
hence distributing the contact forces over a larger area (e.g. bands in Fig. 1b, 1c, 1d). On
the other hand, iron oxide also can reduce the friction between grains, promoting grain
boundary sliding (Underhill and Woodcock, 1987).
The timing of deformation relative to any chemical dissolution and cementation is
also important (e.g., Eichhubl et al., 2006). Dissolution and cementation decrease
porosity and permeability in the band (Figs. 1, 4 and 5) and post-deformational
dissolution can clearly be variable along bands. Our observations show that dissolution
hinders cataclasis and thereby the mild cataclasis in the studied dissolution bands makes
its microstructure different from classical deformation bands reported from the same
area in San Rafael Desert, Utah, provided that the dissolution is not post-kinematic.
We have investigated the relationship between porosity and permeability in the
cataclastic deformation bands and their host rock. It has been suggested before that there
Fig.6. (a) porosity-permeability relationship in the studiedcataclastic deformation bands and their host rock; (b)relationship between (s) specific surface area of the pore-grain interface and permeability for the deformation bands and theirhost rock; Higher specific surface area implies lowerpermeability values. Note to the different trends for bands andthe host rocks in both plots.
126

A. Torabi & H. Fossen
is no direct relationship between porosity and permeability because permeability
depends on the connectivity of pores (Dandekar, 2006). By comparing the porosity-
permeability data for the cataclastic deformation bands investigated in this study (Figure
6a) we see a clear relationship between the two. The relationship between porosity and
permeability is less well-defined for host-rock data (Figure 6a), but a comparison
indicates that host rock permeability is higher than deformation band permeability for
the same porosity value. Although more data would be needed to quantify this
difference, it can be explained in terms of the different processes involved: The
microstructure of the host rock is controlled by sedimentary processes and compaction,
while that of the cataclastic bands is very much the result of grain crushing, which
results in more angular grains and a different grain size distribution (Figs. 1, 4, 5). As a
consequence of cataclasis, the specific surface area of pore-grain interface increases (s is
calculated from Eq. 3 in the methodology section, see Fig.6b). Therefore, the increased s
as result of cataclasis causes more reduction in permeability.
The effect of mean grain size, sorting and porosity on permeability of
unconsolidated media through another version of Kozeny-Carman relationship has been
previously addressed by Panda & Lake, 1994. They have shown that permeability is
sensitive to porosity, mean grain size and sorting for permeabilities higher than 1 Darcy.
Moreover, variations in mean grain size contribute more to permeability changes than do
variations in porosity or sorting. Our results for the Cataclastic deformation bands with
lower permeability values are in agreement with their conclusions.
The present work opens new horizons into detailed understanding of the
permeability structure of deformation bands. In order to understand the relationship
between deformation mechanism within deformation bands on one side and their
microstructure and petrophysical properties on another side, we need to study
appropriate experimental and numerical analogues. Examples of other types of
deformation bands, such as dilation and compaction bands, have to be studied to
investigate the effect of shear in localization, thickness and property variation within the
bands.
4.3. Implications for fluid flow
Variations in petrophysical properties along deformation bands influence their role in a
petroleum reservoir setting. Deformation bands can act as both conduits and barriers on
127

Spatial variation of microstructure
microscopic scale, although the latter is more common. The rapid variation in properties
along bands even on mm and cm scale, implies that deformation bands may not hold any
significant pressure difference along them and probably do not contribute to the sealing
capacity of faults, as argued by for example Harper and Lundin (1997). On the other
hand, cataclastic bands can affect the petrophysical characteristics of the reservoirs in a
production situation, although their influence on productivity strongly depends on the
cumulative thickness of the bands as well as their internal reduction in permeability
(Fossen & Bale, 2007). Plug permeability measurements across cataclastic bands and
dissolution/cementation bands show several orders of variation (Fossen et al., 2007 and
references therein). We suggest that the lateral variations in porosity and permeability
documented through the image analyses in the current work could explain at least some
of this scatter.
Disaggregation bands are effective baffles to fluid flow only if the phyllosilicate
content is high and evenly distributed throughout the host rock, which is not generally
the case. Hence, the variation in permeability values related to the phyllisilcate content
in the band, as exemplified by Fig. 1a, can explain the wide variation in reported
permeability values for this type of bands (e.g., Fisher and Knipe, 2001). Thus, different
types of deformation bands (cataclastic and non-cataclastic) show spatial variations in
petrophysical properties even at the cm-scale, suggesting that different factors control
these variations in each case. We have demonstrated how variations in mineralogy,
notably phyllosilicate content, can cause significant spatial changes in permeability
along disaggregation bands. Secondary cementation can also be variably developed, for
instance as a function of clay mineral distribution. The variations documented in
cataclastic bands are enigmatic, and more research is required to understand and predict
these variations.
5. Conclusions
1. Deformation bands can show rapid variations in microstructure that cause
variations in porosity and permeability along the strike and dip of the bands.
2. These variations occur in disaggregation bands, dissolution/cementation bands
and cataclastic bands. In particular, the local phyllosilicate content control
disaggregation bands in phyllosilicate-bearing sandstones.
128

A. Torabi & H. Fossen
3. Our results show that permeability can change from one up to two orders of
magnitude over a short (mm-scale) distance within a single band.
4. Phyllosilicate content influences the thickness of the band, i.e. higher
phyllosilicate content implies a thicker band.
5. No simple relationship between thicknesses and intensity of cataclasis can be
detected in the studied cataclastic deformation bands.
6. The widely scattered distribution of previously reported porosity and
permeability data for both phyllosilicate and cataclastic bands is likely caused by
the observed spatial variation in petrophysical properties of individual bands.
Permeability variations along deformation bands make them unlikely to
contribute to the sealing properties of faults. Therefore, we predict they have a
restricted influence on hydrocarbon production in most cases.
7. The porosity-permeability relationship in the cataclastic bands is affected by
cataclasis and the resulting reduction in size, sorting and roundness of the grains
caused by this mechanism. Statistically, this results in lower permeability in the
band than in undeformed sandstone of identical porosity.
Acknowledgements
We are grateful to the sponsors of the Fault Facies project (Norwegian Research
Council, StatoilHydo, Conoco-Philips) at Centre for Integrated Petroleum Research at
the University of Bergen. Thanks to Behzad Alaei for scientific advice in the image
processing work. Alvar Braathen is appreciated for comments on an earlier version of
the manuscript.
References
Agung, M. W., Sassa, K., Fukuoka, H., Wang, G., 2004. Evolution of shear zone
structure in undrained ring-shear tests. Lanslides 1, 101-112.
Alshibli, K. A., Alsaleh, M. J., Voyiadjis, G. Z., 2006. Modelling strain localization in
granular materials using micropolar theory, numerical implementation and verification,
Int. Anal. Mech. Geomech., 30, 1525-1544.
Alsaleh, M. I., K. A., Alshibi, G. Z., Voyiadjis, 2006. Influence of micromaterial
heterogeneity on strain localization in granular materials, International Journal of
geomecahnics, Vol. 6, Issue 4, pp. 248-259
129
Spatial variation of microstructure
Antonellini, M. and Aydin, A., 1994. Effect of faulting on fluid flow in porous
sandstones: petrophysical properties, AAPG Bull., 78, 355-377.
Archie, G. E., 1942. The electrical resistivity log as an aid in determining some reservoir
characteristics. Trans. Am. Ins. Min. Metall. Pet. Eng., 146, 54-62.
Aydin, A., Johnson, A. M., 1978. Development of faults as zones of deformation bands
and slip surfaces in sandstone. Pure and Applied Geophysics, 116, 931-942.
Aydin, A. & Johnson, A. M., 1983. Analysis of faulting in porous sandstones, Journal of
Structural Geology 5, 1, 19-31.
Aydin, A., 1978. Small faults formed as deformation bands in sandstone. Pure and
Applied Geophysics 116, 913-930.
Bakke, S., Øren, P. E. 1997. 3-D Pore-scale modelling of sandstones and flow
simulations in the pore networks, SPE 35479, 2.
Berryman, J. G., 1985. Measurement of spatial correlation functions using image
processing techniques. J. Appl. Phys., 57, 2374-2384.
Berryman, J. G., 1998. Planar spatial correlations, anisotropy, and specific surface area
of stationary random porous media, J. Appl. Phys., 83 (3).
Blair, S. C., Berge, P.A. & Berryman, J. G., 1996. Using two-point correlation functions
to characterize microgeometry and estimate permeabilities of sandstones and porous
glass, J. Geophys. Res., 101(B9), 20359-20375.
Blenkinsop, T. G., 1991. Cataclasis and process of particle size reduction. PAGEOPH
136 (1).
Bésuelle, P., 2001 Evolution of strain localization with stress in sandstone: Brittle and
semi-brittle regimes, Phys. Chem. Earth, 26, 101-106.
Davis, G. H., 1999. Structural geology of the Colorado Plateau region of Southern Utah.
Geological Society of America, Special Papres, 342.
Davatzes, N. C., Aydin, A., Eichhubl, P., 2003. Overprinting faulting mechanisms
during the development of multiple fault sets in sandstone, Chimney Rock fault array,
Tectonophysics, 363, 1-18.
Doyen, P. M., 1988. Permeability, conductivity, and pore geometry of sandstone, J.
Geophys. Res., 93, 7729-7740.
Dandekar, A. Y., 2006. Petroleum reservoir rock and fluid properties, 460 pp., CRC
Press, Taylor and Francis Group.
130

A. Torabi & H. Fossen
Ehrlich R., Kennedy, S. K., Crabtree, S. J. & Cannon, R. L., 1984. Petrographic image
anlysis: I. Analysis of reservoir pore complexes, Journal of Sedimentary Petrology, 54,
1515-1522.
Fisher, Q. J. & Knipe, R. J., 2001. The permeability of faults within siliciclastic
petroleum reservoirs of the North Sea and Norwegian Continental Shelf. Marine and
Petroleum Geology, 18, 1063-1081.
Fossen, H., Schultz, R. A., Mair, K. and Shipton, Z., 2007. Deformation bands in
sandstones- a review, Journal of Geological Society, London, 164, 755-769.
Fossen, H. & Bale, A., 2007. Deformation bands and their influence on fluid flow.
AAPG Bulletin, December issue in press.
Garboczi, E. J., Bentz, D. P. & Martys, N. S., 1999. Digital images and computer
modelling. Experimental methods in the physical sciences, Methods in the Physics of
Porous Media, Chapter 1, Academic Press, San Diego, CA. 35, 1-41.
Gibson, R. G., 1998. Physical character and fluid-flow properties of sandstone-drived
fault zone. Geological Society London, Special Publication 127, 83-97.
Haied, A., Kondo, D., Henry, J. P., 2000. Strain localization in Fontainbleau Sandstone.
Mechanics of Cohesive-Frictional Materials, 5, 239-253.
Harper, T. R. & Lundin, E. R., 1997. Fault seal analysis: reducing our dependence on
empiricism. In: Möller-Pedersen, P. & Koestler, A. G. (eds) Hydrocarbon seals-
Importance for Exploration and Production. Norwegian Petroleum Society, Special
Publication 7, 149-165.
Hesthammer, J. & Fossen, H., 2001. Structural core analysis from the Gullfaks area,
Northern North Sea. Marine and Petroleum Geology 18, 411-439.
Hesthammer, J., Bjørkum, P. A. & Watts, L., 2002. The effect of temperature on sealing
capacity of faults in sandstone reservoirs: Examples from the Gullfaks and Gullfaks Sør
fields, North Sea. AAPG Bulletin.
Jamison, W. R., Stearns, D. W., 1982. Tectonic deformation of Wingate Sandstone,
Colorado National Monument. AAPG Bulletin, 66, 2584-2608.
Johansen, T. E. S., Fossen, H. 2008. Internal deformation of fault damage zones in
interbedded siliciclastic rocks. Geological Society, London Special Publications, in
press.
Keehm, Y., Mukerji, T. & Nur, A., 2004. Permeability prediction from thin sections: 3D
reconstruction and Lttice-Boltzmann flow simulation, Geophys. Res. Let., 31, L04606.
131

Spatial variation of microstructure
Keehm, Y., Sternlof, K., Mukerji, T., 2006. Computational estimation of compaction
band permeability in sandstone. Geosciences Journal, 10, 4, 499-505.
Knipe, R. J., Fisher, Q. J. & Clennel, M. R., et al.,1997. Fault seal analysis: successful
methodologies, application and future directions. In: Møller- Pedersen, P. & Koestler,
A.G. (eds) Hydrocarbon Seals: Importance for Exploration and Production. Norwegian
Petroleum Society Special Publication, 7, 15–40.
Koplik, J., C., Vermette, L. M., 1984. Conductivity and permeability from
microgeometry, J. Appl. Phys., 56, 3127-3131.
Ogilvie, S. R. & Glover, Paul, W. J., 2001. The petrophysical properties of deformation
bands in relation to their microstructure; Earth and Planetary Science Letters, 193, 129-
142.
Panda, M., N. & Lake, L. W., 1994. Estimation of single-phase permeability from
parameters of particle-size distribution, AAPG Bulletin, 78, 7, 1028-1039.
Pittman, E. D., 1981. Effect of fault-related granulation on porosity and permeability of
quartz sandstones, Simpson Group (Ordovician) Oklahoma. AAPG Bulletin, 65, 2381-
2387.
Rawling, G. C.& Goodwin, L. B., 2003. Cataclasis and particulate flow in faulted poorly
lithified sediments, Journal of Structural Geology, 25, 3, 317-331.
Rotevatn, A., Torabi, A., Fossen, H., Braathen, A., 2007. Slipped deformation bands: a
new type of cataclastic deformation bands in Western Sinai, Suez Rift, Egypt, Accpeted
by Journal of Structural Geology.
Rykkelid, E. Fossen, H. 2002: Layer rotation around vertical fault overlap zones:
observations from seismic data, field examples and physical experiments. Marine and
Petroleum Geology, 19, 181-192.
Torabi, A., Braathen, A., Cuisiat, F., Fossen, H., 2007. Shear zones in porous sand:
Insights from ring-shear experiments and naturally deformed sandstones.
Tectonophysics, 437, 37-50.
Torabi A., Fossen, H., Alaei, B., 2007, Application of spatial correlation functions in
permeability estimation of deformation bands in porous rocks. In review, Journal of
Geophysical Research (Solid Earth).
Trent, B. C., 1989. Numerical simulation of wave propagation through cemented
granular material, in AMD-101, Wave Propagation in Granular Media, eds. D.
Karamanlidis and R. B. Stout, 9-15.
132

A. Torabi & H. Fossen
Underhill, J. R. & Woodcock, N. J., 1987. Faulting mechanisms in high porosity
sandstones; New Red Sandstone, Arran, Scotland, In: Jones, M. E., Preston, R. M. F.
(Eds.), Deformation of sediments and sedimentary rocks, Geological Society Special
Publication, 29, 91-105.
White, J., A, Borja, R. I., Fredrich, J. T., 2006. Calculating the effective permeability of
sandstone wit multiscale lattice Boltzmann/finite element simulations. Acta
Geotechnica, 1, 195-209.
Yin, H. & Dvorkin, J., 1994. Strenght of cemented grains, Geophysical Research Letters
21, 10, 903-906.
133

134

PhD dissertation, A. Torabi, 2007
Synthesis
135

136

PhD dissertation, A. Torabi, 2007
SynthesisThis dissertation contributes to our detailed understanding of the microstructure of
deformation bands and their related petrophysical properties. The papers presented in
this dissertation address deformation bands, their microstructure, and evolution; and how
they affect porosity and permeability (petrophysical properties) in porous sandstones.
Here I synthesize the papers, discussing the findings reported in the individual papers
with respect to each other. Implementation of such studies to the geological and
simulation models for reservoirs can provide more realistic models. The ultimate goal is
improved understanding of hydrocarbon flow within faulted reservoirs.
Progress on deformation band microstructure
We have compared experimentally-produced shear zones that resemble
deformation bands to natural deformation bands, acknowledging that the deformation
process is to some extent different in the ring-shear experimental apparatus than in
natural deformation bands (Paper 1). The key difference is that in the ring-shear
experiments the displacement and strain rate are far larger than in the natural setting.
One can say that larger displacements in the experimental shear zones make them more
comparable to faults than deformation bands. However, utilizing the ring-shear
apparatus for deformation of highly-porous sand in a condition similar to shallow to
medium burial depth and having the constrained thickness of the sample to the space
between the rings, makes our comparison reasonable. In another word, the experimental
shear zones have similar thickness to the single natural deformation bands.
We have identified variation in microstructure across experimental shear zones
which are comparable to that seen in natural deformation bands (Paper 1). This variation
has been previously addressed by a number of workers (e.g. Aydin, 1978; Aydin and
Johnson, 1978, 1983; Gabrielsen and Aarland, 1990; Davis, 1999; Agung, 2004). The
thin section microscopy studies of experimental shear zones produced by the ring-shear
apparatus revealed the presence of three layers: a top layer, a central shear zone and a
bottom layer (Paper 1).
The experimental shear zones were classified into two groups, diffuse boundary
shear zones and sharp boundary shear zones. Diffuse boundary shear zone formed at
low levels of normal stress and/or shear displacement, whereas sharp boundary shear
zone formed at high normal stress and/or at high shear displacements. The sharp
137

PhD dissertation, A. Torabi, 2007
boundary shear zone has not been previously reported from ring-shear experiments
performed on sand or sandstone. The sharp boundary shear zones consist of margins of
crushed and compacted grains around a more crushed and compacted central part which
shows maximum reduction in particle size and significant porosity decrease. These shear
zones are similar in microstructure to the classic deformation bands reported by Aydin
(1978), which also have a compacted outer layer, but in which the deformation
mechanism is mainly pore collapse.
The significant parameter that controls the transition from diffuse to sharp
boundary shear zone is the transition of the grain fracturing mode from dominant flaking
(e.g. Rawling and Goodwin, 2003; Paper 1) to dominant splitting. The transition occurs
as a result of increasing the level of stress in the ring shear (similar to increasing the
confining pressure in nature). This shift results in an increase in the D value (the power
dimension of the grain size distribution fit). D has a good inverse correlation with the
degree of cataclasis and grain size reduction (Blenkinsop, 1991; An & Sammis, 1994).
However, the D values are relatively low in the experimental sharp boundary shear zone
(D reaches a maximum of 1.5), suggesting that they have not reached the steady state
particle size distribution (D~2.58).
Study of the effect of grain size on the frictional behavior of sand in the ring-shear
experiments indicates that initial grain size has no influence on the deformation behavior
at 5 MPa normal stresses (Paper 1; Kjelstad et al., 2002). On the other hand, Mair et al
(2002) based on experiments from 5 MPa to 40 MPa stress, showed that grain
characteristics, such as grain size distribution and roughness, have a clear effect on the
frictional behavior of granular shear zones. In our ring-shear experiments, we have not
investigated the effect of grain characteristics on experiments at more than 5 MPa.
Visual inspection of the experimental shear zones revealed that diffuse boundary
shear zones are wider than sharp boundary ones (Paper 1). This is in agreement with
results from numerical study of strain localization in granular material by for example
Alsaleh (2006) and Alshibli et al. (2006). These studies showed that shear band
thickness was found to decrease with increasing confining pressure. However, we have
also demonstrated (Paper 4) that in natural deformation bands under constant confining
pressure at the scale of a single deformation band, there is no simple relationship
between thickness of the cataclastic deformation band and the degree of cataclasis within
the band. The degree of cataclasis which is a factor of strain localization varies within
Cataclastic deformation bands. Other factors that influence the thickness of deformation
138

PhD dissertation, A. Torabi, 2007
bands during localization, such as grain characteristics, mineralogy, and initial porosity,
need to be further investigated by both experimental and numerical studies. Besides, the
research presented here shows there is a direct relationship between the thickness of the
bands and the proportion of phyllosilicate (Paper 4).
Several of our studies have examined the spatial variation of deformation band
microstructure, a topic which has received little or no attention in the literature. In this
light, it is of interest that we show that a single band can change in thickness and
microstructure over a short (mm-scale) distance. The variation in microstructure of the
band implies that there is spatial variation in its petrophysical properties; this will be
discussed further in the next sections.
A new type of deformation band has also been introduced through outcrop (Sinai,
Egypt) and microscopy studies; here termed a slipped deformation band (Paper 2).
Slipped deformation bands, characterized by a central slip surface, are different from
conventional deformation bands (e.g. Aydin, 1978; Davatzes & Aydin 2003, Shipton &
Cowie 2003, Johnson & Fossen in press). There is no compaction zone around the
central part of the band in the slipped deformation bands from Sinai, Egypt. Therefore,
in the slipped bands, the transition from the mildly-fractured background (host) rock to
the band is sharp. We termed these individual tiny deformation bands "slipped
deformation bands" because they can accumulate abundant shear strain and exhibit a slip
surface. It is unclear how they form, but one plausible explanation can be found by the
cam-cap model (e.g. Rudnicki & Rice, 1975; Rudnicki, 2002; Schultz & Siddharthan,
2005, Fossen et al., 2007; Holcomb et al., 2007). The background fracturing was
probably induced during initial compaction as a result of overburden pressure, after
which the deformation bands formed in a condition near simple shear-compaction in the
field to the right-hand side of the cam-cap (Paper 2). The condition for localization of
these bands is uncertain, but the parameters such as initial grain size and porosity should
be significant.
Image processing technique for estimation of porosity and permeability
While microstructural variations along as well as across deformation bands are
easily studied under the microscope, their internal permeability structure is difficult to
assess by means of classical methods (e.g. permeability obtained from mini-
permeameter and laboratory plug measurements). Mini-permeameter and laboratory
plug measurements directly measure porosity and permeability for a band together with
139

PhD dissertation, A. Torabi, 2007
its less deformed surrounding, whereas by application of image processing method, we
are able to isolate the properties of only deformation band.
We have developed an image processing-based method which is applied on high
resolution and -magnification images of thin sections. The image processing method
applies statistical approaches such as spatial correlation functions to obtain porosity and
specific surface area of the pore-grain interface from backscatter images of sandstone. In
this method, we are able to catch the irregularities of the pore-grain interface, something
that can not be done in other approaches such as process-based modeling by Bakke and
Øren (1997), where they use an original BSE image of undeformed sandstone to obtain
the grain size distribution and finally populate their model with a random spherical grain
size distribution and use clay and cement to reach to the approximate angularity of the
real grains.
We have used a similar approach to what Blair et al. (1996) used, but they applied
that method on images from 2D thin sections of undeformed sandstone, which had
simpler pore size distribution compared to deformation bands. Later on Keehm et al.
(2004); and White et al. (2006) calculated effective permeability of compaction bands in
sandstone through stochastic 3D porous media reconstruction and flow simulation using
the Lattice Boltzman method. They used the calculated two-point correlation function of
the 2D images (similar to what we calculate) to reconstruct their 3D model.
Furthermore, they modeled compaction bands which lack cataclasis. Our research
indicates that in order to capture the complex microgeometry of cataclastic deformation
bands, we need to take several high magnification images that cover the entire width of
the band and use these images to calculate an average specific surface area for the band.
We have resolved the problem of the sensitivity of specific surface area estimation
to the resolution of the image (e.g. Keehm et al., 2004) by using high resolution images
that provide insight into complex microgeometries. Implementation of image processing
methods for deformation bands enables us to map out the variation in porosity and
permeability across as well as along tiny deformation bands. Moreover, by applying this
method on thin sections of different orientation, we can map out the properties of the
band in different orientations (Papers 3 and 4).
Assessing the petrophysical properties of deformation bands
The macroscopic anisotropy across deformation bands and their influence on the
petrophysical characteristics of petroleum reservoirs have been addressed before by
140

PhD dissertation, A. Torabi, 2007
among others Antonellini and Aydin (1994), Sigda et al. (1999) and Shipton et al.
(2002). The microscopic anisotropy in the properties along a deformation band has been
described in Paper 3 of this thesis. Comparison of porosity and permeability estimates
from image processing with direct measurements of porosity and permeability from
plugs is not straightforward, as the scale of measurement is different. Comparison of our
estimated values to lab-measured data shows that the estimated values are always lower
than the lab-measured values. We ascribe this difference to the scale limitation (2.54
cm/1 inch) inherent when plug-sized samples are used to measure the properties of
millimeter-wide bands.
Our results from image processing show that both porosity and permeability
decrease in the studied cataclastic bands compare to the host rock, but the permeability
reduction is substantial (up to four orders of magnitude). This is in agreement with lab-
measured data (Papers 2, 3) and consistent with the studied cataclastic deformation
bands exhibiting more grain crushing than compaction, reducing the grain size and
increasing the specific surface area of the pore-grain interface. Hence, the permeability
values decrease. In addition, the studied dissolution band (Paper 4) showed up to four
orders of magnitude reduction in permeability. This can be also explained by increased
specific surface area of the pore-grain interface as a consequence of touching grains.
This study describes new aspects of anisotropy in petrophysical properties such as
porosity and permeability induced by deformation bands in the deformed sandstones in
microscale. By using our developed image processing method, we have obtained several
porosity and permeability measurements for a single band in one thin section,
identifying permeability changes up to two orders of magnitude along the band (Paper
4). These changes are related to the variation in microstructure and grain size along the
band, as described in the first section of this discussion. We suggest that lateral
variations in porosity and permeability documented through image analyses presented in
Papers 3 and 4 can explain at least some of the scatter in the porosity and permeability
data reported in the literature.
Implications for fluid flow
The effect of deformation bands on fluid flow in a petroleum reservoir depends on
the type of deformation band, which is linked to (i) their deformation mechanisms, (ii)
their physical properties, and more importantly (iii) the variation of properties such as
porosity and permeability across as well as along the bands. Our observations show that
141

PhD dissertation, A. Torabi, 2007
cataclastic deformation bands can reduce absolute permeability values up to four orders
of magnitude (Papers 3 and 4). In this sense, they are considered to be important for
reservoir management, particularly where they appear in clusters in the damage zones of
large faults. On the other hand, rapid spatial variation in properties along bands (Paper 4)
implies that deformation bands may rarely be significant pressure barriers and thus
probably do not contribute significantly to the sealing capacity of faults (e.g. Harper and
Lundin, 1997). In the case of phyllosilicate bands, which are abundant in North Sea
petroleum reservoirs, predicting their thickness and continuity is essential for planning
oil and gas fields production (Fisher and Knipe, 2001; Hesthammer and Fossen, 2001;
Ogilvie and Glover, 2001). Phyllosilicate bands can potentially seal hydrocarbon
columns with heights of several hundred metres (Gibson, 1998). During reservoir
development, it is important to consider the influence of diagenesis on the petrophysical
characteristics of the reservoir, particularly concerning the effect of quartz cement in
deep reservoir horizons (more than about 2 km). Finally, the effect of deformation
bands on fluid flow in reservoirs depends on their spatial distributions and their
abundance, which is beyond the scope of the presented work.
Limitations related to the current study
Research is perhaps always compromised by limitations of some kind, and this
research is not an exception. There are limitations inherent both in the instruments
applied and in the methods that have been used in this study. The limitations that are
related to the individual steps of this research are as follows:
Constraints imposed by the ring-shear apparatus limited the experiments to (i) a
predefined shear surface, and (ii) higher shear displacement than it is required for
the formation of deformation bands. Taken together, these make the comparison
of experimental shear zones to natural deformation bands less straight forward;
this is discussed further in Paper 1.
The time-consuming segmentation process for grain size analysis and also the
image processing for porosity, permeability estimations rely on the quality of the
obtained binary image and the level of threshold that a backscatter image is
assigned to (Papers 3, 4). A quality check should be done during binarizing
images by comparing them to the original BSE images.
142

PhD dissertation, A. Torabi, 2007
In the Kozney-Carman relation, the constant c is considered to be equal to 2 for
the pores with circular cross-sections. In order to calculate the formation factor
we used an exponential relationship between porosity and formation factor
(Archie, 1942). The results could be slightly different if we could measure the
formation factors for the studied deformation bands (Paper 3).
Suggestions for future work
Further investigation is also needed on the initiation and development of
deformation bands in a wide range of sandstones with different mineralogy,
initial grain size, and porosity.
The presence of cement at the time of deformation affects the deformation
processes and resulting deformation-band properties (e.g. Trent, 1989; Yin and
Dvorkin, 1994). The effect of quartz cement on cataclasis and the significance of
phyllosilicates on the initiation of quartz cement should be studied further.
In order to better simulate the natural formation of deformation bands,
performing experiments with fluid in the pore spaces (that is, undrained) is
recommended. At low confining pressures and in the presence of fluids, minerals
such as feldspar are deformed by chemical alteration rather than physical
deformation.
In order to document the detailed microstructure of deformation bands,
especially when one is trying to build a 3D geological model, we suggest making
thin sections at least in two perpendicular directions.
High resolution X-ray microtomography can be used to characterize the 3D
microgeometry of deformation bands if their resolution is sufficient for capturing
the complex microgeometry of cataclastic bands. This type of study may add to
our knowledge about deformation bands.
In the case of slipped deformation bands (Paper 2) more field work is needed to
find out whether this kind of band is common in other similar geological settings,
and in sandstones with similar petrophysical properties. Besides, understanding
the mechanism of formation of slipped bands requires theoretical work, triaxial
analogue modeling, and developing their cam-cap model accordingly. The initial
material properties, such as grain size and porosity, must be considered in such
studies.
143

PhD dissertation, A. Torabi, 2007
References Agung, M. W., Sassa, K., Fukuoka, H., Wang, G., 2004. Evolution of shear zone
structure in undrained ring-shear tests. Landslides 1, 101-112.
Antonellini, M. and Aydin, A., 1994. Effect of faulting on fluid flow in porous
sandstones: petrophysical properties, AAPG Bull., 78, 355-377.
Archie, G. E., 1942. The electrical resistivity log as an aid in determining some reservoir
characteristics. Trans. Am. Ins. Min. Metall. Pet. Eng., 146, 54-62.
Aydin, A., 1978. Small faults formed as deformation bands in sandstone. Pure and
Applied Geophysics 116, 913-930.
Aydin, A. & Johnson, A.M., 1978; Development of faultz as zones of deformation bands
and slip surfaces in sandstone. Pure and Applied Geophysics 116, 931-942.
Aydin, A. & Johnson, A. M., 1983. Analysis of faulting in porous sandstones, Journal of
Structural Geology 5, 1, 19-31.
Davis, G. H., 1999. Structural geology of the Colorado Plateau region of Southern Utah.
Geological Society of America, Special Papres, 342.
Davatzes, N. C., Aydin, A., 2003. Overprinting faulting mechanisms in high porosity
sandstones of SE Utah. Journal of Structural Geology, 25, 1795-1813.
Fisher , Q. J. & Knipe, R. J., 2001. The permeability of faults within siliciclastic
petroleum reservoirs of the North Sea and Norwegian Continental Shelf. Marine and
Petroleum Geology, 18, 1063-1081.
Fossen, H., Schultz, R. A., Mair, K. and Shipton, Z., 2007. Deformation bands in
sandstones- a review, Journal of Geological Society, London, 164, 755-769.
Gabrielsen, R. H. & Aarland, R. K., 1990. Characteristics of pre-syn-consolidation
structures and tectonic joints and microfaults in fine- to medium-grained sandstones.
Rock Joints. Balkema, Amsterdam, 45-50.
Gibson, R. G., 1998. Physical character and fluid-flow properties of sandstone-drived
fault zone. Geological Society London, Special Publication 127, 83-97.
Harper, T. R. & Lundin, E. R., 1997. Fault seal analysis: reducing our dependence on
empiricism. In: Möller-Pedersen, P. & Koestler, A. G. (eds) Hydrocarbon seals-
Importance for Exploration and Production. Norwegian Petroleum Society, Special
Publication 7, 149-165.
144

PhD dissertation, A. Torabi, 2007
Hesthammer, J. & Fossen, H., 2001. Structural core analysis from the Gullfaks area,
Northern North Sea. Marine and Petroleum Geology 18, 411-439.
Johansen, T. E. S. & Fossen, H. 2008: Internal deformation of fault damage zones in
interbedded siliciclastic rocks. Geological Society, London, Special Publicatio, in press.
Ogilvie, S. R., Glover, P. W. J., 2001. The petrophysical properties of deformation bands
in relation to their microstructure. Earth and Planetary Science Letters 193, 129-142.
Shipton, Z. K., Evans, J. P., Robeson, K. R., Forster, C: B., Snelgrove, S., 2002.
Structural heterogeneity and permeability in eolian sandstone: Implications for
subsurface modelling of faults. AAPG Bull. 86, 863-883.
Shipton, Z. K. & Cowie, P. A., 2003. A conceptual model for the origin of fault damage
zone structures in high porosity sandstone. Journal of structural Geology, 25, 333-345.
Sigda, J. M., Goodwin, L. B., Mozely, P. S. & Wilson, J. L., 1999. Permeability
alteration on small displacement faults in poorly lithified sediments: Rio Grande Rift,
Central New Mexico. In: Faults and Subsurface Fluid Flow in the Shallow Crust (edited
by Hanberg, W. C., Mozely, P. S., Moore, C. J., Goodwin, L. B.. Geophysical
Monograph 113. American Geophysical Union, Washington DC, 51-68.
Trent, B. C., 1989. Numerical simulation of wave propagation through cemented
granular material, in AMD-101, Wave Propagation in Granular Media, eds. D.
Karamanlidis and R. B. Stout, 9-15.
Yin, H. & Dvorkin, J., 1994. Strenght of cemented grains, Geophysical Research Letters
21, 10, 903-906.
145

146

PhD dissertation, A. Torabi, 2007
Appendix
147

148

Appendix PhD dissertation, A. Torabi, 2007
% This program includes a series of functions that estimate the %porosity and specific surface area from microscopic images of thin %sections using statistical physics.
% Note: The authors assumes no responsibility whatsoever for the use of % the program by other parties, and makes no guarantees, about its %quality, or any other characteristic.
% Terms of use of this program
% 1) Use of this program by any for-profit commercial organization is %expressly forbidden unless said organization is a Fault Facies Project %sponsor.
% 2) A Fault Facies Project sponsor may use this program under the %terms of the Fault Facies Project Sponsorship agreement.
% 3) A student or employee of a non-profit educational institution may %use this program subject to the following terms and conditions: % - this program is for research purposes only. % - including it or any portion of it, in any software that will be %resold is expressly forbidden. % - transferring the program in any form to a commercial firm or any %other for-profit organization is expressly forbidden.
% (1) The 1st step is reading thin section images into MATLAB.
I=imread('image file'); %Image matrix has M rows and N columns %(i=1,2,...M, j=1,2,...N).
figure, imagesc(I),colormap(gray(256)), grid on;
% By using 'imagesc' function to display the thin section the data is %scaled to use the full colormap.
figure,imshow(I),grid on; axis on % imshow displays the grayscale image 'I' without scaling the data.
%======================================================================% (2): The 2nd step is to choose part of the image for further work. By % using 'grid on' and 'axis on' commands in the display functions, we %can choose the matrix indices of the four corners forming the selected %area inside the image 'I'.% The following drawing shows the matrix range for the initial image 'I' %and the cropped image inside the initial image. %% j=1 j=N % i=1 |------------------------|% | | % | |-----------------| | % | | | | % | |-----------------| | % | | % i=M |------------------------|
% I=I(first row of cropped image: last row of the cropped image, first %column of cropped image: last column of the cropped image);
149

%=======================================================================% (3) The 3rd step is to estimate the threshold. There are two ways %to perform this: % (3-A) Otsu method (MATLAB built in function)
threshold=graythresh(I);
% graythresh computes a global threshold that can be used to convert %the image 'I' to a binary image. The resultant value or level is a %normalized intensity value that lies in the range [0, 1]. % GRAYTHRESH uses Otsu's method, which chooses the threshold to % %minimize the intraclass variance of the threshold black and% white pixels.
% (3-B) The second way is to create the data histogram, display it and %choose the threshold value by visual inspection of the data histogram. %The numbers of occurrences of the values between 0 and 255 ('counts') %are displayed. The length of 'counts' is the same length of colormap %in this case 256.
imhist(I)[counts,x]=imhist(I);figure, bar(x,counts),
%=====================================================================% (4) The 4th step is making binary using the estimated threshold %value.
bw=im2bw(I, threshold);
% The function is MATLAB build in function that Convert image to binary %image by thresholding. % The output binary image BW has values of 1 (white) for all % pixels in the input image with luminance greater than LEVEL and 0 %(black) for all other pixels.
figure,imagesc(bw),colormap(gray), grid on % scaled display to %colormap range figure, imshow(bw), grid on, axis on % Dispaly without scaling
%======================================================================% (5) The 5th step is to change the image to a square matrix in case if %it is not, We select parts of the image that has as less as possible% broken grains at the edge of the image. This stage is only necessary %if we calculate the two point correlation function using function %'xcorr2' (step 8).
I2=bw(1:m,1:m);
% m is the number of rows and also columns that is selected from the %image.
figure, imagesc(I2),colormap(gray), grid on % scaled display to %colormap range figure, imshow(bw), grid on, axis on % Dispaly without scaling
%======================================================================% (6) The 6th step is reversing the negative image to positive image it %means pore space from black (0) to white (1). The indicator function %or phase function or characteristic function is 1 for pores and 0 for %grains.
150

I3=ones(size(I2)); tes=find(bw); I3(tes)=0; %If we apply the 5th stage %then here bw will be replaced by I2. figure,imagesc(I3),colormap(gray),grid on % scaled display to %colormap range figure, imshow(I3), grid on, axis on % Dispaly without scaling
%======================================================================% (7) The 7th step is to calculate the one point correlation function %that is the porosity. The denominator is the product of pixel numbers % in both directions.
phi=length(find(I3))/(M*N) % MxN is the ranke of I3.
%======================================================================
% (8) The 8th step is to calculate the two-point correlation function. % We have two methods to do this.% 8-A) First the function we have written called tpcf.m. The function% is run as follows: S2=tpcf(I3);
% The function detail is given below: function s2=tpcf(I3) % This function calculate the two-point correlation function %(that is a joint probability function) using the binary image with a % certain pixel size.
s2(1,1)=length(find(I3))/(length(I3));s2(1,1);a=length(I3(:,1));
b=length(I3(1,:)); c=a/b;
for m=3; i=1:length(I3(:,1)-m; end for n=3; j=1:length(I3(1,:))-n; end for i=1:length(I3(:,1))-m; for j=1:length(I3(1,:))-n;
x=I3(i,j);save x y=I3(i+m,j+n);save y %data(1:m,1:n).test=[x,y]test=x.*y;save test test2=sum(test);test3=test2/(length(I3));save test3 %save test s2(m,n)=sum((I3(i,j)*I3(i+m,j+n))/((a-m)*(b-n))); end
151

end end
% 8-B) The second method is to use the MATLAB built in function called % xcorr2. test4=xcorr2(I3); % The only difference is that in the second method we should use two % more step as follows: % sub-step 1: Selection of the positive lag of the autocorrelation function: I4=(test4(length(I3(:,1)):end,length(I3(1,:)):end)); figure,imagesc(I4), grid on % scaled display to colormap range figure, imshow(I4), grid on, axis on % Dispaly without%scaling
% sub-step 2: Normalization of the results: I4=I4/(length(I3)); figure, imagesc(I4),grid on % scaled display to colormap range figure, imshow(I4), grid on, axis on % Dispaly without scaling
%======================================================================% (9) The 9th step is a main step to convert the calculated two-point % correlation function from the Cartesian coordinate system to a%radial system and then taking average along the certain radiuses.% The reason for this is to be able to use the spatial correlation data % derived from 2D images for 3D purposes. % We have written a function called average.m to do this that is run as% follows:
[test3]=average(I4), figure, plot(test3), grid on % test3 is a vector that represents the mean values of two point % correlation function along different radiuses.
function [test3]=average(I4) % This function is planned to map the two-point correlation function%from a Cartesian coordinate system to polar coordinate system and then %taking average along fixed radiuses.% The input to the function is just the normalized two-point %correlation function (output of the 8th staep). The output is a vector %that represents the average values of two-point correlation function %along the fixed radiuses.
X=1:length(I4(:,1));Y=1:length(I4(1,:));test3=[1:length(I4(:,1))/2];test3=test3';test3(1)=I4(1,1);%=====================================[x,y]=meshgrid([1:length(I4(:,1))],[1:length(I4(1,:))]);for k=2:300; l=1:2*k-1; v(l)=(pi*l)/(4.*(k)); XI=k*cos(v); YI=k*sin(v); s=[XI; YI]; Z1=interp2(x,y,I4,s(1,2:end-1),s(2,2:end-1)); % 2D interpolation has been used. a=sum(Z1); test3(k)=(1/(2.*k+1))*sum(I4(k+1,1)+I4(1,k+1)+a+Z1(1)+Z1(end)); end
152

%======================================================================% (10)to set the scale, and caluculate the slope.
FX(1)=test3(2)-test3(1)scale=(the scale in main picture)/(number of pixels of the scale bar)% For example scale bar is 100 micromillimeter and the length of bar in % pixels are 80 then scale=100/80=1.25
FX(1)=FX(1)./scale
% Now we have the quantity that can be used to calculate specific %surface area.
FX(1) = -(specific surface area)/4
FX(1)=-(specific surface area)/pi
153