
Photonic bands: Convergence problems with the plane-wave method
Upload
independentCategory
view
0download
0
Integration across frequency bands for consonant identificationDiane Ronan,a) Ann K. Dix,b) Phalguni Shah,c) and Louis D. Braidad)
Research Laboratory of Electronics, Massachusetts Institute of Technology, Cambridge, Massachusetts 02139
~Received 4 November 2003; revised 3 June 2004; accepted 7 June 2004!
A comparison of the predictions of models of integration to data on the reception of consonantsfiltered into a variety of frequency bands is reported. New data on the consonant identification arepresented. Three experiments were conducted testing the following bands: experiment I, 0–2100 Hzand 2100–4500 Hz; experiment II, 0–700 Hz combined with 700–1400, 1400–2100, 2100–2800,and 2800–4500 Hz; experiment III, all combinations of 700–1400, 1400–2100, 2100–2800, and2800–4500 Hz. The predictions of four models, Fletcher’s@Speech and Hearing in Communication~Van Nostrand, New York, 1950!# independent errors model, Massaro’s fuzzy logical model ofperception@Proc. Int. Congress of Phonetic Sciences, Stockholm, Vol. 3, pp. 106–113~1987!#, andBraida’s pre-labelling and post-labelling models of integration@Q. J. Exp. Psychol. A43, 647–677~1991!#, were compared in terms of their ability to predict combined-band scores. At least twomodels were capable of predicting performance for each combined-band condition. For experimentI, all models were able to make satisfactory predictions. For experiment II, a variant of thepre-labelling model was able to make satisfactory predictions. For experiment III, no model wasable to make satisfactory predictions, but the fuzzy logical model of perception and a variant of thepre-labelling model made relatively good predictions. Thus the ability of the models to predictperformance depended more on whether the condition included the lowest frequency band than onthe adjacency or frequency separation. ©2004 Acoustical Society of America.@DOI: 10.1121/1.1777858#
PACS numbers: 43.71.Es@PFA# Pages: 1749–1762
triocea
thaethb
veani
o
diecawiesise
t,
reorestheexent,The
ver.
00AI
ofto
e AIech.ela-tlearer-AIrossonetion
the
ityd si-ide
72
M
ni
redu
I. INTRODUCTION
The cues used to identify speech segments are disuted broadly over a frequency range of more than fivetaves rather than confined to a small number of narrow sptral regions. Auditory processing by contrast, exhibitsconsistent tonotopic organization at a variety of levels innervous system. One consequence of this tonotopic orgzation is that narrow band stimuli primarily influence thperception of signals in nearby spectral regions. Althoughphysiological processing of speech sounds is increasinglying studied, many details are poorly understood. Howebased on the proximity of spectral processing regions,tonotopically organized system may be expected to deal wsounds that contain spectrally adjacent cues differently frsounds that contain spectrally distinct cues.
The most relevant perceptual studies of the spectraltribution of speech cues have employed filtered spestimuli. The reception of speech processed by lowpasshighpass filtering has been studied extensively. Togetherstudies of the masking of speech by additive noise, thstudies form the basis of current standardized methodestimating the effects of linear filtering and additive nodistortion, such as the articulation index~AI, ANSI, 1969!
a!Current address: Oregon Hearing Research Center, Portland, OR 9Electronic mail: [email protected]
b!Current address: SAR Health Sciences, Boston University, Boston,02115. Electronic mail: [email protected]
c!Current address: 5913 Ricky Ridge Trail, Orefield, PA 18609. Electromail: [email protected]
d!Author to whom correspondence should be addressed. Current add36-747 M.I.T, Cambridge, MA 02139. Electronic mail: [email protected]
J. Acoust. Soc. Am. 116 (3), September 2004 0001-4966/2004/116(3)/1
b--c-
eni-
ee-r,y
thm
s-h
ndthseof
the speech transmission index~STI, Steeneken and Houtgas1980! or the speech intelligibility index~SII, ANSI, 1997!.
These formulations assume that the intelligibility scoin a combined-band case is related nonlinearly to the scin the separate bands that comprise it. Specificallycombined-band score is a monotonic function of an indformed as a simple linear sum of the indices that represnonlinearly, the scores in the separate frequency bands.additivity assumption has been called into question, howeFor example, Grant and Braida~1991! found that for combi-nations of adjacent bands~70–700 Hz combined with 700–1100 Hz, and 1800–2800 Hz combined with 2800–35Hz!, the sum of the AI values exceeded the observedvalue by 18%. Recently, Steeneken and Houtgast~1999!have argued that ‘‘redundancy’’ is responsible for the sumthe indices of adjacent bands overstating their contributionthe combined index and have proposed a correction to thcalculation procedure in the case of octave bands of spe
By contrast the reception of speech processed by rtively narrow bandpass filters has received relatively litsystematic study. Rather the effects of bandpass filteringusually inferred from the results of high- and lowpass filteing by differencing techniques. The inadequacy of theapproach to the problem of integrating speech cues acfrequency has long been recognized. When more thannarrow band of speech is presented simultaneously, recepcan improve substantially beyond the level predicted byarticulation index. For example, Kryter~1960! argued thatthe standard AI calculation underestimates the intelligibilthat results when separated narrow bands are presentemultaneously. He showed three separated 500-Hz-w
39.
A
c
ss:
1749749/14/$20.00 © 2004 Acoustical Society of America

iex-ot
s
0
rre
pityedeth
eas
nan
moothos-
irerede
ton
ce
n-o
anfia
ecrth
alt
fteAo
atiofoe
lre
n-6micse
am-theomions
chalsoasisstic;
heen-selyre-nd
rfer-
tion-aveca-oss‘‘op-insis-gle-tionter-rise
xis-nti-
ntedtedker,a-ingn oftrol-ar
rated
ex-forf-eri-on
nts
bandpass filters centered at 500, 1500, and 2500 Hz yintelligibility scores for phonetically balanced words that eceed those for single bandpass filters of equivalent tbandwidth~1500 Hz! even though the single band systemhave higher predicted AI values. Grant and Braida~1991!found that for combinations of nonadjacent bands~70–700combined with 1800–2800 Hz or 2800–3500 Hz, and 701100 Hz combined with 2800–3500 Hz! the sum of the AIvalues was less than the observed AI value by 41%. Waet al. ~1995! reported that very high intelligibility can beachieved from combinations of bands that are widely serated in center frequency. He showed that the intelligibilof sentences processed by one-third octave filters center370 and 6000 Hz was much larger, when the bands wcombined, than expected based on the intelligibilities ofindividual bands. Although Warrenet al. did not interprettheir results in terms of AI predictions, they report improvments relative to the component band conditions that‘‘superadditive,’’ such as those occasionally seen in caseaudiovisual integration. Recently, Mu¨sch and Buus~2001!have proposed a model of speech intelligibility that accoufor a much larger proportion of this difference than the stdard SII model.
Although many theories of speech perception assuthat speech cues are readily integrated across frequencynonuniform auditory spectral resolution is accounted fmuch auditory research has focused on limitations onability to integrate acoustic cues for simple sounds acrfrequency. Limet al. ~1977! reported that when the loudnesses of two sequentially presented tones are compared‘‘roving-level’’ paradigm, resolution decreases as the fquency difference between the tones increases. G~1988!, although demonstrating that listeners can employtails of spectral shape remote from a signal frequencyimprove detection performance, also documented limitation this ability. Yost and Sheft~1990! reported that the abilityto detect amplitude modulations of one tone can be reduwhen other tones with similar modulations but different frquencies are presented. Both Sheft and Yost~1992! andTakeuchi and Braida~1993! reported that listeners have cosiderable difficulty comparing the envelope modulationsnoise bands having different center frequencies. HallGrose~1990! reported that while listeners are able to benefrom the presentation of a second narrow band noise withenvelope similar to that of a masker noise band when deting a tone located in the masker, the improvement is maedly reduced when the second noise is displaced fromfirst by more than one critical band.
The integration of speech cues across frequency isrelevant to the design of signal processing schemes forhearing-impaired and the deaf. Frequency selectivity is oreduced in listeners with sensorineural impairments.though this is often most evident in measures of ‘‘spreadmasking,’’ it also implies that speech cues are not segregnormally into frequency bands, so that the cue-integratproblem for the hearing impaired may be different thanlisteners with normal hearing. Several recently developprocessing schemes treat speech separately in severaquency bands. For example, multiband amplitude comp
1750 J. Acoust. Soc. Am., Vol. 116, No. 3, September 2004
ld
al
–
n
a-
atree
-reof
ts-
encer,es
n a-en-os
ed-
fdtnt-
k-e
sohen
l-f
ednrdfre-s-
sion systems~e.g., Villchur, 1973; Lippmannet al., 1981; DeGennaroet al., 1986; Bustamante and Braida, 1987; Rosegardet al., 2004! reduce the range of level variation in 4–1bands to match the processed signal to the residual dynarange of the impaired listener. Although the failure of theschemes to provide substantial benefit relative to linearplification has been attributed to short term alterations ofoverall spectral envelope, the extent to which it results frwithin-band distortions as opposed to across-band distorthas not been studied.
In addition to studying the perception of filtered speesignals, the envelopes of filtered bands of speech havereceived attention. They have been found to provide a bfor the design of processing schemes intended for acouaids and cochlear implants~e.g., Breeuwer and Plomp, 1984Grantet al., 1993; Kasturiet al., 2002; Shannonet al., 1998,2001!. However, listeners do not always benefit from tpresentation of multiple envelopes, particularly when thevelopes are presented as amplitude modulations of clospaced sinusoidal carriers. The extent to which this repsents a failure to integrate the cues for the different baenvelopes as opposed to simpler types of perceptual inteence, such as masking, has not been determined.
Finally, recent research on audiovisual speech recep~e.g., Massaro, 1987; Braida, 1991! has led to the development of models of perceptual integration. These models hbeen formulated abstractly, so that they are potentiallypable of describing the integration of auditory cues acrspectral bands. Some of the models proposed are of thetimal processor’’ type in that the performance predictedthe combined-band condition is the highest possible content with the performances observed in the isolated sinband conditions assuming that simultaneous presentaneither creates interband cues nor results in interband inference effects, such as masking. Interband cues might afrom comparison of levels across bands. Although the etence of interband cues is often hypothesized, direct quatative evidence is lacking. Several studies have documeconditions in which interband interference is to be expec~e.g., Franklin 1969, 1975, 1979; Goshorn and Studeba1984!, and the ANSI procedure for calculating the articultion index recognizes the possibility of spread of maskfrom one band of speech to another. Dichotic presentatiothe component bands provides an obvious means for conling peripheral interference effects, although it is unclewhether speech cues presented contralaterally are integas well as those presented ipsilaterally~see Loizouet al.,2003!.
In the remainder of this paper we describe a set ofperiments intended to evaluate across-band integrationconsonant sounds~Sec. II!, and report the results in terms oidentification scores~Sec. III!. Models of across-band integration are described in Sec. IV and applied to the expmental results in Sec. V. Finally, we discuss the implicatiof these findings and suggest future research in Sec. VI.
II. EXPERIMENTS
We report the results of three identification experimeusing filtered consonant-vowel-consonant~CVC! syllables.
Ronan et al.: Integration across frequency bands

//
s.fosy
ein
dp
re12
ed
itht
edyto
utpeo
s
ce
s,ntCo
oen
edicVCne
t in
erere-nantgle-and
ofelyiousndsds
eachndd-
ofour. Ino-entom-ioti-ntedle-he
heons
ionso-a inter-on-
-49Too-was
the
ersd-
d toctice. Lis-
A. Materials
The CVC materials~Lippmann et al., 1981! were re-corded by one male and one female talker in the form./-CVC, where /./ is the unstressed schwa. The vowels wereÄ, u, ( }, )/ and the consonants were /p, t, k, b, d, g, f,Y, s,b, v, Z, z, dc, tb, h, c/. The mean durations of the syllablespoken by each of the two talkers were 634 and 574 ms
The test items were divided into two groups, onetesting and one for practice. Testing was restricted tolables made up of the 12 consonants /p, t, k, b, d, g,Y, s, b, v,Z, and z/. The practice items had excluded consonants~dc, tb,c, h, and f! in either the initial or final positions. There wer864 items in the set of full set of syllables and 486 itemsthe set of 12 test syllables. Materials were lowpass filtere9 kHz then converted to 12-bit digital samples at a samrate of 20 kHz.
The initial and final consonants for a CVC token weindependently drawn with probability 1/12 from the set ofconsonants, allowing for duplications of CVCs~one maleand one female token! and omissions. Tests were conductin groups of 48 items.
B. Listeners
The listeners in all experiments were young adults wclinically normal hearing~thresholds better than 20 dB HL aaudiometric test frequencies from 200 to 8000 Hz!. In ex-periment I there were five listeners~3 F and 2 M!, in experi-ment II there were four listeners~2 F and 2 M!, while inexperiment III there were five listeners~3 F and 2 M!. Nolisteners participated in more than one experiment.
C. Filtering
Before filtering the CVC materials were downsamplto a bandwidth of 5000 Hz. All filtering was performed blinear-phase FIR filters. Filter lengths varied from 8961216 points. Transition region widths were 50 Hz, with oof-band attenuations of 80 dB. After filtering, speech-shanoise ~at 135 dB SNR! was added to the filtered signal tobscure the speech in the stop bands. Filter bands were~A!0–700,~B! 700–1400,~C! 1400–2100,~D! 2100–2800, and~E! 2800–4500 Hz. These bands are fairly similar to thostudied by Wanget al. ~1978! except that the band from1400 to 2800 Hz was divided in two~bands C and D! toavoid ceiling effects on performance. The bands produroughly equal levels of performance~67 percentage points!when tested in isolation.
In addition we tested various combinations of thebands. In experiment I, we tested~F!, composed of bands AB, and C and also~G!, composed of D and E. In experimeII, we tested A in combination, separately, with bands B,D, and E. In experiment III, we tested all combinationsbands B, C, D, and E.
D. Conditions
Experiment I was intended to investigate the abilitylisteners to integrate cues for consonants from two, relativwide, bands of speech. Further, the two bands were prese
J. Acoust. Soc. Am., Vol. 116, No. 3, September 2004
i,
rl-
atle
-d
e
d
e
,f
flyted
either to the same ear~homolateral presentation!, or to dif-ferent ears~contralateral presentation!. This experiment waspart of a larger study of the benefits that might be obtainfrom dichotic presentation. In experiments II and III, diotpresentation was used exclusively. In experiment I the Csyllables were filtered into component bands F and G. Olistener received F in the left ear, the other four received ithe right ear. The combined bands~F1G! were then pre-sented both monaurally, in which both bands F and G wpresented to one ear, and dichotically, in which F was psented to one ear and G to the opposite ear. Each consowas presented to each listener 48 times in each of the sinband conditions and 24 times in each of the combined-bconditions.
Experiment II was intended to investigate the abilitylisteners to integrate cues for consonants from two, relativnarrow, bands of speech, a low frequency band and varhigher frequency bands. Each of the five component ba~A, B, C, D, and E! and combined bands consisting of banA1B, A1C, A1D, and A1E were presented diotically, toeach of four listeners. Each consonant was presented tolistener roughly 92 times in each of the four single-baconditions and roughly 32 times in each of the combineband conditions.
Experiment III was intended to investigate the abilitylisteners to integrate cues for consonants from two to fbands of speech that excluded the low-frequency bandexperiment III the CVC syllables were filtered into compnent bands B, C, D, and E. Each of these four componbands and combined bands consisting of all 11 possible cbinations of the component bands were then presented dcally to each of five listeners. Each consonant was preseto each listener roughly 200 times in each of the four singband conditions and roughly 72 times in each of tcombined-band conditions.
In all experiments, more data was collected in tsingle-band conditions than in the combined-band conditito facilitate the application of models to the data~Sec. IV!.Most of these models require detailed data on the confusmade by individual observers in identifying specific consnants in the single-band conditions. We collected less datthe combined-band conditions because we were only inested the overall consonant identification score for these cditions.
E. Test procedures
The processed materials were presented over TDHheadphones at an unfiltered listening level of 75 dB SPL.minimize the contributions of out-of-band speech compnents, a continuous speech-shaped background noisepresented continuously at a level 40 dB below that ofunfiltered speech.
Before testing, for each processing condition listenpracticed identifying syllables with correct-response feeback provided. Training proceeded until scores appearereach a plateau. The materials used during these prasessions were never presented during the test sessionsteners were tested without correct answer feedback.
1751Ronan et al.: Integration across frequency bands

onteaahlyc
esue
n
enetwot
ndte
th
nifi-ri-
and
resv-
e for
is-ted
hebut
for
n-
dsenage
is-ted
atitoar
d t
es
oress
F. Data analysis
The data from the experiments were analyzed by cstructing confusion matrices for each listener and each filing and presentation condition, averaged over testing runvowel. Data were analyzed separately for initial and finconsonants, by averaging over the presentations of eacthese consonant groups. These matrices were then anato determine an overall percentage of correct response sS, computed from the entries in the confusion matrix,$Ni j %.
S5100( i 51
M Nii
( i 51M ( j 51
M Ni j
. ~1!
We present the identification scores averaged over listenand the ranges of identification scores. We discuss the reof an analysis of variance on the arc-sine transformed idtification scores with listener, band~s!, and consonant type~initial/final! as factors. We consider results to be significaat the 0.05 level.
III. RESULTS
A. Experiment I
The results of experiment I~Table I! indicate that thehighest average scores~typically 88%–91% correct! wereobtained for the wideband condition~F1G, 0–4500 Hz!,followed by the low-frequency~F, 0–2100 Hz! band~75%–80% correct!, and the high-frequency~G, 2100–4500 Hz!band~65%–68% correct!. With the possible exception of thlow-frequency band, average scores for the various bawere nearly the same for initial and final consonants. Avage scores for the monaural presentation condition wereto three points higher than average scores for the dichpresentation condition.
The results of the ANOVA indicate that listeners abands-modality were statistically significant and contribusubstantially~74% for bands-modality, and 15% listeners! tothe total variance. Of the remaining factors, all except for
TABLE I. Identification scores for initial~I! and final ~F! consonants inexperiment I for various bands and combinations of bands. Presentconditions include homolateral~H, single-band sounds were presentedone ear!, contralateral~C, the high-band was presented to the opposite e!,monaural~M, both bands were presented to the homolateral ear!, and di-chotic ~D, the low-band sound was presented to the homolateral ear anhigh-band sound was presented to the contralateral ear!. Average scores~across four listeners! as well as the minimum and maximum scorachieved by the listeners are reported.
Consonant Band~s!Presentation
conditionMinimum
scoreAverage
scoreMaximum
score
I F H 76.9 80.4 85.8I G H 57.4 68.3 80.0I G C 60.6 66.9 81.4I F1G M 85.8 90.9 93.8I F1G D 83.0 87.6 93.4
F F H 67.7 75.0 81.3F G H 51.6 68.0 76.0F G C 48.8 65.1 79.7F F1G M 84.0 89.4 92.0F F1G D 82.6 87.9 93.4
1752 J. Acoust. Soc. Am., Vol. 116, No. 3, September 2004
-r-ndlof
zedore
rs,ltsn-
t
dsr-o
ic
d
e
interaction between bands and consonant types were sigcant, but none contributed more than 4% to the total vaance.
B. Experiment II
The results of experiment II~Table II! indicate that thehighest average scores were obtained for the combined-bconditions~54%–68% correct!, followed by the single-band~B,C,D,E! conditions ~41%–49% correct!, and the low-frequency~0–700 Hz! band condition~34%–47% correct!.With the exception of the low-frequency band, where scofor initial consonants were higher by roughly 13 points, aerage scores for the various bands were roughly the saminitial and final consonants.
The results of the ANOVA indicate that bands and lteners were statistically significant factors and contribusubstantially~77% for bands and 3% for listeners! to thetotal variance. Of the remaining factors, all except for tinteraction between listeners and types were significant,none contributed more than 7% to the total variance.
C. Experiment III
The results of experiment III~Table III! indicate thataverage scores generally fell into four groups. Scoressingle bands~45%–57% correct! were generally lowest,while those for pairs of bands adjacent in frequency~67%–70% correct! were somewhat higher but below those for noadjacent pairs~73%–78% correct!. The highest scores~78%–90% correct! were obtained when three or four banwere combined. There was also little difference betwescores for the initial and final consonant type: 3.3 percentpoints averaged across listeners and bands.
The results of the ANOVA indicate that bands and lteners were statistically significant factors and contribu
on
he
TABLE II. Identification scores for initial~I! and final ~F! consonants inexperiment II for various bands and combinations of bands. Average sc~across four listeners! as well as the minimum and maximum scoreachieved by the listeners are reported.
Consonant Band~s!Minimum
scoreAverage
scoreMaximum
score
I A 43.8 47.2 52.0I B 43.9 47.1 52.5I C 42.2 48.3 53.3I D 39.2 40.7 43.0I E 44.5 49.2 51.7I A1B 52.2 58.9 61.6I A1C 58.0 64.5 71.8I A1D 58.7 63.0 66.9I A1E 58.8 68.1 74.9
F A 31.2 34.3 39.7F B 40.7 42.5 43.4F C 48.0 49.2 50.3F D 41.6 44.2 46.9F E 43.4 47.1 53.7F A1B 48.6 53.9 58.2F A1C 56.2 60.4 63.1F A1D 54.6 61.7 67.7F A1E 56.3 64.8 74.9
Ronan et al.: Integration across frequency bands

heb
e
Eet
th-er
e
tte
seio
lcu-
atte-
on.
s a
re
luesere
ts
lues
hatdut
kenepply
rea-nlyIIof
isE,
sorlyfor
in-mayandfori-por-e-
veross
on
-of
ores
substantially~88% for bands and 7% for listeners! to thetotal variance. Of the remaining factors, all except for tinteraction between listeners and bands were significant,none contributed more than 1% to the total variance.
D. Consistency across experiments
Several conditions were tested in more than one expment. Specifically band G~D1E, 2100–4500 Hz! was testedin both experiments I and III while bands B, C, D, andwere tested in both experiments II and III. We analyzscores from each of these two sets of experiments usingnonparametric Wilcoxson rank-sum test. The results ofanalysis indicated that the~small! differences between experiments I and III were most likely due to chance. Howevthe differences between scores for final consonants undeD, and E were very likely not due to chance~at the 0.05 levelof significance!. This difference is most likely due to the usof different listeners in experiments II and III.
E. Articulation index
The scores observed in all three experiments are ploas a function of the estimated articulation index~AI ! in Fig.1. In each case we have superimposed a curve that reprea hypothesized relation between AI and the identificat
TABLE III. Identification scores for initial~I! and final ~F! consonants inexperiment III for various bands and combinations of bands. Average sc~across four listeners! as well as the minimum and maximum scorachieved by the listeners are reported.
Consonant Band~s!Minimum
scoreAverage
scoreMaximum
score
I B 42.4 52.1 57.5I C 46.7 52.7 56.6I D 40.0 45.3 55.3I E 48.2 52.8 59.1I B1C 65.8 70.7 75.0I C1D 64.9 68.9 74.4I D1E 61.1 66.6 76.0I B1D 72.2 77.4 85.0I B1E 72.6 77.7 86.9I C1E 70.1 74.4 80.4I B1C1D 79.7 85.3 89.4I C1D1E 76.2 80.8 84.5I B1C1E 84.7 88.3 93.2I B1D1E 82.2 87.2 93.5I B1C1D1E 86.3 90.0 93.9
F B 39.7 47.1 55.6F C 52.7 55.4 56.9F D 41.5 47.3 56.8F E 50.3 57.1 63.0F B1C 61.8 67.0 71.2F C1D 62.1 67.0 74.1F D1E 57.4 62.7 72.5F B1D 67.0 72.6 82.2F B1E 70.3 74.7 83.1F C1E 71.4 74.6 81.1F B1C1D 76.7 80.8 88.6F C1D1E 74.1 78.2 86.7F B1C1E 78.4 83.9 90.4F B1D1E 80.0 84.3 90.2F B1C1D1E 83.0 86.6 92.3
J. Acoust. Soc. Am., Vol. 116, No. 3, September 2004
ut
ri-
dheis
r,C,
d
ntsn
score. According to the assumptions that underlie the calation of the articulation index~AI !, the intelligibility scorefor a given presentation condition is related to the AI for thcondition by a function that depends on the talker, the marials, and the listener, but is independent of the conditiAlthough this function can be determined empirically~e.g.,by measuring identification performance systematically afunction of signal-to-noise ratio!, we chose to employ thefunction suggested by Fletcher and Galt~1950!,
S5A1Be2C3AI, ~2!
whereA, B, andC are fitting parameters whose values wederived from the observed scores. The sumA1B was con-strained to equal 8.3% (100/N), the number of items to beidentified so thatS5100/N when AI50. Effectively two freeparameters were used to fit the observed scores. The vaof AI plotted and used to estimate the free parameters wcomputed from the third-octave band intelligibility weighfor nonsense syllables given by Pavlovic~1987! for the vari-ous bands and combinations of bands. The best fitting vaof parametersA andC together with the rms error~E! of thefit of the curves are listed in Fig. 1. The results indicate tthe smallest values ofE were obtained for experiment III anthe largest for experiment I. For experiments I and III, bnot for experiment II, the values of parametersA andC, andalso of the rms errorE, was very similar for initial and finalconsonants. It should be noted that the values ofE that wefound were roughly comparable to those found by Steeneand Houtgast~1999! who found rms errors of 8.8 for femalspeech and 12.8 for male speech. We were unable to aSteeneken and Houtgast’s~1999! correction to the articula-tion index values because of differences in bandwidths.
Clearly, although the values of these parameters aresonably consistent, the predicted curves fit the data omoderately well. In particular, the results for experimentare puzzling. It is unclear why the performance in the caseband A1B, which had the highest predicted value of AI,relatively so poor, or why performance on bands D andwhich had the lowest predicted values of AI, is relativelygood. The results for experiment III are both more ordeand better fit by the hypothesized curve than the resultsexperiments I and II.
IV. INTEGRATION MODELS
The success of calculations based on the articulationdex, such as those discussed in Sec. III, suggests that itbe possible to use measures of performance in single-bconditions to predict scores in combined-band conditionsindividual listeners without the need for auxilliary expermentally determined parameters, such as the band imtance weights in the articulation index computation, or drived fitting constants. In this section we describe fimodels of the process by which cues are integrated acfrequency bands that can make the desired predictions.
All of the models considered make predictions basedobserved confusion matrices. LetPK(Rj uSi) denote the prob-ability that responseRj is made when the stimulusSi ispresented via bandK andPK(RuS) denote the confusion matrix for bandK. In all cases we use the relative frequency
es
1753Ronan et al.: Integration across frequency bands

s axri-
eri-ral-
ts,on-hch
FIG. 1. Plot of scores, averaged across listeners, afunction of the estimated value of the articulation inde~AI !. Symbols indicate the scores, observed in expement I ~top row!, II ~middle row!, and III ~bottom row!for initial ~left column! and final~right column! conso-nants plotted versus the AI for the band~s!. Bars indi-cate the ranges of scores across listeners. For expment I, data points corresponding to the contralateand dichotic conditions are indicated by unfilled symbols which have been displaced leftward by 0.02 unidata points corresponding to the homolateral and maural conditions are indicated by filled symbols whichave been displaced rightward by 0.02 units. Eapanel reports the values of the fitting parametersA andC, as well as the rms fitting error,E.
-
ri
e
b
annd
th,
elateuess toKL
suld
belndg-
observing responseRj when stimulusSi is presented to estimate P(Rj uSi). Given the confusion matrices for bandsKandL, the models make predictions for the confusion matwhen these bands are presented simultaneously,PKL(RuS).We estimate the predicted probability of a correct responsthe combined-band condition asCKL , where
CKL51
N (i 51
N
PKL~Ri uSi !. ~3!
A. Multiplicative error probabilities
The simplest band combination rule is one usedFletcher ~1953! in the analysis of ‘‘Articulation Tests:’’ aresponse error is made in the combined-band condition ifonly if an error is made in each of the component baconditions. Fletcher appears to have applied this methopredicting the overall probability of error:
CKL512~12CK!3~12CL!. ~4!
We denote this method Flet1. It is also possible to applyrule separately to each of theN consonants to be identified
1754 J. Acoust. Soc. Am., Vol. 116, No. 3, September 2004
x
in
y
ddto
e
PKL~Ri uSi !512~12PK~Ri uSi !!3~12PL~Ri uSi !!, ~5!
and then use Eq.~3! to predictCKL . We denote this methodFlet2.
B. Post-labelling integration
According to the Post-labelling integration mod~Braida, 1991!, the listener is assumed to make separidentification judgments about the stimulus based on the cavailable in each band, and to combine these judgmentdetermine the response to the multiband stimulus. In thecondition, for example, presentation of stimulusSi generatesa pair of labels (Lm ,Ln) corresponding respectively to bandK and L. The labels correspond to the responses that wobe given in single-band experiments. The collection of lapairs is assumed to be divided into mutually exclusive acollectively exhaustive sets. In particular, all labels beloning to the setUj elicit responseRj so that
PKL~Rj uSi !5 (m,nPUj
PKL* ~Lm ,LnuSi !, ~6!
Ronan et al.: Integration across frequency bands

ti-ddg
c
int
he
s
o
re
he
ro
chra
hthe-s
b
or-
elbeop-
tiesces
y
-
dentmon
.e.,
-
eed
ro-e
entto-cuethe
where PKL* (Lm ,LnuSi) is the probability that stimulusSi
gives rise to the label pair (Lm ,Ln) and PKL(Rj uSi) is theprobability that responseRj is given to this stimulus whenbands K and L are presented together.
To relate multiband identification to single-band idenfication, we assume that the label produced for each banindependent of the labels in the other bands. Labelling juments for each band are thus assumed to be made bysame processes that operate in single-band presentationditions:
PKL* ~Lm ,LnuSi !5PK* ~LmuSi !3PL* ~LnuSi !. ~7!
In particular, we assume that the probability of assignlabels is described by the confusion matrices observed insingle-band presentation conditions. For example, wband K is presented,
PK* ~LmuSi !5PK~RmuSi !, ~8!
and when band L is presented,
PL* ~LnuSi !5PL~RnuSi !, ~9!
wherePK(RmuSi) and PL(RnuSi) determine the frequencieobserved in the single-band confusion matrices.
There are many possible rules~or equivalently manypossible choices of theUj sets! that the listener can use tmap the label pair (Lm ,Ln) into a response. When theapriori stimulus presentation probabilities of the stimuli aequal, it is well known~e.g., van Trees, 1968! that no ruleleads to greater identification accuracy~probability of re-sponding correctly! than themaximum likelihoodrule: foreach (Lm ,Ln) the response should be the identity of tstimulus for whichPKL* (Lm ,LnuSi) is greatest.
Let Tj denote the set of (m,n) for whichPKL* (Lm ,LnuSj ).PKL* (Lm ,LnuSi) for all iÞ j . Then, com-bining the above assumptions, the conditional response pabilities for the maximum likelihood rule are specified by
PKL~Rj uSi !5 (m,nPTj
PK~RmuSi !3PL~RnuSi !. ~10!
If there is a set of (Lm ,Ln) for which
PKL* ~Lm ,LnuSi !5PKL* ~Lm ,LnuSj !.PKL* ~Lm ,LnuSk!~11!
for all kÞ i , j, then these (Lm ,Ln) may be mapped arbitrarily~on a deterministic or probabilistic basis! to eitherRi or Rj
without affecting identification accuracy. If there is no suset, the mapping that leads to greatest identification accuis unique. We denote this rule as PostLI.
C. Fuzzy logical model of perception „FLMP…
In the FLMP ~Massaro, 1987!, the response to eacstimulus is determined, in a probabalistic fashion, by‘‘feature value’’ of that stimulus for each of the possible rsponses. In single-band presentations the feature value itimated as the conditional probability,PK(Rj uSi). In multi-band conditions, the feature value is assumed to
J. Acoust. Soc. Am., Vol. 116, No. 3, September 2004
is-
theon-
ghen
b-
cy
e
es-
e
proportional to the product of the feature values for the cresponding unimodal conditions~Cohen and Massaro, 1995!.ThusPKL(Rj uSi) is
PKL~Rj uSi !5PK~Rj uSi !PL~Rj uSi !
(k51N PK~RkuSi !PL~RkuSi !
. ~12!
@The denominator term in Eq.~12! normalizes the featurevalues for theN responses to conditional probabilities.# Wedenote this rule by FLMP.
D. Pre-labelling integration
According to the pre-labelling integration mod~Braida, 1991!, single-band sensory data are assumed torepresented in continuous valued cues that are combinedtimally before labels are assigned. The statistical properof the cues are inferred from singleband confusion matriusing a type of multidimensional scaling~Braida, 1988!.Each presentation of one of theN possible consonantsSi isassumed to generate aD-dimensional vector of cuesXW
5^x1 ,x2 ,...,xD& described by the conditional probabilitdensity
p~XW uSi !5)k51
D
p~xkuSi !5)k51
D1
A2pexpS 2
~xk2sik!2
2 D .
~13!
Equivalently, the cue vectorXW may be thought of as displaced from thestimulus center SW
i5^si1 ,si2 ,...,siD& by anadditive noise vector whose components are indepenGaussian random variables with zero means and comunit variance.
Corresponding to each response there is aresponse cen-ter or prototype RW i5^r i1 ,r i2 ,...,r iD&. ~It is not necessarilytrue thatRW i5SW i .) The listener is assumed to respondRk ifand only if the distance from the observed vector of cuesXW
to RW k is smaller than the distance to any other prototype, iuXW 2RW ku,uXW 2RW j u for all j Þk. For any two vectorsYW andZW ,the distanceuYW 2ZW u is defined in terms of the vector componentsyk andzk as
uYW 2ZW u5A(k51
D
~yk2zk!2. ~14!
In effect, this rule partitions theD-dimensional space of cuvectors intoN compact ‘‘response regions’’ that are boundby hyperplanes~see Fig. 2!. All the points in each region arecloser to the prototype in that region than to any other ptotype. The probability thatRj is the response when thstimulus isSi is the probability that the vector of cuesXW iscloser toRW j than to any other prototype whenSi is presented.Since the densityp(XW uSi) weights the relative likelihood ofoccurrence of cue vectors in these conditions,P(Rj uSi) isdetermined by integrating the density with meanSW i over theresponse region containingRW j .
Thus the decision process in an identification experimreflects the listener’s comparison of cue vectors with protypes. Errors result from the assumed noisiness of thevector and the distribution of error responses reflects
1755Ronan et al.: Integration across frequency bands
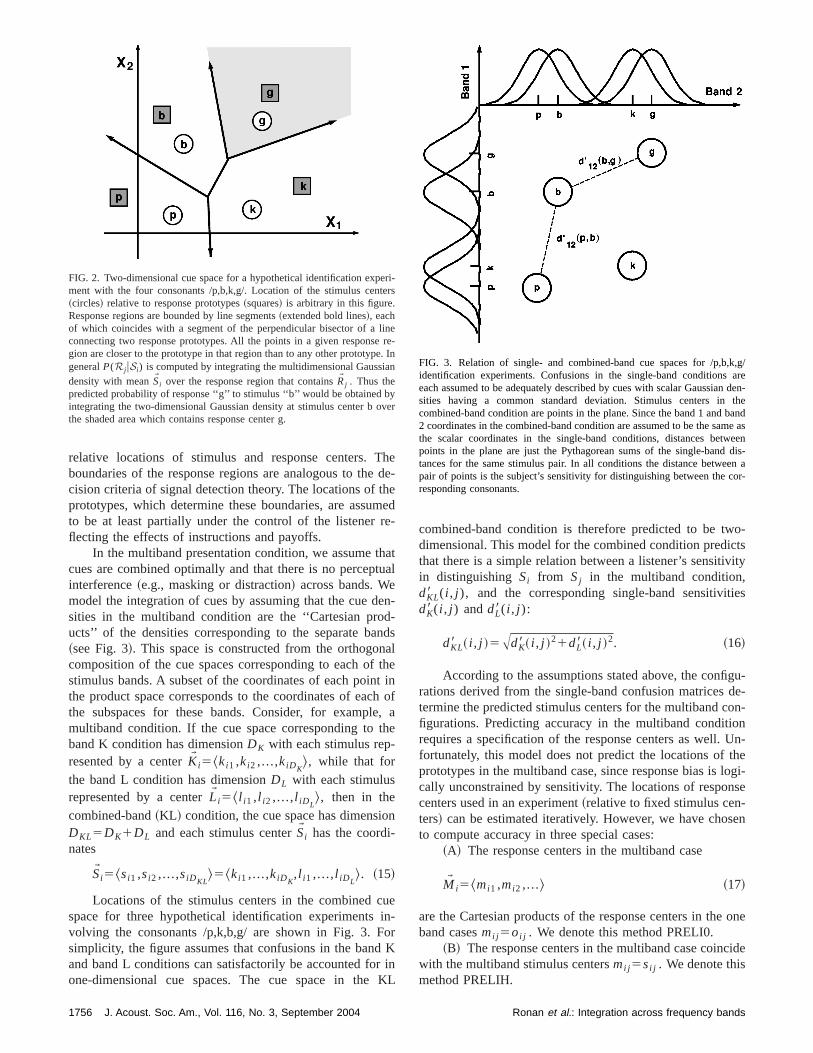
Thehmre
htu
ednatth
leth
on
uino
dr i
K
o-ctsvity
ies
gu-de-on-onUn-
thelogi-se
-sen
one
ide
erte
line re.ian
yov
,k,g/aren den-the
bandme asween
dis-en aor-
relative locations of stimulus and response centers.boundaries of the response regions are analogous to thcision criteria of signal detection theory. The locations of tprototypes, which determine these boundaries, are assuto be at least partially under the control of the listenerflecting the effects of instructions and payoffs.
In the multiband presentation condition, we assume tcues are combined optimally and that there is no percepinterference~e.g., masking or distraction! across bands. Wemodel the integration of cues by assuming that the cue dsities in the multiband condition are the ‘‘Cartesian proucts’’ of the densities corresponding to the separate ba~see Fig. 3!. This space is constructed from the orthogoncomposition of the cue spaces corresponding to each ofstimulus bands. A subset of the coordinates of each pointhe product space corresponds to the coordinates of eacthe subspaces for these bands. Consider, for exampmultiband condition. If the cue space corresponding toband K condition has dimensionDK with each stimulus rep-resented by a centerKW i5^ki1 ,ki2 ,...,kiD K
&, while that forthe band L condition has dimensionDL with each stimulusrepresented by a centerLW i5^ l i1 ,l i2 ,...,l iD L
&, then in thecombined-band~KL ! condition, the cue space has dimensiDKL5DK1DL and each stimulus centerSW i has the coordi-nates
SW i5^si1 ,si2 ,...,siD KL&5^ki1 ,...,kiD K
,l i1 ,...,l iD L&. ~15!
Locations of the stimulus centers in the combined cspace for three hypothetical identification experimentsvolving the consonants /p,k,b,g/ are shown in Fig. 3. Fsimplicity, the figure assumes that confusions in the banand band L conditions can satisfactorily be accounted foone-dimensional cue spaces. The cue space in the
FIG. 2. Two-dimensional cue space for a hypothetical identification expment with the four consonants /p,b,k,g/. Location of the stimulus cen~circles! relative to response prototypes~squares! is arbitrary in this figure.Response regions are bounded by line segments~extended bold lines!, eachof which coincides with a segment of the perpendicular bisector of aconnecting two response prototypes. All the points in a given responsgion are closer to the prototype in that region than to any other prototypgeneralP(Rj uSi) is computed by integrating the multidimensional Gaussdensity with meanSW i over the response region that containsRW j . Thus thepredicted probability of response ‘‘g’’ to stimulus ‘‘b’’ would be obtained bintegrating the two-dimensional Gaussian density at stimulus center bthe shaded area which contains response center g.
1756 J. Acoust. Soc. Am., Vol. 116, No. 3, September 2004
ede-eed-
atal
n--dslheinof
, ae
e-rKnL
combined-band condition is therefore predicted to be twdimensional. This model for the combined condition predithat there is a simple relation between a listener’s sensitiin distinguishing Si from Sj in the multiband condition,dKL8 ( i , j ), and the corresponding single-band sensitivitdK8 ( i , j ) anddL8( i , j ):
dKL8 ~ i , j !5AdK8 ~ i , j !21dL8~ i , j !2. ~16!
According to the assumptions stated above, the confirations derived from the single-band confusion matricestermine the predicted stimulus centers for the multiband cfigurations. Predicting accuracy in the multiband conditirequires a specification of the response centers as well.fortunately, this model does not predict the locations ofprototypes in the multiband case, since response bias iscally unconstrained by sensitivity. The locations of responcenters used in an experiment~relative to fixed stimulus centers! can be estimated iteratively. However, we have choto compute accuracy in three special cases:
~A! The response centers in the multiband case
MW i5^mi1 ,mi2 ,...& ~17!
are the Cartesian products of the response centers in theband casesmi j 5oi j . We denote this method PRELI0.
~B! The response centers in the multiband case coincwith the multiband stimulus centersmi j 5si j . We denote thismethod PRELIH.
i-rs
ee-In
er
FIG. 3. Relation of single- and combined-band cue spaces for /p,bidentification experiments. Confusions in the single-band conditionseach assumed to be adequately described by cues with scalar Gaussiasities having a common standard deviation. Stimulus centers incombined-band condition are points in the plane. Since the band 1 and2 coordinates in the combined-band condition are assumed to be the sathe scalar coordinates in the single-band conditions, distances betpoints in the plane are just the Pythagorean sums of the single-bandtances for the same stimulus pair. In all conditions the distance betwepair of points is the subject’s sensitivity for distinguishing between the cresponding consonants.
Ronan et al.: Integration across frequency bands

ae
tha
an
ci
eont-gru
nsuc
nn
ra
nte
th
eera
edithret
thfue
rvre
b-
y-th-
rehemth
neexel
llya
thein
om-
be-r
d toativeres.
a-eran
ers.lue
ic-hat
andd in-ndfor-andods
orre-were-
bi-th
tLIncefor-en-
hat0.05al
~C! The response centers in the multiband case are hway between the response centers in the one-band casmultiband stimulus centersmi j 5(oi j 1si j )/2. We denote thismethod PRELI1.
Case A represents the case of minimal adjustment tomultiband presentation condition: the response centerslocated at the same locations they had in the single-bconditions.
Case B, the coincident center condition, has two speproperties. First, when thea priori stimulus presentationprobabilities are equal, as they usually are in consonant idtification experiments, it leads to the maximum valueidentification accuracy among all choices of response celocations~van Trees, 1968!. This facilitates direct comparisons between the models of pre- and post-labelling intetion. Second, because this condition leads to a maximvalue of overall accuracy, small deviations in the respocenter locations from the stimulus center locations prodonly second-order changes in overall accuracy~althoughthey produce first-order changes in the conditional respoprobabilities!. Thus if listeners use response center locatiothat are close to the coincident locations, observed accushould be very close to that predicted by the method.
Case C represents an intermediate case of adjustmethe multiband presentation condition: the response cenare halfway between the response centers of case A andof case B.
Note that when the single-band response centers arcated at the positions of the single-band stimulus centthen all three cases have the same locations for the multibresponse centers.
V. MODEL PREDICTIONS
Although the different models of integration discussin Sec. IV are capable of making predictions for scorescombined-band conditions on the basis of performance incomponent bands, they base these predictions on diffeaspects of component-band performance. To comparemodels in a consistent fashion, predictions of scores incombined-band conditions were computed from the consion matrices observed in the single-band conditions. Thpredictions were computed by assuming that the obseconfusion matrices for the single-band conditions gave pcise estimates of the conditional [email protected].,PK(Rj uSi)and PL(Rj uSi)] which were then used to predict the proability of correct responses,CKL , or equivalently the scoreSKL5100CKL , in the combined-band conditions. In appling this model to the experimental data, we estimatePK(Rj uSi) and PL(Rj uSi) directly from the single-band matrices, and use these to compute predicted valuesPKL(Rj uSi) by means of Eq.~12!. Massaro and Cohen~1995! have argued that this procedure may tend to undetimate the extent to which the FLMP is capable of fitting tdata. Nevertheless, we use this approach because it issimilar to the approaches used to obtain predictions forother models considered.
Predictions were made separately for each listecombined-band condition, and initial/final consonants inperiments I, II, and III. In the case of the pre-labelling mod
J. Acoust. Soc. Am., Vol. 116, No. 3, September 2004
lf-and
ered
al
n-fer
a-mee
sescy
t tors
ose
lo-s,nd
nenthee-
seed-
e
of
s-
oste
r,-,
single-band confusions were fit withD54 dimensions usingprocedures described by Braida~1988! to estimate the loca-tions of stimulus centers.
Although filter band and listener were often statisticasignificant factors, their interaction accounted for onlysmall fraction of the total variance. Thus we evaluatedadequacy of the predictions for a given set of listenersterms of average bias and also in terms of chi-squared, cputed over listeners.
The bias was computed as the average differencetween predicted score and the observed score for listenei,
B51
NL(i 51
NL
SPi2SOi ,
where NL is the number of listeners,SOi is the observedscore~in percent of items correct! for listeneri, andSPi is thepredicted score. Thus positive values of bias corresponpredicted scores that are higher than actual scores, negvalues to predicted scores that are lower than actual sco
The value of chi-squared was computed as the sum
X25(i 51
NL Ni
100
~SPi2SOi!2
SPi,
whereNi is the total number of entries in the confusion mtrix for observeri. The chi-squared test was applied in ordto determine cases for which a given model did not makeaccurate prediction of the scores obtained by the listenValues of chi-squared which are in excess of a critical va~corresponding to the 0.05 level of significance! indicate thatpredictions were relatively poor, independent of the predtion bias. This use of the chi-squared test is similar to temployed by Braida~1991! in evaluating the ability of mod-els to account for audiovisual integration.
A. Experiment I
Predictions were made separately for the monauraldichotic presentation conditions. The results, summarizeterms of average bias and chi-squared~computed across listeners!, are shown in Tables IV and V. Overall the Flet1 aPreLI1 prediction methods overestimated observed permance when bands were combined, whereas the PostLIPreLI0 methods underestimated performance. No methmade predictions that exceeded the chi-squared value csponding to the 0.05 level of significance. Consequently,conclude that all methods made relatively satisfactory pdictions of the scores.
B. Experiment II
Predictions were made separately for each band comnation. The results are shown in Tables VI and VII. For boinitial and final consonants, the Flet1, FLMP, and Posprediction methods overpredicted observed performawhile the Flet2 and PreLI0 methods underpredicted permance when two bands were combined. The bias was gerally much less for the PreLIH method.
The PreLI0, and PreLI1 methods made predictions texceeded the chi-squared value corresponding to thelevel of significance for all band combinations for both initi
1757Ronan et al.: Integration across frequency bands
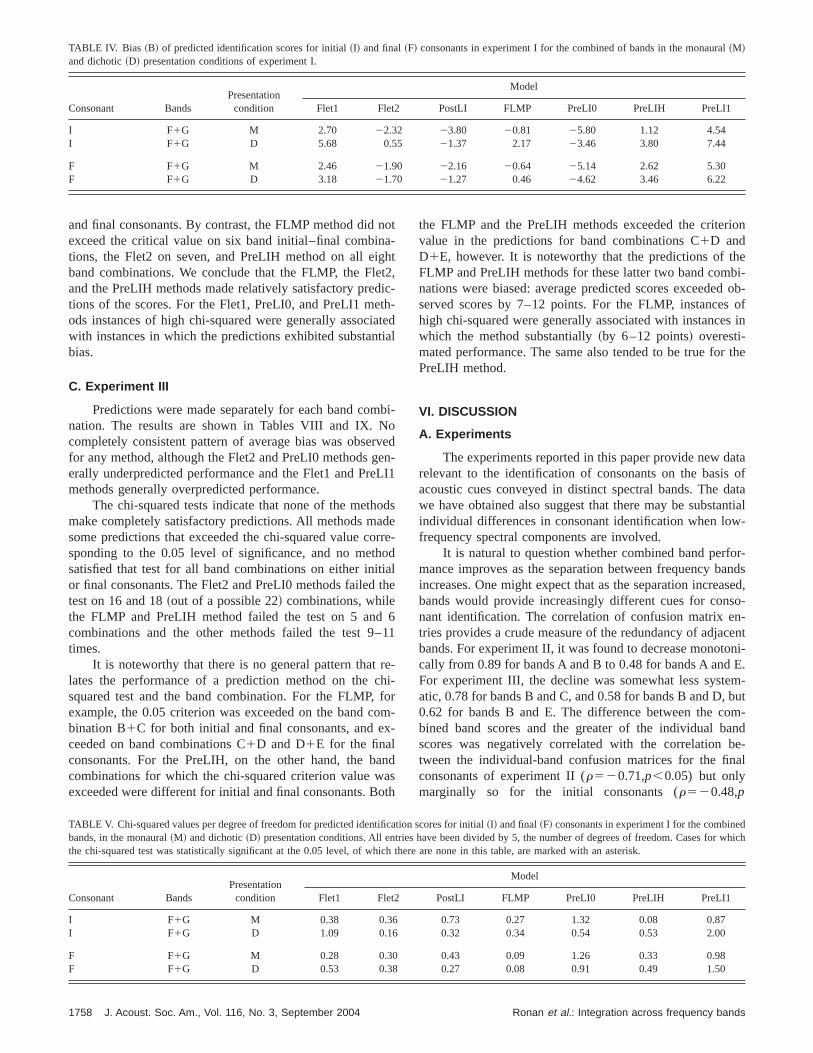
TABLE IV. Bias ~B! of predicted identification scores for initial~I! and final~F! consonants in experiment I for the combined of bands in the monaural~M!and dichotic~D! presentation conditions of experiment I.
Consonant BandsPresentation
condition
Model
Flet1 Flet2 PostLI FLMP PreLI0 PreLIH PreLI1
I F1G M 2.70 22.32 23.80 20.81 25.80 1.12 4.54I F1G D 5.68 0.55 21.37 2.17 23.46 3.80 7.44
F F1G M 2.46 21.90 22.16 20.64 25.14 2.62 5.30F F1G D 3.18 21.70 21.27 0.46 24.62 3.46 6.22
noaght2
dicth
iattia
bo
rveL
od
oro
tiath
6–1
rehfoox-
anaot
ion
hebi-d ob-
ofs in
r the
ataof
datantial
w-
or-andsased,so-n-centoni-E.m-butm-
andbe-al
and final consonants. By contrast, the FLMP method didexceed the critical value on six band initial–final combintions, the Flet2 on seven, and PreLIH method on all eiband combinations. We conclude that the FLMP, the Fleand the PreLIH methods made relatively satisfactory pretions of the scores. For the Flet1, PreLI0, and PreLI1 meods instances of high chi-squared were generally assocwith instances in which the predictions exhibited substanbias.
C. Experiment III
Predictions were made separately for each band comnation. The results are shown in Tables VIII and IX. Ncompletely consistent pattern of average bias was obsefor any method, although the Flet2 and PreLI0 methods gerally underpredicted performance and the Flet1 and Premethods generally overpredicted performance.
The chi-squared tests indicate that none of the methmake completely satisfactory predictions. All methods masome predictions that exceeded the chi-squared value csponding to the 0.05 level of significance, and no methsatisfied that test for all band combinations on either inior final consonants. The Flet2 and PreLI0 methods failedtest on 16 and 18~out of a possible 22! combinations, whilethe FLMP and PreLIH method failed the test on 5 andcombinations and the other methods failed the test 9times.
It is noteworthy that there is no general pattern thatlates the performance of a prediction method on the csquared test and the band combination. For the FLMP,example, the 0.05 criterion was exceeded on the band cbination B1C for both initial and final consonants, and eceeded on band combinations C1D and D1E for the finalconsonants. For the PreLIH, on the other hand, the bcombinations for which the chi-squared criterion value wexceeded were different for initial and final consonants. B
1758 J. Acoust. Soc. Am., Vol. 116, No. 3, September 2004
t-t,--edl
i-
edn-I1
dsere-dle
1
-i-r
m-
dsh
the FLMP and the PreLIH methods exceeded the critervalue in the predictions for band combinations C1D andD1E, however. It is noteworthy that the predictions of tFLMP and PreLIH methods for these latter two band comnations were biased: average predicted scores exceedeserved scores by 7–12 points. For the FLMP, instanceshigh chi-squared were generally associated with instancewhich the method substantially~by 6–12 points! overesti-mated performance. The same also tended to be true foPreLIH method.
VI. DISCUSSION
A. Experiments
The experiments reported in this paper provide new drelevant to the identification of consonants on the basisacoustic cues conveyed in distinct spectral bands. Thewe have obtained also suggest that there may be substaindividual differences in consonant identification when lofrequency spectral components are involved.
It is natural to question whether combined band perfmance improves as the separation between frequency bincreases. One might expect that as the separation increbands would provide increasingly different cues for connant identification. The correlation of confusion matrix etries provides a crude measure of the redundancy of adjabands. For experiment II, it was found to decrease monotcally from 0.89 for bands A and B to 0.48 for bands A andFor experiment III, the decline was somewhat less systeatic, 0.78 for bands B and C, and 0.58 for bands B and D,0.62 for bands B and E. The difference between the cobined band scores and the greater of the individual bscores was negatively correlated with the correlationtween the individual-band confusion matrices for the finconsonants of experiment II (r520.71,p,0.05) but onlymarginally so for the initial consonants (r520.48,p
dr which
TABLE V. Chi-squared values per degree of freedom for predicted identification scores for initial~I! and final~F! consonants in experiment I for the combinebands, in the monaural~M! and dichotic~D! presentation conditions. All entries have been divided by 5, the number of degrees of freedom. Cases fothe chi-squared test was statistically significant at the 0.05 level, of which there are none in this table, are marked with an asterisk.
Consonant BandsPresentation
condition
Model
Flet1 Flet2 PostLI FLMP PreLI0 PreLIH PreLI1
I F1G M 0.38 0.36 0.73 0.27 1.32 0.08 0.87I F1G D 1.09 0.16 0.32 0.34 0.54 0.53 2.00
F F1G M 0.28 0.30 0.43 0.09 1.26 0.33 0.98F F1G D 0.53 0.38 0.27 0.08 0.91 0.49 1.50
Ronan et al.: Integration across frequency bands

t
J. Acoust. Soc. Am.
TABLE VI. Bias ~B! of the predicted identification scores for initial~I! and final~F! consonants in experimenII for various combinations of bands.
Consonant Bands
Model
Flet1 Flet2 PostLI FLMP PreLI0 PreLIH PreLI1
I A1B 12.40 21.77 23.45 3.62 26.20 2.32 10.27I A1C 8.02 23.94 25.02 6.32 29.70 0.27 6.42I A1D 6.07 22.99 23.62 5.81 29.08 0.70 8.37I A1E 4.27 22.99 21.37 5.73 28.55 1.93 8.57
F A1B 9.64 21.44 25.61 4.23 29.05 0.33 7.70F A1C 6.18 21.67 29.68 2.46 211.05 0.20 8.33F A1D 2.10 25.06 29.31 0.04 212.32 20.30 6.58F A1E 2.47 22.25 24.92 1.72 210.50 20.28 6.25
x
ath
aashaudth
ifi-(-amer
tioer
pnt
anrora
re-Theatedsuredthe
t areinof
eselsing
ofualls
a-dida
tter
ssof
tingngple
.0.05) and for both the initial and final consonants of eperiment III ~r520.68, andr520.64, p,0.05). Thus theimprovement scores associated with combining bandspears to be inversely related to the correlation betweenindividual-band confusion matrices.
Based on the data in Tables II and III, it would appethat, as the separation between frequency bands increperformance in the combined band conditions improves. Tis approximately true, but the improvements in score thatassociated with increasing frequency separation are notambiguous. Overall performance in the single-band contions varies. For example, the final-consonant scores incombined-band conditions of experiment II were signcantly correlated with the individual band scoresr50.68,p,0.05) but there was no correlation for initial consonant scores. For experiment III, there was no significcorrelation for initial or final consonant scores for the cobinations of pairs of bands that involved band B, but thwas for the pairs that involved band C (r50.76,p,0.05).
Reduced performance in combined-band presentaconditions is often seen in elderly listeners and in listenwith disorders of the central auditory system. Matzger~1958!reported that elderly listeners with no diagnosed centralthology are much less capable of dichotic across-band igration than younger listeners. Palva and Jokinen~1975! alsoreport a decline in dichotic integration after age 60. Ha~1982! has pointed out that since nearly the same reductioseen when diotic presentation is used, the integration plem for elderly listeners may be evident even in monau
, Vol. 116, No. 3, September 2004
-
p-e
res,isren-i-e
nt-e
ns
a-e-
sisb-l
situations. Of course, this reduced performance may alsoflect poor reception of one or both of the separate bands.models we are developing allow these factors to be separbecause combined-band predictions are based on meaconfusions in single-band presentation conditions forsame listener.
B. Models
We have discussed seven model-based methods thapotentially applicable to the problem of predicting scorescombined-band conditions on the basis of descriptionsperformance in component-band conditions. Three of thmodels~the FLMP, and the pre- and post-labelling mode!have previously been applied to the problem of predictaudiovisual consonant-identification scores on the basisdescriptions of performance in separate audio and visidentification experiments. Although the other two mode~Flet1 and Flet2! were not applied to the audiovisual integrtion problem, it is unlikely that they would have providegood accounts of audiovisual scores. In related work Bra~1993! showed that the pre-labelling model provides a beaccount than the post-labelling model~though perhaps nobetter than Flet1! of data obtained by Miller and Nicely~1955! on the integration of consonants subject to lowpaand highpass filtering. Moreover, he showed that boththese models can be extended to the problem of predicthe effects of varying the signal-to-noise ratio by treatiincreases in signal-to-noise ratio as equivalent to multi
4, the05 level
TABLE VII. Chi-squared values per degree of freedom for predicted identification scores for initial~I! and final~F! consonants in experiment II for various combinations of bands. All entries have been divided bynumber of degrees of freedom. Cases for which the chi squared test was statistically significant at the 0.are marked with an asterisk.
Consonant Bands
Model
Flet1 Flet2 PostLI FLMP PreLI0 PreLIH PreLI1
I A1B 9.06* 1.50 1.57 1.16 3.71* 1.13 6.93*I A1C 3.71* 1.67 2.78* 2.59* 7.00* 0.57 2.71*I A1D 2.59* 1.05 1.36 2.17 7.87* 0.54 4.30*I A1E 2.65* 1.51 2.45* 3.59* 6.60* 1.23 5.21*
F A1B 6.51* 0.59 4.52* 1.81 8.58* 0.23 4.38*F A1C 2.31 0.67 8.20* 0.43 10.34* 0.18 4.05*F A1D 0.86 2.70* 7.30* 0.20 12.61* 0.16 2.94*F A1E 1.62 0.96 2.20 1.33 8.26* 0.06 2.55*
1759Ronan et al.: Integration across frequency bands

1760 J. Acoust. S
TABLE VIII. Bias ~B! of the predicted consonant identification scores for initial~I! and final~F! consonants inexperiment III for various combinations of bands.
Consonant Bands
Model
Flet1 Flet2 PostLI FLMP PreLI0 PreLIH PreLI1
I B1C 6.60 26.80 22.17 6.49 29.06 1.84 7.82I C1D 4.95 27.42 22.79 1.14 210.10 1.70 7.90I D1E 7.78 24.42 21.15 1.66 27.86 5.34 12.74I B1D 23.54 215.09 211.33 22.07 218.90 26.92 20.38I B1E 20.56 210.68 24.73 0.52 211.78 20.56 5.72I C1E 2.72 28.12 22.06 20.97 28.54 2.48 8.38I B1C1D 2.17 213.71 210.98 0.11 219.72 27.40 20.42I C1D1E 7.30 27.67 26.43 0.24 214.84 21.36 6.56I B1C1E 1.20 212.33 29.09 21.13 216.32 25.88 0.78I B1D1E 0.06 214.36 214.70 22.51 219.64 27.04 0.24I B1C1D1E 3.84 211.11 213.92 20.50 217.84 26.28 1.26
F B1C 9.32 23.26 21.77 7.06 27.52 2.68 8.74F C1D 9.56 20.75 2.95 7.36 23.66 7.64 12.30F D1E 13.93 0.73 8.99 12.08 0.88 11.62 16.62F B1D 20.03 212.02 27.05 0.82 215.48 24.72 1.54F B1E 2.83 27.28 20.75 3.35 29.28 0.04 5.94F C1E 5.48 25.71 6.39 5.34 22.34 5.70 9.30F B1C1D 7.29 27.26 26.30 5.10 216.04 22.54 3.92F C1D1E 12.02 20.99 5.82 9.81 23.58 6.22 10.50F B1C1E 6.23 26.42 22.03 5.15 210.92 20.64 4.76F B1D1E 2.75 211.74 24.42 2.17 215.64 24.38 1.58F B1C1D1E 7.96 25.45 22.20 6.12 211.78 20.36 4.78
oo
ged
MPon
entailal
independent samples of noisy cues. Both the pre- and plabelling models are capable of accounting for the effectschanging signal-to-noise ratio over more than a 20-dB ran
The models differ markedly in structure. Flet1 is basonly on overall scores in component bands, Flet2 is base
oc. Am., Vol. 116, No. 3, September 2004
st-f
e.don
scores for each vowel in component bands, while the FLand the pre-Labelling and post-labelling models are basedthe detailed patterns of confusion made in the componbands. The models correspondingly differ in level of detavailable in their predictions~overall scores versus residu
5, the05 level
TABLE IX. Chi-squared values per degree of freedom for predicted identification scores for initial~I! and final~F! consonants in experiment III for various combinations of bands. All entries have been divided bynumber of degrees of freedom. Cases for which the chi-squared test was statistically significant at the 0.are marked with an asterisk.
Consonant Bands
Model
Flet1 Flet2 PostLI FLMP PreLI0 PreLIH PreLI1
I B1C 3.00* 4.06* 0.93 2.82* 6.42* 0.50 3.64*I C1D 1.82 4.49* 0.87 0.39 7.92* 0.39 3.62*I D1E 3.84* 2.08 0.27 0.53 4.88* 1.88 8.72*I B1D 0.87 15.62* 8.70* 0.55 26.34* 3.07* 0.22I B1E 0.83 7.72* 1.98 0.59 10.01* 0.61 2.52*I C1E 0.70 4.22* 0.46 0.53 4.92* 0.71 3.60*I B1C1D 0.42 11.36* 7.52* 0.23 26.04* 3.34* 0.28I C1D1E 2.77* 3.79* 2.82* 0.39 14.03* 0.53 2.40*I B1C1E 0.42 9.03* 5.32* 0.30 16.51* 2.03 0.56I B1D1E 0.44 12.75* 14.23* 0.66 25.21* 3.19* 0.92I B1C1D1E 0.83 6.86* 12.01* 0.19 19.35* 2.24* 0.57
F B1C 5.51* 1.50 0.79 3.65* 4.72* 1.24 5.03*F C1D 5.47* 0.43 1.11 3.43* 1.64 3.71* 8.46*F D1E 10.70* 0.35 5.40* 8.37* 0.43 7.63* 14.65*F B1D 0.26 10.78* 3.77* 0.16 18.07* 1.86 0.68F B1E 0.58 3.61* 0.44 0.70 5.48* 0.18 2.12F C1E 1.74 2.22* 2.21 1.54 0.59 1.64 4.14*F B1C1D 3.28* 3.89* 3.34* 1.85 17.20* 0.62 1.16F C1D1E 7.18* 0.76 2.08 4.88* 1.16 2.11 5.43*F B1C1E 2.47* 2.92* 0.67 1.72 7.02* 0.29 1.51F B1D1E 0.84 8.97* 1.35 0.57 15.71* 1.75 0.80F B1C1D1E 3.27* 1.90 0.58 2.05 7.88* 0.17 1.33
Ronan et al.: Integration across frequency bands

hethe
neoam
kee
ov
athuamntb
mg
coaninb
eo
thththnges
ren
ttee
hisatte
tishindiorit
ing
kc-nprnson
ep-
thear-
atri-
foruretthener.atendthedic-l-d innduch
ofeedberknd-
ewechallyf am-m-ceues.
J.,
riti-ers.S.to
dersrt of
au-
I
-
-
-
confusion patterns!. However, all the models assume that tcues are statistically independent from band to band,cues are combined without interference, and that no ncues arise from interband comparisons. Within the confiof these assumptions, the models differ with respect to hthey characterize the cues available in component bandsin how they describe the process by which cues from coponent bands are combined. Since these models marange of predictions for a given combination of bands, thprovide bounds on the range of combined-band scoreswhich their common assumptions cannot be rejected.
The fact that the cues are assumed to be statisticindependent from band to band implies that, in general,combined-band score exceeds the larger of the individband scores. Even when the two single-band confusiontrices are the same, the combined-band score would geally be expected to exceed the single band score, excepspecial cases, such as when all responses in the singlematrix are correct, or when all responses have an equal~uni-form! probability. In all cases when a single band was cobined with itself, the predicted score exceeded the sinband score. In addition, the predicted combined band sfor pairs of bands exceeded the maximum of the single bscores. Braida~1993! provides examples of the differencepredictions made by the pre- and post-labelling modelstween the cases of completely redundant cues~identical con-fusion matrices! and complementary cues. In each case, pformance is predicted to be greater in the casecomplementary cues.
We evaluated the quality of the predictions made byseven methods in terms of bias and chi-squared. Two ofmethods, the FLMP and the PreLIH, seemed to providebest overall predictions. For experiment I, FLMP predictiowere less biased than those of PreLIH. The reverse waserally true for experiment II, while for experiment III biasewere roughly equal. When evaluated in terms of chi-squaboth the FLMP and the PreLIH methods made predictiothat fared about equally.
In general the FLMP and PreLIH methods made bepredictions for experiments I and II, which included th0–700 Hz band, than for experiment III, which excluded tband. It did not prove to be any more difficult to make sisfactory predictions for bands that were widely separathan for bands that were close in frequency.
Although none of the methods made completely safactory predictions, we are not overly discouraged by tresult. For every band combination and for both initial afinal consonants, at least two of the models made predictwhich were relatively unbiased and did not exceed the ccal chi-squared value.
By contrast with the results we obtained when applythe models to across-band integration tasks, Braida~1991!reported that the pre-labelling model~the equivalent ofPreLI1! made relatively good predictions of scores in tasinvolving audiovisual integration. This difference in preditive abilities is difficult to interpret because there are madifferences between the tasks considered. Audiovisualdictions were based on group data rather than on respoobtained from individual listeners. However, the integrati
J. Acoust. Soc. Am., Vol. 116, No. 3, September 2004
atws
wnd-a
yer
llyel-a-er-forand
-lered
e-
r-f
eee
sn-
d,s
r
-d
-s
nsi-
s
ye-es
tasks also differ with respect to the opportunities for perctual interference~at least at the peripheral level! and alsowith respect to the structure of perceptual confusions incomponent conditions: error patterns with the structure chacterized by visemes are rarely seen in the confusion mces for bandpass-filtered consonants.
We plan to continue to develop and evaluate modelsthe integration of cues across frequency bands. In futwork it will be important to determine whether differenmodels are required depending on whether cues from0–700 Hz band of speech are made available to the listeUnfortunately our experiments do not allow us to separthis question from possible differences in listeners aspeech materials. It is also important to understand whydifferent models had more or less success in making pretions for consonants in initial and final position in CVC sylables. More generally, the models need to be compareterms of their ability to make predictions of combined-baperformance that are more detailed than overall score, sas detailed patterns of errors.
C. Concluding remarks
Although we have investigated a substantial numberband combinations, there are obviously many more that nto be studied if the models described in Sec. IV are toinvestigated rigorously. Of particular interest in future woare band combinations consisting of multiple separated bapass conditions such as those investigated by Kryter~1960!and Warrenet al. ~1995!.
The models we have investigated may provide nmeans for identifying interband interference effects in spereception. At present such effects are identified operationby ad hoctechniques, such as noting when the addition oband reduces an intelligibility score, or when greater iprovements are obtained for dichotic than diotic band cobinations. Such criteria are likely to be too lax. Interferenmay be operative whenever the listener combines the cfrom the component bands in a less than optimal fashion
ACKNOWLEDGMENTS
This work was supported by the N. I. H.~Grant R01-DC00117!. We are grateful for thoughtful discussions withB. Allen, P. Duchnowski, A. Oxenham, W. M. Rabinowitzand C. M. Reed. We are grateful for the comments and ccisms of the Associate Editor and the anonymous reviewWe are also grateful to M. W. Connell, J. Greenberg, D.Lum, and P. Milner for assistance with the software usedprocess the stimuli and conduct the experiments. Reainterested in obtaining the data matrices obtained as pathe research described should contact the correspondingthor.
ANSI ~1969!. Methods for the Calculation of the Articulation Index, ANSS3.5-1969~American National Standards Institute, New York!.
ANSI ~1997!. Methods for the Calculation of the Speech Intelligibility Index, ANSI S3.5-1997~American National Standards Institute, New York!.
Braida, L. D.~1988!. ‘‘Development of a model for multidimensional identification experiments,’’ J. Acoust. Soc. Am.84, S142.
Braida, L. D.~1991!. ‘‘Crossmodal integration in the identification of consonant segments,’’ Q. J. Exp. Psychol. A43~3!, 647–677.
1761Ronan et al.: Integration across frequency bands

m
h
op
e
s
gin
a-re
a-on.
re
i-
,’’
c-
pe
ri
or
olm
re-
t
s
andring
m.
-
n.
m.
y
-
nfu-
S.gh
,’’ J.
Braida, L. D.~1993!. ‘‘Integration Models of Intelligibility,’’ in Proc. 1993N.A.S.-C.H.A.B.A. Symp. on Speech Communication Metrics and HuPerformance, Washington, DC, 3–4 June, 1993.
Breeuwer, M., and Plomp, R.~1984!. ‘‘Speechreading supplemented witfrequency-selective sound-pressure information,’’ J. Acoust. Soc. Am.76,686–691.
Bustamante, D. K., and Braida, L. D.~1987!. ‘‘Principal component ampli-tude compression for the hearing impaired,’’ J. Acoust. Soc. Am.82,1227–1242.
Cohen, M. M., and Massaro, D. W.~1995!. ‘‘Perceiving visual and auditoryinformation in consonant-vowel and vowel syllables,’’ inLevels in SpeechCommunication: Relations and Interactions: A Tribute to Max Wajsk,edited by C. Sorin, H. Meloni, and J. Schoentgen~Elsevier Science, Am-sterdam!.
De Gennaro, S., Braida, L. D., and Durlach, N. I.~1986!. ‘‘MultichannelSyllabic Compression for Severely Impaired Listeners,’’ J. Rehabil. RDev. 23, 17–24.
Fletcher, H. M.~1953!. Speech and Hearing in Communication~Van Nos-trand, New York!.
Fletcher, H. M., and Galt, R. H.~1950!. ‘‘The perception of speech and itrelation to telephony,’’ J. Acoust. Soc. Am.22, 89–151.
Franklin, B. ~1969!. ‘‘The effect on consonant discrimination of combinina low-frequency passband in one ear and a high-frequency passbandother ear,’’ J. Aud Res.9, 365–378.
Franklin, B. ~1975!. ‘‘A comparison of the effect on consonant discrimintion of combining low- and high-frequency passbands on consonantognition in the hearing impaired,’’ J. Speech Hear. Res.18, 719–727.
Franklin, B. ~1979!. ‘‘A comparison of the effect on consonant discrimintion of combining low- and a high-frequency passbands in normal, cgenital, and adventitious hearing-impaired subjects,’’ J. Am. Audiol Soc5,168–176.
Goshorn, E. L., and Studebaker, G. A.~1984!. ‘‘Effects of Intensity onIdentification of Filtered Nonsense Syllables,’’ ASHA-84.
Grant, K. W., and Braida, L. D.~1991!. ‘‘Evaluating the articulation indexfor auditory-visual input,’’ J. Acoust. Soc. Am.89, 2952–2960.
Grant, K. W., Braida, L. D., and Renn, R. J.~1993!. ‘‘Auditory supplementsto speechreading: Combining amplitude envelope cues from diffespectral regions of speech,’’ J. Acoust. Soc. Am.95, 1065–1073.
Green, D. M.~1988!. Profile Analysis: Auditory Intensity Discrimination~Oxford U.P., New York!.
Haas, G.~1982!. ‘‘Impaired Listeners’ Recognition of Speech Presented Dchotically through High- and Lowpass Filters,’’ Audiology21, 433–453.
Hall, J. W., and Grose, J. H.~1990!. ‘‘Effects of flanking band proximity,number, and modulation pattern on comodulation masking releaseAcoust. Soc. Am.87, 269–283.
Kasturi, K., Loizou, P. C., Dorman, M., and Spahr, T.~2002!. ‘‘The intelli-gibility of speech with holes in the spectrum,’’ J. Acoust. Soc. Am.112,1102–1111.
Kryter, K. D. ~1960!. ‘‘Bandwidth compression through spectrum seletion,’’ J. Acoust. Soc. Am.32, 547–556.
Lim, J. S., Rabinowitz, W. M., Braida, L. D., and Durlach, N. I.~1977!.‘‘Intensity perception VIII. Loudness comparisons between different tyof stimuli,’’ J. Acoust. Soc. Am.62, 1256–1267.
Lippmann, R. P., Braida, L. D., and Durlach, N. I.~1981!. ‘‘Study of mul-tichannel amplitude compression for persons with sensorineural healoss,’’ J. Acoust. Soc. Am.69, 524–534.
1762 J. Acoust. Soc. Am., Vol. 116, No. 3, September 2004
an
s.
the
c-
-
nt
J.
s
ng
Loizou, P. C., Mani, A., and Dorman, M. F.~2003!. ‘‘Dichotic speech rec-ognition in noise using reduced spectral cues,’’ J. Acoust. Soc. Am.114~1!,475–483.
Massaro, D. W.~1987!. Speech Perception by Ear and Eye: A Paradigm fPsychological Inquiry~Earlbaum, Hinsdale, NJ!.
Massaro, D. W., and Cohen, M. M.~1995!. ‘‘Modelling the Perception ofBimodal Speech,’’ Proc. Int. Congress of Phonetic Sciences, StockhSweden, Vol. 3, pp. 106–113.
Matzker, J.~1958!. Ein binauraler Horsynthese-Test zum Nachweis zebraler Horstungen~Thieme, Stutgart!.
Miller, G. A., and Nicely, P. E.~1955!. ‘‘An analysis of perceptual confu-sions among some English consonants,’’ J. Acoust. Soc. Am.27, 338–352.
Musch, H., and Buus, S.~2001!. ‘‘Using statistical decision theory to predicspeech intelligibility. I. Model structure,’’ J. Acoust. Soc. Am.109, 2896–2909.
Palva, A. K., and Jokinen, K.~1975!. ‘‘Role of the binaural test in filteredspeech audiometry,’’ Acta Oto-Laryngol.79, 310–313.
Pavlovic, C. V.~1987!. ‘‘Derivation of primary parameters and procedurefor use in speech intelligibility predictions,’’ J. Acoust. Soc. Am.82, 413–422.
Rosengard, P. S., Payton, K. L., and Braida, L. D.~2004!. ‘‘Effect of slow-acting wide dynamic range compression on measures of intelligibilityratings of speech quality in simulated-loss listeners,’’ J. Speech HeaRes.~in press!.
Shannon, R. V., Galvin, III, J. J., and Baskent, D.~2001!. ‘‘Holes in Hear-ing,’’ J. Assoc. Res. in Otolaryngology3, 185–199.
Shannon, R. V., Zeng, F. G., and Wygonski, J.~1998!. ‘‘Speech recognitionwith altered spectral distribution of envelope cues,’’ J. Acoust. Soc. A104, 2467–2476.
Sheft, S., and Yost, W. A.~1992!. ‘‘Spectral transposition of envelope modulation,’’ J. Acoust. Soc. Am.91, 2333.
Steenecken, H. J. M., and Houtgast, T.~1980!. ‘‘A physical method formeasuring speech-transmission quality,’’ J. Acoust. Soc. Am.69, 318–326.
Steenecken, H. J. M., and Houtgast, T.~1999!. ‘‘Mutual dependence of theoctave-band weight in predicting speech intelligibility,’’ Speech Commu28, 109–123.
Takeuchi, A., and Braida, L. D.~1993!. ‘‘Effect of frequency transpositionon the discrimination of amplitude envelope patterns,’’ J. Acoust. Soc. A97, 453–460.
van Trees, H. L.~1968!. Detection, Estimation, and Modulation Theor~Wiley, New York!.
Villchur, E. ~1973!. ‘‘Signal processing to improve intelligibility in perceptive deafness,’’ J. Acoust. Soc. Am.53, 1646–1657.
Wang, M., Reed, C., and Bilger, R.~1978!. ‘‘A comparison of the effects offiltering and sensorineural hearing loss on patterns of consonant cosions,’’ J. Speech Hear. Res.21, 5–36.
Warren, R. M., Reiner, K. M., Blashford, J. J. A., and Brubaker, B.~1995!. ‘‘Spectral redundancy: Intelligibility of sentences heard throunarrow spectral slits,’’ Percept. Psychophys.57, 175–182.
Yost, W. A., and Sheft, S.~1990!. ‘‘Modulation detection interference: In-terference for detecting a change in the depth of amplitude modulationAcoust. Soc. Am.88, S145.
Ronan et al.: Integration across frequency bands
Copyright © 2022 FDOKUMEN