Developmental and gender-related trends of intra-talker variability in consonant production.
15
1 Developmental and gender-related trends of intra-talker variability in consonant production Rachel Romeo a), Valerie Hazan and Michèle Pettinato Department of Speech Hearing and Phonetic Sciences, University College London, London, UK a) Current affiliation: PhD program in Speech and Hearing Bioscience and Technology. Harvard University & Massachusetts Institute of Technology. Authors’ manuscript of Romeo, R., Hazan, V., Pettinato, M. (2013). Developmental and gender-related trends of intra-talker variability in consonant production, Journal of the Acoustical Society of America, 134 (5), 3781-3792. This article may be found at (http://scitation.aip.org/content/asa/journal/jasa/134/5/10.1121/1.4824160). Abstract This study investigates the effect of age and gender on the internal structure, cross-category distance, and discriminability of phonemic categories for two contrasts varying in fricative place of articulation (/s/-/ʃ/) and stop voicing (/b/-/p/) in word-initial tokens spoken by adults and normally-developing children aged 9 to 14 years. Vast between- and within-talker variability was observed, with 16% of speakers of all ages exhibiting some degree of overlap between phonemic categories—a possible contribution to the range of talker intelligibility found in the literature. Females of all ages produced farther and thus more discriminable categories than males, though gender- marking for fricative between-category distance did not emerge until approximately 11 years of age. Children produced farther yet also much more dispersed categories than adults,with increasing discriminability with age, such that by age 13, children’s categories were no less discriminable than those of adults. However, children’s ages did not predict category distance or dispersion, indicating that convergence on adult-like category structure must occur later in adolescence. PACS number: 43.70 Ep 1. Introduction Studies of the effect of cross-talker variations in intelligibility have sought to identify acoustic-phonetic correlates of intelligibility, linking talker means for various acoustic- phonetic measures with intelligibility rates for these same talkers (Bradlow, et al., 1996; Hazan & Markham, 2004; van Dommelen & Hazan, 2012). Such investigations are often based on the assumption that intelligibility is strongly linked to the distance between phoneme categories, with measurements by means possibly neglecting patterns seen in token-by-token analysis (Hitchcock & Koenig, 2013). Moreover, listeners are also sensitive to the internal phoneme category structure of individual talkers (e.g., Allen et al., 2003; Clayards et al., 2008; Sumner, 2011; Nygaard & Pisoni, 1998; Theodore et al., 2010, 2013), and this within-category phonetic variation has been shown to affect lexical access (McMurray et al., 2002). Newman, Clouse & Burnham (2001) explored the contrast between voiceless sibilant fricatives /s/ and /ʃ/, measuring intra-talker variability by the spectral distance between these phonemic categories and degree of overlap between category distributions. After determining that talkers did differ in category distinctness, they found that listeners were slower to identify initial consonants in tokens spoken by more internally variable talkers, with category overlap affecting perception above and beyond small between-category distances. Hazan & Baker (2011) also examined measures of between- category distance and within-category dispersion in a corpus of 40 adult talkers of British English in two different contrasts: /s/-/ʃ/ and /p/-/b/. Degrees of variability for the fricative and stop contrasts were not correlated, suggesting that intra-talker phonemic variability is contrast- and/or cue-specific rather than a general talker characteristic. The goal of the present study is to characterize the extent of acoustic variability both within talkers across these same two phonemic contrasts: (/s/-/ʃ/ and /p/-/b/) and between talkers demographically across both age and gender. Stops and fricatives are the two largest feature (articulation manner) categories of English consonants (Ladefoged, 2005), and while the /s/-/ʃ/ contrast is distinguished by place of articulation, the /b/-/p/ contrast is distinguished by voicing; thus these contrasts allow comparison of two critical phonetic features primarily marked by differences in spectral (/s/-/ʃ/) and temporal (/p/- /b/) patterns. Both contrasts have been previously shown to vary both within talkers and systematically between talkers, though not necessarily following the same demographic patterns (Newman et al., 2001; Allen et al., 2003; Theodore et al., 2009). The production of the contrast between /s/ and /ʃ/ in both adults and children has been investigated in a number of recent studies. These studies differ, to a certain extent, in the measures used to characterize fricative spectra and in the analysis methods used to obtain these measures. The first four moments of the spectral energy distribution have often been used for the analysis of fricative spectra (Forrest et al., 1988): the first moment represents the center of gravity (centroid or spectral mean) of the fricative; the second moment, the amount by which the spectrum energy deviates from the centroid, thus giving a measure of standard deviation; the third reflects energy above and below the centroid and therefore gives a measure of skewness; finally the fourth moment reflects the peakedness of the spectrum and therefore gives a measure of kurtosis. These four moments, as well as additional acoustic cues such as spectral transitions (especially the second formant) into the subsequent vowel, have been found contrastive between /s/ and /ʃ/ (McMurray & Jongman, 2011), and are especially prevalent in other languages (e.g., Japanese: Li, 2012). However, in English, the first moment—the centroid—has been found to be the primary acoustic cue for differentiating between the two voiceless sibilants, with a higher centroid obtained for /s/ than /ʃ/ (Nittrouer, 1995; Jongman et al., 2000; Fox & Nissen, 2005; Li et al., 2009;
Transcript of Developmental and gender-related trends of intra-talker variability in consonant production.

1
Developmental and gender-related trends of intra-talker variability in consonantproduction
Rachel Romeo a), Valerie Hazan and Michèle Pettinato
Department of Speech Hearing and Phonetic Sciences, University College London, London, UKa) Current affiliation: PhD program in Speech and Hearing Bioscience and Technology. Harvard
University & Massachusetts Institute of Technology.
Authors’ manuscript of Romeo, R., Hazan, V., Pettinato, M. (2013). Developmental and gender-related trends of intra-talkervariability in consonant production, Journal of the Acoustical Society of America, 134 (5), 3781-3792. This article may befound at (http://scitation.aip.org/content/asa/journal/jasa/134/5/10.1121/1.4824160).
Abstract
This study investigates the effect of age and gender on theinternal structure, cross-category distance, anddiscriminability of phonemic categories for two contrastsvarying in fricative place of articulation (/s/-/ʃ/) and stop voicing (/b/-/p/) in word-initial tokens spoken by adults andnormally-developing children aged 9 to 14 years. Vastbetween- and within-talker variability was observed, with16% of speakers of all ages exhibiting some degree ofoverlap between phonemic categories—a possiblecontribution to the range of talker intelligibility found in theliterature. Females of all ages produced farther and thusmore discriminable categories than males, though gender-marking for fricative between-category distance did notemerge until approximately 11 years of age. Childrenproduced farther yet also much more dispersed categoriesthan adults,with increasing discriminability with age, suchthat by age 13, children’s categories were no lessdiscriminable than those of adults. However, children’s agesdid not predict category distance or dispersion, indicatingthat convergence on adult-like category structure mustoccur later in adolescence.
PACS number: 43.70 Ep
1. Introduction
Studies of the effect of cross-talker variations in intelligibilityhave sought to identify acoustic-phonetic correlates ofintelligibility, linking talker means for various acoustic-phonetic measures with intelligibility rates for these sametalkers (Bradlow, et al., 1996; Hazan & Markham, 2004; vanDommelen & Hazan, 2012). Such investigations are oftenbased on the assumption that intelligibility is strongly linked tothe distance between phoneme categories, with measurementsby means possibly neglecting patterns seen in token-by-tokenanalysis (Hitchcock & Koenig, 2013). Moreover, listeners arealso sensitive to the internal phoneme category structure ofindividual talkers (e.g., Allen et al., 2003; Clayards et al.,2008; Sumner, 2011; Nygaard & Pisoni, 1998; Theodore et al.,2010, 2013), and this within-category phonetic variation hasbeen shown to affect lexical access (McMurray et al., 2002).Newman, Clouse & Burnham (2001) explored the contrastbetween voiceless sibilant fricatives /s/ and /ʃ/, measuring intra-talker variability by the spectral distance between thesephonemic categories and degree of overlap between categorydistributions. After determining that talkers did differ incategory distinctness, they found that listeners were slower to
identify initial consonants in tokens spoken by more internallyvariable talkers, with category overlap affecting perceptionabove and beyond small between-category distances. Hazan &Baker (2011) also examined measures of between- categorydistance and within-category dispersion in a corpus of 40 adulttalkers of British English in two different contrasts: /s/-/ʃ/ and /p/-/b/. Degrees of variability for the fricative and stopcontrasts were not correlated, suggesting that intra-talkerphonemic variability is contrast- and/or cue-specific ratherthan a general talker characteristic.
The goal of the present study is to characterize the extent ofacoustic variability both within talkers across these same twophonemic contrasts: (/s/-/ʃ/ and /p/-/b/) and between talkers demographically across both age and gender. Stops andfricatives are the two largest feature (articulation manner)categories of English consonants (Ladefoged, 2005), and whilethe /s/-/ʃ/ contrast is distinguished by place of articulation, the /b/-/p/ contrast is distinguished by voicing; thus these contrastsallow comparison of two critical phonetic features primarilymarked by differences in spectral (/s/-/ʃ/) and temporal (/p/-/b/) patterns. Both contrasts have been previously shown tovary both within talkers and systematically between talkers,though not necessarily following the same demographicpatterns (Newman et al., 2001; Allen et al., 2003; Theodore etal., 2009).
The production of the contrast between /s/ and /ʃ/ in both adults and children has been investigated in a number of recentstudies. These studies differ, to a certain extent, in themeasures used to characterize fricative spectra and in theanalysis methods used to obtain these measures. The first fourmoments of the spectral energy distribution have often beenused for the analysis of fricative spectra (Forrest et al., 1988):the first moment represents the center of gravity (centroid orspectral mean) of the fricative; the second moment, theamount by which the spectrum energy deviates from thecentroid, thus giving a measure of standard deviation; the thirdreflects energy above and below the centroid and thereforegives a measure of skewness; finally the fourth momentreflects the peakedness of the spectrum and therefore gives ameasure of kurtosis. These four moments, as well as additionalacoustic cues such as spectral transitions (especially thesecond formant) into the subsequent vowel, have been foundcontrastive between /s/ and /ʃ/ (McMurray & Jongman, 2011), and are especially prevalent in other languages (e.g., Japanese:Li, 2012). However, in English, the first moment—thecentroid—has been found to be the primary acoustic cue fordifferentiating between the two voiceless sibilants, with ahigher centroid obtained for /s/ than /ʃ/ (Nittrouer, 1995; Jongman et al., 2000; Fox & Nissen, 2005; Li et al., 2009;

2
Haley et al., 2010), and thus will be the measure used here. Inearlier studies, estimates of spectral moments were typicallymade using discrete Fourier transforms (e.g., Nittrouer, 1995;Jongman et al., 2000; Fox & Nissen, 2005; Li et al., 2009;Maniwa et al., 2009; Li, 2012). However, it has been arguedthat spectral estimates made using DFTs exhibit large variancedue to the random nature of frication noise (Shadle, 2012;Koenig et al., 2013). A more precise spectral estimation can beobtained using multitaper spectra (Blacklock, 2004), and theadvantages of using such an analysis have been outlined byReidy (2013). Though, it should be noted that calculations offricative centroids using both methods have been found to bestrongly correlated (Reidy & Beckman, 2012).
In this study, we will be investigating the effect of gender andage on internal category structure for /s/ and /ʃ/. Though Newman et al. (2001) and Hazan and Baker (2011) notedacoustic differences between male and female voices, neitherstudy systematically analyzes gender effects for this contrast.Women are generally reported to produce higher fricativecentroids than men (Jongman, et al., 2000; Flipsen et al., 1999;Fox & Nissen, 2005). These spectral differences may be partlyrelated to anatomical differences between adult males andfemales (Fitch & Giedd, 1999; Fuchs & Toda, 2010) but arealso affected by sociophonetic factors in the realization of /s/especially, with women and girls using more frontedarticulations leading to higher spectral peaks for /s/ (Stuart-Smith, 2007; Fuchs & Toda, 2010; Holliday et al., 2010).Holliday et al. (2010) found evidence of gender-marking for/s/ in Ohio-based girls as young as three years old; thesegender differences were unlikely to be due to physiologicalfactors as they were found for American but not Japanesechildren of the same age. Age effects have also beeninvestigated for sibilant contrasts. Comparisons of fricativesproduced by adults and children have shown evidence ofcategory overlap in English-speaking children but not adults(Li et al., 2009), although some overlap was seen in thedistributions for a small number of adults in Holliday et al.(2010) using a peakERB measure (spectral peak calculated onan auditory scale). Furthermore, the age at which childrenachieve adult-like production of this contrast is unclear.McGowan and Nittrouer (1988) found that seven year oldsproduce sibilants that differ from adult models. In childrenwith normal hearing aged between 2 and 9, peak location for/ʃ/ decreased with increasing age, but not peak location for /s/ (Fox & Nissen, 2005; Todd et al., 2011). The greater effect ofage on /ʃ/ production reflects similar findings by Fox & Nissen (2005) with an older age range (6 to 14 years). Measures ofinternal category structure for fricatives produced by childrenhave also been evaluated. Greater within-category variabilityin both duration and spectral characteristics was found infricatives produced by children aged between 3 and 9(Munson, 2004). Also, using measures of peakERB andcategory compactness, Holliday et al. (2010) derived ameasure of the ‘robustness’ of the /s/-/ʃ/ contrast for adults and children aged 2 to 5, representing the accuracy rate with whicha fitted logistic regression model could predict the fricativetarget. Data showed an increase in contrast robustness withage, and greater robustness in girls, which was interpreted as aresult of gender-marking.
For the stop voicing contrast, analyses will focus on themeasure of Voice Onset Time (VOT), the duration betweenburst release and the onset of voicing periodicity. Although thestop voicing contrast is marked by a multiplicity of acousticpattern differences (Lisker, 1986), VOT is recognized as the
primary cue marking the contrast (Lisker, 1978). For thevoicing contrast, there is also evidence of listeners’ sensitivityto the internal structure of phoneme categories: work on theeffect of specific talker characteristics (e.g., VOT range used)on the perception of the stop voicing contrast suggested thatlisteners adapt both phoneme boundaries and internal categorystructure to talkers’ characteristic productions (Theodore et al.,2010, 2013). An effect of gender has been shown in theproduction of the voicing contrast, with women producinglonger VOTs for /p/ only (Whiteside & Irving, 1998) or longerVOTs for both stops (Whiteside, Henry & Dobbin, 2004),although some studies find no gender difference for VOT(Morris et al., 2008). Whiteside and Marshall (2001) suggestedthat these differences in gender effects across studies carriedout with different speaker populations may be linked tosociophonetic factors and their effect on allophonic variation.These gender differences in VOT production have been shownto emerge between the ages of 9 and 11, with longer VOTs forvoiceless stops in girls than boys (Whiteside & Marshall,2001). Women also typically display larger between-categorydistance and overall discriminability for stops (Whiteside &Irving, 1998), though gender disparities in dispersion, if theyexist, are rarely if ever reported. Thus by comparing male andfemale talkers within the different age groups on theseacoustic-phonetic dimensions, we can better understand howthese two demographics might interact throughout speechdevelopment. As regards to age effects on the production ofthe voicing contrast, children typically produce longer VOTsoverall (Ohde, 1985), converging to adult-like stop VOTs byage 11 (Whiteside & Marshall, 2001). Furthermore, youngchildren typically exhibit smaller distances betweencontrasting phonemes before overcompensating as adolescents(Nissen & Fox, 2005; Fox & Nissen, 2005), and exhibitgreater category dispersion than adults (Whiteside et al.,2003).
Many of the child studies cited above have examineddevelopment in the production of these contrasts over the firstdecade of life. This study will focus on older children, and themain research objective is to establish whether adult-likeprofiles in terms of phoneme category structure and contrastdiscriminability are achieved by age 14. In their broader studyof speech production in children, Lee et al. (1999) found thatthe greater within-speaker variation found in younger childrendiminished from around age 12 and reached adult levelsaround the age of 14 for girls and 15 for boys. Within the agerange of 9 to 14, our expectations are therefore that there willbe an effect of age for measures of dispersion, and an increasein discriminability. A second objective is to examine whetherthere is an effect of gender on within-talker variability. Theprevious literature would lead us to predict greater between-category distance and therefore discriminability for adultfemale speakers, but the age at which this gender effect willappear—if it has not already—is unclear, and is worthy ofinvestigation.
2. Method
2.1. Participants
Speech was recorded from native Standard Southern BritishEnglish (SSBE) speakers with no reported history of speech orhearing impairment. There were 40 adults (20 male, aged 18-29 years, mean 20.8; 20 female, aged 20-28, mean 23.5) and73 children aged 9-14 years (34 male, mean 12.0 years; 39

3
female, mean 12.6 years), intended to include the age range atwhich children achieve adult-like production in the contrastsof interest, based on previous literature. Additionally, thefollowing subjects were entirely excluded: two male childrendue to many unnatural speech tokens (shouting, whispering,singing, etc.), one male child for producing the tokens out ofcontext, and one male and female child each for technicalfailure.
2.2. Materials
Words were elicited via a picture-naming task rather than byrepetition of a heard token (as was used in Newman et al.,2001), to approximate a more natural, uninfluenced speakingenvironment. Eight near minimal pairs, 4 containing word-onset phonemes /p/ or /b/ and 4 with /s/ or /ʃ/ were included in the acoustic analyses. The pairs were: beach-peach, bee-pea,bill-pill, bin-pin, sea-sheep, seat-sheet, cell-shell and sack-shack. This subset of 16 nouns was analyzed for both childrenand adults. The adult speech tokens were from the LUCIDcorpus of British English (Baker & Hazan, 2010); the 16nouns selected were a subset of 36 keywords included in therecording session. Child tokens were from the child version ofthe LUCID corpus which is currently being collected; in thechild recordings, only the set of 16 keywords included in theanalysis were recorded.
2.3. Procedure
Participants sat in a sound-treated room. The pictures werepresented on screen via DMDX software (Forster & Forster,2003). Participants’ utterances were recorded from aBeyerdynamic DT297PV microphone headset directly to thedisk at a sampling rate of 22050Hz and were automaticallysaved into separate audio files by DMDX.
As each picture appeared on the computer screen, participantsnamed it aloud within the frame ‘I can see a (noun)’ toapproximate a natural linguistic context and elicit citation stylespeech, which would be closer to a clear than conversationalspeech style (Smiljanic & Bradlow, 2009). Each picture waspresented 8 times in a randomized order yielding 128 tokensper talker: 64 per contrast and 32 per phoneme category. Afterrecording, a phonetically trained listener excluded tokensjudged to be misarticulations (e.g., frontal misarticulations of/s/, depalatization of /ʃ/, etc.), as well as unrepresentative tokens due to technical malfunction and/or disruptivebackground noise; missing, incomplete, or wrong keywords;rapid corrections resulting in atypical speaking rates, or anyother solitary outlying production for a speaker. For the 40adults, the picture-naming task yielded 5120 total tokens, ofwhich 194 (3.8%) were excluded, and for the 73 children, thistask yielded 9344 total tokens, of which 266 tokens (2.8%)were excluded. This resulted in an average loss of 3.6 tokensper talker (3%) and 101 tokens per phoneme (3%).
2.4. Analysis
Word-initial consonant onsets and offsets were annotated foreach token in Praat (Boersma & Weenink, 2012). Forkeywords with initial /p/-/b/, markers were placed at the burstrelease onset (at the initial rise in amplitude) and at thebeginning of the first full periodic cycle indicating the onset ofvoicing (Ladefoged, 2003). A Praat script was then used tocalculate the Voice Onset Time (VOT) for each token.
For keywords with initial /s/-/ʃ/, markers were placed at the start of the frication portion (after the periodicity of theprevious vowel had ended and noise amplitude began to rise)and at the end of the frication portion (beginning of the firstfull periodic cycle of subsequent vowel), excluding portions ofmixed excitation. For each token, the R scripts described inReidy (2013) were used to band-pass filter the audio file (withlow and high cut off frequencies of 300 and 20000 Hz), thencompute multitaper spectra (Thomson, 1982) using 8 tapersfor the middle 50% of the fricative. Since frication energy isspectrally dynamic over time, and peaks tend to emerge morein the middle to end (Behrens & Blumstein, 1988), this medialmeasurement avoids the effects of fricative onset variation andsubsequent vowel formant transitions (Meyer & Ptok, 2011).No pre-emphasis was applied. The four spectral moments werethen obtained. Because all four moments were correlated (allPearson’s r>|0.07|, all p<.001) and frication centroids are oftenthe most distinguishing measure of /s/ and /ʃ/ (e.g., Jongman et al., 2000), only this measure was used to quantify categorymeans and dispersions (standard deviations of all tokencentroids from one speaker). To evaluate the comparability ofcentroid measures obtained using multitaper and DFT spectra,a Praat script was used to calculate the same four spectralmoments using a Hanning window, using the same bandwidthand duration settings. All four moments were highly correlated(all r>0.87, all p<0.01), with the highest correlations forcentroid measures (r>0.99, p<0.001), extending the findings ofReidy and Beckman (2012) to talkers of British English accentand to children.
To quantify talkers’ discriminability, three additional measureswere derived for each phoneme contrast for each talker.Within-category dispersion equaled the mean of the standarddeviations of the frication centroids for all /s/ and /ʃ/ tokens and of the stop VOTs for all /p/ and /b/ tokens. Between-category distance equaled the difference between the meancentroids for the fricative contrast and between the meanVOTs for the stop contrast. The magnitude of this disparitywas further calculated as the difference between the minimum/s/ and maximum /ʃ/ centroids, and between the minimum /p/ and maximum /b/ VOTs; if positive, this measures themagnitude of distance between contrasting category extremes,and if negative, the magnitude of category overlap. Finally, anoverall measure of phoneme discriminability d(a)corresponded to sensitivity from signal detection theory—since phoneme category variances were not equal, d(a) equalsthe difference between the mean values of the fricationcentroids or stop VOTs (distance), divided by the square rootof the mean of the variances (roughly dispersion). When thesevariances are equal, d(a) reduces to the common d’ (Simpson& Fitter, 1973).
3. Results
The 73 children were divided into three age subgroups (9-10years, n=24; 11-12 years, n=16; and 13-14 years, n=33). Asthese three groups only differed for two individual phonemic,contrast, or interaction measures [remaining F(2,67)<2.18,p>0.12], the subgroups were collapsed for most comparisons.Neither did splitting children into more similarly-sizedsubgroups (n=24-25) uncover significant age group effects [allF(2,67)<1.18, all p>0.19]. Additionally, children'schronological age (in months) did not correlate with any butone of these measures [remaining r<0.14, p>0.23]. Therefore,

4
separate analyses for subgroups are only presented whenmeasures significantly differ by age group, or wherechronological age is a significant predictor for a measure.
3.1. Fricatives
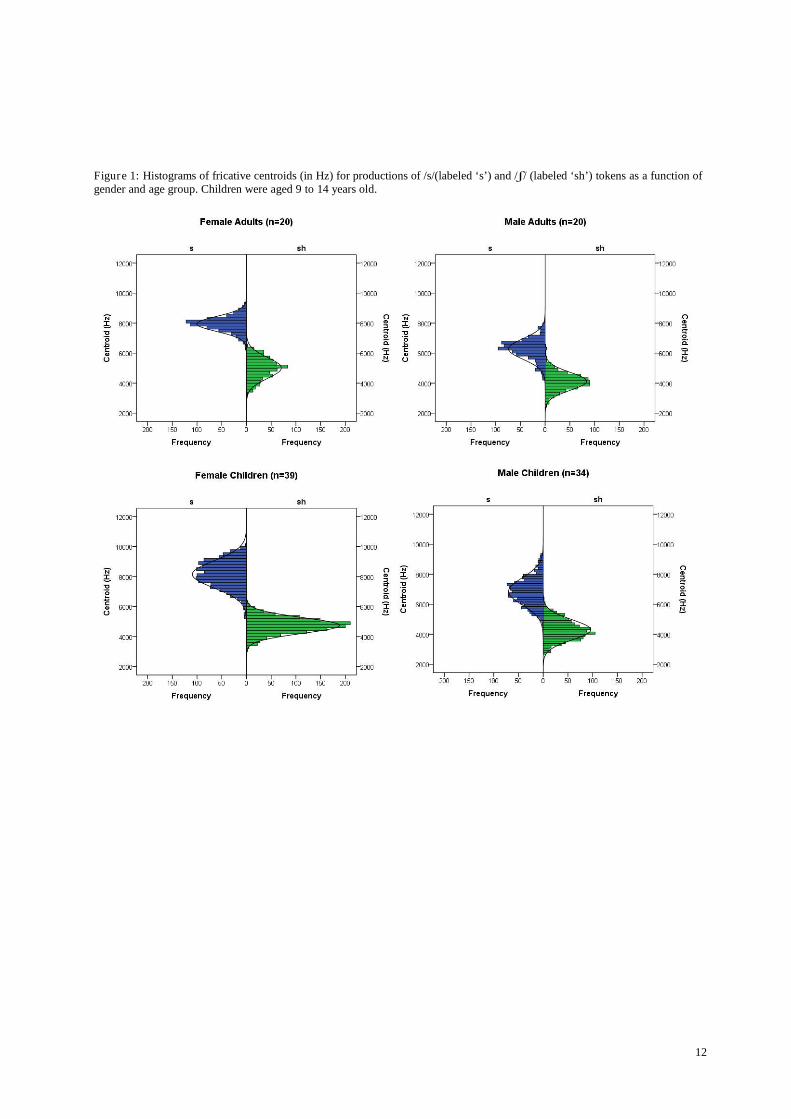
Figure 1 shows the distribution of /s/ and /ʃ/ tokens’ centroids as a function of age group (adult, child) and gender, displayingapparent differences in distributions. The singular effects ofage and gender on centroid values and on the various phonemecategory structure measures were further explored.
3.1.1. Phoneme discrimination
Mean centroid values and standard deviation as a function ofage group and gender are presented in Table 1. A mixed-design analysis of variance (ANOVA) with phoneme as a bi-level within-subjects factor, both age group and gender as bi-level between-subjects factors, and centroids (first moment) asthe dependent variable revealed a main effect of phoneme[F(1,109)=1380.42, p<0.001, effect size η2=0.927], indicating that centroid values sufficiently distinguished intended /s/ and/ʃ/ productions, with /s/ centroids having higher energy concentrations (mean: 7298 Hz) than /ʃ/ centroids (mean: 4545 Hz). A second ANOVA with standard deviations of thecentroids (square root of the second moment) as the dependentvariable revealed that talkers’ token-by-token /s/ categorieswere more dispersed than their /ʃ/ categories [F(1,109)=12.56, p<0.01, η2=0.103, mean /s/ σ=405 Hz, mean /ʃ/ σ=351 Hz]. However, within individual talkers, the dispersions betweenthe two categories are marginally correlated (r=.174, p<0.07),justifying an averaged within-talker dispersion value forsimplicity.
3.1.2. Effect of gender
The above mixed-design ANOVA for centroids also revealeda main effect of gender [F(1,109)=135.63, p<0.001,η2=0.554], indicating that females overall produced higher centroids (6462 Hz) than males (5381 Hz). Furthermore, agender*phoneme interaction [F(1,109)=30.98, p<0.001,η2=0.22] and post-hoc univariate ANOVAs (gender as independent variable, mean category centroids separately asdependent variables) indicated that females produced highercentroids for both /s/ [F(1,111)=118.27, p<0.001, female:8077 Hz, male: 6622 Hz] and for /ʃ/ [F(1,111)=39.24, p<0.001, female: 4835 Hz, male: 4232 Hz], yet the effect sizeis much larger for /s/ (1455 Hz; η2=0.516) than for /ʃ/ (603 Hz; η2=0.261). To investigate category distinction, measures of between-category distance, within- category dispersion, and overalldiscriminability were calculated for each talker as describedabove (see Figure 2). These measures were separately used asthe dependent variables of a multivariate ANOVA with genderand age group as independent variables. This yielded a maineffect of gender for between-category distance[F(1,109)=30.98, p<0.001, η2=0.221], indicating that females’ phoneme categories were farther apart than males’ categories(male: 2341 Hz, female: 3166 Hz). However, a gender*ageinteraction [F(1,105)=5.42, p<0.01, η2=0.13] reveals that this gender difference does not emerge until approximately age 11,with 9- and 10-year-olds exhibiting no male-female differencein category distance [t(22)=0.26, p>0.7].Despite no main effect of gender on dispersion [F(1,109)=0.5,p>0.4], a gender*phoneme interaction [F(1,109)=8.50, p<0.01,
η2=0.072] indicates that females have a much higher standard deviation of their /s/ centroids (422 Hz) than their /ʃ/ centroids (322 Hz), while males show little difference in dispersionbetween the two categories (/s/ = 387, /ʃ/ = 379 Hz), driving the overall /s/-/ʃ/ dispersion difference mentioned previously. When large category dispersions such as these are notseparated by similarly large between-category distances, thiscan result in intra-talker category overlap. While much of thevisible overlap in Figure 1 simply results from averagingacross talkers (the mean /s/ for one talker could coincide withthe mean /ʃ/ for another talker), overlapping categories were seen in the individual distributions of 11 talkers (10% of thesample). Interestingly, all but two overlapping talkers weremale, and all but one were children, though were scatteredrelatively evenly across the child age range, with nocorrelation between specific age and overlap (p>0.7). Theirmagnitude of overlap ranged from 29 to 1457 Hz, comprising3% to 41% of tokens. Combined with the female tendency toproduce further fricative categories, this nearly all-maleoverlap gave rise to a gender effect on the magnitude ofdistance between category extremes [F(1,109)=30.01,p<0.001, η2=0.22], with males averaging 671 Hz between /s/-/ʃ/ distribution extremes and females averaging 1569 Hz. Finally, since between-category distance but not within-category dispersion varied between genders, this created agender difference in overall category discriminability[F(1,109)=25.62, p<0.001, η2=0.19], such that males’ sibilant categories were less discriminable [mean d(a): 6.28] thanfemales’ categories [mean d(a)=8.77].
3.1.3. Effect of age
The previously described mixed-design ANOVA with centroidmeans as the dependent variable revealed only a marginallysignificant main effect of age group [F(1,109)=3.01, p<0.1].However, a group*phoneme interaction [F(1,109)=8.18,p<0.01, η2=0.07] and post-hoc univariate ANOVAs (gender as independent variable, mean category centroids separately asdependent variables) indicated that children produced higher/s/ centroids than adults [F(1,111)=4.51, p<0.05, η2=0.04; child mean: 7530 Hz, adult mean: 7111 Hz], yet the groupsexhibit no difference in /ʃ/ centroids [F(1,111)>0.09, p>0.7, child: 4535 Hz, adult: 4570 Hz], thus indicating that overallage differences are primarily due to children’s higher /s/categories.Again we refer to the above-mentioned multivariate ANOVAwith independent variables of gender and age group, anddependent variables of between-category distance, within-category dispersion, and overall discriminability calculated persubject. Children overall had not yet decreased their between-category distance to adult-like values [F(1,109)=8.18, p<0.01,η2=0.07, adult: 2541 Hz, children: 2965 Hz], with all individual child age subgroups exhibiting at least marginallyfarther categories than adults (all t>3.13, all p<0.08). Lookingcloser, a gender*age group interaction effect that disappears asthe children get older [9-10 year olds: F(60)=6.16, p<0.02, 11-12 year olds: F(52)=3.56, p<0.07, 13-14 year olds:F(69)=2.49, p>0.12] reveals that males very graduallydecrease in between-category distance between age 9 andadulthood, while females dramatically increase their between-category distances between ages 10 and 11 before graduallydecreasing. This is due exclusively to a significant rise in theseyoung females’ average /s/ centroid between the 9-10 year oldgroup and the 11-12 year olds [t(18)=3.58, p<0.01], whichyields a gender difference in /s/ centroids and between-

5
category distance that persists throughout adulthood.Surprisingly though, within each gender group, children’sprecise ages (in months) do not predict their between-categorydistance [multiple regression coefficient t(72)=-0.66, p>0.9],and the significant difference obtained between children andadults suggests that a meaningful decrease in between-category distance must occur between ages 14 and 18.In the aforementioned mixed-design ANOVA with centroidstandard deviations as dependent variable, a main effect of agegroup [F(1,109)=46.22, p<0.001, η2=0.30] indicates that children on average have more dispersed categories (435 Hz)than adults (321 Hz). Furthermore, a phoneme*age groupinteraction [F(1,109)=14.96, p<0.001, η2=0.12] and post-hoc univariate ANOVAs (age group as independent variable, meancategory standard deviations separately as dependentvariables) revealed that this age difference in dispersion ismuch larger for /s/ categories [F(111)=49.70, p<0.001,η2=0.31, child: σ = 492 Hz, adult σ = 318 Hz, difference = 174 Hz] than for /ʃ/ categories [F(111)=6.44, p<0.02, η2=0.06, child σ = 378 Hz, adult σ = 323 Hz, difference = 55 Hz]. This adult-child difference in within-category dispersion also heldfor each child age subgroup (all t>27, all p<0.001), yet, withineach gender group, children’s precise ages in months did notpredict their within-category dispersion [multiple regressioncoefficient t(72)=0.66, p>0.5], indicating that anothermeaningful shift in category structure must occur betweenages 14 and 18.From a multivariate ANOVA with independent variables ofgender and age group, and dependent variable of overalldiscriminability, it at first appears that children’s largecategory distances were not sufficient to counteract their largerdispersions, yielding slightly less discriminable categories thanadults [F(1,109)=5.55, p<0.05, η2=0.05, adult d(a): 8.10, child d(a): 6.94]. However, closer examination reveals that thissmall effect is due exclusively to the very low discriminabilityof the youngest (9-10 year old) female children, which differsfrom that of female adults [t(29)=2.65, p<0.05] and that of allother female children [t(37)=2.19, p<0.05]. These young girlshad yet to undergo the extreme increase in /s/ centroids, andwhen they are excluded from the child group, only a marginaldifference in overall discriminability between children andadults remains [F(98)=3.34, p>0.07]. Finally, within genders,children’s precise ages in months once more do not predicttheir overall discriminability [multiple regression coefficientt(72)=0.69, p>0.4]. Again, this suggests that between the agesof 14 and 18, children’s categories must grow closer togetherbut also much less dispersed, preserving their general adult-like category discriminability.
3.2. Stops
Figure 3 shows the VOT distributions for /b/ and /p/ tokenssplit across age groups and genders, displaying apparentdifferences in distributions. The singular effects of age andgender on VOT values and on the various phoneme categorystructure measures were further explored.
3.2.1. Phoneme discrimination
Mean VOT values and standard deviation as a function of agegroup and gender are presented in Table 1. A mixed-designANOVA with phoneme as a bi-level within-subjects factor,both age group and gender as bi-level between-subjectsfactors, and VOT as the dependent variable revealed a maineffect of phoneme [F(1,109)=1367.64, p<0.001, η2=0.93],
indicating, as expected, that VOT values sufficientlydistinguished intended /b/ and /p/ productions, with longerVOTs for /p/ (69ms) than /b/ (11ms). Additionally, the sameANOVA with standard deviations as the dependent variablerevealed that talkers’ token-by-token /p/ categories were moredispersed than their /b/ categories [F(1,109)=632.56, p<0.001,η2=0.85, /p/ σ=4ms, /b/ σ=17ms]. This is unsurprising given that unvoiced stops are less constrained in the length ofaspiration before voicing, while voiced stops are much morelimited in range, including a minimum VOT of 0 ms (therewas no evidence of pre-voicing in any tokens). However,within individual talkers, the two category dispersions arehighly correlated (r=.284, p<0.01), again justifying anaveraged overall within-talker dispersion value for simplicity.
3.2.2. Effect of gender
The above mixed-design ANOVA for VOTs also revealed amain effect of gender [F(1,109)=9.48, p<0.01, η2=0.08], indicating that females overall produced longer VOTs (43 ms)than males (38 ms). Furthermore, a gender*phonemeinteraction [F(1,109)=10.668, p<0.001, η2=0.09] and post-hoc univariate ANOVAs (gender as independent variable, meancategory VOTs separately as dependent variables) indicatedthat females produced longer /p/ VOTs [F(1,111)=9.72,p<0.01, η2=0.08; female=74 ms, male=64 ms], yet no differences in /b/ VOTs [F(1,111)=0.01, p>0.0.9, both genders11 ms], indicating that any gender differences are exclusivelydue to /p/ VOTs.
A multivariate ANOVA was conducted with independentfactors of gender and age group and dependent measures ofbetween-category distance, within-category dispersion, andoverall discriminability, a summary of which is displayed inFigure 4. As with fricatives, males had smaller between-category distances than females [F(1,109)=10.67, p<0.01,η2=0.09, male: 53 ms, female: 63 ms], and genders showed no difference in within-category dispersion [F(109)=0.79, p>0.3,male: 10 ms, female: 11ms]. Together, this yields the slightcategory overlap seen in Figure 3, much of which results fromaveraging across talkers. However, like for fricatives, categoryoverlap was seen in the individual distributions for 11 talkers,and again this group was largely comprised of male children(7 male children, 2 female children, and 1 each of male andfemale adults). The magnitude of overlap ranged from 2ms to32ms and comprised 3% to 47% of an individual’s tokens.Finally, since between-category distance but not within-category dispersion varied between genders, this created agender difference in overall discriminability [F(1,109)=7.28,p<0.01, η2=0.06] such that males’ labial stop categories are less discriminable (mean d(a) = 4.49) than females’ categories(mean d(a) = 5.15).
3.2.3. Effect of age
The previously described mixed-design ANOVA withdependent VOT means revealed a main effect of age group[F(1,109)=10.67, p<0.001, η2=0.09], indicating that children produced overall longer mean VOTs (42ms) than adults(38ms). Furthermore, a phoneme*group interaction[F(1,109)=18.54, p<0.001, η2=0.15] and post-hoc univariate ANOVAs (gender as independent variable, mean categoryVOTs separately as dependent variables) indicate that childrenproduced longer /p/ VOTs [F(1,111)=11.41, p<0.001,η2=0.09, child: 75ms, adult: 64ms] yet shorter /b/ VOTs [F(1,111)=14.63, p<0.001, η2=0.17, child: 10ms, adult: 13

6
ms]. Repeating this analysis with child age subgroups, 9-10year olds produced shorter /b/ VOTs (8ms) than the olderchildren (11 ms) [F(1,67) = 7.29, p<0.001, η2=0.18], suggesting some lengthening of /b/ VOTs throughoutadolescence. Because of the youngest children’s shorter /b/VOTs, it is unlikely that age effects for /p/ VOTs are simplydue to children using a slower speech rate. Examination ofindividual child tokens revealed that in instances of muchlengthened words, this longer duration was due to a significantelongation of the vowel rather than of the initial consonant.Furthermore, in /b/-/p/ VOT continua with constant vowellength, the phoneme boundary is minimally affected by speechrate (Jongman, 1986).
Again we refer to the above-mentioned multivariate ANOVAwith independent variables of gender and age group, anddependent measures of between-category distance, within-category dispersion, and overall discriminability calculated persubject. Due to their shorter /b/ and longer /p/ VOTs, childrenhad greater between-category distance than adults[F(1,109)=18.54, p<0.001, η2=0.15, adult: 51 ms, child: 65 ms], yet there was no decreasing pattern in distance acrosschildren’s precise ages in months [multiple regressioncoefficient t(1,70)=0.31, p>0.7] nor differences between agesubgroups [F(2,67)=0.34, p>0.7], suggesting that childrenmust acquire adult-like category closeness at some agebetween 14 and 18.
In the aforementioned mixed-design ANOVA with dependentVOT standard deviations, a main effect of age group[F(1,109)=35.96, p<0.001, η2=0.25] indicates that children on average have more dispersed categories (12 ms) than adults (9ms), and a phoneme*age group interaction [F(1,109)=35.62,p<0.001, η2=0.25] revealed that this is due mostly to differences in /p/ category dispersions (children = 21 ms,adults = 14 ms, difference = 7 ms), with no age difference in/b/ category dispersions (both ages 4 ms). What’s more,children did not approach an adult-like narrowness across theages (108-179 months) studied here [multiple regressioncoefficient t(1,70)=0.84, p>0.4], again pointing toward anacquisition of adult-like category narrowness between ages 14and 18.
As with fricatives, a multivariate ANOVA with independentvariables of gender and age group, and dependent variable ofoverall discriminability shows that children’s stop categorydistance was not quite sufficient to counteract this extremecategory dispersion, yielding lower overall categorydiscriminability d(a) for children [F(1,109)=14.50, p<0.01,η2=0.08, adult d(a): 5.20, child d(a): 4.45]. However, this was also the only measure to yield a marginally significantregression toward adult values (within genders) between 9years 0 months and 14 years 11 months [t(1,70)=1.74,p<0.09], such that by the age of 13-14, these children produceno less discriminable stop categories than adults[F(1,69)=1.91, p>0.1]. Thus, even though stop distance anddispersion are not adult-like by this age, the oldest childrenbalance them to attain an adult- like discriminability of thecontrast, with children younger than 13 steadily approachingadult- like discriminability. Interestingly though, there was noage*gender effect for any phoneme or contrast measures,indicating that male and female children develop stoparticulations similarly as they age into adulthood, yet with nodistinct trajectory in distance nor dispersion.
3.3. Relationship between contrasts
Standardized Z-scores of between-category distance, within-category dispersion, overall category discriminability, andpresence of overlap were calculated for each contrast andtalker; then, two-tailed Pearson’s product-moment correlationswere computed.
For the fricative contrast, distance and dispersion weremarginally correlated overall (r=0.17, p<0.08), yet were notcorrelated within any of the four talker subgroups (all |r|<0.16,all p>0.33), suggesting that any overall correlation is due todemographic trends rather than individual differences. For thestop contrast, distance and dispersion were much morestrongly correlated overall (r=0.64, p<0.001), as they were forall children and male adults (male children r=0.61, p<0.001;female children r=0.52, p<0.001; male adults r=0.78,p<0.001), but not so for female adults (r=.31, p>0.1). Since allcorrelations are positive, this indicates that as /p/ VOTincreases and thus distance between stop categories increases,so does dispersion within the /p/ category. However, thisrelationship grows stronger with age for males, yet weakenswith age for females. For adults, these are the same resultsfound by Hazan & Baker (2011), and this extends theserelationships to children. However, it is plausible that, since/p/ VOT distributions are often right-skewed, as are all upper-boundless voiceless aspirated stops (Koenig, 2001), thedistance- dispersion relationship could be an artifact of /p/means being pulled higher as the skew and dispersion grow.Yet, when between-category distance is instead measured bycategory medians, all of these relationships still hold (overallr=0.62, p<0.001; male children r=0.62, p<0.001; femalechildren r=0.46 p<0.001; male adults r=0.75, p<0.001; femaleadults r=.31, p>0.1). This indicates that for stops, between-category distance and within-category dispersion increasetogether, perhaps to balance discriminability; however, forfricatives, distance and dispersion vary independently betweendemographically similar individuals, suggesting that therelationship between these measures varies between thesecontrasts.
Finally, in order to investigate whether phoneme variability isa consistent characteristic of the talker, correlations betweenthese measures were also calculated between fricative and stopcontrasts. Over all talkers, between-category distance (r=0.30,p<0.001), within-category dispersion (r=0.47, p<0.001), andoverall discriminability (r=0.26, p<0.01) were correlatedacross contrasts, appearing as if these measures might indicatea general pattern that individuals exhibit across different typesof phonemic contrasts. However, when talkers are split intothe four gender*age subgroups, none of these measures werecorrelated within individuals (all |r|<0.28, all p>0.12), exceptd(a) for male children (r=0.45, p<0.01) and marginally fortheir dispersion (r=0.30, p<0.10), suggesting that the overallcorrelations can be attributed to demographic trends ratherthan individual differences, and more broadly, that talkersappear to exhibit contrast-specific levels of phonemicdistinction, rather than general articulatory traits. Yet, lookingmore closely, the correlations seen in male children werelargely driven by the presence of overlapping categories—ofthe people with any category overlap (18 subjects, 16%), mostonly exhibited overlap in one contrast (14 subjects, 78%), butthe few who exhibited overlap in both contrasts (4 subjects,22%) were exclusively male children. In fact, when themagnitude of overlap is standardized, both male and femalechildren exhibited nearly significant correlations between

7
contrasts in the magnitude of their category overlap or distance(male r=0.33, p<0.06; female r=0.32, p<0.6). In all, thissuggests that children, especially males, might possess ageneral trend in their level of phonemic category distinction,yet by the time they reach adulthood, they stop generallyapplying these trends, resulting in contrast-specific levels ofphoneme distinction.
4. Discussion
This study explored the emergence of adult-like phonemecategory structure and contrast discriminability in male andfemale children ages 9-14. As well as considering distancebetween categories, emphasis was placed on the developmentof within-phoneme dispersion and overall categorydiscriminability. Since within-talker variation in children hasbeen found to approach adult-like values within this age range,it was hypothesized that there should be an age effect formeasures of category dispersion and increaseddiscriminability. In line with predictions, children had greaterwithin-category dispersion than adults, specifically within /s/and /p/; this variability did not tail off in the oldest group, norwas there an effect of children’s linear ages. Notably, thespeech stimuli only contained front vowel contexts; had a fullEnglish vowel set been included, one would suspect to findeven greater dispersion. This suggests that a significant shifttowards narrower adult-like dispersions is still to take placebetween the ages of 14 and 18. This was an unexpectedfinding, given that most literature for stops finds that childrentypically reach adult- like within-category dispersion by age11 (Whiteside et al., 2003) or even by age 8 (Eguchi & Hirsh,1969). Though little work has been done on the spectraldispersion of fricatives between the ages of 9-14, children’sgreater within-category variability is consistent with that ofMunson (2004) for younger children (ages 3-8), and with Leeet al. (1999) in terms of temporal fricative measures up to age14. These discrepancies could in part be due tomeasurements—Whiteside et al. (2003) measured stopvariability by the coefficient of variance, expressing thestandard deviation as a function of the mean to control for thehigher standard deviations that naturally accompany largermeans. However, even using this measurement, the childparticipants here still have significantly more variablecategories for all 4 phonemes (all F>6.47, p<0.05). We suspectthat at ages 11-14, children might still be mastering the motorcontrol required to produce adult- like speech consistency forall types of phonemes (Murdoch et al., 2012; Walsh & Smith,2002).Whilst the 9-10 year old group had lower overalldiscriminability than adults, the oldest groups’ categories werenot only more dispersed but also much farther apart,compensating to produce discriminabilities equal to adults.Interestingly, since there were no discernable age- relatedtrends in either the shortening of distance or the narrowing ofdispersion between ages 9 and 14, this indicates that furtherdevelopment must take place after age 14, at which point eachchild learns to balance these two features independently andindividually in order to achieve adult-like discriminability bytheir teenage years. Redford & Gildersleeve-Neumann (2009)examined preschool children’s different speaking styles andobserved a lack of vowel reduction when speaking casually.They proposed that because children were not expert speakers,they were unable to use efficient and reduced movements,resulting in an inability to take the articulatory shortcutstypically associated with adult casual speech. Something
similar may be occurring here—since adolescents are lesspracticed speakers, their production is still morevariable, as evidenced by greater category dispersion. In orderto maintain phonemic distinctions, they must increase categorydistances. However, as their motor-speech control continues toincrease from ages 14 to 18 (Murdoch et al., 2012; Walsh &Smith, 2002), they are expected to gain the ability to producemore consistent articulatory targets, thus decreasing categorydispersion, which could engender a complementary decreasein category distance. Little research exists on the continueddevelopment of category structure between the ages of 14-18,and the present study highlights that this age range mayprovide further insights into the link between motor abilitiesand phonetic categories.A second aim of the study was to investigate the effect ofgender. Previous literature has shown an effect of gender oncategory distance and discriminability, though the age atwhich this becomes evident is not clear (Hazan & Baker,2011; Fox & Nissen, 2005; Whiteside & Irving, 1998). Thisstudy therefore also sought to document the use of potentialsociophonetic cues in this age group. Again in line withpredictions, males overall had smaller distances betweencategories, and since they did not differ in dispersion fromfemales, this resulted in overall lower discriminability scoresfor both adult and child males. For the fricative contrast, thissupports previous findings of females producing more fronted/s/ articulations, resulting in higher in spectral peaks (Stuart-Smith, 2007; Fuchs & Toda, 2010) and higher fricativecentroid values (Jongman, Wayland & Wong, 2000; Flipsen etal., 1999; Fox & Nissen, 2005). This is not surprising, since itis known from the sociophonetic literature that gender-marking is particularly strong for /s/ production (Fuchs &Toda, 2010; Heffernan, 2004; Stuart-Smith, 2007) andlisteners have been shown to perceive ambiguous /s/-/ʃ/ tokens differently depending on whether they were accompanied by amale or female video (Strand, 1999; 2000).Also of interest was the age at which this gender-marking forthe alveolar fricative first appeared. For the group of SSBEspeakers in this study, a marked shift appeared around age 11:whilst 9-10 year old females produced higher /s/ and /ʃ/ centroids than their male counterparts, the categories of eachwere the same distance apart. From age 11, female childrenstrikingly increased their centroid values for /s/—higher eventhan female adults’ values—thus creating a between-categorydistance larger than males’ that lasted through adulthood.Since other studies have found evidence for gender-markingfor /s/ in younger children and even toddlers (e.g Holliday etal., 2010), such distinctions may become accentuated later inadolescence; however, it is difficult to compare findingsdirectly, as methodologies and dialects vary.Stops may exhibit a less clear patterning for gender, withstudies reporting longer VOTs for /p/ only in women(Whiteside & Irving, 1998), longer VOTs for both stops(Whiteside, Henry & Dobbin, 2004), or no gender differencefor VOT (Morris, McCrea &.Herring, 2008). Here, for the stopcontrast, female children had overall greater distances, whichwere achieved through longer /p/ VOTs. Because dispersionwas the same as for male children, females produced greatercategory discriminability, though without a cleardevelopmental trend.Finally, an important finding is the presence of categoryoverlap within talkers. Though overlap would be moreexpected in casual speech, the present experimental setupelicited fairly formal speech, and still eighteen (16%) of the

8
speakers exhibited some amount of overlap in at least onecontrast—this was generally more pronounced for fricatives(at most 41% of a talker’s tokens, average 12%) than for stops(at most 21% of a talker’s tokens, average 7%), likely due tothe clear temporal boundary in citation style stop voicing(Lisker & Abramson, 1967), for which there is no sibilantcounterpart. Though the vast majority of these speakers weremale children, again showing an effect of gender, overlap wasalso present in three adults—one male for fricatives, one malefor stops, and one female for stops—therefore, motor controlcannot provide a complete explanation for less distinctivecategories.At present, there is little literature on the prevalence ofconsonant category overlap; however, it is generallyconsidered quite rare in normal populations—Newman et al.(2001) only found 1 in 20 adults with sibilant overlap, whileothers have found minimal to no overlap within individualadult talkers (Haley et al., 2010) and children ages 7-11(Mandulak, 2009); however, these studies involved Americandialects and smaller samples. Phoneme category overlap ismuch more common in individuals with abnormal speech,such as those with aphasia, apraxia, ALS, or cleft palates whohave more physical motor trouble producing distinctions,showing that overlapping categories might be a sign ofdisordered speech (Haley et al., 2010). With this thought,Haley and colleagues argue that the significant internaloverlap that Newman et al. (2001) found in one normallyspeaking talker was likely a result of measurement error.Despite the robust spectral calculations here, using bothmultitaper spectra and windowing, we find even moreindividuals with category overlap, indicating that talkers withconsiderably non-discrete categories do indeed exist in thetypical adult population—at least for SSBE speakers. Newmanet al. further found that the more internally variable talkers—especially those with overlapping categories—were lessreadily intelligible to listeners. Along with the strong gendereffect seen here, this suggests the frequent finding that womenare more intelligible than men (Bradlow et al., 1996; Hazan &Markham, 2004) may in part be due to females’ greatercategory distance. The causes of this advantage are still poorlyunderstood; by examining the interaction between dispersionand distance, the present study offers the beginning of anexplanation of the acoustics behind the phenomenon.Conflicting results between studies indicate acoustic-phoneticsources of talker intelligibility are likely to be multi-dimensional, with possible trade-off effects between cues.These are likely to be driven by environmental, contextual,and listener factors, which intertwine to determine a talker’sperspicuity (Hazan & Baker 2011). What’s more, simplydescribing categories through mean values cues is notsufficient either—developmental patterns might be overlookedwithout additional measures such as category range anddiscreteness (see Hitchcock & Koenig, 2013 for furtherdiscussion). Therefore, a holistic approach to phonemediscriminability, including both internal and external categorystructure, is necessary to fully characterize the wide range ofbetween- and within-talker variability, how this changesthrough the lifespan, and ultimately affects intelligibility.
5. Conclusions
To achieve successful communication in a variety ofenvironments, talkers need to continuously adapt acoustic-phonetic and linguistic aspects of their speech production [9].Our data suggest that developments in speech adaptation
strategies are ongoing until mid adolescence at least, althoughsome basic strategies are already established within the firstfew years of life. Together with findings that perception ofnoisy and reverberant speech is not adult-like until 14 years[22, 23], this suggests that adverse listening environments arelikely to have a deleterious effect on communication forchildren and teens throughout their school years.
6. Acknowledgements
We gratefully acknowledge the contribution of Patrick Reidywho provided us with the R scripts used for the fricativemultitaper analysis. This work was supported by the Economicand Social Research Council [grant number: RES-062-23-3106]. Data can be accessed by contacting the correspondingauthor.

9
7. References
Allen, J. S., Miller, J. L., & DeSteno, D. (2003). “Individual talkerdifferences in voice-onset- time.” J. Acoust. Soc. Am. 113, 544-552.
Baker, R. & Hazan, V. (2010). “LUCID: A corpus of spontaneous andread clear speech in British English.” Proc. DiSS-LPSS JointWorkshop, 3-6.
Behrens, S. J. & Blumstein, S. E. (1988). “Acoustic characteristics ofEnglish voiceless fricatives: a descriptive analysis.” J. Phon. 16,295-298.
Blacklock, O. S. (2004). Characteristics of variation in production ofnormal and disordered fricatives, using reduced-variance spectralmethods. Ph.D. dissertation, University of Southampton.
Boersma, P. & Weenink, D. (2012). “Praat: doing phonetics bycomputer” [Computer program]. Version 5.3.07, retrieved 5March 2012 from http://www.praat.org/.
Bradlow A. R., Torretta G. M., & Pisoni D. B. (1996). “Intelligibilityof normal speech. 1. Global and fine-grained acoustic-phonetictalker characteristics.” Speech Commun. 20, 255–272.
Clayards, M., Tanenhaus, M.K., Aslin, R.N., & Jacobs, R.A. (2008).“Perception of speech reflects optimal use of probabilistic speechcues.” Cognition 108, 804–809.
Eguchi, S. & Hirsh, I. J. (1969). “Development of speech sounds inchildren.” Acta Oto- laryngologica Supp. 257, 1-51.
Fitch, W.T. & Giedd, J. (1999). “Morphology and development of thehuman vocal tract: a study using magnetic resonance imaging.”J. Acoust. Soc. Am. 106, 1511-1522.
Flipsen, P., Shriberg, L., Weismer, G., Karlsson, H. & McSweeny, J.(1999). “Acoustic characteristics of /s/ in adolescents.” J. SpeechLang. Hear. Res. 42, 663-677.
Forrest, K.,Weismer, G., Milenkovic, P., & Dougall, R. N. (1988).“Statistical analysis of word- initial voiceless obstruents:Preliminary data.” J. Acoust. Soc. Am. 84,115–124.
Forster, K. I. & Forster, J. C. (2003). “DMDX: A windows displayprogram with millisecond accuracy.” Behav. Res. Meth. Ins. C.35, 116-124.
Fox, R. A. & Nissen, S. L. (2005). “Sex-related acoustic changes invoiceless English fricatives.” J Speech Lang. Hear. Res. 48, 753-765.
Fuchs, S. & Toda, M. (2010). “Do differences in male versus female/s/ reflect biological or sociophonetic factors?” In SusanneFuchs, Martine Toda & Marzena Zygis (eds.), Turbulent sounds.An interdisciplinary guide (pp. 281-302). Berlin: Mouton deGruyter.
Haley, K. L., Seelinger, E., Mandulak, K. C., & Zajac, D. J. (2010).“Evaluating the spectral distinction between sibilant fricativesthrough a speaker-centered approach.” J. Phon. 38, 548-554.
Hazan, V. & Baker, R. (2011). “Is Consonant Perception Linked toWithin-Category Dispersion or Across-Category Distance?”Proc. 17th Int. Cong. Phonetic Sc., 839-842.
Hazan, V. & Markham D. (2004). “Acoustic-phonetic correlates oftalker intelligibility for adults and children.” J. Acoust. Soc. Am.116, 3108–3118.
Heffernan, K. (2004). “Evidence from HNR that /s/ is a social markerof gender.” Toronto Working Papers in Linguistics, 23, 71-84.
Hitchcock, E. & Koenig, L.L., (2013). “The effects of data reductionin determining the schedule of voicing acquisition in youngchildren.” J. Speech Lang. Hear. Res. 56, 441-457.
Holliday, J. J., Beckman, M. E., & Mays, C. (2010). “Did you say susior shushi ? Measuring the emergence of robust fricative contrastsin English- and Japanese-acquiring children.” Methods, 1886-1889.
Jongman, A. (1986). “Effects of speaking rate on the perception ofsyllable-initial stop consonants.” J. Acoust. Soc. Am. 79, S9-S9.
Jongman, A., Wayland, R., & Wong, S. (2000). “Acousticcharacteristics of English fricatives.” J. Acoust. Soc. Am. 108,1252-1263.
Koenig, L. L. (2001). “Distributional characteristics of VOT inchildren’s voiceless aspirated stops and interpretation ofdevelopmental trends.” J Speech Lang. Hear. Res. 44, 1058-1068.
Koenig, L.L., Shadle, C.H., Preston, J.L., & Mooshammer, C.R.(2013). “Towards improved spectral measures of /s/: results fromadolescents.” J Speech Lang. Hear. Res. 56, 1175-1189
Ladefoged, P. (2003). Phonetic data analysis: An introduction tofieldwork and instrumental techniques (pp 138-143). BlackwellPublishing, Oxford, UK.Ladefoged, P. (2005). Vowels and consonants: An introduction to the
sounds of languages (2nd ed., pp. 50-56). Blackwell Publishing,Oxford, UK,.
Lee, S., Potamianos, A., & Narayanan, S. (1999). “Acoustics ofchildren’s speech: Developmental changes of temporal andspectral parameters.” J. Acoust. Soc. Am. 105, 1455-1468.
Li, F. (2012). “Language-Specific Developmental Differences inSpeech Production: A Cross- Language Acoustic Study.” ChildDev., 83, 1303-15.
Li, F., Edwards, J., & Beckman, M. E. (2009). “Contrast and covertcontrast: The phonetic development of voiceless sibilantfricatives in English and Japanese toddlers.” J Phon. 37, 111-124.
Lisker, L. (1978). “In qualified defense of VOT.” Lang. Speech 21,375-383
Lisker, L. (1986). “‘Voicing’ in English: a catalogue of acousticfeatures signaling /b/ versus /p/ in trochees.” Lang. Speech 29, 3-11.
Lisker, L. & Abramson, A. S. (1967). “Some effects of context onvoice onset time in English stops.” Lang. Speech 10, 1-28.
Maniwa, K., Jongman, A., & Wade, T. (2009). “Acousticcharacteristics of clearly spoken English fricatives.” J. Acoust.Soc. Am. 125, 3962–3973.
Mandulak, K. C. (2009). Production and perception of the voicelesssibilant fricatives in typically developing children withapplications for children with cleft palate. Unpublished doctoraldissertation, University of North Carolina at Chapel Hill.
McGowan, R. S. & Nittrouer, S. (1988). “Differences in fricativeproduction between children and adults: evidence from anacoustic analysis of /S/ and /s/.” J. Acoust. Soc. Am. 83, 229-236.
McMurray, B. & Jongman, A. (2011). “What information is necessaryfor speech categorization? Harnessing variability in the speechsignal by integrating cues computed relative to expectations.”Psychol. Rev. 118, 219-246.
McMurray, B., Tanenhaus, M. K., & Aslin, R. N. (2002). “Gradienteffects of within-category phonetic variation on lexical access.”Cognition 86, B33-B42.
Meyer, S. & Ptok, M. (2011). “The objective evaluation of sibilants.”Laryngorhinootologie, 90, 753-759.
Morris, R. J., McCrea, C. R., & Herring, K. D. (2008). “Voice onsettime differences between adult males and females: Isolatedsyllables.” J. Phon. 36, 308-317.
Munson, B. (2004). “Variability in /s/ production in children andadults: evidence from dynamic measures of spectral mean.” J.Speech Lang. Hear. Res. 47, 58-69.
Murdoch, B. E., Cheng, H. Y., & Goozée, J. V. (2012).“Developmental changes in the variability of tongue and lipmovements during speech from childhood to adulthood: AnEMA study.” Clinical Ling. Phon. 26, 216-31.
Newman, R. S., Clouse, S. A., & Burnham, J. L. (2001). “Theperceptual consequences of within-talker variability in fricativeproduction.” J. Acoust. Soc. Am. 109, 1181-1196.
Nissen, S. L., & Fox, R. A. (2005). “Acoustic and spectralcharacteristics of young children’s fricative productions: adevelopmental perspective.” J. Acoust. Soc. Am. 118, 2570-2578.
Nittrouer, S. (1995). “Children learn separate aspects of speechproduction at different rates: Evidence from spectral moments.”J. Acoust. Soc. Am. 97, 520-530.
Nittrouer, S., Studdert-Kennedy, M., & McGowan, R. S. (1988). “Theemergence of phonetic segments: evidence from the spectralstructure of fricative-vowel syllables spoken by children andadults.” J. Speech Hear. Res. 32, 120-132.
Nygaard, L.C. & Pisoni, D.B. (1998). “Talker-specific learning inspeech perception.” Perc.Psych. 60, 355–376.
10
Ohde, R. N. (1985). “Fundamental frequency correlates of stopconsonant voicing and vowel quality in the speech ofpreadolescent children.” J. Acoust. Soc. Am. 78, 1554-1561.
Redford, M.A. & Gildersleeve-Neumann, C.E. (2009). “Thedevelopment of distinct speaking styles in preschool children.” JSpeech Lang. Hear. Res. 52, 1434-1448.
Reidy, P. F. (2013). “An introduction to random processes for thespectral analysis of speech data.” Ohio State University WorkingPapers in Linguistics, 67-116.
Reidy, P. F. & Beckman M. E. (2012). “The effect of spectralestimator on common spectral measures for sibilant fricatives.”Proceedings of INTERSPEECH-2012, 1516-1519.
Shadle, C.H. (2012). “The Acoustics and Aerodynamics ofFricatives.” In A. Cohn, C. Fougeron, M. K. Hoffman (eds.) TheOxford Handbook of Laboratory Phonology (pp. 511-526).Oxford University Press.
Simpson, A. J., & Fitter, M. J. (1973). “What is the best index ofdetectability?” Psychol. Bull. 80, 481–488.
Smiljanic, R. & Bradlow, A. (2009). “Speaking and hearing clearly:Talker and listener factors in speaking style changes.” Lang.Linguist. Compass. 3, 236-264.
Strand, E. (1999). “Uncovering the role of gender stereotypes inspeech perception.” J. Lang. Soc. Psych. 18, 86–99.
Strand, E. (2000). Gender stereotype effects in speech processing.Unpublished dissertation. Columbus: The Ohio State University.
Stuart-Smith, J. (2007). “Empirical evidence for gendered speechproduction: /s/ in Glaswegian.” In: Cole, J. and Hualde, J.I.(eds.) Laboratory Phonology 9. Series: Phonology and phonetics(pp. 65-86). Mouton de Gruyter, New York, USA.
Sumner, M. (2011). “The role of variation in the perception ofaccented speech.” Cognition 119, 131–136.
Theodore, R. M., Miller, J. L., & DeSteno, D. (2009). “Individualtalker differences in voice- onset-time: Contextual influences.” J.Acoust. Soc. Am. 125, 3974-3982.
Theodore, R. M., Miller, J. L., & DeSteno, D. (2010). “Characteristicsof listener sensitivity to talker-specific phonetic detail.” J.Acoust. Soc. Am. 128, 2090-2099.
Theodore, R. M., Myers, E. B., & Lomibao, J. (2013). “Listeners’sensitivity to talker differences in voice-onset-time: Phoneticboundaries and internal category structure.” POMA 19,060248.
Thomson, D. J. (1982). “Spectrum estimation and harmonic analysis.”Proc. of the IEEE, 70, 1055–1096.
Todd, A.E., Edwards, J.R., & Litovsky, R.Y. (2011) “Production ofcontrast between sibilant fricatives by children with cochlearimplants.” J. Acoust. Soc. Am. 130, 3969-3979.
van Dommelen, W. & Hazan, V. (2012). “Impact of talker variabilityon word recognition in non-native listeners.” J. Acoust. Soc. Am.132, 1690-1699.
Walsh B. & Smith A. (2002). “Articulatory movements in adolescents:Evidence for protracted development of speech motor controlprocesses.” J Speech Lang. Hear. Res. 45, 1119–1133
Whiteside, S. P. & Irving, C. (1998). “Speakers’ sex differences invoice onset time: A study of isolated word production.” Percept.Motor Skill. 86, 651–654.
Whiteside, S. P. & Marshall, J. (2001). “Developmental trends invoice onset time: some evidence for sex differences.” Phonetica58, 196-210.
Whiteside, S. P., Dobbin, R., & Henry, L. (2003). “Patterns ofvariability in voice onset time: a developmental study of motorspeech skills in humans.” Neurosci. Lett. 347, 29-32.
Whiteside, S. P., Henry, L., & Dobbin, R. (2004). “Sex differences invoice onset time: a developmental study of phonetic contexteffects in British English.” J. Acoust. Soc. Am. 116, 1179-1183

11
Table 1: Mean fricative centroids and stop VOTs for child and adult age groups. Standard deviations are in parentheses.
Fricative Centroid (Hz) Stop VOT (ms)
/s/ /ʃ/ /b/ /p/
Children
9-10 yrs(n=24)
Male (n=13) 7339 (724) 4446 (596) 8.3 (2.2) 66.9 (17.1)
Female (n=11) 7675 (732) 4869 (281) 8.0 (1.1) 76.6 (11.1)
11-12 yrs
(n=16)
Male (n=7) 6657 (767) 4217 (551) 10.5 (2.0) 69.3 (26.2)
Female (n=9) 8619 (312) 4757 (309) 10.6 (1.8) 76.5 (17.4)
13-14 yrs(n=33)
Male (n=14) 6430 (599) 4196 (485) 12.0 (4.7) 74.7 (20.9)
Female (n=19) 8192 (769) 4663 (457) 10.6 (3.6) 80.6 (15.3)
All(n=73)
Male (n=34) 6818 (788) 4299 (537) 10.3 (3.8) 70.6 (20.4)
Female (n=39) 8135 (751) 4745 (381) 9.9 (2.9) 78.5 (14.6)
Adults (n=40)Male (n=20) 6277 (632) 4124 (482) 12.1 (2.4) 57.2 (13.7)
Female (n=20) 7946 (367) 5016 (649) 12.9 (4.0) 70.0 (13.9)
12
Figure 1: Histograms of fricative centroids (in Hz) for productions of /s/(labeled ‘s’) and /ʃ/ (labeled ‘sh’) tokens as a function ofgender and age group. Children were aged 9 to 14 years old.

13
Figure 2: Distance between /s/-/ʃ/ categories, average dispersion within both categories, and /s/- /ʃ/ category discriminability d(a)as a function of gender and age subgroups.

14
Figure 3: Histograms of VOT durations for productions of /b/(labeled ‘b’) and /p/ (labeled ‘p’) tokens as a factor of gender andage group. Children were aged 9 to 14 years old.

15
Figure 4: Distance between /b/-/p/ categories, average dispersion within both categories, and /b/-/p/ category discriminability d(a)as a function of gender and age subgroups.