Simplified Measurement of Intra-Access Pressure
6
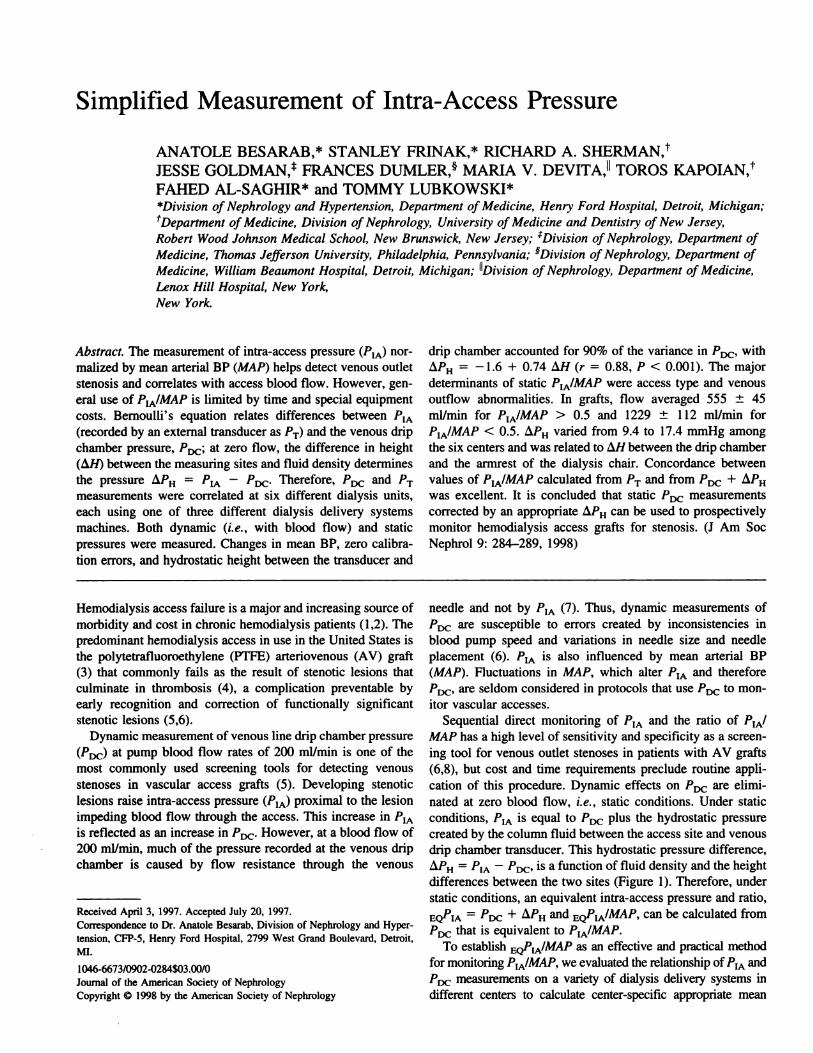
Simplified Measurement of Intra-Access Pressure ANATOLE BESARAB,* STANLEY FRINAK,* RICHARD A. SHERMAN,t JESSE GOLDMAN,t FRANCES DUMLER, MARIA V. DEVITA,11 TOROS KAPOIAN, FAHED ALSAGHIR* and TOMMY LUBKOWSKI* *Di,ision of Nephrology and Hypertension, Department of Medicine, Henry Ford Hospital, Detroit, Michigan; tDepartment of Medicine, Division of Nephrology, University of Medicine and Dentistry of New Jersey, Robert Wood Johnson Medical School, New Brunswick, New Jersey; Division of Nephrology, Department of Medicine, Thomas Jefferson University, Philadelphia, Pennsylvania; Division of Nephrology, Department of Medicine, William Beaumont Hospital, Detroit, Michigan; “Division of Nephrology, Department of Medicine, Lenox Hill Hospital. New York, New York. Abstract. The measurement of intra-access pressure (VIA) nor- malized by mean arterial BP (MAP) helps detect venous outlet stenosis and correlates with access blood flow. However, gen- eral use of PIA/MAP is limited by time and special equipment costs. Bernoulli’s equation relates differences between IA (recorded by an external transducer as T) and the venous drip chamber pressure, MDC; at zero flow, the difference in height (H) between the measuring sites and fluid density determines the pressure IA DC#{149} Therefore, and ‘T measurements were correlated at six different dialysis units, each using one of three different dialysis delivery systems machines. Both dynamic (i.e. , with blood flow) and static pressures were measured. Changes in mean BP, zero calibra- tion errors, and hydrostatic height between the transducer and drip chamber accounted for 90% of the variance in MDC’ with ‘H 1.6 + 0.74 zH (r = 0.88, P < 0.001). The major determinants of static PtA/MAP were access type and venous outflow abnormalities. In grafts, flow averaged 555 ± 45 mllrnin for PIA/MAP > 0.5 and 1229 ± 1 12 mllmin for PtA/MAP < 0.5. varied from 9.4 to 17.4 mmHg among the six centers and was related to H between the drip chamber and the armrest of the dialysis chair. Concordance between values of PIA/MAP calculated from T and from DC was excellent. It is concluded that static DC measurements corrected by an appropriate can be used to prospectively monitor hemodialysis access grafts for stenosis. (J Am Soc Nephrol 9: 284-289, 1998) Hemodialysis access failure is a major and increasing source of morbidity and cost in chronic hemodialysis patients (I ,2). The predominant hemodialysis access in use in the United States is the polytetrafluoroethylene (PTFE) arteriovenous (AV) graft (3) that commonly fails as the result of stenotic lesions that culminate in thrombosis (4), a complication preventable by early recognition and correction of functionally significant stenotic lesions (5,6). Dynamic measurement of venous line drip chamber pressure (MDc) at pump blood flow rates of 200 mllmin is one of the most commonly used screening tools for detecting venous stenoses in vascular access grafts (5). Developing stenotic lesions raise intra-access pressure (viA) proximal to the lesion impeding blood flow through the access. This increase in IA is reflected as an increase in DC#{149} However, at a blood flow of 200 ml/min, much of the pressure recorded at the venous drip chamber is caused by flow resistance through the venous Received April 3. 1997. Accepted July 20, 1997. Correspondence to Dr. Anatole Besarab, Division of Nephrology and Hyper- tension, CFP-5, Henry Ford Hospital, 2799 West Grand Boulevard, Detroit, MI. 1046-6673/0902-0284$03.OO/O Journal of the American Society of Nephrology Copyright © 1998 by the American Society of Nephrology needle and not by ‘31A (7). Thus, dynamic measurements of DC are susceptible to errors created by inconsistencies in blood pump speed and variations in needle size and needle placement (6). 1A is also influenced by mean arterial BP (MAP). Fluctuations in MAP, which alter IA and therefore ‘DC, are seldom considered in protocols that use DC to mon- itor vascular accesses. Sequential direct monitoring of IA and the ratio of VIA’ MAP has a high level of sensitivity and specificity as a screen- ing tool for venous outlet stenoses in patients with AV grafts (6,8), but cost and time requirements preclude routine appli- cation of this procedure. Dynamic effects on DC are elimi- nated at zero blood flow, i.e. , static conditions. Under static conditions, ‘IA S equal to DC plus the hydrostatic pressure created by the column fluid between the access site and venous drip chamber transducer. This hydrostatic pressure difference, ‘H IA ‘DC S a function of fluid density and the height differences between the two sites (Figure 1 ). Therefore, under static conditions, an equivalent intra-access pressure and ratio, EQIA = ‘DC ‘H and EQPIA/M, can be calculated from PDc that is equivalent to PtA/MAP. To establish EcPIA/MAP IS an effective and practical method for monitoring PIA/MAP, we evaluated the relationship of IA and PDC measurements on a variety of dialysis delivery systems in different centers to calculate center-specific appropriate mean
Transcript of Simplified Measurement of Intra-Access Pressure
Simplified Measurement of Intra-Access Pressure
ANATOLE BESARAB,* STANLEY FRINAK,* RICHARD A. SHERMAN,t
JESSE GOLDMAN,t FRANCES DUMLER,� MARIA V. DEVITA,11 TOROS KAPOIAN,�
FAHED AL�SAGHIR* and TOMMY LUBKOWSKI**Di�,ision of Nephrology and Hypertension, Department of Medicine, Henry Ford Hospital, Detroit, Michigan;
tDepartment of Medicine, Division of Nephrology, University of Medicine and Dentistry of New Jersey,
Robert Wood Johnson Medical School, New Brunswick, New Jersey; �Division of Nephrology, Department of
Medicine, Thomas Jefferson University, Philadelphia, Pennsylvania; �Division of Nephrology, Department of
Medicine, William Beaumont Hospital, Detroit, Michigan; “Division of Nephrology, Department of Medicine,
Lenox Hill Hospital. New York,
New York.
Abstract. The measurement of intra-access pressure (VIA) nor-
malized by mean arterial BP (MAP) helps detect venous outlet
stenosis and correlates with access blood flow. However, gen-
eral use of PIA/MAP is limited by time and special equipment
costs. Bernoulli’s equation relates differences between �IA
(recorded by an external transducer as �T) and the venous drip
chamber pressure, MDC; at zero flow, the difference in height
(�H) between the measuring sites and fluid density determines
the pressure � �IA � �DC#{149} Therefore, � and ‘�T
measurements were correlated at six different dialysis units,
each using one of three different dialysis delivery systems
machines. Both dynamic (i.e. , with blood flow) and static
pressures were measured. Changes in mean BP, zero calibra-
tion errors, and hydrostatic height between the transducer and
drip chamber accounted for 90% of the variance in MDC’ with
�‘�H � 1.6 + 0.74 z�H (r = 0.88, P < 0.001). The majordeterminants of static PtA/MAP were access type and venous
outflow abnormalities. In grafts, flow averaged 555 ± 45
mllrnin for PIA/MAP > 0.5 and 1229 ± 1 12 mllmin for
PtA/MAP < 0.5. � varied from 9.4 to 17.4 mmHg among
the six centers and was related to �H between the drip chamber
and the armrest of the dialysis chair. Concordance between
values of PIA/MAP calculated from �T and from �DC �
was excellent. It is concluded that static �DC measurements
corrected by an appropriate � can be used to prospectively
monitor hemodialysis access grafts for stenosis. (J Am Soc
Nephrol 9: 284-289, 1998)
Hemodialysis access failure is a major and increasing source of
morbidity and cost in chronic hemodialysis patients (I ,2). The
predominant hemodialysis access in use in the United States is
the polytetrafluoroethylene (PTFE) arteriovenous (AV) graft
(3) that commonly fails as the result of stenotic lesions that
culminate in thrombosis (4), a complication preventable by
early recognition and correction of functionally significant
stenotic lesions (5,6).
Dynamic measurement of venous line drip chamber pressure
(MDc) at pump blood flow rates of 200 mllmin is one of the
most commonly used screening tools for detecting venous
stenoses in vascular access grafts (5). Developing stenotic
lesions raise intra-access pressure (viA) proximal to the lesion
impeding blood flow through the access. This increase in �IA
is reflected as an increase in �DC#{149} However, at a blood flow of
200 ml/min, much of the pressure recorded at the venous drip
chamber is caused by flow resistance through the venous
Received April 3. 1997. Accepted July 20, 1997.Correspondence to Dr. Anatole Besarab, Division of Nephrology and Hyper-
tension, CFP-5, Henry Ford Hospital, 2799 West Grand Boulevard, Detroit,MI.
1046-6673/0902-0284$03.OO/OJournal of the American Society of NephrologyCopyright © 1998 by the American Society of Nephrology
needle and not by ‘31A (7). Thus, dynamic measurements of
�DC are susceptible to errors created by inconsistencies inblood pump speed and variations in needle size and needle
placement (6). �1A is also influenced by mean arterial BP
(MAP). Fluctuations in MAP, which alter �IA and therefore
‘�DC, are seldom considered in protocols that use �DC to mon-itor vascular accesses.
Sequential direct monitoring of �IA and the ratio of VIA’
MAP has a high level of sensitivity and specificity as a screen-
ing tool for venous outlet stenoses in patients with AV grafts
(6,8), but cost and time requirements preclude routine appli-
cation of this procedure. Dynamic effects on �DC are elimi-
nated at zero blood flow, i.e. , static conditions. Under static
conditions, ‘�IA �S equal to �DC plus the hydrostatic pressure
created by the column fluid between the access site and venous
drip chamber transducer. This hydrostatic pressure difference,
�‘�H �IA � ‘�DC� �S a function of fluid density and the heightdifferences between the two sites (Figure 1 ). Therefore, under
static conditions, an equivalent intra-access pressure and ratio,
EQ�IA = ‘�DC � �‘�H and EQPIA/M, can be calculated from
PDc that is equivalent to PtA/MAP.To establish EcPIA/MAP �IS an effective and practical method
for monitoring PIA/MAP, we evaluated the relationship of �IA and
PDC measurements on a variety of dialysis delivery systems indifferent centers to calculate center-specific appropriate mean

�DC
Transducer
Transducer 4”
Simplified Measurement of Intra-Access Pressure 285
values. The variation in � among different dialysis ma-chines and centers was related to a simply measured parameter,
the height difference between the drip chamber and the armrest of
the dialysis chair. To define the clinical relevance of EQPIA/MAP
in detecting hemodynamically significant vascular access steno-
ses, Doppler ultrasound studies and angiography were performed
at the initial dialysis site (hereafter referred to as the alpha site),
where the methodology was developed.
Materials and MethodsThe study included six different dialysis centers in the United
States. Dialysis delivery systems studied used digitally displayed
venous mean pressures; these included Fresenius-H (F-H), Cobe Cen-tury 3 (CC3), and Althin 2000 (ALT). At each center, a pressure
transducer (Namic USA, Glenns Falls, NY) was placed between the
venous return tubing and the venous needle and connected to a
pressure monitor (Hewlett-Packard, King of Prussia, PA), as depicted
in Figure 1. The transducer was taped to the extremity at the bevel ofthe venous needle in the access, and pressures were recorded from the
patient monitor connected to the transducer, �T’ and from the venousdrip chamber pressure display. �DC#{149} Atmospheric pressure served as
the zero reference point for the access transducer and the drip chamber
transducer. �DC and �T were recorded at the patient’s usual blood
flow (250 to 500 ml/min), at zero (static) flow, and at one or more
intermediate blood flows.
To measure �DC accurately during no-flow conditions, the drip
chamber has to be isolated from the effects of any ultrafiltration in thedialyzer to prevent dissipation of pressure through the dialyzer mem-
brane. This can be accomplished by either shutting off the ultrafiltra-tion or clamping the venous line between the dialyzer and venous drip
chamber. Preliminary studies in 12 patients revealed no differencebetween the two techniques, ��H’ averaging 17. 1 ± 1.6 mmHg versus
18.5 ± 1.3 mmHg (P = NS, paired t test). Because the clamp method
was simpler and quicker, it was used thereafter at all sites. Equilib-
rium static pressures, �DC and �T’ were recorded 20 to 30 s after the
blood pump was stopped. Simultaneously. MAP was recorded by an
automatic BP monitoring system.
At the alpha site, the height between the level of the transducer and
the top of the blood column in the venous drip chamber was measured
in 33 patients with a ruled T-square and level as �DC and �T were
measured. Pressures and height differences were remeasured 1 to 2 wk
later to assess replicability and to determine the source of variability
in P�. At the end of dialysis, calibration of the drip chamber
transducer was verified using a mercury manometer. At two centers,
measurements were conducted by dialysis nurses or technicians to
assess the practicality of the procedure.
Direct or indirect measurement of intra-access pressures is of little
clinical relevance unless the measurements reflect access flow and
predict hemodynamically significant stenosis. A 50% by diameter
stenosis is widely accepted as hemodynamically significant and as a
precursor of access failure (5,6,9,10). Flow and pressure in grafts areinversely related (I 1). Flow less than 500 to 650 mb/mm in grafts
correlates with either stenosis or impending thrombosis (9-12).
Therefore, patient enrollment at the alpha site required informed
consent that included subject willingness to undergo Doppler flow
studies and angiography. Doppler flow measurements were conducted
on all 33 patients with a permanent access. Angiography was per-
formed on all 26 prosthetic graft accesses and three of the seven
autologous fistulas. The degree of stenosis was graded by the radiol-
ogists as: absent to mild (<30% lumen reduction by diameter [%D]),
possibly hemodynamically significant (30 to 40%D), and hemody-
namically significant (>50%D). At the other sites, patients were
selected at random to represent the mix of access types in use. Neither
Doppler flow nor angiography studies were performed.
Statistical Analyses
Data were analyzed using Systat for Windows (version 5.02. Sys-
tat, Inc., Evanston. IL). All results are presented as mean ± SEM. A
P value <0.05 was accepted as statistically significant.
L� H ( height)
Arterial
Venous
Figure 1. Schematic of circuit showing that the measurement of pressure at the level of the access by an external transducer and from the drip
chambers differs by a height difference (L�H).
XPH=-l.6+O.74�H.
(p<O.O()I)
10 20 30 40 50
y = 24+ O.34x +O.00037x2
. Venous Drip Chamber
. Transducer
static level
300 400 500 600
286 Journal of the American Society of Nephrology
ResultsOverall, we studied 185 arm prosthetic grafts, 57 native
arteriovenous fistulas, and four central venous catheters; the
number of permanent accesses studied among centers varied
from 16 to 7 1 . Inclusion of native AV fistulae along with a few
catheters allowed a wider variation in pressures and in �
than that allowed by the study of prosthetic grafts alone. At
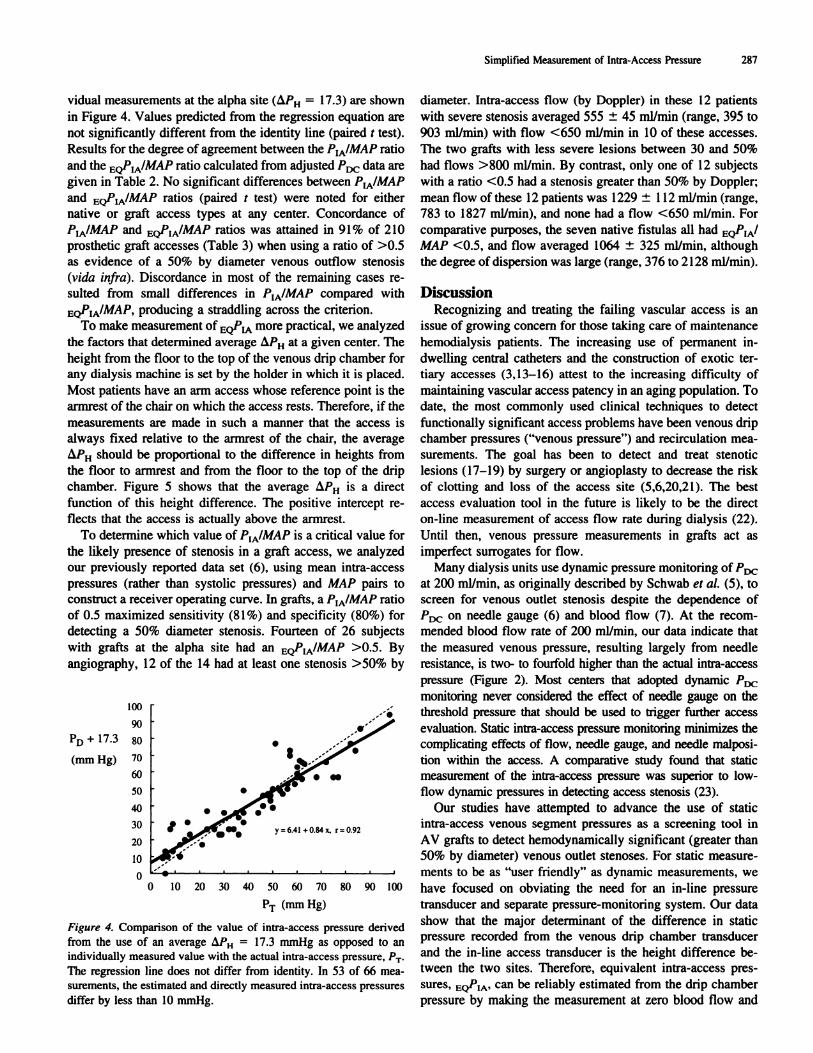
blood flows most often used for dialysis, P� exceeded �T by
more than 40 mmHg at all sites (data not shown). Figure 2
shows the relationship between �T and �DC measured over a
range of flows at the alpha site. At a blood flow of 150 ml/min,
‘3T and �DC were virtually identical; however, at this flow �DC
exceeded ‘�T by 1 1 mmHg with Cobe and Althin dialysis
equipment (data not shown).
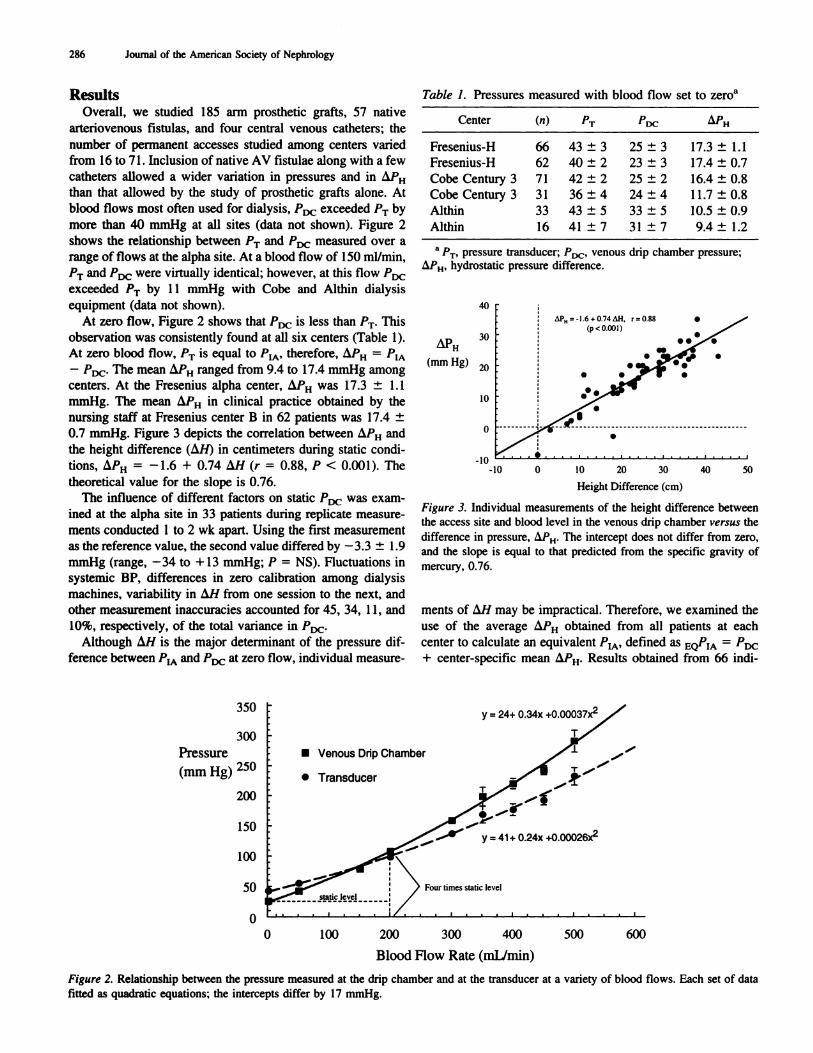
At zero flow, Figure 2 shows that �DC is less than �T#{149}This
observation was consistently found at all six centers (Table 1).
At zero blood flow, �T �S equal to VIA’ therefore, � =
- �DC The mean � ranged from 9.4 to 17.4 mmHg amongcenters. At the Fresenius alpha center, � was 1 7.3 ± 1.1
mmHg. The mean � in clinical practice obtained by the
nursing staff at Fresenius center B in 62 patients was 17.4 ±
0.7 mmHg. Figure 3 depicts the correlation between � and
the height difference (�H) in centimeters during static condi-tions, � � 1.6 + 0.74 i�H (r 0.88, P < 0.001). The
theoretical value for the slope is 0.76.
The influence of different factors on static P� was exam-
med at the alpha site in 33 patients during replicate measure-
ments conducted 1 to 2 wk apart. Using the first measurement
as the reference value, the second value differed by -3.3 ± 1.9
mmHg (range, -34 to + 13 mmHg; P = NS). Fluctuations in
systemic BP, differences in zero calibration among dialysis
machines, variability in �H from one session to the next, and
other measurement inaccuracies accounted for 45, 34, 1 1 , and10%, respectively, of the total variance in P�.
Although �H is the major determinant of the pressure dif-
ference between #{241}A and �DC at zero flow, individual measure-
Table 1. Pressures measured with blood flow set to zero�’
Center (,,) �T MDc: �H
Fresenius-H 66 43 ± 3 25 ± 3 1 7.3 ± 1.1
Fresenius-H 62 40 ± 2 23 ± 3 17.4 ± 0.7
Cobe Century 3 71 42 ± 2 25 ± 2 16.4 ± 0.8
Cobe Century 3 3 1 36 ± 4 24 ± 4 1 1.7 ± 0.8
Althin 33 43 ± 5 33 ± 5 10.5 ± 0.9
Althin 16 41 ± 7 31 ± 7 9.4 ± 1.2
a �T’ pressure transducer; P0�. venous drip chamber pressure;
�‘�H’ hydrostatic pressure difference.
(mm Hg)
40
30
20
10
0
-10-10
Height Difference (cm)
Figure 3. Individual measurements of the height difference between
the access site and blood level in the venous drip chamber versus the
difference in pressure, i�PH. The intercept does not differ from zero,
and the slope is equal to that predicted from the specific gravity of
mercury, 0.76.
ments of �H may be impractical. Therefore, we examined the
use of the average Z�PH obtained from all patients at each
center to calculate an equivalent VIA’ defined as EQ�IA = �DC
+ center-specific mean � Results obtained from 66 mdi-
350
300
Pressure
(mm Hg) 250
200
150
100
50
0
0 100 200
Blood Flow Rate (mL/min)
Figure 2. Relationship between the pressure measured at the drip chamber and at the transducer at a variety of blood flows. Each set of datafitted as quadratic equations; the intercepts differ by 17 mmHg.
�D � 17.3
(mm Hg)
.
lOt)
90
80
70
60
50
40
30
20
10
0
I �
Simplified Measurement of Intra-Access Pressure 287
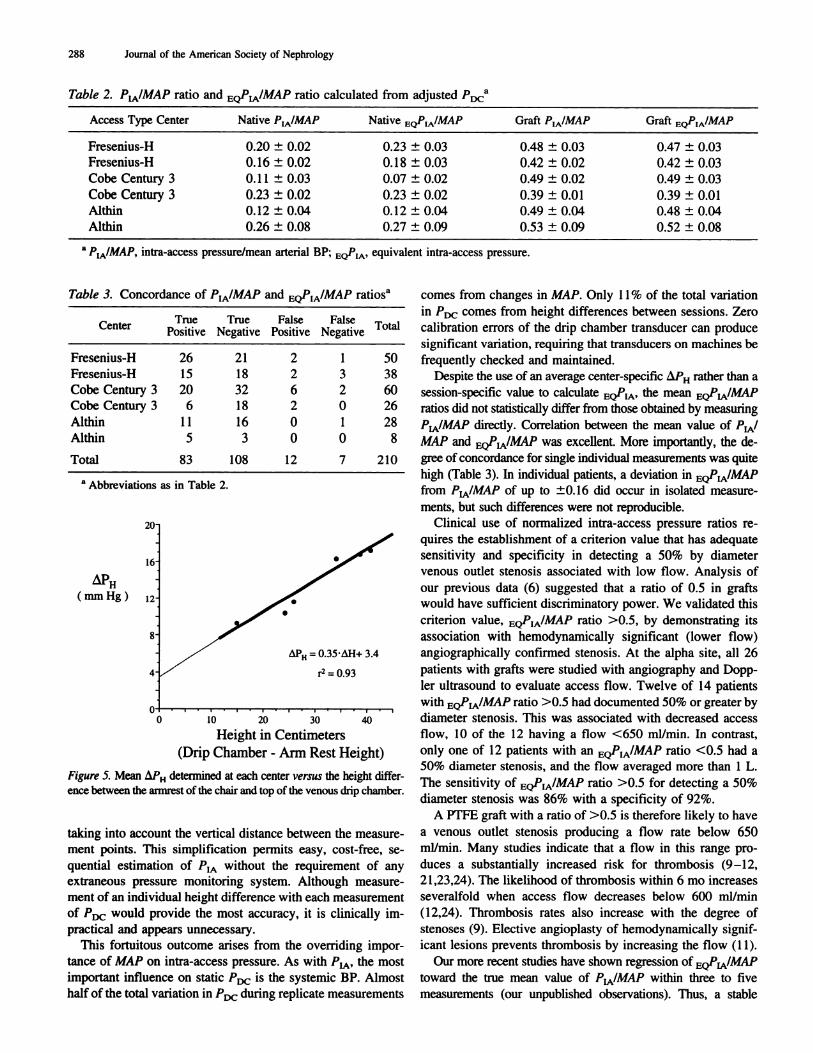
vidual measurements at the alpha site (��H = 17.3) are shown
in Figure 4. Values predicted from the regression equation are
not significantly different from the identity line (paired t test).
Results for the degree of agreement between the PIA/MAP ratio
and the EQPIA/MAP ratio calculated from adjusted P,� data are
given in Table 2. No significant differences between PIA/ MAP
and EQPIA/MAP ratios (paired t test) were noted for either
native or graft access types at any center. Concordance ofPIA/MAP and EQPIA/MAP ratios was attained in 91% of 210
prosthetic graft accesses (Table 3) when using a ratio of >0.5
as evidence of a 50% by diameter venous outflow stenosis
(vida infra). Discordance in most of the remaining cases re-
sulted from small differences in PIA/MAP compared with
EQPlA�’MAP, producing a straddling across the criterion.To make measurement of EQPIA more practical, we analyzed
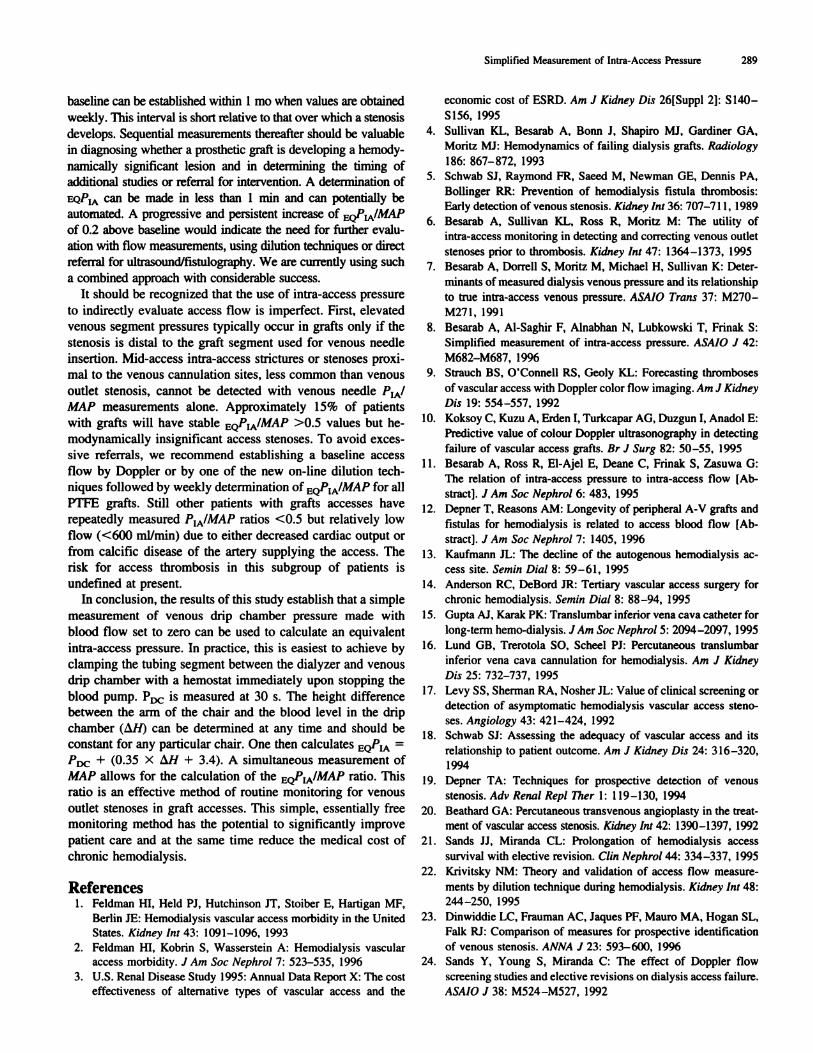
the factors that determined average � at a given center. The
height from the floor to the top of the venous drip chamber for
any dialysis machine is set by the holder in which it is placed.
Most patients have an arm access whose reference point is the
armrest of the chair on which the access rests. Therefore, if the
measurements are made in such a manner that the access is
always fixed relative to the armrest of the chair, the average
� should be proportional to the difference in heights fromthe floor to armrest and from the floor to the top of the drip
chamber. Figure 5 shows that the average L�PH is a direct
function of this height difference. The positive intercept re-
flects that the access is actually above the armrest.
To determine which value of PIA/MAP is a critical value for
the likely presence of stenosis in a graft access, we analyzedour previously reported data set (6), using mean intra-access
pressures (rather than systolic pressures) and MAP pairs to
construct a receiver operating curve. In grafts, a PtA/MAP ratio
of 0.5 maximized sensitivity (8 1%) and specificity (80%) for
detecting a 50% diameter stenosis. Fourteen of 26 subjects
with grafts at the alpha site had an EQPIA/MAP >0.5. By
angiography, 12 of the 14 had at least one stenosis >50% by
0 10 20 30 40 50 60 70 80 90 100
�T (mm Hg)
Figure 4. Comparison of the value of intra-access pressure derived
from the use of an average � = I 7.3 mmHg as opposed to an
individually measured value with the actual intra-access pressure, P�.
The regression line does not differ from identity. In 53 of 66 mea-surements, the estimated and directly measured intra-access pressures
differ by less than 10 mmHg.
diameter. Intra-access flow (by Doppler) in these 12 patients
with severe stenosis averaged 555 ± 45 mb/mm (range, 395 to
903 mllmin) with flow <650 ml/min in 10 of these accesses.
The two grafts with less severe lesions between 30 and 50%
had flows >800 ml/min. By contrast, only one of 12 subjects
with a ratio <0.5 had a stenosis greater than 50% by Doppler;
mean flow of these 12 patients was I 229 ± 1 12 mi/mm (range,
783 to 1827 mI/mm), and none had a flow <650 mI/mm. For
comparative purposes, the seven native fistulas all had EQ�IA’
MAP <0.5, and flow averaged 1064 ± 325 ml/min, although
the degree ofdispersion was large (range, 376 to 2128 ml/min).
DiscussionRecognizing and treating the failing vascular access is an
issue of growing concern for those taking care of maintenance
hemodialysis patients. The increasing use of permanent in-
dwelling central catheters and the construction of exotic ter-
tiary accesses (3,13-16) attest to the increasing difficulty of
maintaining vascular access patency in an aging population. To
date, the most commonly used clinical techniques to detect
functionally significant access problems have been venous drip
chamber pressures (“venous pressure”) and recirculation mea-
surements. The goal has been to detect and treat stenotic
lesions (17-19) by surgery or angioplasty to decrease the risk
of clotting and loss of the access site (5,6,20,2 1 ). The best
access evaluation tool in the future is likely to be the direct
on-line measurement of access flow rate during dialysis (22).
Until then, venous pressure measurements in grafts act as
imperfect surrogates for flow.
Many dialysis units use dynamic pressure monitoring of P�
at 200 ml/min, as originally described by Schwab et a!. (5), toscreen for venous outlet stenosis despite the dependence of
�DC #{176}� needle gauge (6) and blood flow (7). At the recom-mended blood flow rate of 200 mI/mm, our data indicate that
the measured venous pressure, resulting largely from needle
resistance, is two- to fourfold higher than the actual intra-access
pressure (Figure 2). Most centers that adopted dynamic P,�
monitoring never considered the effect of needle gauge on the
threshold pressure that should be used to trigger further access
evaluation. Static intra-access pressure monitoring minimizes the
complicating effects of flow, needle gauge, and needle malposi-
tion within the access. A comparative study found that static
measurement of the intra-access pressure was superior to low-
flow dynamic pressures in detecting access stenosis (23).
Our studies have attempted to advance the use of staticintra-access venous segment pressures as a screening tool in
AV grafts to detect hemodynamically significant (greater than
50% by diameter) venous outlet stenoses. For static measure-
ments to be as “user friendly” as dynamic measurements, we
have focused on obviating the need for an in-line pressure
transducer and separate pressure-monitoring system. Our data
show that the major determinant of the difference in static
pressure recorded from the venous drip chamber transducer
and the in-line access transducer is the height difference be-
tween the two sites. Therefore, equivalent intra-access pres-
sures, EQ’�IA� can be reliably estimated from the drip chamber
pressure by making the measurement at zero blood flow and
I:
.
40
288 Journal of the American Society of Nephrology
Table 2. PIA/MAP ratio and EQPIA/MAP ratio calculated from adjusted �DC�’
Access Type Center Native PIA/MAP Native EQPIA/MAP Graft PIA/MAP Graft EQPJA/MAP
Fresenius-H 0.20 ± 0.02 0.23 ± 0.03 0.48 ± 0.03 0.47 ± 0.03
Fresenius-H 0. 16 ± 0.02 0. 1 8 ± 0.03 0.42 ± 0.02 0.42 ± 0.03
Cobe Century 3 0. 1 1 ± 0.03 0.07 ± 0.02 0.49 ± 0.02 0.49 ± 0.03
Cobe Century 3 0.23 ± 0.02 0.23 ± 0.02 0.39 ± 0.01 0.39 ± 0.01
Althin 0.12 ± 0.04 0.12 ± 0.04 0.49 ± 0.04 0.48 ± 0.04
Althin 0.26 ± 0.08 0.27 ± 0.09 0.53 ± 0.09 0.52 ± 0.08
a P/MAP intra-access pressure/mean arterial BP; EQPIA. equivalent intra-access pressure.
Table 3. Concor dance of PIA/MAP and EQPI A/MAP ratiosa
CenterTrue
. .
PosltlveTrue
.
NegatlveFalse
. .
PosltlveFalse
.
NegattveTotal
Fresenius-H 26 21 2 1 50
Fresenius-H 15 18 2 3 38
Cobe Century 3 20 32 6 2 60
Cobe Century 3 6 1 8 2 0 26
Althin 11 16 0 1 28
Althin 5 3 0 0 8
Total 83 108 12 7 210
a Abbreviations as in Table 2.
( mm Hg)
L�Pu 0.35M1+ 3.4
r2 = 0.93
10 20 30
Height in Centimeters
(Drip Chamber - Arm Rest Height)
Figure 5. Mean � determined at each center versus the height differ-
ence between the armrest of the chair and top of the venous drip chamber.
taking into account the vertical distance between the measure-
ment points. This simplification permits easy, cost-free, se-
quential estimation of �lA without the requirement of any
extraneous pressure monitoring system. Although measure-
ment of an individual height difference with each measurement
of �DC would provide the most accuracy, it is clinically im-
practical and appears unnecessary.
This fortuitous outcome arises from the overriding impor-
tance of MAP on intra-access pressure. As with �lA’ the most
important influence on static �DC is the systemic BP. Almost
half of the total variation in � during replicate measurements
comes from changes in MAP. Only 1 1 % of the total variation
in P0C comes from height differences between sessions. Zero
calibration errors of the drip chamber transducer can produce
significant variation, requiring that transducers on machines be
frequently checked and maintained.
Despite the use of an average center-specific z�PH rather than a
session-specific value to calculate EQPIA� the mean EQP IA/MAP
ratios did not statistically differ from those obtained by measuring
PtA/MAP directly. Correlation between the mean value of VIA’
MAP and EQPIA/MAP was excellent. More importantly, the de-
gree of concordance for single individual measurements was quite
high (Table 3). In individual patients, a deviation in EQP IA/MAP
from PIA/MAP of up to ±0. 16 did occur in isolated measure-
ments, but such differences were not reproducible.
Clinical use of normalized intra-access pressure ratios re-
quires the establishment of a criterion value that has adequate
sensitivity and specificity in detecting a 50% by diameter
venous outlet stenosis associated with low flow. Analysis of
our previous data (6) suggested that a ratio of 0.5 in grafts
would have sufficient discriminatory power. We validated this
criterion value, EQPIA/MAP ratio >0.5, by demonstrating its
association with hemodynamically significant (lower flow)
angiographically confirmed stenosis. At the alpha site, all 26
patients with grafts were studied with angiography and Dopp-
ler ultrasound to evaluate access flow. Twelve of 14 patients
with EQPIA/MAP ratio >0.5 had documented 50% or greater by
diameter stenosis. This was associated with decreased access
flow, I 0 of the I 2 having a flow <650 ml/min. In contrast,
only one of 12 patients with an EQPIA/MAP ratio <0.5 had a
50% diameter stenosis, and the flow averaged more than 1 L.
The sensitivity of EQPIA/MAP ratio >0.5 for detecting a 50%
diameter stenosis was 86% with a specificity of 92%.
A PTFE graft with a ratio of >0.5 is therefore likely to have
a venous outlet stenosis producing a flow rate below 650
ml/min. Many studies indicate that a flow in this range pro-
duces a substantially increased risk for thrombosis (9-12,
21 ,23,24). The likelihood of thrombosis within 6 mo increases
severalfold when access flow decreases below 600 mllmin
(I 2,24). Thrombosis rates also increase with the degree of
stenoses (9). Elective angioplasty of hemodynamically signif-
icant lesions prevents thrombosis by increasing the flow (1 1).
Our more recent studies have shown regression of EQPIA/MAP
toward the true mean value of PIA/MAP within three to five
measurements (our unpublished observations). Thus, a stable
Simplified Measurement of Intra-Access Pressure 289
baseline can be established within 1 mo when values are obtainedweekly. This interval is short relative to that over which a stenosis
develops. Sequential measurements thereafter should be valuable
in diagnosing whether a prosthetic graft is developing a hemody-
namically significant lesion and in determining the timing of
additional studies or referral for intervention. A determination of
EQPIA can be made in less than 1 mm and can potentially be
automated. A progressive and persistent increase of EQPIA/MAP
of 0.2 above baseline would indicate the need for further evalu-
ation with flow measurements, using dilution techniques or direct
referral for ultrasound/fistulography. We are currently using such
a combined approach with considerable success.
It should be recognized that the use of intra-access pressure
to indirectly evaluate access flow is imperfect. First, elevatedvenous segment pressures typically occur in grafts only if the
stenosis is distal to the graft segment used for venous needle
insertion. Mid-access intra-access strictures or stenoses proxi-
mal to the venous cannulation sites, less common than venous
outlet stenosis, cannot be detected with venous needle VIA’
MAP measurements alone. Approximately 15% of patients
with grafts will have stable EQPIA/MAP >0.5 values but he-
modynamically insignificant access stenoses. To avoid exces-
sive referrals, we recommend establishing a baseline access
flow by Doppler or by one of the new on-line dilution tech-niques followed by weekly determination of EQPIA/MAP for all
PTFE grafts. Still other patients with grafts accesses have
repeatedly measured PIA/MAP ratios <0.5 but relatively low
flow (<600 mI/mm) due to either decreased cardiac output orfrom calcific disease of the artery supplying the access. The
risk for access thrombosis in this subgroup of patients is
undefined at present.In conclusion, the results of this study establish that a simple
measurement of venous drip chamber pressure made with
blood flow set to zero can be used to calculate an equivalent
intra-access pressure. In practice, this is easiest to achieve by
clamping the tubing segment between the dialyzer and venous
drip chamber with a hemostat immediately upon stopping the
blood pump. �DC is measured at 30 s. The height difference
between the arm of the chair and the blood level in the drip
chamber (z�H) can be determined at any time and should be
constant for any particular chair. One then calculates EQPIA =
PDc2 + (0.35 X �H + 3.4). A simultaneous measurement of
MAP allows for the calculation of the EQPIA/MAP ratio. This
ratio is an effective method of routine monitoring for venous
outlet stenoses in graft accesses. This simple, essentially freemonitoring method has the potential to significantly improve
patient care and at the same time reduce the medical cost of
chronic hemodialysis.
References1. Feldman HI, Held P1, Hutchinson IT, Stoiber E, Hartigan MF,
Berlin IE: Hemodialysis vascular access morbidity in the UnitedStates. Kidney mt 43: 1091-1096, 1993
2. Feldman HI, Kobrin 5, Wasserstein A: Hemodialysis vascular
access morbidity. J Am Soc Nephrol 7: 523-535, 1996
3. U.S. Renal Disease Study 1995: Annual Data Report X: The cost
effectiveness of alternative types of vascular access and the
economic cost of ESRD. A,n J Kidney Dis 26[Suppl 2J: 5 140-
5156, 1995
4. Sullivan KL, Besarab A, Bonn J, Shapiro MI. Gardiner GA,
Moritz MI: Hemodynamics of failing dialysis grafts. Radiology
186: 867-872, 1993
5. Schwab SI, Raymond FR, Saeed M, Newman GE, Dennis PA,
Bollinger RR: Prevention of hemodialysis fistula thrombosis:
Early detection of venous stenosis. Kidney mt 36: 707-7 1 1, 1989
6. Besarab A, Sullivan KL, Ross R, Moritz M: The utility ofintra-access monitoring in detecting and correcting venous outlet
stenoses prior to thrombosis. Kidney mt 47: 1364-1373, 1995
7. Besarab A. Dorrell 5, Moritz M, Michael H, Sullivan K: Deter-
minants of measured dialysis venous pressure and its relationship
to true intra-access venous pressure. ASAIO Trans 37: M270-
M27l, 1991
8. Besarab A, Al-Saghir F, Alnabhan N, Lubkowski T, Frinak 5:
Simplified measurement of intra-access pressure. ASAJO J 42:
M682-M687, 1996
9. Strauch BS, O’Connell RS, Geoly KL: Forecasting thromboses
of vascular access with Doppler color flow imaging. Am J Kidney
Dis 19: 554-557, 1992
10. Koksoy C, Kuzu A. Erden I, Turkcapar AG, Duzgun I, Anadob E:
Predictive value of colour Doppler ultrasonography in detecting
failure of vascular access grafts. Br J Surg 82: 50-55, 1995
11. Besarab A, Ross R, El-Ajel E, Deane C, Frinak S. Zasuwa G:
The relation of intra-access pressure to intra-access flow [Ab-
stract]. J Am Soc Nephrol 6: 483, 1995
12. Depner T, Reasons AM: Longevity of peripheral A-V grafts and
fistulas for hemodialysis is related to access blood flow [Ab-
stract]. J A,n Soc Nephrol 7: 1405, 1996
13. Kaufmann IL: The decline of the autogenous hemodialysis ac-
cess site.Semi,, Dial 8: 59-61, 1995
14. Anderson RC, DeBord IR: Tertiary vascular access surgery for
chronic hemodialysis. Semin Dial 8: 88-94, 1995
15. Gupta AJ, Karak PK: Translumbar inferior vena cava catheter for
long-term hemo-dialysis. JAm Soc Nephrol 5: 2094-2097, 1995
16. Lund GB, Trerotola SO, Scheel P1: Percutaneous translumbar
inferior vena cava cannulation for hemodialysis. Ai;i J Kidney
Dis 25: 732-737, 1995
17. Levy 55, Sherman RA, Nosher IL: Value of clinical screening or
detection of asymptomatic hemodialysis vascular access steno-
ses. Angiology 43: 421-424, 1992
18. Schwab SI: Assessing the adequacy of vascular access and its
relationship to patient outcome. Am J Kidney Dis 24: 316-320,
I994
19. Depner TA: Techniques for prospective detection of venous
stenosis. Adv Rena! Rep! T/ier I : 1 19 -1 30, 1994
20. Beathard GA: Percutaneous transvenous angioplasty in the treat-
ment of vascular access stenosis. Kidney mt 42: 1390-1397, 1992
21. Sands II, Miranda CL: Prolongation of hemodialysis access
survival with elective revision. C!in Nephrol 44: 334-337, 1995
22. Krivitsky NM: Theory and validation of access flow measure-
ments by dilution technique during hemodialysis. Kidney Im’ 48:244-250, 1995
23. Dinwiddie LC, Frauman AC, laques PF, Mauro MA, Hogan SL,
Falk RI: Comparison of measures for prospective identification
of venous stenosis. ANNA J 23: 593-600, 1996
24. Sands Y, Young 5, Miranda C: The effect of Doppler flow
screening studies and elective revisions on dialysis access failure.
ASAIO J 38: M524-M527, 1992