
Causal relationships between frequency bands of extracellular signals in visual cortex revealed by...
20
J Comput Neurosci (2010) 29:547–566 DOI 10.1007/s10827-010-0236-5 Causal relationships between frequency bands of extracellular signals in visual cortex revealed by an information theoretic analysis Michel Besserve · Bernhard Schölkopf · Nikos K. Logothetis · Stefano Panzeri Received: 20 August 2009 / Revised: 27 January 2010 / Accepted: 25 March 2010 / Published online: 16 April 2010 © The Author(s) 2010. This article is published with open access at Springerlink.com Abstract Characterizing how different cortical rhythms interact and how their interaction changes with sen- sory stimulation is important to gather insights into how these rhythms are generated and what sensory function they may play. Concepts from information theory, such as Transfer Entropy (TE), offer principled ways to quantify the amount of causation between different frequency bands of the signal recorded from extracellular electrodes; yet these techniques are hard to apply to real data. To address the above issues, in this study we develop a method to compute fast Action Editor: Mark van Rossum Electronic supplementary material The online version of this article (doi:10.1007/s10827-010-0236-5) contains supplementary material, which is available to authorized users. This research was supported by the Max Planck Society, by the BMI Project of the Italian Institute of Technology and by the San Paolo Foundation. M. Besserve (B ) · B. Schölkopf · N. K. Logothetis Max Plack Institute for Biological Cybernetics, Spemannstrasse 38, 72076 Tuebingen, Germany e-mail: [email protected] N. K. Logothetis Division of Imaging Science and Biomedical Engineering, University of Manchester, Manchester M13 9PT, United Kingdom S. Panzeri Robotics, Brain and Cognitive Sciences Department, Italian Institute of Technology, Via Morego 30, 16163 Genova, Italy and reliably the amount of TE from experimental time series of extracellular potentials. The method consisted in adapting efficiently the calculation of TE to ana- log signals and in providing appropriate sampling bias corrections. We then used this method to quantify the strength and significance of causal interaction be- tween frequency bands of field potentials and spikes recorded from primary visual cortex of anaesthetized macaques, both during spontaneous activity and dur- ing binocular presentation of naturalistic color movies. Causal interactions between different frequency bands were prominent when considering the signals at a fine (ms) temporal resolution, and happened with a very short (ms-scale) delay. The interactions were much less prominent and significant at coarser temporal resolu- tions. At high temporal resolution, we found strong bidirectional causal interactions between gamma-band (40–100 Hz) and slower field potentials when con- sidering signals recorded within a distance of 2 mm. The interactions involving gamma bands signals were stronger during movie presentation than in absence of stimuli, suggesting a strong role of the gamma cycle in processing naturalistic stimuli. Moreover, the phase of gamma oscillations was playing a stronger role than their amplitude in increasing causations with slower field potentials and spikes during stimulation. The dom- inant direction of causality was mainly found in the direction from MUA or gamma frequency band signals to lower frequency signals, suggesting that hierarchical correlations between lower and higher frequency corti- cal rhythms are originated by the faster rhythms. Keywords Local field potentials · Transfer Entropy (TE) · Information theory
-
Upload
independent -
Category
Documents
-
view
0 -
download
0
Transcript of Causal relationships between frequency bands of extracellular signals in visual cortex revealed by...
J Comput Neurosci (2010) 29:547–566DOI 10.1007/s10827-010-0236-5
Causal relationships between frequency bandsof extracellular signals in visual cortex revealedby an information theoretic analysis
Michel Besserve · Bernhard Schölkopf ·Nikos K. Logothetis · Stefano Panzeri
Received: 20 August 2009 / Revised: 27 January 2010 / Accepted: 25 March 2010 / Published online: 16 April 2010© The Author(s) 2010. This article is published with open access at Springerlink.com
Abstract Characterizing how different cortical rhythmsinteract and how their interaction changes with sen-sory stimulation is important to gather insights intohow these rhythms are generated and what sensoryfunction they may play. Concepts from informationtheory, such as Transfer Entropy (TE), offer principledways to quantify the amount of causation betweendifferent frequency bands of the signal recorded fromextracellular electrodes; yet these techniques are hardto apply to real data. To address the above issues,in this study we develop a method to compute fast
Action Editor: Mark van Rossum
Electronic supplementary material The online version of thisarticle (doi:10.1007/s10827-010-0236-5) containssupplementary material, which is available to authorizedusers.
This research was supported by the Max Planck Society, bythe BMI Project of the Italian Institute of Technology andby the San Paolo Foundation.
M. Besserve (B) · B. Schölkopf · N. K. LogothetisMax Plack Institute for Biological Cybernetics,Spemannstrasse 38, 72076 Tuebingen, Germanye-mail: [email protected]
N. K. LogothetisDivision of Imaging Science and Biomedical Engineering,University of Manchester, Manchester M13 9PT,United Kingdom
S. PanzeriRobotics, Brain and Cognitive Sciences Department,Italian Institute of Technology,Via Morego 30, 16163 Genova, Italy
and reliably the amount of TE from experimental timeseries of extracellular potentials. The method consistedin adapting efficiently the calculation of TE to ana-log signals and in providing appropriate sampling biascorrections. We then used this method to quantifythe strength and significance of causal interaction be-tween frequency bands of field potentials and spikesrecorded from primary visual cortex of anaesthetizedmacaques, both during spontaneous activity and dur-ing binocular presentation of naturalistic color movies.Causal interactions between different frequency bandswere prominent when considering the signals at a fine(ms) temporal resolution, and happened with a veryshort (ms-scale) delay. The interactions were much lessprominent and significant at coarser temporal resolu-tions. At high temporal resolution, we found strongbidirectional causal interactions between gamma-band(40–100 Hz) and slower field potentials when con-sidering signals recorded within a distance of 2 mm.The interactions involving gamma bands signals werestronger during movie presentation than in absence ofstimuli, suggesting a strong role of the gamma cyclein processing naturalistic stimuli. Moreover, the phaseof gamma oscillations was playing a stronger role thantheir amplitude in increasing causations with slowerfield potentials and spikes during stimulation. The dom-inant direction of causality was mainly found in thedirection from MUA or gamma frequency band signalsto lower frequency signals, suggesting that hierarchicalcorrelations between lower and higher frequency corti-cal rhythms are originated by the faster rhythms.
Keywords Local field potentials · Transfer Entropy(TE) · Information theory

548 J Comput Neurosci (2010) 29:547–566
1 Introduction
A prominent feature of both spontaneous and sensory-evoked cortical activity, revealed by extracellularrecordings of Local Field Potentials (LFPs) and spiketrains, is the presence of rhythmic activity (Buzsáki2006; Buzsáki and Draguhn 2004). This rhythmicactivity has a complex structure: even within thesame recording location and during the same task,fluctuations span a very broad frequency spectrum,ranging from a fraction of a Hz to well over 100 Hz,and these rhythms often interact with each other in ahierarchical fashion (Roopun et al. 2008). The fact thatthese broadband fluctuations and their interactions, aswell as their behavioral correlates, are largely preservedthroughout the mammalian evolution has led to suggestthat they are supported by universal mechanisms, andthat the interplay between different rhythms is crucialto the function of the brain and forms a basis for cor-tical information processing (Destexhe and Sejnowski2003; Gray et al. 1989; Llinas and Ribary 1993; Kahanaet al. 2001; Bragin et al. 1999; Buzsáki and Draguhn2004; Buzsáki 2006; Roopun et al. 2008). Understand-ing which rhythms drives which, and how the causalchain is modulated by the stimulus, is thus important tounderstand how rhythms are generated and what rolethey play in sensory function.
The interactions between different rhythms havebeen mainly studied so far by considering a correla-tion analysis between features of two rhythms. Thesestudies have revealed a hierarchically organized set ofrelationships between activity at lower and higher fre-quencies (Roopun et al. 2008). For example, the phaseof slow rhythms (in the theta or delta frequency range)often correlates with the power of the gamma rhythm(Lisman 2005; Canolty et al. 2006; Roopun et al. 2008).However, a problem with a pure correlation analysisis that it cannot tell whether the covariation betweenrhythms arises from true causal relations between thetwo rhythms or from other sources. As a result, we donot know whether or not these relationships imply thepresence of a leading set of frequencies that drives theothers, and if so, which are these leading frequencies.
A more principled and effective approach to estab-lish causal relationships is to use the causality principleformulated by Wiener and Granger (Granger 1969).Using this principle, techniques from information the-ory, such as TE (Schreiber 2000), can in principleprovide measures of the amount of causation betweenrhythms, which provide meaningful answers even inthe presence of strong nonlinearities in the consideredsignals. If the appropriately applied causal techniquesreveal a clearly dominant direction of causality, this
direction can be used to individuate the leading signal.If instead these techniques reveal a similar amountof causation in both directions, their result should beinterpreted as individuating the presence of coherencybetween signals.
Despite their promise, the application of TE tothe study of causal interactions from brain recordingshave been so far limited, largely because of the tech-nical difficulties in computing any information theo-retic quantity from limited samples of neuronal data(Panzeri et al. 2007) and in applying computationallyexpensive estimation methods on large datasets. Thegoal of this article is to overcome the estimation prob-lems that have previously limited extensive use of theTE approach to neurophysiology data, and to prove theworth of these techniques by demonstrating the pres-ence and stimulus modulation of causal relationshipsbetween rhythms of sensory cortex during naturalisticfunction. We develop and test computationally efficientmathematical methods for the reliable computation ofTE between experimentally recorded oscillatory neuralsignals, and we then use this approach to investigatewhich frequency ranges of cortical activity in primaryvisual cortex (either observed from the same location orfrom nearby locations) cause each other. To understandhow the causal chain of frequency relationships is mod-ulated by the presence of sensory stimuli, we quantifythe changes in the amount of causation induced by sen-sory stimulation compared to spontaneous activity. Weconsider neural fluctuations and oscillations expressedboth at the level of spiking activity and of LFPs, sincethey express largely independent and complementaryaspects of the network activity (Logothetis 2008) andhave a largely complementary content in terms of sen-sory information (Belitski et al. 2008).
This article is organized as follows. We first discusshow to measure causality and introduce the concept ofTE; we then consider and address the algorithmic prob-lems arising when computing TE from limited stretchesof neurophysiology data; we develop an efficient al-gorithm for such an estimation; we then apply thisalgorithm to recordings from primary visual cortex andwe compare TE with other methods such as phasecoherence analysis; finally we discuss the implicationsof our findings.
2 Measuring causality
Causality methods compute directional measures ofinteractions between dynamical systems from theirassociated time series. This methodology has beenestablished by the pioneering work of Wiener and
J Comput Neurosci (2010) 29:547–566 549
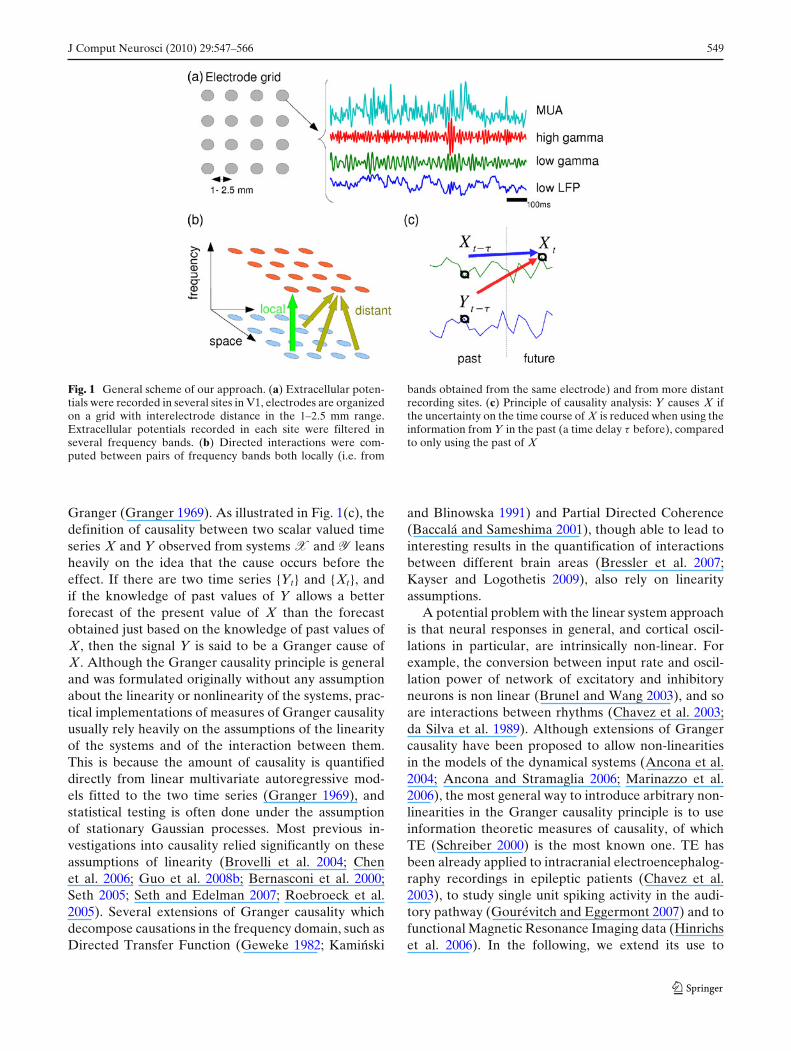
Fig. 1 General scheme of our approach. (a) Extracellular poten-tials were recorded in several sites in V1, electrodes are organizedon a grid with interelectrode distance in the 1–2.5 mm range.Extracellular potentials recorded in each site were filtered inseveral frequency bands. (b) Directed interactions were com-puted between pairs of frequency bands both locally (i.e. from
bands obtained from the same electrode) and from more distantrecording sites. (c) Principle of causality analysis: Y causes X ifthe uncertainty on the time course of X is reduced when using theinformation from Y in the past (a time delay τ before), comparedto only using the past of X
Granger (Granger 1969). As illustrated in Fig. 1(c), thedefinition of causality between two scalar valued timeseries X and Y observed from systems X and Y leansheavily on the idea that the cause occurs before theeffect. If there are two time series {Yt} and {Xt}, andif the knowledge of past values of Y allows a betterforecast of the present value of X than the forecastobtained just based on the knowledge of past values ofX, then the signal Y is said to be a Granger cause ofX. Although the Granger causality principle is generaland was formulated originally without any assumptionabout the linearity or nonlinearity of the systems, prac-tical implementations of measures of Granger causalityusually rely heavily on the assumptions of the linearityof the systems and of the interaction between them.This is because the amount of causality is quantifieddirectly from linear multivariate autoregressive mod-els fitted to the two time series (Granger 1969), andstatistical testing is often done under the assumptionof stationary Gaussian processes. Most previous in-vestigations into causality relied significantly on theseassumptions of linearity (Brovelli et al. 2004; Chenet al. 2006; Guo et al. 2008b; Bernasconi et al. 2000;Seth 2005; Seth and Edelman 2007; Roebroeck et al.2005). Several extensions of Granger causality whichdecompose causations in the frequency domain, such asDirected Transfer Function (Geweke 1982; Kaminski
and Blinowska 1991) and Partial Directed Coherence(Baccalá and Sameshima 2001), though able to lead tointeresting results in the quantification of interactionsbetween different brain areas (Bressler et al. 2007;Kayser and Logothetis 2009), also rely on linearityassumptions.
A potential problem with the linear system approachis that neural responses in general, and cortical oscil-lations in particular, are intrinsically non-linear. Forexample, the conversion between input rate and oscil-lation power of network of excitatory and inhibitoryneurons is non linear (Brunel and Wang 2003), and soare interactions between rhythms (Chavez et al. 2003;da Silva et al. 1989). Although extensions of Grangercausality have been proposed to allow non-linearitiesin the models of the dynamical systems (Ancona et al.2004; Ancona and Stramaglia 2006; Marinazzo et al.2006), the most general way to introduce arbitrary non-linearities in the Granger causality principle is to useinformation theoretic measures of causality, of whichTE (Schreiber 2000) is the most known one. TE hasbeen already applied to intracranial electroencephalog-raphy recordings in epileptic patients (Chavez et al.2003), to study single unit spiking activity in the audi-tory pathway (Gourévitch and Eggermont 2007) and tofunctional Magnetic Resonance Imaging data (Hinrichset al. 2006). In the following, we extend its use to

550 J Comput Neurosci (2010) 29:547–566
quantify the causal relationships between rhythms gen-erated in sensory cortex during spontaneous activityand during naturalistic sensory stimulation, and we con-sider the computational problems arising when com-puting these quantities from limited datasets of neuraldata.
3 Calculation of TE
Transfer Entropy (TE) is a measure of causality thatstems from information theory and relies on the con-cepts of entropy and mutual information, which forcompleteness will be briefly reviewed next.
3.1 Background
Given a discrete random variable X with probabilitydistribution p(x), following Shannon (1948) we definethe entropy of X as
H(X) = −∑
x∈X
p(x) log2(p(x)) (1)
where the summation over x stands for the sum overall possible values of X. H is a positive quantity thatquantifies the uncertainty (or variability) of the randomvariable X. The conditional entropy of X given anotherdiscrete random variable Y is
H(X|Y) = −∑
y∈Y
p(y)∑
x∈X
p(x|y) log2(p(x|y)) (2)
Then mutual information between X and Y is definedas I(X; Y) = H(X) − H(X|Y). I(X; Y) quantifies thereduction of uncertainty about X gained by the knowl-edge of Y. If X and Y are independent then I(X; Y) =0, otherwise mutual information is strictly positive.
3.2 Transfer Entropy (TE)
We consider the time series of two simultaneouslyrecorded neurophysiological signals X and Y. The timeseries of the values of the two signals simultaneouslyrecorded at each sampling time is denoted by (Xt, Yt).We assume that this joint time series can be representedby a discrete stationary Markov process of order k. Thismeans that the probability distribution of the signalsat time t given the past depends only of the vectorscomposed of the k previous samples X(k)
t = (Xt−1,
..., Xt−k) and Y(k)t = (Yt−1, ..., Yt−k), and not on the
values of the signals at earlier times. Then, following(Schreiber 2000), the TE from Y to X is defined as:
TY→X = H(Xt|X(k)t ) − H(Xt|X(k)
t , Y(k)t ) (3)
TE is the mutual information between the present valueof X and the past values of Y, conditioned on theknowledge of past values of X. As such, TE quantifiesthe reduction of uncertainty in Xt when the knowledgeof the past of Y is added to the past of X itself. Anon-zero value for TY→X can be interpreted as “thepast values of Y have an effect on the present valueof X”. The conditioning on past values of X makesTE asymmetric with respect to changes between Xand Y. This asymmetry of TE is a crucial feature toestablish the directionality of information flow betweentwo systems. However, as reported in Schreiber (2000)a direct quantitative comparison of the flow of informa-tion in both directions should be avoided when the twosystems have fundamentally different characteristics.
In practice, although it is reasonable to model thetime series of the neurophysiological signals as Markovprocesses, the order of the Markov process (i.e. thenumber k of past delays that influence the currentneural response and thus must be considered whencomputing Eq. (3)) is not know a priori, and mustbe determined empirically by balancing the followingconflicting requirements. On the one hand, it would bedesirable to use a large value of k in order to include allpossible dependencies between the neural responses.On the other hand, conditioning on many past valuesof the neurophysiological signals makes it very difficultto sample the probabilities entering Eq. (3), the num-ber of samples needed increasing exponentially with k.Following (Schreiber 2000), the empirical solution wechose is to use only one time delay, but to take it at avariable delay τ , which is the same for both time seriesX and Y, and whose value is varied parametricallywithin a range to test the potential effect of causationsat different delays. The expression of TE is then
TY→X = H(Xt|Xt−τ ) − H(Xt|Xt−τ , Yt−τ ) (4)
Importantly, choosing the same delay for both timeseries X and Y requires they vary at comparable timescales, this point will be ensured by the preprocessingdescribed in Section 4.1. We also checked whether theconditioning of TE on a single time delay was sufficientand not inducing false causality values, as follows. Wecomputed TE values when including an additional timedelay 2τ , as follows:
TY→X = H(Xt|Xt−τ , Xt−2τ ) − H(Xt|Xt−τ , Xt−2τ , Yt−τ )
J Comput Neurosci (2010) 29:547–566 551
We found (results not shown) that the magnitude ofTE, the patterns of significance of TE values, and thedifferences between spontaneous and visual stimula-tion (see next section) remained similar to those ob-tained when conditioning on only one previous timepoint (as in Eq. (4)). This consistency lends credibilityto our findings.
Following Gourévitch and Eggermont (2007), wewill quantify causal relationships using a NormalizedTransfer Entropy value (NTE) defined as the propor-tion of reduction of entropy compared to the referenceentropy H(Xt|Xt−τ ):
NTEY→X(τ ) = TY→X
H(Xt|Xt−τ )= 1 − H(Xt|Xt−τ , Yt−τ )
H(Xt|Xt−τ )
(5)
This normalization is very useful because it en-ables to compare information flows independently ofthe degree of dependence between Xt and its past(Gourévitch and Eggermont 2007). In that way, it con-tributes to normalize the measure with respect to thedifferent degree of complexity of the X and Y signals.
3.3 Estimation of TE
We wish to estimate TE between two time seriesof extracellular potentials, which (unlike spike trains)are analog variables. Calculations of TE between ana-log variables is possible by using approximations ofdifferential entropies using Kernel density estimation(KDE) or nearest neighbor distance estimation (NND)(Schreiber 2000; Kaiser and Schreiber 2002; Chavezet al. 2003; Victor 2002). However, these techniques re-quire a large amount of neural data to converge unlessthe underlying probability distributions are sufficientlysmooth (Victor 2002; Nelken et al. 2005). Moreover,KDE and NND techniques are computationally expen-sive, and their use would make it practically unfeasibleto analyze such an extensive dataset (containing hoursof multichannel recordings from several tens of record-ings sites) in a reasonable amount of time on an up-to-date server.
To overcome these difficulties, here we developed asimpler and data robust approach to the estimation ofTEs from analog signals. This approach, which is basedon a recently developed and successful approach to es-timating mutual information between external stimuliand LFPs and EEGs (Belitski et al. 2008; Montemurroet al. 2008; Magri et al. 2009; Kayser et al. 2009), con-sists in first discretizing the considered analog neuralsignals into a given number of bins R; then computing aplug-in estimate of TE (denoted by TY→X) obtained by
simply plugging the experimentally measured discreteprobabilities into the TE equations; and by correctingfor the bias of the plugin TE estimate due to limitedsampling.
Several strategies are possible for the quantizationof the analog signals (see Hlavackova-Schindler et al.2007 for a review). We used equipopulated binningof the marginal distribution of each signal, because itallows a good sampling of the conditional probabilitiesof neural signals. Since it equalized the entropies H(Y)
and H(X) of the two signals, it is also useful to reducepotential problems arising form the different degreesof complexity of the X and Y signals (Quiroga et al.2000; Stam and van Dijk 2002). In all the followingstudy we used a discretization into five bins (R = 5),because we previously found (Magri et al. 2009) thatthis discretization is the coarser one which is sufficientto approximate with very high precision the mutualinformation that the LFPs in the dataset we analyzebelow (see Section 4.1) carry about the visual featuresin the movie. Consistently with these previous findings,here we found that increasing the number of bins didnot change appreciably the TE and NTE values (resultsnot shown). The estimation and subtraction of the biasdue to limited sampling was performed by means of ageneralization to specific case of TE of a “shuffling”bias correction procedure originally developed inMontemurro et al. (2007) and Panzeri et al. (2007) forthe case of mutual information between stimuli andresponses. Details on this bias correction procedurewhich as we will see greatly increases the convergenceof the TE estimation with the sample size are pro-vided in the Appendix. We implemented the requiredentropy calculations using the Information BreakdownToolbox (Magri et al. 2009).
We compared the run time complexity of our ap-proach with respect to a KDE with a rectangular win-dow (as proposed in Schreiber 2000). On a personallaptop equipped with an Intel Core 2 duo processor(2.4 GHz), time for computing a single TE value on50,000 data points takes 50 ms with our approach and10 s using KDE techniques. The reduction in run timecomplexity with our approach is thus crucial for theextensive use of TE measures on a large dataset.
4 Computations of TE between different frequencycomponents of the extracellular signals recordedin primary visual cortex
After having defined TE and NTE and having outlinedthe computation procedure, we now apply it to real
552 J Comput Neurosci (2010) 29:547–566
data with the aim of evaluating its convergence proper-ties and consider which interactions between frequencybands it reveals.
4.1 Neurophysiological data
We begin by describing the neurophysiological record-ings. These data were described before (Belitski et al.2008) in the context of the analysis of how differentfrequencies of neural activity encode naturalistic stim-uli. In brief, we recorded with an array of extracellulartungsten electrodes from primary visual cortex of fourmacaques (monkeys A98, D04, G97, C98) anesthetizedwith opiates. All procedures were approved by thelocal authorities (Regierungspraesidium) and were infull compliance with the guidelines of the EuropeanCommunity (EUVD 86/609/EEC) for the care and useof laboratory animals. The electrodes were arranged ina 4 × 4 square matrix (interelectrode spacing variedfrom 1 mm to 2.5 mm) and introduced for each exper-imental session into the cortex through the overlyingdura mater by a microdrive array system (ThomasRecording). We refer to the study by Eckhorn andThomas (1993) for more details. Electrode tips weretypically (but not always) positioned in the upper ormiddle cortical layers. The impedance of the electrodevaried from 300 k� to 800 k�. For each recording site,the extracellular signals were sampled at 20835 Hz andcollected in response to either a binocularly presented(3.5–6-min long, depending on recording session) natu-ralistic color movie or during a 5 min period of sponta-neous activity (that is, in absence of visual stimulation).In each session, between 5 and 30 repetitions (trials) ofstimulation with the same movie were available, and 5–10 spontaneous-activity trials were also available. Eachrecording site corresponded to a well-defined V1 visualreceptive field within the field of movie projection.From each electrode, we extracted both spiking activityand LFPs as follows.
4.1.1 Extraction of multi-unit-activity (MUA)
Multi-unit-activity (MUA) was extracted by band pass-ing the extracellular signal in the 1,000–3,000 Hz rangeand extracting the envelope of the resulting oscillations(Gail et al. 2004; Logothetis et al. 2001). The resultingquantity is know to represent a weighted average ofthe extracellular spikes of all neurons within a sphereof approximately 140–300 μm around the tip of theelectrode (Logothetis 2003), and can be thus taken asa good measure of the local spiking activity.
4.1.2 Extraction of LFPs
LFPs were extracted by bandpassing the extracellularsignal in the 1–150 Hz frequency range. LFPs obtainedin this way reflect the fluctuations in the input and theintracortical processing of the local cortical network,including the overall effect of population synaptic po-tentials (Mitzdorf 1987; Juergens et al. 1999) and othertypes of slow activity, such as spike afterpotentials andvoltage-dependent membrane oscillations (Harada andTakahashi 1983; Kamondi et al. 1998; Buzsáki 2002;Logothetis 2003).
LFPs were subsequently further decomposed intofrequency bands widely used in the literature (Buzsáki2006). In this study we focused on the following bands:the theta (4–8 Hz) LFP bands, because it is very infor-mative about naturalistic stimuli in both primary visualcortex (Belitski et al. 2008; Montemurro et al. 2008)and auditory cortex (Kayser et al. 2009); the low (40–60 Hz) and high (60–120 Hz) gamma bands, which arealso strongly modulated by visual stimuli (Belitski et al.2008; Berens et al. 2008) and are thought to reflectthe rapid cycles of excitation and inhibition in localrecurrent networks (Brunel and Wang 2003); and thebeta (24–40 Hz) band, which in visual cortex activity hasa relatively strong power and has been hypothesized tobe mainly driven by stimulus-independent neuromodu-latory processes (Belitski et al. 2008; Logothetis 2008).
4.2 Temporal resolutions considered in the analysis
Since signals in different bands may vary on verydifferent time scales, a direct causality analysis of inter-actions between them may not always be appropriate,especially because we compute TE with the same timedelay for both time series under analysis (see Section3.3), thereby assuming a similar time scale for the dy-namics of each series.
The requirement of similarity of time scales ofchanges in the two signals is partly supported in thisdataset by our previous finding (Belitski et al. 2008)that gamma and MUA power variations due to stim-ulation are as slow as the time variations of thelow frequency LFPs. In fact, we found that in thisdataset MUA carries most information and has thehighest power in the low frequency (1–4 Hz) range(Belitski et al. 2008), possibly reflecting network en-trainment to slow regularities in the naturalistic stim-ulus (Mazzoni et al. 2008). Moreover, the envelope ofgamma-range LFPs varies slowly too and covaries withMUA (Belitski et al. 2008).

J Comput Neurosci (2010) 29:547–566 553
However, to better control for possible effects dueto differences in the time scales of the signals, and tostudy parametrically the temporal resolution at whichfrequency bands may cause one another, we decided tolow pass all signals to a cut-off frequency F, which wasvaried parametrically and set the temporal resolutionat which causal relationships were considered. The TEanalysis was thus performed at 3 different time scalescorresponding to low pass cutting frequencies F of 8,30 and 100 Hz and down-sampled at 80, 300 and 1,000Hz respectively (see Table 1).
Additionally to the bandpassed LFPs describedabove, at each considered time scale we computed abroadband signal called “low LFP”, for which the band-width corresponds exactly to the cutting frequency ofthe low pass filter. Because the power spectrum of LFPsignals decays with increasing frequency, activity in thisband is dominated by lower frequencies. We then com-puted also the LFP partitioned in the frequency bandsdefined above. The frequency ranges above the cuttingfrequency of the low pass filter were rectified. Sincethe frequency domain of the amplitude of an oscillationcan range approximately from 0 to half its bandwidth,rectified oscillations were included in the analysis onlyif their bandwidth was sufficiently large to reach thecutting frequency of the low pass filter (otherwise thechanges in amplitude are too slow for the consideredtemporal resolution). This explains for example whyno rectified low gamma activity is computed at middletemporal resolution (see Table 1).
4.3 Convergence of the estimation of TEwith sample size
To ensure our estimation is reliable and not affectedby a limited sampling bias, we first studied the conver-gence properties of NTE for our neurophysiology data.
Table 1 Frequency bands used for causality analysis at threedifferent time resolution
Resolution (F) Low (8 Hz) Middle (30 Hz) High (100 Hz)
Low LFP [0 8 Hz] [0 30 Hz] [0 100 Hz]Theta [4 8 Hz]Beta [24 40 Hz]R [14 30 Hz]Low gamma [40 60 Hz]R [40 60 Hz]High gamma [60 120 Hz]R [60 120 Hz]R [60 100 Hz]MUA [1 3 k Hz]R [1 3 k Hz]R [1 3 k Hz]R
Depending on the temporal resolution, each band can be rectified(indicated by an “R” exponent, i.e. absolute value is computedand low pass filtered at the cutoff frequency F indicated abovethe column)
We estimated NTE in an experiment in one monkey(A98) both during stimulation with a 260 s long movieor during 300 s of stimulus-free (spontaneous) activity.For both stimulation conditions, we used 5 trials, andwe computed NTE estimates for an increasing numberof samples by using only a fraction of data points.
Results are reported in Fig. 2 for the middle-resolution case (frequency cutoff F = 30 Hz). We firsttested the performance of the shuffled bias correctiontechnique (developed and described in the Appendix)in removing the upward bias (Panzeri et al. 2007)of information calculations due to limited sampling.A comparison of the convergence with data size ofthe plug-in estimate (no bias correction) with the biascorrected estimate (Fig. 2) shows that our bias correc-tion clearly helps in reducing the bias in both stimu-lation conditions: the NTE values are clearly reducedfor a number of samples below 10,000, and the bias-corrected NTE reaches a plateau earlier than the non-corrected NTE, especially during spontaneous activity.The number of samples necessary to reach this plateauwas approximately 10,000 samples.
A know source of bias for TE and NTE is thecorrelation between samples close to each other intime (Theiler 1986). To test for this effect, we recom-puted bias-corrected NTEs by taking randomly spacedsamples rather than continuous data points from thebeginning of recordings. We found that the randomspacing estimation needed less data points to convergethan the procedure taking consecutive data points, al-though both procedures converged to the same valuewhen using the whole dataset. An even simpler proce-dure consisting of estimating bias-corrected TE froma down-sampled time series (decimated by a factor5) to reduce time correlation between samples helda faster convergence (Fig. 2). It should be noted thatthis fast convergence of the downsampled estimate wasobtained only using the bias-corrected estimate in com-bination with the downsampling, and was not so fastwhen using either technique in isolation (results notshown). It is also interesting to note that Fig. 2 showsthat NTE estimate converge faster with spontaneousthan with movie data. In our view, the reason is thatthe stationarity condition is likely to be more severelyviolated during movie stimulation (because the stimu-lus drives larger, non-stochastic changes in the networkresponse).
Results were qualitatively similar when consideringhigh and low temporal resolution, and also when con-sidering activity from other frequency bands (data notshown). In sum, all estimators converged to the same

554 J Comput Neurosci (2010) 29:547–566
Fig. 2 Convergence of NTE at middle temporal resolution be-tween MUA activities from pairs of sites recorded from V1 ofmonkey A98. Two stimulus conditions are considered; sponta-neous activity (a) and movie stimulation (b). NTE is estimatedfrom 5 trials of 4 minutes each and the number of samples is mod-ulated by increasing the length of the time interval starting fromstimulus onset. Four estimation procedures are considered. plug-in estimate (black curve) is computed directly from Eq. (5) with-
out any bias correction. bias corrected estimate is computed bysubtracting a bootstrap estimate to cancel the bias (see Eq. (7)).rand. spaced sampl. is a corrected estimate, which takes the sameamount of samples as the previous estimate, but the samples arespaced randomly on the whole time interval of the trials: this is away to destroy time correlation between samples. downsampledis a bias-corrected estimate using time series down-sampled to 60Hz (original sampling frequency is 300 Hz)
value when either 5 trials of spontaneous activity or 5trials with presentation of the same movie were used.However, a much faster convergence to the same as-ymptotic value was obtained by downsampling the timeseries by decimation of a factor 5 combined with ournovel NTE sampling bias correction techniques thatcompensates for the reduced number of samples. Thisallowed a substantial reduction of the computationaltime without deteriorating the sampling properties.Further analysis will thus be done using downsamplingcombined with bias corrections.
4.4 Bootstrap test of significance of causalrelationships above those imposed by a commonstimulus drive
After studying the convergence of the method, we usedit to investigate whether there are significant causal in-teractions between the bands of the cortical extracellu-lar potentials. Based on the above convergence results,in the following we used 5 trials of the same experimentto compute one NTE value (for each particular pairof frequencies and electrodes). When more than fivetrials from the same movie were available, trials foreach movie condition were divided into subgroups of5 consecutive trials, and each subgroup was analyzedseparately. We computed TE between different fre-quency bands as a function of the delay τ used to com-pute the conditioning with respect to the causing signal
(Eq. (4)). Unless otherwise stated, results will be re-ported as average over all animals, recording sites andtrial subgroups.
We first investigated whether the measured causalinteractions between frequency bands were statisticallysignificant. To assess this significance it is necessaryto quantify the distribution of NTE values under anull hypothesis of non-causality H0. We estimated theproperties of this distribution from our data using abootstrap procedure. To compute the distribution un-der H0 of TE from X to Y, we estimated TE from Xto Y∗, where the trials of Y∗ are drawn randomly with-out replacement form the trials of Y. Given that thetrials were several minutes long, and that correlationsbetween neural signals span a much shorter range, thisbootstrapping destroys all causal relationships apartfrom those arising in the movie condition due to a com-mon stimulation history for both neural signals by thesame movie in all different trials. By running 20 timesthe bootstrap procedure for each subset of experiments,we computed the mean and standard deviation of thebootstrapped NTE values and compared to the originalNTE value.
Figure 3 reports, separately for causal interactionscomputed from the same electrode (panel a) and froma different electrode (panel b), the results of this com-parison at high temporal resolution (F = 100 Hz). Atthis resolution, in the case of movie stimulation andfor several pairs of frequency bands of the extracellular
J Comput Neurosci (2010) 29:547–566 555
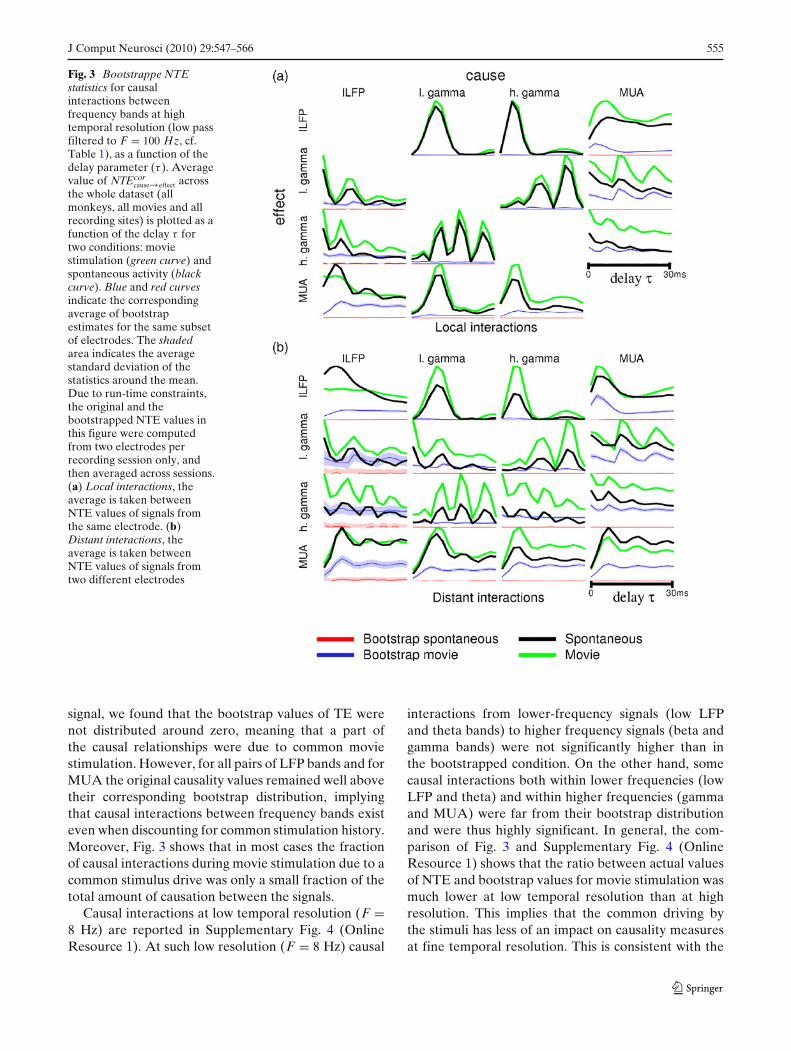
Fig. 3 Bootstrappe NTEstatistics for causalinteractions betweenfrequency bands at hightemporal resolution (low passfiltered to F = 100 Hz, cf.Table 1), as a function of thedelay parameter (τ ). Averagevalue of NTEcor
cause→effect acrossthe whole dataset (allmonkeys, all movies and allrecording sites) is plotted as afunction of the delay τ fortwo conditions: moviestimulation (green curve) andspontaneous activity (blackcurve). Blue and red curvesindicate the correspondingaverage of bootstrapestimates for the same subsetof electrodes. The shadedarea indicates the averagestandard deviation of thestatistics around the mean.Due to run-time constraints,the original and thebootstrapped NTE values inthis figure were computedfrom two electrodes perrecording session only, andthen averaged across sessions.(a) Local interactions, theaverage is taken betweenNTE values of signals fromthe same electrode. (b)Distant interactions, theaverage is taken betweenNTE values of signals fromtwo different electrodes
signal, we found that the bootstrap values of TE werenot distributed around zero, meaning that a part ofthe causal relationships were due to common moviestimulation. However, for all pairs of LFP bands and forMUA the original causality values remained well abovetheir corresponding bootstrap distribution, implyingthat causal interactions between frequency bands existeven when discounting for common stimulation history.Moreover, Fig. 3 shows that in most cases the fractionof causal interactions during movie stimulation due to acommon stimulus drive was only a small fraction of thetotal amount of causation between the signals.
Causal interactions at low temporal resolution (F =8 Hz) are reported in Supplementary Fig. 4 (OnlineResource 1). At such low resolution (F = 8 Hz) causal
interactions from lower-frequency signals (low LFPand theta bands) to higher frequency signals (beta andgamma bands) were not significantly higher than inthe bootstrapped condition. On the other hand, somecausal interactions both within lower frequencies (lowLFP and theta) and within higher frequencies (gammaand MUA) were far from their bootstrap distributionand were thus highly significant. In general, the com-parison of Fig. 3 and Supplementary Fig. 4 (OnlineResource 1) shows that the ratio between actual valuesof NTE and bootstrap values for movie stimulation wasmuch lower at low temporal resolution than at highresolution. This implies that the common driving bythe stimuli has less of an impact on causality measuresat fine temporal resolution. This is consistent with the
556 J Comput Neurosci (2010) 29:547–566
fact that these movies had the most power in the lowfrequency (below 4 Hz) range, which in turn impliesthat the stimulus drive is mostly at low frequencies(Belitski et al. 2008; Montemurro et al. 2008).
Another result worth commenting is the dependencyof NTE value on the time delay τ . In particular, weobserve that NTE values in Fig. 3 for interactions in thegamma bands are oscillatory. We investigated whetherthis shape was specific to our results or a consequenceof the oscillatory nature of signals by a simulation studyfully reported in online resource 1, Section “Two fre-quencies, linear system”. The main result was that theobserved dependence of NTE on the time delay shapecould be obtained for simulated band pass signals, andthe pseudo period was a function of the original periodof the oscillations. As a consequence, maxima in thecurve should not be interpreted as the characteris-tic time delay of the causal interaction. Nevertheless,simulations also showed the maximal amount of NTEover time was related to the actual causal interaction.Therefore we decided to use the latter parameter as thequantification of causality.
4.5 Modulation of causal interactions by the presenceof visual stimuli
The above results indicate that the amount of causal in-teraction is modulated by the presence of visual stimuli.In this subsection, we examine in detail the strength andstatistical significance of these changes of causality dueto the presence of the movie stimuli with respect to thestimulus-free (spontaneous) condition.
To allow correction for multiple comparison, thestatistical significance of the effect of the type of stim-uli (movie versus spontaneous activity) was evaluatedthrough all possible delays and couples of frequencieswith a permutation test. The chosen approach is similarto the one used by Pantazis et al. (2005) for the caseof a T-statistics. In our case, we test the significancelevel of the F-statistics of the stimulus effect in a twoway analysis of variance (ANOVA) using the indepen-dent variables “monkey” and “stimulus”. The distrib-ution of this statistics under the null hypothesis wascomputed as follows: for each monkey, we randomlyshuffled the NTE values corresponding to “movie” and“spontaneous” conditions. Then the maximum of theF-statistics for the stimulus effect through all possibletime delays and couple of frequencies was computed.Using 300 iterations of this shuffling, the distributionof the maximal F-statistics under the null hypothesiswas computed, as well as a threshold correspondingto the desired p-value. Then the F-statistics was evalu-ated on the original dataset and any delay and couple
of frequency corresponding to a TE value above thethreshold was considered significant. This analysis wascarried out at each time resolution considering sepa-rately: causal interactions within the same electrode,and interactions between different recording sites.
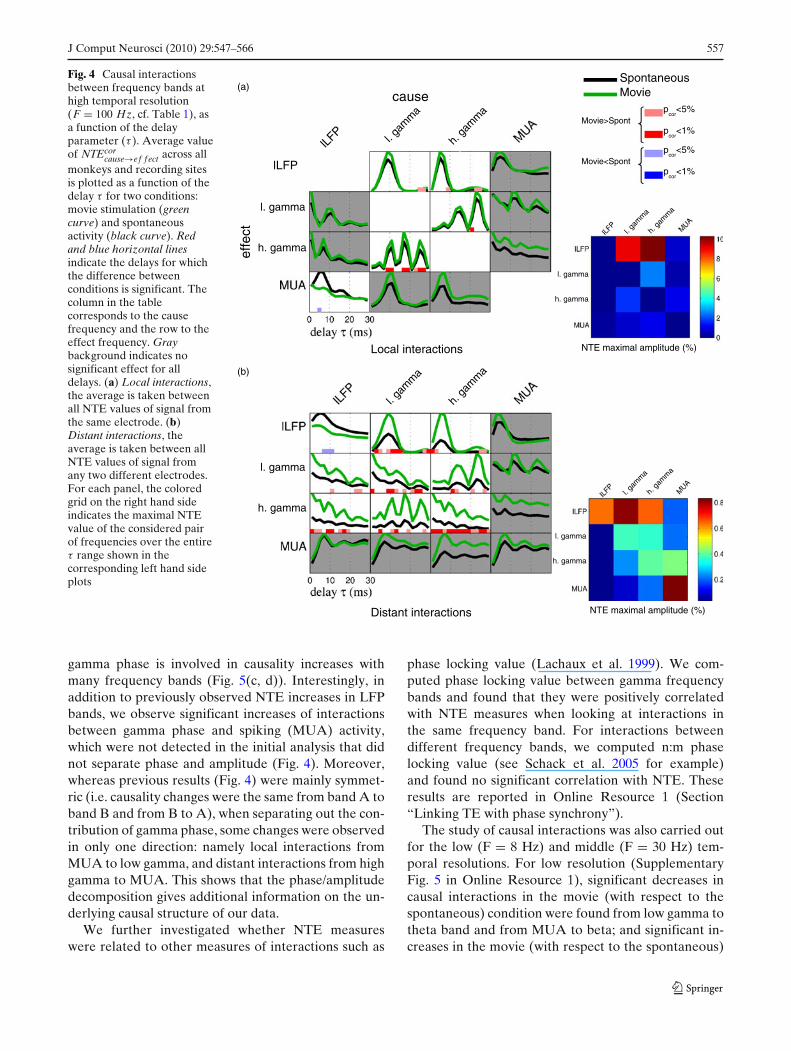
Results for the high temporal resolution case (F =100 Hz) are reported in Fig. 4. For high resolution inter-actions between signals from different electrodes (de-noted as ”distant interaction”, Fig. 4(b)), the amountof causation between all pairs of LFP bands (low LFP,low gamma and high gamma band) during movie stimu-lation was significantly different from that measured inthe absence of stimulation. Except for the low LFP tolow LFP causality, for which movie stimulation inducesa decrease of NTE, all other significant pairs exhib-ited an increase in causality. There were no significantchanges involving MUA spiking activity either as causeor effect. Since the distances between recording siteswere in the range 1–7 mm, this suggests that interac-tions between MUA and LFP bands are more local. Wethus computed local causal interactions within the samerecording site (i.e. causal interactions between signalsform the same electrode; Fig. 4(a)). The NTE valuesobtained for local interactions were several times largerthan those obtained for distant interactions. However,the pattern of NTE changes between movie and sponta-neous condition for local causal interactions (Fig. 4(a))were in most cases consistent with the case of distantinteractions: for example we found that interactionsbetween the two LFP gamma bands, and betweengamma LFPs and lower-frequency LFP bands also in-creased during movie presentation. The most notabledifference between the local and the distant case wasthat in the local case we also found causal interactionsinvolving the MUA band: in particular a decrease oflow-LFP to MUA causation during movie presentation.
Since the gamma bands are not rectified at this hightemporal resolution (see Table 1), the measurements inthis band mix envelope (or power) and phase informa-tion. We thus did further analysis to disambiguate thecausal interactions provided respectively by the phaseand envelope of gamma oscillations. Using the Hilberttransform we computed the instantaneous phase andenvelope associated to oscillations in the low and highgamma bands. These measures were computed respec-tively as modulus and angle of the complex time seriesgiven by the Hilbert transform of the considered signal.Then causal interactions were recomputed using eitherthe envelope or phase time series for the gamma band.Results are reported in Fig. 5. We found (Fig. 5(a, b))that gamma amplitude only accounts for increases incausality from high gamma to high gamma and fromgamma to low LFP. On the other hand, low and high
J Comput Neurosci (2010) 29:547–566 557
Fig. 4 Causal interactionsbetween frequency bands athigh temporal resolution(F = 100 Hz, cf. Table 1), asa function of the delayparameter (τ ). Average valueof NTEcor
cause→ef f ect across allmonkeys and recording sitesis plotted as a function of thedelay τ for two conditions:movie stimulation (greencurve) and spontaneousactivity (black curve). Redand blue horizontal linesindicate the delays for whichthe difference betweenconditions is significant. Thecolumn in the tablecorresponds to the causefrequency and the row to theeffect frequency. Graybackground indicates nosignificant effect for alldelays. (a) Local interactions,the average is taken betweenall NTE values of signal fromthe same electrode. (b)Distant interactions, theaverage is taken between allNTE values of signal fromany two different electrodes.For each panel, the coloredgrid on the right hand sideindicates the maximal NTEvalue of the considered pairof frequencies over the entireτ range shown in thecorresponding left hand sideplots
pcor
<5%
SpontaneousMovie
pcor
<1%
pcor
<1%
pcor
<5%
Movie>Spont
Movie<Spont
(a)
(b)
cause
effe
ct
Local interactions
Distant interactions
NTE maximal amplitude (%)
NTE maximal amplitude (%)
lLFP
lLFP
l. gamma
h. gamma
l. gamma
h. gamma
l. gam
ma
h. g
amm
a
l. gamma
h. gamma
l. gam
ma
h. g
amm
a
l. gamma
h. gamma
l. gam
ma
h. g
amm
a
l. gam
ma
h. g
amm
a
gamma phase is involved in causality increases withmany frequency bands (Fig. 5(c, d)). Interestingly, inaddition to previously observed NTE increases in LFPbands, we observe significant increases of interactionsbetween gamma phase and spiking (MUA) activity,which were not detected in the initial analysis that didnot separate phase and amplitude (Fig. 4). Moreover,whereas previous results (Fig. 4) were mainly symmet-ric (i.e. causality changes were the same from band A toband B and from B to A), when separating out the con-tribution of gamma phase, some changes were observedin only one direction: namely local interactions fromMUA to low gamma, and distant interactions from highgamma to MUA. This shows that the phase/amplitudedecomposition gives additional information on the un-derlying causal structure of our data.
We further investigated whether NTE measureswere related to other measures of interactions such as
phase locking value (Lachaux et al. 1999). We com-puted phase locking value between gamma frequencybands and found that they were positively correlatedwith NTE measures when looking at interactions inthe same frequency band. For interactions betweendifferent frequency bands, we computed n:m phaselocking value (see Schack et al. 2005 for example)and found no significant correlation with NTE. Theseresults are reported in Online Resource 1 (Section“Linking TE with phase synchrony”).
The study of causal interactions was also carried outfor the low (F = 8 Hz) and middle (F = 30 Hz) tem-poral resolutions. For low resolution (SupplementaryFig. 5 in Online Resource 1), significant decreases incausal interactions in the movie (with respect to thespontaneous) condition were found from low gamma totheta band and from MUA to beta; and significant in-creases in the movie (with respect to the spontaneous)

558 J Comput Neurosci (2010) 29:547–566
NTE maximal amplitude (%)
NTE maximal amplitude (%)
NTE maximal amplitude (%)
NTE maximal amplitude (%)
pcor
<5%
SpontaneousMovie
pcor
<1%
pcor
<1%
pcor
<5%
Movie>Spont
Movie<Spont
lLFP
MUA
lLFP
MUA
lLFP
MUA
lLFP
MUA
lLFP
MUA
lLFP
MUA
lLFP
MUA
lLFP
MUA
l. gam
ma
h. g
amm
a
l. gam
ma
h. g
amm
a
l. gam
ma
h. g
amm
a
l. gam
ma
h. g
amm
a
h. gamma
l. gamma
h. gamma
l. gamma
h. gamma
l. gamma
h. gamma
l. gamma
cause
effe
ct
cause
effe
ctcause
effe
ctcause
effe
ct(a) gamma envelope, local interactions (c) gamma phase, local interactions
(d) gamma phase, distant interactions(b) gamma envelope, distant interactions
l. gam
ma
h. g
amm
a
MUA
lLFP
l. gamma
h. gamma
lLFP
MUA
l. gam
ma
h. g
amm
a
MUA
lLFP
l. gamma
h. gamma
lLFP
MUA
l. gam
ma
h. g
amm
a
MUA
lLFP
l. gamma
h. gamma
lLFP
MUA
l. gam
ma
h. g
amm
a
MUA
lLFP
l. gamma
h. gamma
lLFP
MUA
Fig. 5 Causal interactions with phase/envelope of the gammaband at high temporal resolution (F = 100 Hz, cf. Table 1),as a function of the delay parameter (τ ). Average value ofNTEcor
cause→eff ect across all monkeys and recording sites is plottedas a function of the delay τ for two conditions: movie stimulation(green curve) and spontaneous activity (black curve). Red andblue horizontal lines indicate the delays for which the differencebetween conditions is significant. The column in the table cor-responds to the cause frequency and the row to the effect fre-
quency. (a) Average NTE for the envelope of gamma oscillations(local interactions). (b) Average NTE for the envelope of gammaoscillations (distant interactions). (c) Average NTE for the phaseof gamma oscillations (local interactions). (d) Average NTE forthe phase of gamma oscillations (distant interactions). For eachpanel, the colored grid on the bottom right hand side indicates themaximal NTE value of the considered pair of frequencies overthe entire τ range shown in the corresponding left hand side plots.Gray background indicates no significant effect for all delays
condition were found within the gamma bands. Themagnitude of the estimated NTE was highly depen-dent on the considered couple of frequencies and wasmaximal for low frequency (theta) and high frequency(gamma, MUA) bands. In particular, at low temporalresolution, cross-interactions between low and high fre-quencies have clearly lower NTE magnitudes. Valueswere also higher when considering local interactionsbetween signals from the same electrode (panel a) com-pared to distant interactions (panel b). The shape ofNTE curves as a function of delay exhibit dissimilarities
depending on the considered couple of frequencies.NTE computed between rectified frequencies (gammaand MUA) tend to be small for small values of τ , toincrease rapidly to a maximal value and then slowlydecrease. Considering causality measures from low fre-quency bands to themselves (on the diagonal in thearrays), NTE values are progressively decreasing as afunction of the delay τ . At middle temporal resolutions(Supplementary Fig. 5 in Online Resource 1) almost nointeractions are significant, thus the following analysiswill focus on the two other time resolutions.
J Comput Neurosci (2010) 29:547–566 559
4.6 Net causality
The results presented above report that causality be-tween two signals is often found in both directions.These results are difficult to interpret. In particular,it is legitimate to infer a leading causality directiononly if causality is stronger in one direction than inthe other. If causality is similar in magnitude in bothdirections, then the results are better interpretable interms of coherency between the two signals. To investi-gate whether there was a leading direction of causalityamong different frequency bands, we therefore com-puted net NTE values as the difference of NTE valuesbetween the two directions �NTE(1, 2) = NTE(1 →2) − NTE(2 → 1).
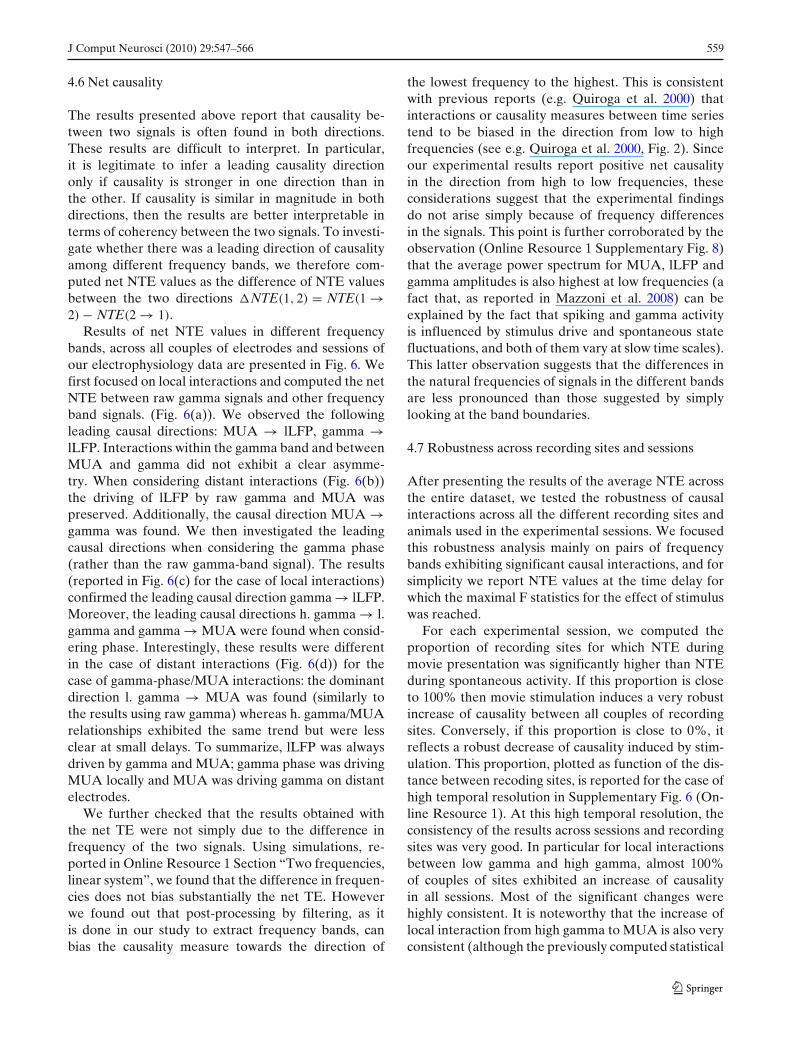
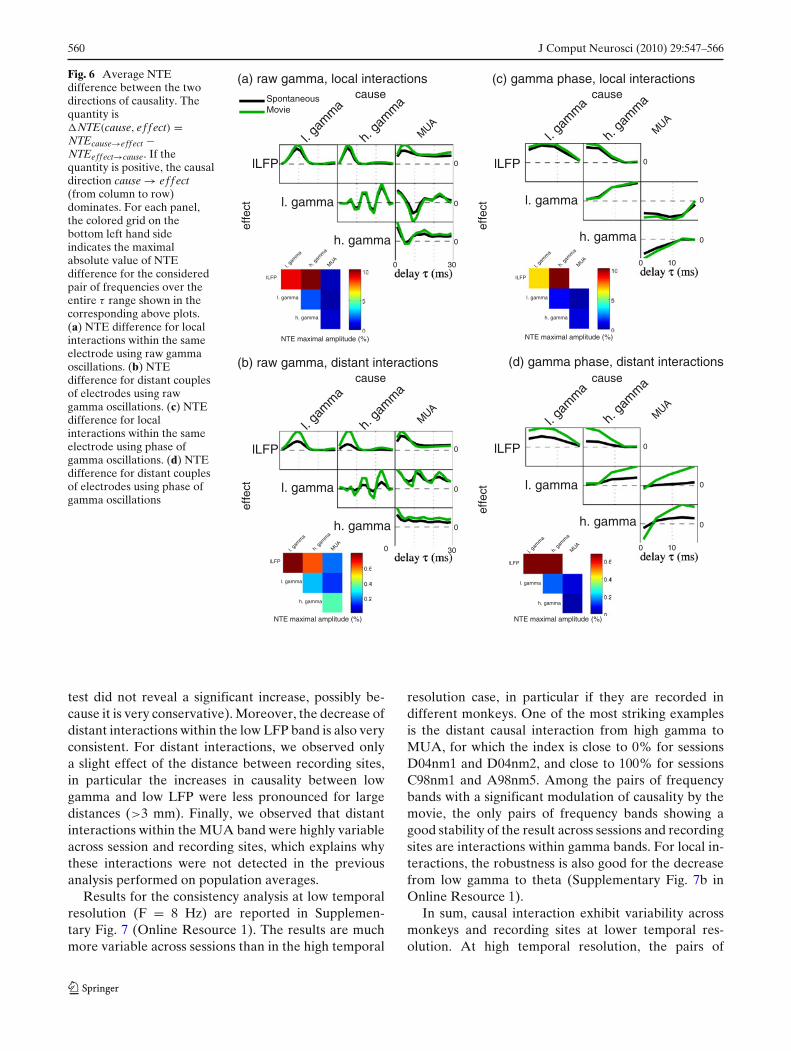
Results of net NTE values in different frequencybands, across all couples of electrodes and sessions ofour electrophysiology data are presented in Fig. 6. Wefirst focused on local interactions and computed the netNTE between raw gamma signals and other frequencyband signals. (Fig. 6(a)). We observed the followingleading causal directions: MUA → lLFP, gamma →lLFP. Interactions within the gamma band and betweenMUA and gamma did not exhibit a clear asymme-try. When considering distant interactions (Fig. 6(b))the driving of lLFP by raw gamma and MUA waspreserved. Additionally, the causal direction MUA →gamma was found. We then investigated the leadingcausal directions when considering the gamma phase(rather than the raw gamma-band signal). The results(reported in Fig. 6(c) for the case of local interactions)confirmed the leading causal direction gamma → lLFP.Moreover, the leading causal directions h. gamma → l.gamma and gamma → MUA were found when consid-ering phase. Interestingly, these results were differentin the case of distant interactions (Fig. 6(d)) for thecase of gamma-phase/MUA interactions: the dominantdirection l. gamma → MUA was found (similarly tothe results using raw gamma) whereas h. gamma/MUArelationships exhibited the same trend but were lessclear at small delays. To summarize, lLFP was alwaysdriven by gamma and MUA; gamma phase was drivingMUA locally and MUA was driving gamma on distantelectrodes.
We further checked that the results obtained withthe net TE were not simply due to the difference infrequency of the two signals. Using simulations, re-ported in Online Resource 1 Section “Two frequencies,linear system”, we found that the difference in frequen-cies does not bias substantially the net TE. Howeverwe found out that post-processing by filtering, as itis done in our study to extract frequency bands, canbias the causality measure towards the direction of
the lowest frequency to the highest. This is consistentwith previous reports (e.g. Quiroga et al. 2000) thatinteractions or causality measures between time seriestend to be biased in the direction from low to highfrequencies (see e.g. Quiroga et al. 2000, Fig. 2). Sinceour experimental results report positive net causalityin the direction from high to low frequencies, theseconsiderations suggest that the experimental findingsdo not arise simply because of frequency differencesin the signals. This point is further corroborated by theobservation (Online Resource 1 Supplementary Fig. 8)that the average power spectrum for MUA, lLFP andgamma amplitudes is also highest at low frequencies (afact that, as reported in Mazzoni et al. 2008) can beexplained by the fact that spiking and gamma activityis influenced by stimulus drive and spontaneous statefluctuations, and both of them vary at slow time scales).This latter observation suggests that the differences inthe natural frequencies of signals in the different bandsare less pronounced than those suggested by simplylooking at the band boundaries.
4.7 Robustness across recording sites and sessions
After presenting the results of the average NTE acrossthe entire dataset, we tested the robustness of causalinteractions across all the different recording sites andanimals used in the experimental sessions. We focusedthis robustness analysis mainly on pairs of frequencybands exhibiting significant causal interactions, and forsimplicity we report NTE values at the time delay forwhich the maximal F statistics for the effect of stimuluswas reached.
For each experimental session, we computed theproportion of recording sites for which NTE duringmovie presentation was significantly higher than NTEduring spontaneous activity. If this proportion is closeto 100% then movie stimulation induces a very robustincrease of causality between all couples of recordingsites. Conversely, if this proportion is close to 0%, itreflects a robust decrease of causality induced by stim-ulation. This proportion, plotted as function of the dis-tance between recoding sites, is reported for the case ofhigh temporal resolution in Supplementary Fig. 6 (On-line Resource 1). At this high temporal resolution, theconsistency of the results across sessions and recordingsites was very good. In particular for local interactionsbetween low gamma and high gamma, almost 100%of couples of sites exhibited an increase of causalityin all sessions. Most of the significant changes werehighly consistent. It is noteworthy that the increase oflocal interaction from high gamma to MUA is also veryconsistent (although the previously computed statistical
560 J Comput Neurosci (2010) 29:547–566
Fig. 6 Average NTEdifference between the twodirections of causality. Thequantity is�NTE(cause, ef f ect) =NTEcause→eff ect −NTEeff ect→cause. If thequantity is positive, the causaldirection cause → ef f ect(from column to row)dominates. For each panel,the colored grid on thebottom left hand sideindicates the maximalabsolute value of NTEdifference for the consideredpair of frequencies over theentire τ range shown in thecorresponding above plots.(a) NTE difference for localinteractions within the sameelectrode using raw gammaoscillations. (b) NTEdifference for distant couplesof electrodes using rawgamma oscillations. (c) NTEdifference for localinteractions within the sameelectrode using phase ofgamma oscillations. (d) NTEdifference for distant couplesof electrodes using phase ofgamma oscillations
(a) raw gamma, local interactions
NTE maximal amplitude (%) NTE maximal amplitude (%)
(c) gamma phase, local interactions
lLFP
MUA
lLFP
h. gamma
l. gamma
h. gamma
l. gamma
0 30 0 10
0
0
0 0
0
0
cause
effe
ct
l. gam
ma
h. g
amm
a
l. gam
ma
h. g
amm
a
l. gam
ma
h. g
amm
a
(d) gamma phase, distant interactions
lLFP
MUA
h. gamma
l. gamma
0 10
0
0
0
l. gam
ma
h. g
amm
a
MUA
lLFP
l. gamma
h. gamma
l. gam
ma
h. g
amm
a
MUA
lLFP
l. gamma
h. gamma
NTE maximal amplitude (%)
SpontaneousMovie
MUA
l. gam
ma
h. g
amm
a
MUA
lLFP
l. gamma
h. gamma
l. gam
ma
h. g
amm
a
MUA
lLFP
l. gamma
h. gamma
NTE maximal amplitude (%)
(b) raw gamma, distant interactions
lLFP
h. gamma
l. gamma
l. gam
ma
h. g
amm
a
MUA
30
0
0
0
0
cause
effe
ct
cause
effe
ct
cause
effe
ct
test did not reveal a significant increase, possibly be-cause it is very conservative). Moreover, the decrease ofdistant interactions within the low LFP band is also veryconsistent. For distant interactions, we observed onlya slight effect of the distance between recording sites,in particular the increases in causality between lowgamma and low LFP were less pronounced for largedistances (>3 mm). Finally, we observed that distantinteractions within the MUA band were highly variableacross session and recording sites, which explains whythese interactions were not detected in the previousanalysis performed on population averages.
Results for the consistency analysis at low temporalresolution (F = 8 Hz) are reported in Supplemen-tary Fig. 7 (Online Resource 1). The results are muchmore variable across sessions than in the high temporal
resolution case, in particular if they are recorded indifferent monkeys. One of the most striking examplesis the distant causal interaction from high gamma toMUA, for which the index is close to 0% for sessionsD04nm1 and D04nm2, and close to 100% for sessionsC98nm1 and A98nm5. Among the pairs of frequencybands with a significant modulation of causality by themovie, the only pairs of frequency bands showing agood stability of the result across sessions and recordingsites are interactions within gamma bands. For local in-teractions, the robustness is also good for the decreasefrom low gamma to theta (Supplementary Fig. 7b inOnline Resource 1).
In sum, causal interaction exhibit variability acrossmonkeys and recording sites at lower temporal res-olution. At high temporal resolution, the pairs of

J Comput Neurosci (2010) 29:547–566 561
frequencies showing significant modulation of the NTEby the movie stimulation at the level of populationaverage also exhibit a very good robustness of thisresult across sessions and animals.
4.8 Effect of the distance between sites
We finally investigated the effect of interelectrode dis-tance on TE. We investigated this by computing NTE athigh temporal resolution and by plotting the joint distri-bution of these NTE values at different interelectrodedistances. Smoothed histograms of this distribution areshown on Supplementary Fig. 9 (Online Resource 1)for the most relevant LFP frequency bands. For allconsidered LFP bands, and both during spontaneousactivity and during visual stimulation with movies, NTEvalues remained high (more than 70% of their maximalvalue, which was observed when computing them from1 mm distant electrodes) for intelectrode distances upto 3 mm, and then it decayed rapidly to very lowNTE values (<30% of the maximum) for interelectrodedistances larger than 5 mm.
5 Discussion
Over the last few years, several theoretical and ex-perimental studies have investigated the origin andpotential functional meaning of the rich structure offrequencies present in the time series of extracellularpotentials (Buzsáki 2006; Bedard et al. 2006; Pettersenand Einevoll 2008; Mazzoni et al. 2008; Belitski et al.2008; Roopun et al. 2008; Kayser et al. 2009; Nadasdy2009). Here, we aimed at contributing to the under-standing of the relationships between the differentfrequency components of the extracellular signal bydeveloping a novel, fast and data robust procedureto compute TE between time series of bandpassedneurophysiological signals in various frequency bands.Although it is possible that causality is to some ex-tent a wide-band phenomenon (Nolte et al. 2008), ourapproach considering the causal relationship betweenseparate frequency bands in the extracellular signalis justified and motivated by the bulk of neurophys-iological evidence linking different frequency rangesto different functional states and neural phenomena(Buzsáki and Draguhn 2004; Buzsáki 2006).
We illustrated our technique by computing and com-paring causal interactions between different frequencybands of the extracellular signal recorded from primateV1 during spontaneous activity or during binocularvisual stimulation with naturalistic movies. Our resultsindividuated causality changes during visual stimula-
tion, which involved specific time scales and frequencybands. The significance of the methods developed hereand of the analysis of the neurophysiological data isdiscussed next.
5.1 Methods for computing TE and their convergenceproperties
One of the main contributions of our study was to intro-duce and develop a novel procedure to computing NTEbetween frequency bands and recording sites of theextracellular signal recorded intracranially with micro-electrodes. This technique built on previous progress incomputing the sensory information carried by LFP andMUA bands (Belitski et al. 2008; Montemurro et al.2008; Magri et al. 2009), and was based on discretizationof the signal, on corrections for the bias due to lim-ited sampling in information measures (Panzeri et al.2007), and on downsampling to achieve at the sametime a faster speed of computation and a reductionof potential artifacts due to correlation between suc-cessive time samples (Theiler 1986). We investigatedthe convergence properties of the measure with thesample size and found that this method held excellentconverge properties. This fast convergence was crucialin allowing us to estimate reliably NTE values and tocompare them across a large dataset and across severalfrequency bands and time scales within a reasonablecomputational time. Because of these features, ourtechnique could become valuable to the neurophysiol-ogy community for further studies of causation.
Our analysis methods depart from that used in aprevious attempt to estimate TE from intracranialrecordings, which used an approach based on approx-imating differential entropies using KDE (Schreiber2000; Chavez et al. 2003). One reason why we couldnot use KDE (or NND) techniques in the present studywas that, despite their undoubted power and appeal(Grassberger 1988; Kraskov et al. 2004), they were toocomputationally expensive to be run on such a largedataset as ours. However, an important topic of futuremethodological research is to compare in detail therelative advantages of KDE/NND and discretizationmethods with bias corrections in computing informa-tion theoretic quantities form analog neural signals,and in trying to integrate the relative strengths of bothapproaches. In the neurophysiology domain, detailedcomparisons between KDE/NND methods and dis-cretization methods based on up-to-date bias correctionprocedures were so far only performed on spike trains(Nelken et al. 2005) and showed that NND techniquesrequired a large amount of neural data to convergeunless the underlying probability distributions were
562 J Comput Neurosci (2010) 29:547–566
sufficiently smooth. However, it is quite conceivablethat distributions of analog neural signals are muchsmoother than those of spike trains (Magri et al. 2009),and so KDE methods may give a faster convergence onthese datasets. Understanding the relative advantagesof both methods, and producing a set of fast publiclyavailable routines to compute them would greatly in-crease the tools available to experimental laboratoriesto investigate the chain of causal processes in the ner-vous system.
5.2 Causality depends on the temporal resolutionat which it is considered
Since the time scale of causal interactions was notknown, we investigated causal relationships at threedifferent temporal resolutions (low, middle and high)by low pass filtering the signals at 8 Hz, 30 Hz and 100Hz respectively. Significant changes in TE induced byvisual stimulation were mainly observed at low and highresolution. However, the causations observed at hightemporal resolution were stronger and more robustacross sessions than those observed at low resolution.We therefore focus the rest of this discussion on causalinteractions revealed at high temporal resolution.
5.3 Significance and directionality of causalinteractions
One of the main results of our analysis was that weestablished the presence of several highly significantcausal relationships between specific frequency bands.We established significance of causal interactions bymeans of a bootstrap test, which left only causationsdue to common stimulation history. At high tempo-ral resolutions, the NTE values obtained after boot-strapping were typically much smaller than the NTEvalues recorded from the non-bootstrapped data. Thesignificance of these results is that they suggest thatthe causations we observed were due only in smallpart to the effect of common stimulation history, andis important given the fact that techniques to eliminateconfounders in causal inference (Pearl 2000) are welldeveloped for linear measures of causality (Guo et al.2008a; Chen et al. 2006), but are very difficult to handlein the non-linear case. The study of how to handle themin nonlinear situations is an important topic for futureanalytical research.
At a high time resolution, there were highly sig-nificant robust interactions between virtually all fre-quency bands considered, both for signals from thesame electrode or for different electrodes. The mostinteresting and robust causality relationships were
those involving the gamma band. Gamma band had astronger causal effect of all LFP bands at lower fre-quencies during movie stimulation than during sponta-neous activity. These TE changes were significant forvery short time delays of a few milliseconds. Theoreti-cal and experimental results relate gamma oscillationsto the activity of recurrent local microcircuits of in-hibitory and excitatory neurons (Mazzoni et al. 2008;Brunel and Wang 2003; Cardin et al. 2009). The in-creases in the causal effect that the gamma band exertson other LFP bands suggests that the local recurrentloops of inhibitory and excitatory circuitry are moreprominently activated and play a more central role incontrolling the rest of the network activity during theprocessing of visual stimuli than during spontaneousactivity.
Another interesting result afforded by the high tem-poral resolution analysis was that at this resolutionthe gamma activity could be quantified without rec-tification, and this allowed us to disambiguate thecausal effects due to gamma phase from those due togamma amplitude. We found that, although gammaamplitude played a role in causing a number of otherLFP bands, gamma phase had a much prominent rolein increasing causation with other signals during visualstimulation, in particular with MUA activity originatingfrom different electrodes. This results is in agreementwith, and extends to the non-linear causal analysis do-main, previous seminal findings obtained using linearcorrelation analysis to show that gamma phase mod-ulates the communication between neuronal groups(Womelsdorf et al. 2007). Interestingly, previous stud-ies on the same dataset that we analyzed here showedthat gamma phase was not reliably locked to the stimu-lus (Montemurro et al. 2008). The findings that gammaphase is crucially involved in controlling and causingspiking activity in other locations suggests that onereason why it may be functionally convenient not tolock gamma phase to the stimulus time course is thatin this way gamma phase is left free to vary acrossregions receiving the same stimulus dynamics and thustune the amount of communication between neuronalgroups depending on other needs.
The finding of significant interactions at high tempo-ral resolution between frequency bands in both direc-tions raised the question of whether these results implycoherency between the bands or whether it is possibleto infer a leading direction of causality between bands.We addressed this problem by considering the netNTE (defined as the difference of NTE values betweenthe two directions). This calculation led to the findingthat there is indeed a dominant direction of causality,mainly in the direction from MUA or gamma frequency
J Comput Neurosci (2010) 29:547–566 563
band signals to lower frequency signals. Moreover, wefound that the dominant direction of causation be-tween gamma and MUA signals depended upon thespatial scale considered. In particular, there was a same-electrode driving of MUA by gamma phase and across-electrode driving of gamma by MUA. This, in ourview, gives fresh insights on the hierarchical set of cor-relations commonly found between lower and higherfrequency rhythms of cortical activity (Roopun et al.2008), and suggest that these hierarchical correlationsare largely caused by the faster rhythms rather by theslower rhythms.
We further studied systematically how the amount ofcausation of frequency bands and their changes with thestimulation conditions varied with the inter-electrodedistance, in the range of few millimeters. Robust in-creases in causal interactions during movie stimulationwere found in the gamma band between recording sitesseparated from several millimeters in the primary visualcortex. However, such robust changes across distantelectrode were not found when considering MUA spik-ing activity. Larger spatial correlation between gammaband activities compared to spiking have already beenreported (Berens et al. 2008). It has been shown theimpedance of extracellular tissue is independent ofthe frequency (Logothetis et al. 2007). Thus the largedistance interactions observed in the gamma band cannot be explained by propagation in the tissue, but resultfrom network activities, possibly mediated by lateralconnections, which are known to spread on severalmillimeters (Stettler et al. 2002).
Long range causal interactions between differentareas have also been investigated in the literature usingFrequency domain Granger causality (Brovelli et al.2004; Guo et al. 2008b). The results of these previ-ous studies mainly reported significant interactions inlow frequency bands (theta and beta bands), whichcontrasts with our finding of a central role for thegamma band. This difference may be accounted for bythe differences in the considered spatial scale of theinteractions: we are considering interactions within asame area at a maximal distance of few millimeterswhereas previous studies consider interactions betweenmore distant brain areas.
Acknowledgements We are grateful to J. Martinerie, M.Chavez, D. Janzing, Y. Murayama, C. Kayser, N. Ludtke,A. Belitski and C. Magri for many useful discussions andinteractions.
Open Access This article is distributed under the terms of theCreative Commons Attribution Noncommercial License whichpermits any noncommercial use, distribution, and reproductionin any medium, provided the original author(s) and source arecredited.
Appendix: Shuffling correction of the limited samplingbias of TE
In this appendix, we explain the so called “shufflingcorrection procedure” that we developed to reduce thesampling bias affecting transfer entropies.
Sampling bias arises because the probabilitiesneeded to compute the entropies in the TE equations(4) and (5) are not known but have to be measuredexperimentally from the limited number of data pointsin which the neurophysiology or imaging data wererecorded. The estimated probabilities are subject tostatistical error and necessarily fluctuate around theirtrue values. Since the information theoretic probabilityfunctional is non-linear, the finite sampling fluctuationslead to a systematic error (bias) in the estimation of theprobability functional (Panzeri et al. 2007). This biasis negative when considering entropies and is approx-imately directly proportional to the cardinality of theprobability space to be sampled and inversely propor-tional to the number of available data points (Panzeriet al. 2007). We have previously proposed a numberof algorithms for the elimination of the bias of mu-tual information between stimuli and neural responses(Montemurro et al. 2007; Panzeri et al. 2007). Here weextend this work to correct for the bias of TE.
In the following, we will write Q for the plug-in es-timate of the quantity Q (computed from the empiricalprobability distribution of the binned data). We firstrewrite TE as:
TY→X = H(Xt|Xt−τ ) + H(Yt−τ |Xt−τ )
− H((Xt, Yt−τ )|Xt−τ ) (6)
When computing the plug-in estimate TY→X from Eq.(6), the term with the worst sampling behavior andthe most biased is H((Xt, Yt−τ )|Xt−τ ), because (unlikethe other two terms in the r.h.s. of Eq. (6)) it needsestimation of a bivariate conditional probability dis-tribution. Thus the bias of H((Xt, Yt−τ )|Xt−τ ) (whichis negative) dominates the bias of the TE, and as aresult TE is biased upward due to limited sampling.Fortunately, the bias of multivariate entropies such asH((Xt, Yt−τ )|Xt−τ ) (and thus that of TE) can be greatlyreduced at the source by the techniques of Montemurroet al. (2007) and Panzeri et al. (2007). In a nutshell,the idea is to rewrite TE by subtracting and adding tothe estimation of TE two terms with exactly the sameasymptotic values for large number of trials, but witha bias for finite number of trials, which cancels outthe one of the multivariate entropy causing the mostsampling problems. In this way, this corrected estimate
564 J Comput Neurosci (2010) 29:547–566
converges faster to the true values with the data size.This is done by estimating Tsh
Y→X through the followingplug-in shuffled estimate:
TshY→X = H(Xt|Xt−τ ) + H(Yt−τ |Xt−τ )
− H((Xt, Yt−τ )|Xt−τ ) − Hind((Xt, Yt−τ )|Xt−τ )
+ Hsh((Xt, Yt−τ )|Xt−τ ) (7)
where
Hind((Xt, Yt−τ )|Xt−τ ) = H(Xt|Xt−τ ) + H(Yt−τ |Xt−τ )
is the joint conditional entropy under the assumptionof conditional independence of Xt, Yt−τ given Xt−τ .The latter assumption makes it possible to rewriteHind((Xt, Yt−τ )|Xt−τ ) as a sum of entropies of univari-ate conditional marginal distributions, which in turnmeans that this term has a very little bias comparedto that of the bivariate entropy H((Xt, Yt−τ )|Xt−τ ).The term Hsh((Xt, Yt−τ )|Xt−τ ) is the bivariate en-tropy computed by shuffling all the samples of Yt−τ
corresponding to a particular value of Xt−τ , whilesamples from Xt values remain unchanged. This isequivalent to sample data from a distribution with thesame marginal conditional probabilities p(Xt|Xt−τ ),p(Yt−τ |Xt−τ ), but where the conditional independenceassumption mentioned above holds. As shown inMontemurro et al. (2007), for a large number of sam-ples, this shuffled entropy Hsh((Xt, Yt−τ )|Xt−τ ) has as-ymptotically the same value as Hsh((Xt, Yt−τ )|Xt−τ ),but its bias is similar in magnitude and scaling to thatof H((Xt, Yt−τ )|Xt−τ ) (because they are both bivariateand computed form the same number of trials). Thusadding Hsh((Xt, Yt−τ )|Xt−τ ) − Hind((Xt, Yt−τ )|Xt−τ ) tothe TE plug-in computation does not change its asymp-totic value for infinite number of trials, but dramaticallyimproves its bias property for finite datasets becauseit makes it similar to that of univariate conditionalentropies. Therefore in the paper we used Tsh
Y→X of Eq.(7) as the bias corrected TE estimate.
We note that, in agreement with the results ofPanzeri et al. (2007), subtraction of further bias correc-tions techniques (such as those in Panzeri and Treves1996; Strong et al. 1998) did improve slightly the con-vergence of the estimates with the dataset (results notshown). However, they also added a very significantincrease computational time with a relatively little con-vergence benefit, and therefore we did not use theseadditional bias corrections in the extensive analysis ofthe neurophysiological dataset.
References
Ancona, N., & Stramaglia, S. (2006). An invariance property ofpredictors in kernel-induced hypothesis spaces. Neural Com-putation, 18, 749–759.
Ancona, N., Marinazzo, D., & Stramaglia, S. (2004). Radial basisfunction approach to nonlinear granger causality of timeseries. Physical Review E, 70, 056,221
Baccalá, L. A., & Sameshima, K. (2001). Partial directed coher-ence: A new concept in neural structure determination. BiolCybernetics, 84, 463–474.
Bedard, C., Kroger, H., & Destexhe, A. (2006). Model of low-pass filtering of local field potentials in brain tissue. PhysicalReview E, 73, 051,911.
Belitski, A., Gretton, A., Magri, C., Murayama, Y., Montemurro.M. A., Logothetis, N. K., et al. (2008). Low-frequency localfield potentials and spikes in primary visual cortex conveyindependent visual information. Journal of Neuroscience, 28,5696–5709.
Berens, P., Keliris, G. A., Ecker, A. S., Logothetis, N. K., &Tolias, A. S. (2008). Comparing the feature selectivity of thegamma-band of the local field potential and the underlyingspiking activity in primate visual cortex. Frontiers in SystemsNeuroscience, 2, 2.
Bernasconi, C., von Stein, A., Chiang. C., & König, P. (2000). Bi-directional interactions between visual areas in the awakebehaving cat. Neuroreport, 11, 689–692.
Bragin, A., Engel, J., Wilson, C. L., Fried, I., & Buzsáki,G. (1999). High-frequency oscillations in human brain.Hippocampus, 9, 137–142.
Bressler, S. L., Richter, C. G., Chen, Y. H., & Ding, M. (2007).Cortical functional network organization from autoregres-sive modeling of local field potential oscillations. Statisticsin Medicine, 26, 3875–3885.
Brovelli, A., Ding, M., Ledberg, A., Chen, Y., Nakamura, R., &Bressler, S. L. (2004). Beta oscillations in a large-scale sen-sorimotor cortical network: Directional influences revealedby granger causality. Proceedings of the National Academyof Science USA, 101, 9849–9854.
Brunel, N., & Wang, X. J. (2003). What determines the frequencyof fast network oscillations with irregular neural discharges?I. Synaptic dynamics and excitation-inhibition balance. Jour-nal of Neurophysiology, 90, 415–430.
Buzsáki, G. (2002). Theta oscillations in the hippocampus.Neuron, 33, 325–340.
Buzsáki, G. (2006). Rhythms of the brain. Oxford UniversityPress.
Buzsáki, G., & Draguhn, A. (2004) Neuronal oscillations in cor-tical networks. Science, 304, 1926–1929.
Canolty, R. T., Edwards, E., Dalal, S. S., Soltani, M., Nagarajan,S. S., Kirsch, H. E., et al. (2006). High gamma power is phase-locked to theta oscillations in human neocortex. Science, 313,1626–1628.
Cardin, J. A., Carlén, M., Meletis, K., Knoblich, U., Zhang, F.,Deisseroth, K., et al. (2009). Driving fast-spiking cells in-duces gamma rhythm and controls sensory responses. Na-ture, 459, 663–667.
Chavez, M., Martinerie, J., & Le Van Quyen, M. (2003). Statisti-cal assessment of nonlinear causality: Application to epilep-tic EEG signals. Journal of Neuroscience Methods, 124,113–128.
Chen, Y., Bressler, S. L., & Ding, M. (2006). Frequency decom-position of conditional granger causality and application tomultivariate neural field potential data. Journal of Neuro-science Methods, 150, 228–237.
J Comput Neurosci (2010) 29:547–566 565
da Silva, F. L., Pijn, J. P., & Boeijinga, P. (1989). Interdependenceof EEG signals: Linear vs. nonlinear associations and the sig-nificance of time delays and phase shifts. Brain Topography,2, 9–18.
Destexhe, A., & Sejnowski, T. J. (2003). Interactions betweenmembrane conductances underlying thalamocortical slow-wave oscillations. Physiological Reviews, 83, 1401–1453.
Eckhorn, R., & Thomas, U. (1993). A new method for the inser-tion of multiple microprobes into neural and muscular tissue,including fiber electrodes, fine wires, needles and microsen-sors. Journal of Neuroscience Methods, 49(3), 175–179.
Gail, A., Brinksmeyer, H., & Eckhorn, R. (2004). Perception-related modulations of local field potential power and co-herence in primary visual cortex of awake monkey duringbinocular rivalry. Cerebral Cortex, 14, 300–313.
Geweke, J. (1982). Measurement of linear dependence and feed-back between multiple time series. Journal of the AmericanStatistical Association, 77, 304–313.
Gourévitch, B., & Eggermont, J. J. (2007). Evaluating informa-tion transfer between auditory cortical neurons. Journal ofNeurophysiology, 97, 2533–2543.
Granger, C. (1969). Investigating causal relations by econometricmodels and cross-spectral methods. Econometrica, 37, 424–438.
Grassberger, P. (1988). Finite sample corrections to entropy anddimension estimates. Physics Letters A, 128, 369–373.
Gray, C. M., König, P., Engel, A. K., & Singer, W. (1989). Oscil-latory responses in cat visual cortex exhibit inter-columnarsynchronization which reflects global stimulus properties.Nature, 338, 334–337.
Guo, S., Seth, A. K., Kendrick, K. M., Zhou, C., & Feng, J.(2008a). Partial granger causality–eliminating exogenous in-puts and latent variables. Journal of Neuroscience Methods,172, 79–93.
Guo, S., Wu, J., Ding, M., & Feng, J. (2008b). Uncovering in-teractions in the frequency domain. PLoS ComputationalBiology, 4, e1000087.
Harada, Y., & Takahashi, T. (1983). The calcium componentof the action potential in spinal motoneurones of the rat.Journal of physiology, 335, 89–100.
Hinrichs, H., Heinze, H., & Schoenfeld, M. (2006). Causal visualinteractions as revealed by an information theoretic measureand fMRI. NeuroImage, 31, 1051–1060.
Hlavackova-Schindler, K., Palus, M., Vejmelka, M., &Bhattacharya, J. (2007). Causality detection based oninformation-theoretic approaches in time series analysis.Physics Reports, 441, 1–46.
Juergens, E., Guettler, A., & Eckhorn, R. (1999). Visual stimula-tion elicits locked and induced gamma oscillations in mon-key intracortical- and EEG-potentials, but not in humanEEG. Experimental Brain Research, 129(2), 247–259.
Kahana, M. J., Seelig, D., & Madsen, J. R. (2001). Theta returns.Current Opinion in Neurobiology, 11, 739–744.
Kaiser, A., & Schreiber, T. (2002). Information transfer in contin-uous processes. Physica D: Nonlinear Phenomena, 166, 43–62.
Kaminski, M., & Blinowska, K. J. (1991). A new method of thedescription of the information flow in the brain structures.Biological Cybernetics, 65, 203–210.
Kamondi, A., Acsády, L., Wang, X. J., & Buzsáki, G. (1998).Theta oscillations in somata and dendrites of hippocampalpyramidal cells in vivo: Activity-dependent phase-precessionof action potentials. Hippocampus, 8, 244–261.
Kayser, C., & Logothetis, N. K. (2009). Directed interactions be-tween auditory and superior temporal cortices and their role
in sensory integration. Frontiers in Integrative Neuroscience,3, 1–11.
Kayser, C., Montemurro, M. A., Logothetis, N., & Panzeri, S.(2009). Spike-phase coding boosts and stabilizes informationcarried by spatial and temporal spike patterns. Neuron, 61,597–608.
Kraskov, A., Stogbauer, H., & Grassberger, P. (2004). Estimatingmutual information. Physical Review E, Statistical Physics,Plasmas, Fluids, and Related Interdisciplinary Topics, 69,066138.
Lachaux, J., Rodriguez, E., Martinerie, J., & Varela, F. (1999).Measuring phase synchrony in brain signals. Human BrainMapping, 8, 194–208.
Lisman, J. (2005). The theta/gamma discrete phase code occuringduring the hippocampal phase precession may be a moregeneral brain coding scheme. Hippocampus, 15, 913–922.
Llinas, R., & Ribary, U. (1993). Coherent 40-hz oscillation char-acterizes dream state in humans. Proceedings of the NationalAcademy of Science USA, 90, 2078–2081.
Logothetis, N. K. (2003). The underpinnings of the bold func-tional magnetic resonance imaging signal. Journal of Neu-roscience, 23(10), 3963–3971.
Logothetis, N. K. (2008). What we can do and what we can notdo with fMRI. Nature, 453, 869–878.
Logothetis, N. K., Kayser, C., & Oeltermann, A. (2007). In vivomeasurement of cortical impedance spectrum in monkeys:Implications for signal propagation. Neuron, 55, 809–823.
Logothetis, N. K., Pauls, J., Augath, M., Trinath, T., &Oeltermann, A. (2001). Neurophysiological investigation ofthe basis of the fMRI signal. Nature, 412, 150–157.
Magri, C., Whittingstall, K., Singh, V., Logothetis, N., & Panzeri,S. (2009). A toolbox for the fast information analysis ofmultiple-site LFP, EEG and spike train recordings. BMCNeuroscience, 10, 81.
Marinazzo, D., Pellicoro, M., & Stramaglia, S. (2006). Nonlinearparametric model for granger causality of time series. Physi-cal Review E, 73, 066,216.
Mazzoni, A., Panzeri, S., Logothetis, N. K., & Brunel, N. (2008).Encoding of naturalistic stimuli by local field potential spec-tra in networks of excitatory and inhibitory neurons. PLoSComputational Biology, 4, e1000239.
Mitzdorf, U. (1987). Properties of the evoked potential gen-erators: Current source-density analysis of visually evokedpotentials in the cat cortex. International Journal of Neuro-science, 33(1–2), 33–59.
Montemurro, M. A., Rasch, M. J., Murayama, Y., Logothetis,N. K., & Panzeri, S. (2008). Phase-of-firing coding of naturalvisual stimuli in primary visual cortex. Current Biology, 18,375–380.
Montemurro, M. A., Senatore, R., & Panzeri, S. (2007).Tight data-robust bounds to mutual information combiningshuffling and model selection techniques. Neural Computa-tion, 19, 2913–2957.
Nadasdy, Z. (2009). Information encoding and reconstructionfrom the phase of action potentials. Frontiers in SystemsNeurosci, 3, 6.
Nelken, I., Chechik, G., Mrsic-Flogel, T. D., King, A. J., &Schnupp, J. W. H. (2005). Encoding stimulus informationby spike numbers and mean response time in primary au-ditory cortex. Journal of Computational Neuroscience, 19,199–221.
Nolte, G., Ziehe, A., Nikulin, V., Schlögl, A., Krämer, N.,Brismar, T., et al. (2008). Robustly estimating the flow di-rection of information in complex physical systems. PhysicalReview Letters, 100, 234,101.
566 J Comput Neurosci (2010) 29:547–566
Pantazis, D., Nichols, T. E., Baillet, S., & Leahy, R. M. (2005). Acomparison of random field theory and permutation meth-ods for the statistical analysis of MEG data. NeuroImage, 25,383–394.
Panzeri, S., Senatore, R., Montemurro, M. A., & Petersen, R. S.(2007). Correcting for the sampling bias problem in spiketrain information measures. Journal of Neurophysiology,98(3), 1064–1072.
Panzeri, S., & Treves, A. (1996). Analytical estimates of limitedbiases in different information measures. Network, 7, 87–107.
Pearl, J. (2000). Causality—models, reasoning, and inference.Cambridge, UK: Cambridge University Press.
Pettersen, K. H., & Einevoll, G. T. (2008). Amplitude variabilityand extracellular low-pass filtering of neuronal spikes. Bio-physical Journal, 94, 784–802.
Quiroga, R. Q., Arnhold, J., & Grassberger, P. (2000). Learn-ing driver-response relationships from synchronization pat-terns. Physical Review E, Statistical Physics, Plasmas,Fluids, and Related Interdisciplinary Topics, 61,(5 Pt A),5142–5148.
Roebroeck, A., Formisano, E., & Goebel, R. (2005). Mappingdirected influence over the brain using granger causality andfMRI. Neuroimage, 25, 230–242.
Roopun, A. K., Kramer, M. A., Carracedo, L. M., Kaiser, M.,Davies, C. H., Traub, R. D., et al. (2008). Temporal interac-tions between cortical rhythms. Frontiers in Neuroscience, 2,145–154.
Schack, B., Klimesch, W., & Sauseng, P. (2005). Phase synchro-nization between theta and upper alpha oscillations in a
working memory task. International Journal of Psychophys-iology, 57, 105–114.
Schreiber, T. (2000). Measuring information transfer. Physics Re-view Letters, 85, 461–464.
Seth, A. K. (2005). Causal connectivity analysis of evolved neuralnetworks during behavior. Network, 16, 35–55.
Seth, A. K., & Edelman, G. (2007). Distinguishing causal interac-tions in neural populations. Network, 19, 910–933.
Shannon, C. E. (1948). A mathematical theory of communication.AT&T Bell Labs Technical Journal, 27, 379–423.
Stam, C. J., & van Dijk, B. W. (2002). Synchronization likelihood:An unbiased measure of generalized synchronization in mul-tivariate data sets. Physica D, 163(3), 236–251.
Stettler, D. D., Das, A., Bennett, J., Gilbert, C. D. (2002). Lateralconnectivity and contextual interactions in macaque primaryvisual cortex. Neuron, 36, 739–750.
Strong, S. P., Koberle, R., de Ruyter van Steveninck, R. R., &Bialek, W. (1998). Entropy and information in neural spiketrains. Physical Review Letters, 80, 197–200.
Theiler, J. (1986). Spurious dimension from correlation algo-rithms applied to limited time-series data. Physical ReviewA, 34, 2427–2432.
Victor, J. D. (2002). Binless strategies for estimation of infor-mation from neuronal data. Physical Review E, 66, 51,903–51,918.
Womelsdorf, T., Schoffelen, J. M., Oostenveld, R., Singer, W.,Desimone, R., Engel, A. K., et al. (2007) Modulation ofneuronal interactions through neuronal synchronization.Science, 316, 1609–1612.